- Independent Researcher, Durham, United Kingdom
The possible role of avian predators in limiting songbird populations has been largely discounted since the publication of findings showing a lack of statistical association in United Kingdom bird census data between changes in prey species populations and those of a range of predatory species, including raptors and corvids. I re-applied the methodology behind these findings, covering a wider range of prey species and using site-level modeling to estimate predator abundance instead of a mixture of spatial modeling and raw count data. A significant aggregate predator effect was found in 33 out of 40 prey species, compared to only 10 out of 27 in the original study, as well as a higher rate of significant individual predator effects, with 41 significantly negative and 84 significantly positive effects out of a total of 320. The greater explanatory power of predator variables estimated using site-level modeling suggests that this has significant advantages over the use of predator variables derived from spatial modeling, which may not capture variation in predator abundance at a local scale, or from raw count data, which may lead to attenuation of effect estimates. The prevalence of positive associations between predators and prey is consistent with a common response to local habitat variation, which may absorb negative covariance resulting from the impact of predators on prey populations. Both positive and negative predator-prey associations may also occur as a result of independent demographic processes that manifest as sequential habitat occupation or withdrawal. Analyses of census data cannot discriminate among these possible scenarios and may therefore have limited value in determining whether predators have been limiting prey populations. Inference to a lack of impact of avian predators on prey populations from such analyses may therefore be unsafe, and a role for increased predator numbers remains a viable hypothesis with respect to bird population declines. The recent neglect of this possibility should therefore be urgently reversed, with a particular need for field experiments that can support strong inference regarding population limitation of songbirds by avian predators.
Introduction
Conservation management of wild populations takes place against a background of controversy regarding the basis of their persistence and stability. This involves debate over whether populations are limited directly by food availability and other environmental factors or regulated via density dependence (Berryman, 2004; White, 2008), and if the latter whether such regulation is bottom–up or top–down (Schmitz, 2010). Much evidence has accumulated for the action of density-dependence (Sibly et al., 2005), but the means of regulation remains controversial in many cases, with bottom-up regulation via food supply favored by those who believe that mortality resulting from predation affects only a ‘doomed surplus.’ However, experimental studies suggest that top–down regulation of populations by predators is widespread, at least among the quarry species that are the most frequent focus of such investigations (Holt et al., 2008; Salo et al., 2010; Smith et al., 2010, 2011).
Few such studies have focused on the songbirds, which form the majority of the common bird species that have undergone severe population decline in heavily managed landscapes in Europe and worldwide (Inger et al., 2015; Stanton et al., 2018). Bottom–up regulation forms the usual context for explanation of such declines, which cites changes in farming practices and consequent decline in food supply as the ultimate cause, while discounting the possible role of increasing predator populations (Gibbons et al., 2007). Support for this position has emerged from investigations that use data from the British Common Birds Census (CBC) to test for the presence of relationships between local population trends and changes in the local status of predators during the main period of decline in the late 20th century (Thomson et al., 1998; Newson et al., 2010), which found very little to suggest a significant impact of a range of increasingly abundant predator species. By contrast, studies focusing on data from the Garden Bird Feeding Survey (GBFS) have found more evidence of impact (Chamberlain et al., 2009; Bell et al., 2010; Swallow et al., 2016a,b, 2019; Jones-Todd et al., 2018), but since this refers to numbers at winter feeding stations it permits less certain inference regarding impacts on breeding populations.
One of the main methodological problems of using Common Birds Census data to test for association between predators and prey is that predators occur at relatively low density. Census plots, which are generally < 100 ha, may therefore hold a maximum of only one or two breeding territories, which provides little resolution of variation in predator abundance. Newson et al. (2010) addressed this problem by using smoothed relative abundance surfaces to produce year-specific predator indices for each CBC site within their focal area (England), effectively using broad-scale spatio-temporal trends to estimate variation in local abundance. However, they used this approach only for raptors, while using raw count data for the remainder of the predators included in the study, despite the fact that these include species such as Jay and Great Spotted Woodpecker, which occur at a range of densities comparable to those of raptors.
Use of explanatory variables in the form of raw count data presents a danger of inflating the type II error rate of regression analyses, since differences in counts between adjacent years are likely to contain a large element of measurement error. This can be mitigated by using fitted model values, which reflect the long-term trend in local predator activity, but the use of trends measured on a broad geographic scale may fail to reflect variation at the narrower scale represented by the area of a typical CBC census plot. Here, therefore, I reprise the approach used by Newson et al. (2010) for a wider range of potential prey species, and use indices of activity for all predator species derived from modeling of predator presence and absence at individual site level.
Materials and Methods
The analysis uses CBC data for the whole of the United Kingdom, unlike Newson et al. (2010), who used only English data to aid comparability with a similar analysis of Breeding Bird Survey data. The latter began in 1995 so covers the period after the most severe bird population declines in the 1970s and 1980s and has good coverage of the whole of the United Kingdom, unlike CBC which is mainly confined to England. The addition of a small number of sites from Scotland, Wales and Northern Ireland should not, therefore, substantially alter the results. CBC data were supplied by volunteer surveyors as part of a national scheme covering around 250 plots each year. There was relatively high turnover and a policy of replacing a lapsed plot with another of similar character, so the number of years surveyed at individual sites varied considerably.
Model Structure
The approach used retains the structure of the model used by Newson et al. (2010), and implements a regression of change in log prey population against change in log predator indices:
where μi,t is estimated prey population at site i in year t, rj is the instantaneous rate of change in global prey population year j, and χ and λ are variable vectors with associated regression parameter vectors α and β. χ contains predator variables which include zero values and are therefore of the form , where Pi,t is a site and year-specific estimate of predator population (see below), and λ comprises environmental variables of the form . Predator variables used are the same as those used in Newson et al. (2010): Buzzard (P1,i,t), Sparrowhawk (P2,i,t), Kestrel (P3,i,t), Great Spotted Woodpecker (P4,i,t), Magpie (P5,i,t), Jay (P6,i,t), Carrion Crow (P7,i,t), and Collared Dove (P8,i,t), with the latter included as a ‘dummy predator’ to check whether patterns suggestive of predation might emerge where no predation is occurring. Environmental variables are also equivalent to those used in Newson et al. (2010): biomass (Q1,i,t), which is the sum of counts of prey species (other than the focal species) multiplied by species-specific masses obtained from Robinson (2005); mean daily rainfall and minimum temperature from the period April-June of the preceding year (Q2 & 3,i,t); and mean daily rainfall and minimum temperature from the preceding winter period of December to February (Q4& 5,i,t), with all weather data derived from HADUK 1km gridded climate observations1 matched to the 1km square corresponding to each census site. The model excludes Gray Squirrel and prey detectability indices, which were used in Newson et al. (2010) for analysis of Breeding Bird Survey data only.
The model was implemented in R version 3.5.1. (R Core Team, 2018) with prey counts as the response variable, using Poisson errors and a loge link, except where the model dispersion was ≥1.4 (Supplementary Table S1), in which case quasipoisson errors were used:
The ‘recursive’ structure of the model enables a much more efficient use of the available data than in a standard regression model of population change with an offset in the form of the log of observed prey numbers at t-1 (ln Ni, t–1, cf. Thomson et al., 1998) instead of the log estimate of prey numbers in the first data year (ln μi, 1). This is because all the data contribute to maximum likelihood estimates of prey numbers in any given year (t), with those for t = 1 estimated as site effects with sites represented by levels in a categorical variable (cf. Freeman and Newson, 2008). For some long-running census sites in which there were periodic changes in the size of the census area, site data were split between multiple levels of the categorical variable, each corresponding to runs of years in which the census area was consistent, thereby preventing the variance in prey species counts attributable to changes in the size of census areas from being partitioned among the other explanatory variables.
Prey species counts for any given year also contribute to the estimate of the global effect of that year (rj) through inclusion in the model of binary variables representing each data year, which are set to value 1 for species counts taken after the year in question (e.g., 1971, 1972… for the variable representing the effect of conditions in 1970), denoting that the count has been influenced by conditions in the year concerned, and otherwise to 0. Change of prey count between the first and any subsequent year with site data is therefore explained by a combination of the global effect of conditions in the intervening years, and the change in predator and environmental variables over the same period.
Estimation of Predator Activity
All of the predators included in the analysis are species that increased in abundance during the focal period, and therefore could plausibly have contributed to contemporary declines in prey populations. An undoubted outcome of predator increase has been range expansion, resulting in the settlement of many sites that were formerly unoccupied, and estimation of change in predator abundance focuses on this process by first reducing count data to presence and absence, which is then modeled within each site using binary logistic regression. This ensures equal treatment of the predators and facilitates inclusion of frequent occasions on which they are recorded as ‘present’ at a site in a given year, but with a count of zero territories. A predator was therefore recorded as present for counts ≥ 1 and for counts of zero where it was noted as being present, and for all other counts of zero as absent. This may reduce the power of the analysis to detect associations, especially for species such as Magpies for which counts into double figures can occur, although probability of presence is generally a good predictor of abundance (Jones-Todd et al., 2018).
Since regression cannot provide meaningful estimates for short runs of data, modeling was confined to sites in which census data were recorded for at least 5 years. The estimates of predator activity derived for each site and year were then used as explanatory variables (Pi,t) in the analysis of change in prey populations.
Effect of Biomass
Newson et al. (2010) included biomass as a covariate in their linear model ‘to control for the availability of alternate prey, which may buffer against impact on the prey species of interest.’ This was investigated via comparison of predator effect values before and after deletion of biomass, which should result in a reduction in effect size if buffering is occurring.
Comparison of Predator Effects With Population Change
The analysis follows Newson et al. (2010) in using data from the period 1967–2000, facilitating comparison of results with change in national population estimates, which for most prey species are available from 1966 onward (Woodward et al., 2018). Change in national prey population associated with increased numbers of individual predators was estimated using prey-specific effect values (αprey) in combination with a measure of increase in site occupation by the predator, calculated as difference between annual means of the loge predator index. The predicted effect on national prey populations (Rprey) of change in predator occupation across all sites between 1967 and 2000 is then:
where nt = the number of sites (i) contributing predator activity estimates (Pi,t) in year t.
Cross-Study Comparisons
Predator effect estimates for individual prey species were compared with those presented by Newson et al. (2010), and from a series of more recent papers reporting predator effects estimated from GBFS data in which mean over-winter counts at bird feeding stations are modeled within a Bayesian framework, either using site-specific predator and environmental variables as linear predictors (Swallow et al., 2016a,b, 2019), or via a joint spatio-temporal model that determines the dependency of species abundance on the probability that other species are present (Jones-Todd et al., 2018).
Results
A significant aggregate effect of predators was indicated by likelihood ratio test in 33 of the 40 prey species examined (Table 1), and residual plots support the validity of the fitted models (Supplementary Figures S1–S4). Under the null hypothesis of no effect on prey numbers, standardized effects of a predator on a range of prey species should be approximately normally distributed with a mean of zero, resulting in a uniform distribution of one-tailed probabilities. In general, however, the distribution is centrifugal, with excess frequencies at both extremes, indicating that markedly positive and negative effects occur more frequently than expected by chance (Figure 1). The resulting frequency distributions differ significantly from uniform in all except Buzzard and Carrion Crow (Table 2). Among the weather variables the distribution of one-tailed probabilities differs significantly from uniform only for winter temperature, indicating an overall bias toward a positive effect that is particularly marked in Wren and Robin (Table 2 and Supplementary Table S1). Among the eight individual ‘predator’ species six show a significant aggregate effect of the other predators (Supplementary Table S1), and one-tailed effect probabilities show positive bias in Sparrowhawk, Great Spotted Woodpecker, Magpie and Carrion Crow, and negative bias for Spring Rain (Table 2 and Supplementary Table S1).
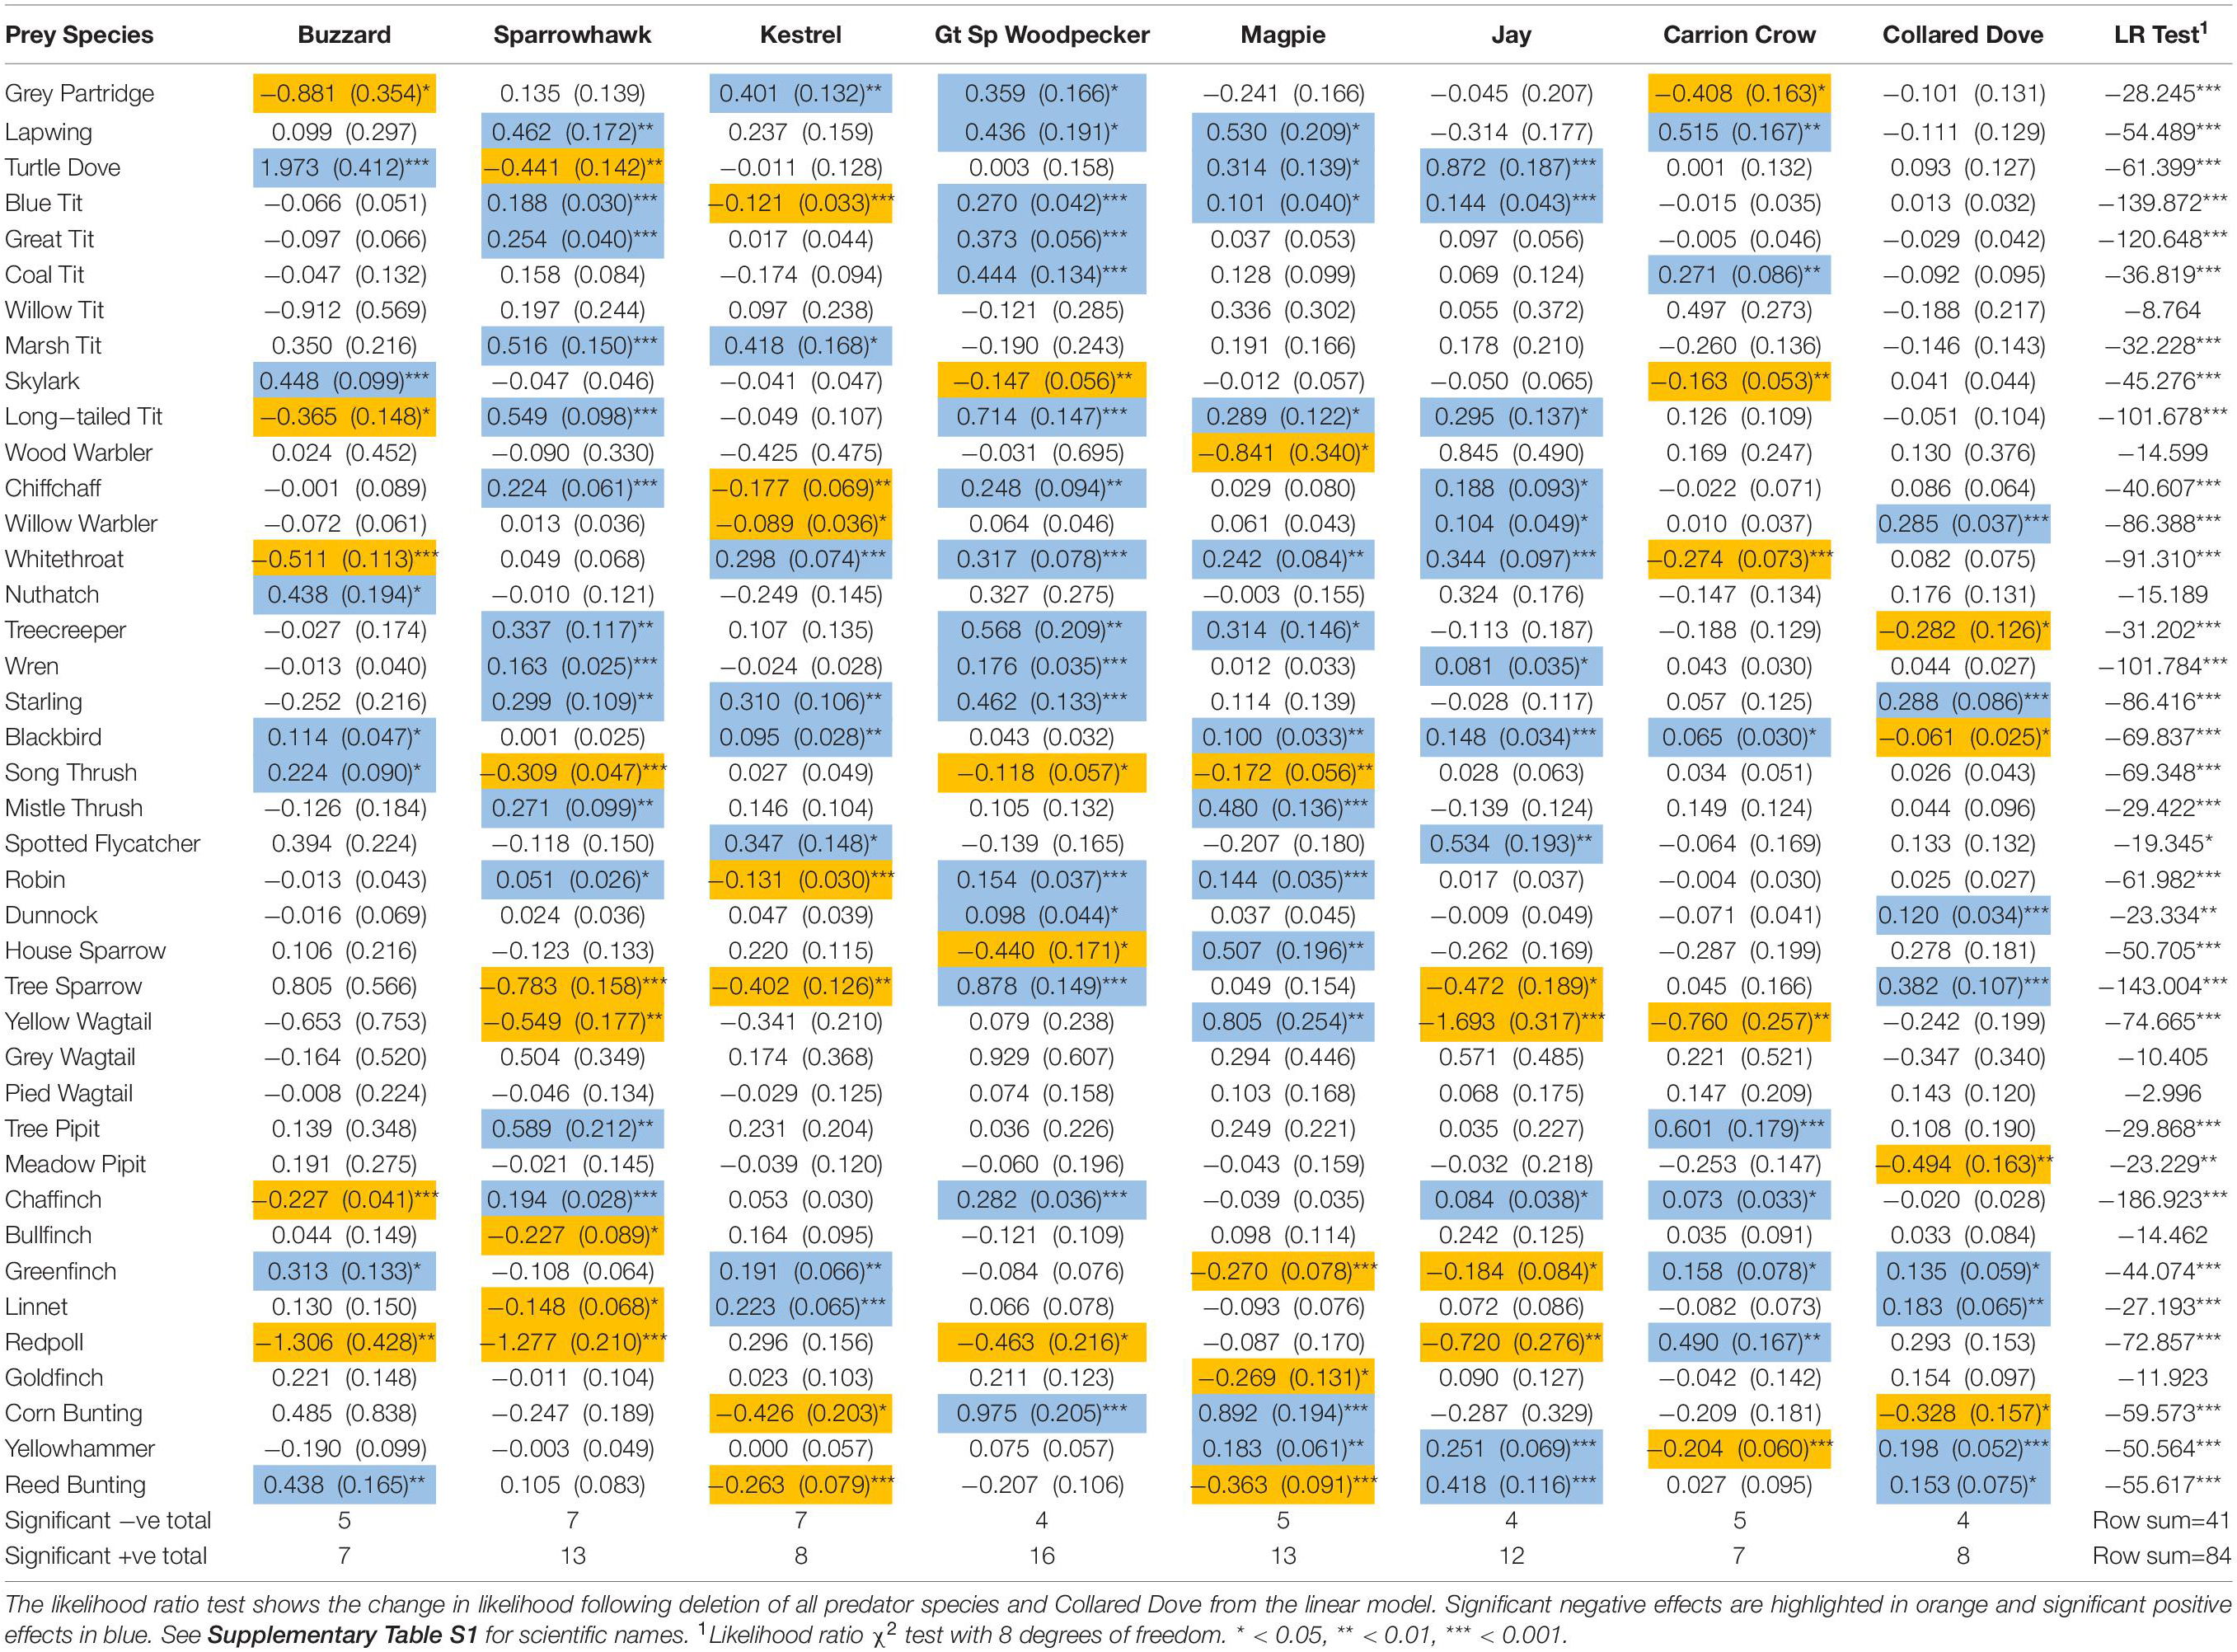
Table 1. Estimated effects with standard errors in brackets from multiple regressions of change in prey abundance against change in predator activity.
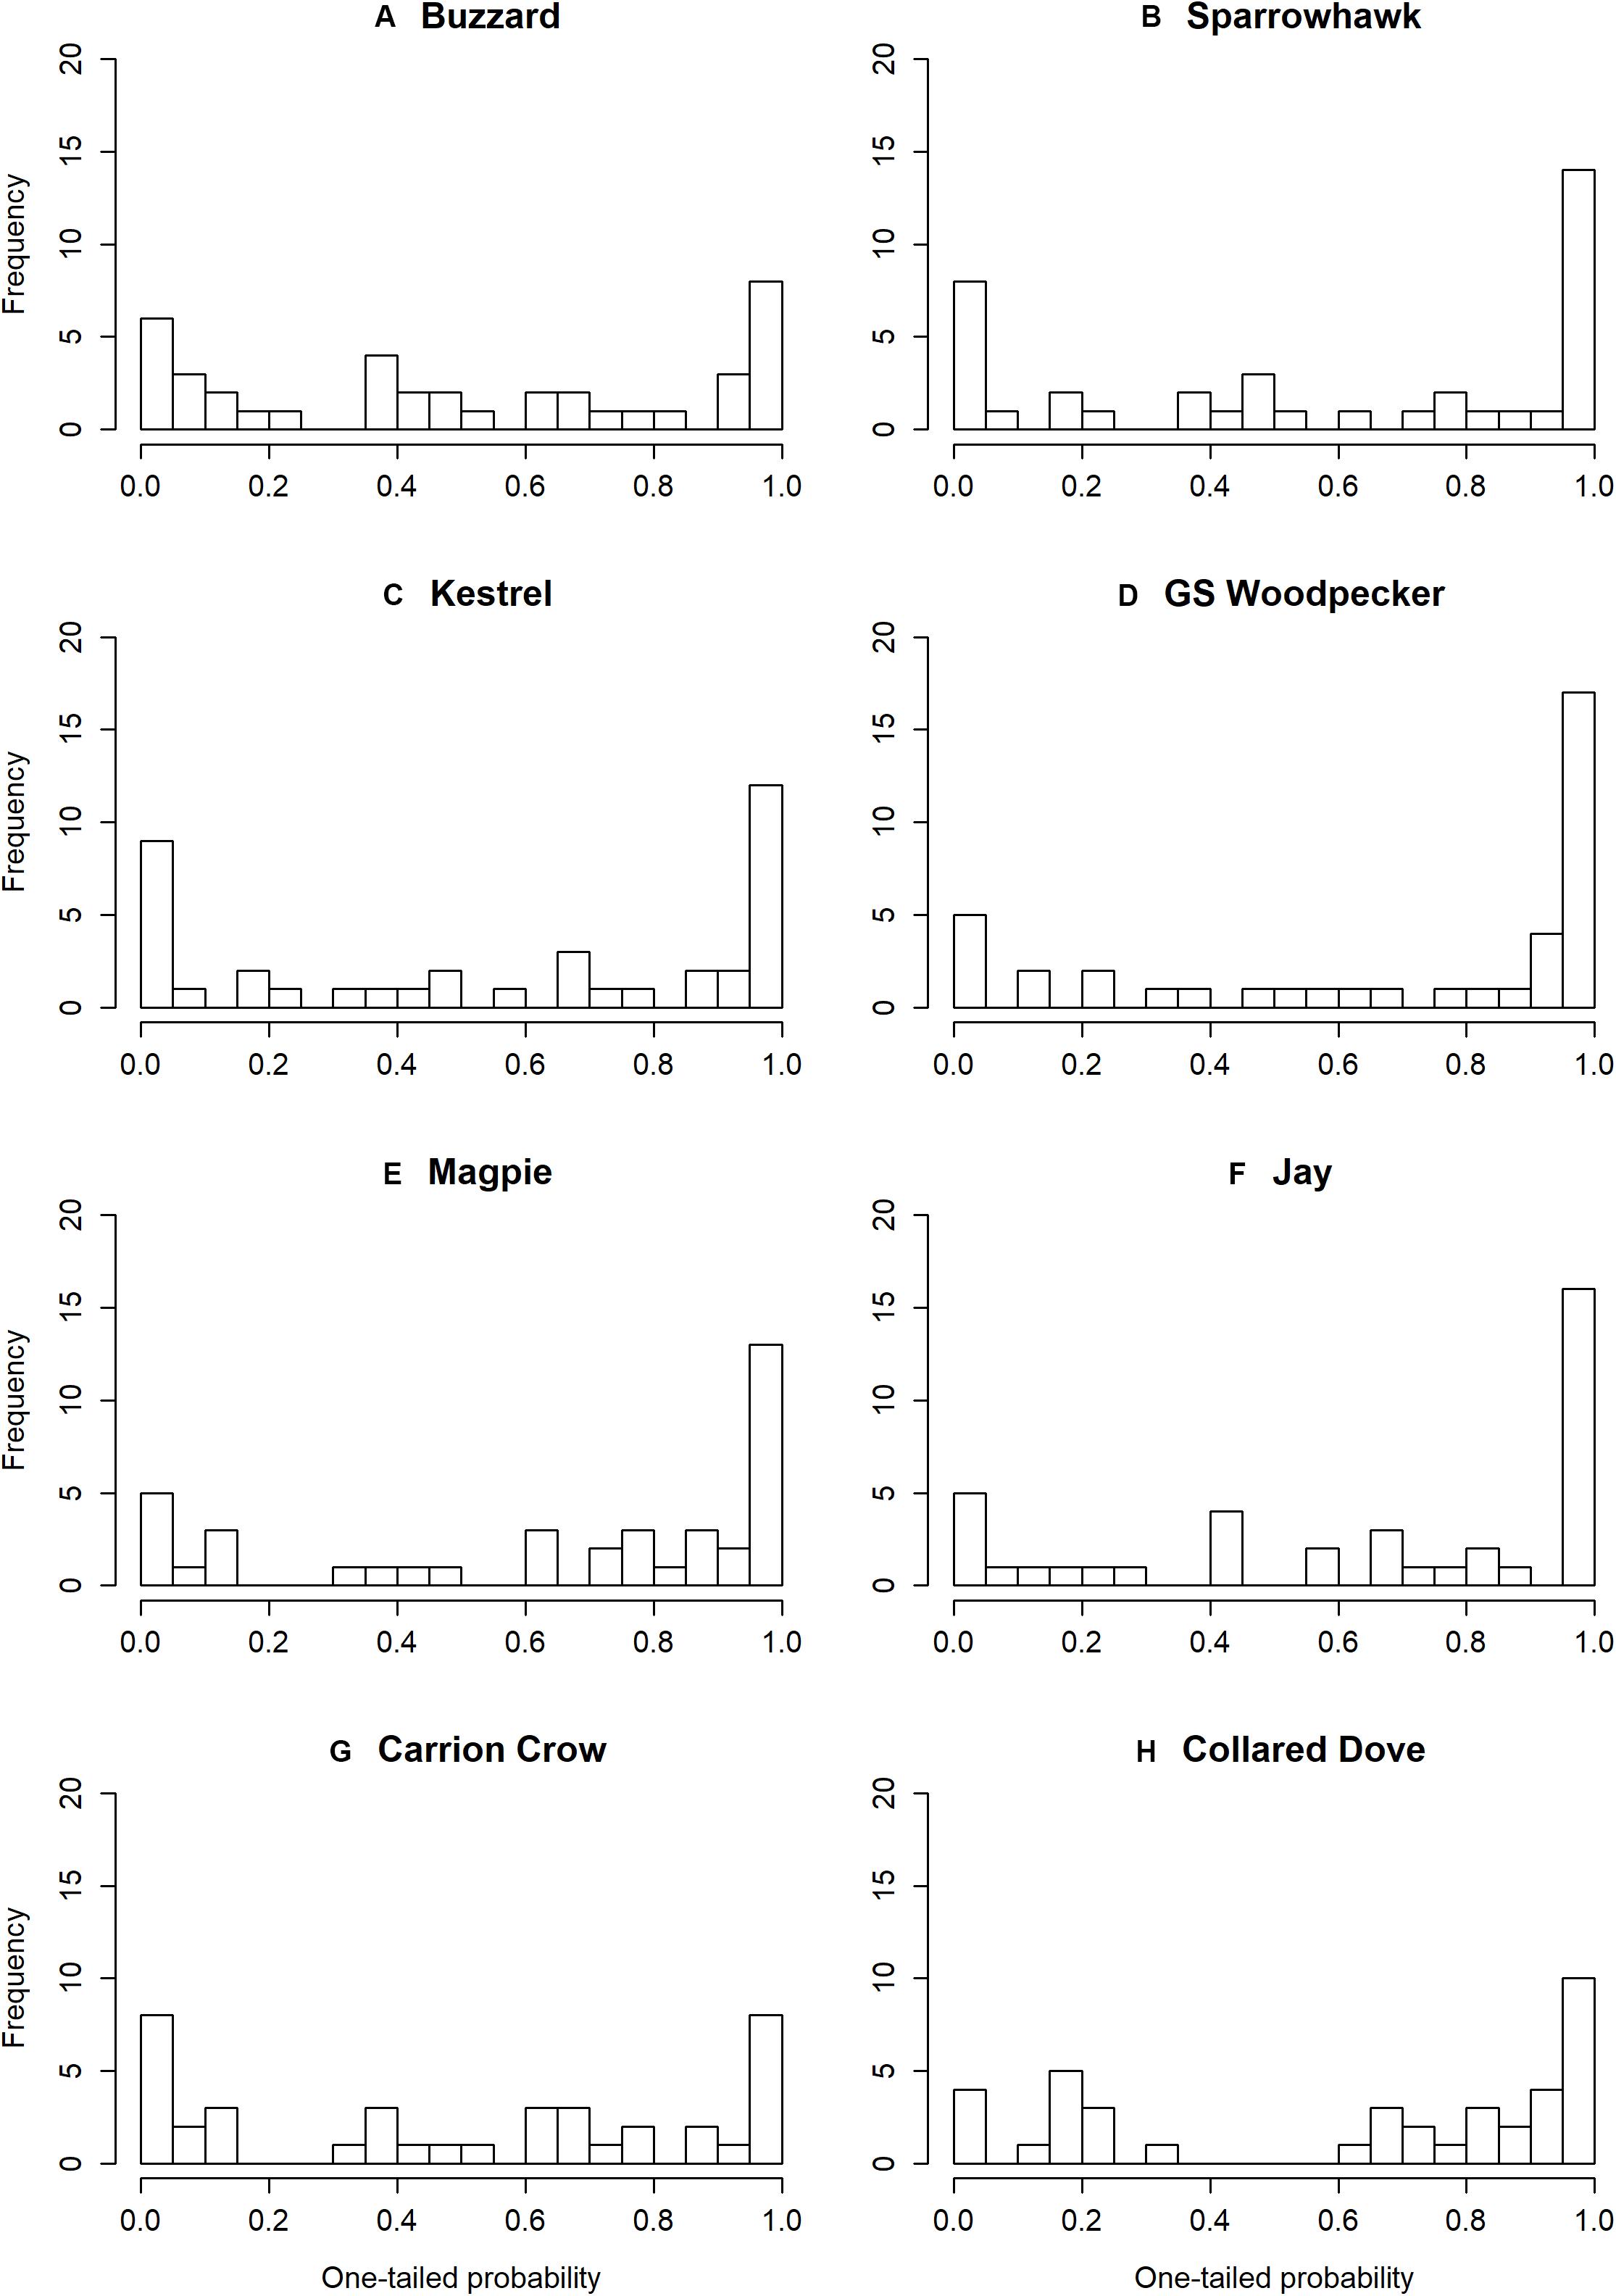
Figure 1. Histograms of one-tailed probabilities for effects of predators on prey species. Parts (A–H) show prey species frequencies for each individual predator species.
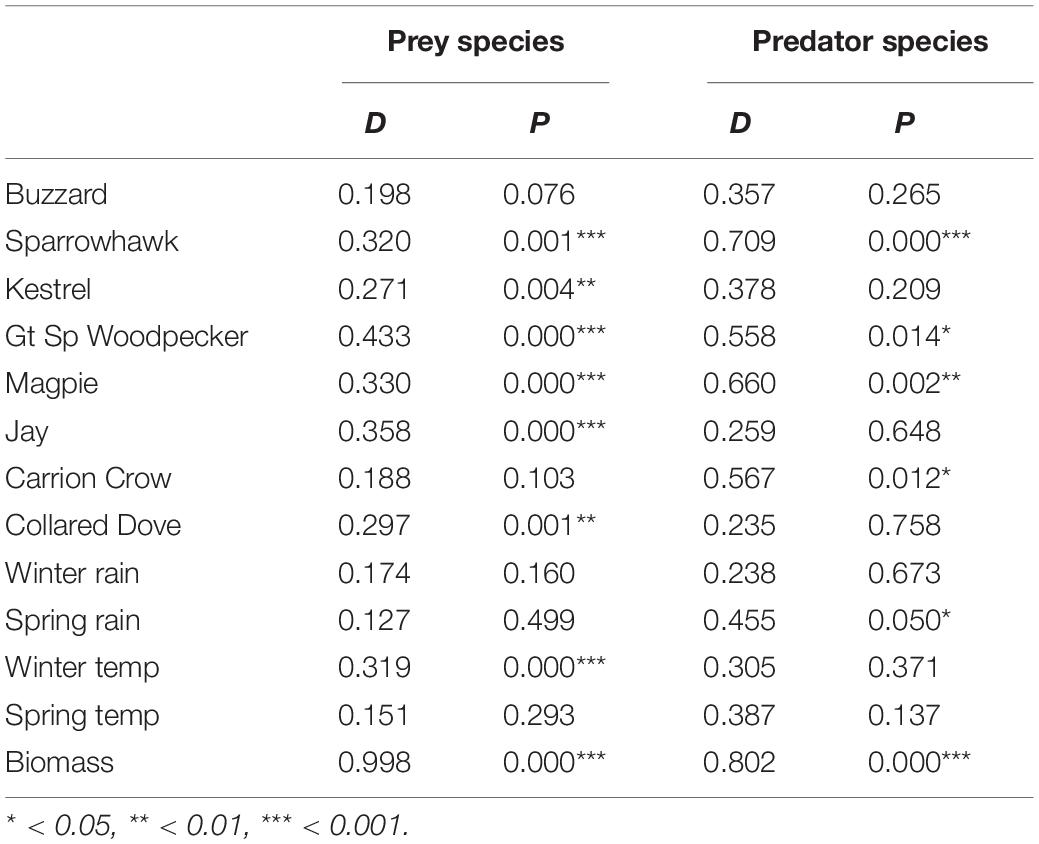
Table 2. Kolmogorov–Smirnov tests of the null hypothesis that one-tailed probabilities of predator, weather and biomass effects on prey and predator species have a uniform distribution.
Biomass shows a highly significant positive effect in all 40 prey species and in 6 of the 8 ‘predator’ species (Supplementary Table S1), but changes in predator effects that occur on deletion of biomass are overwhelmingly positive, and this holds whether the effects themselves are positive or negative (Table 3 and Figure 2). Consequently negative effects generally decrease, which is in line with the assumption that biomass controls for the buffering effect of alternative prey, but positive effects generally increase, which is contrary to this assumption. The exceptions are negative Sparrowhawk effects and positive Buzzard effects, which show no overwhelming tendency to increase or decrease, and positive Sparrowhawk effects, which generally decrease (Table 3 and Figure 2).

Table 3. Mean change in estimated effects of predators on prey species following deletion of biomass from the linear model.
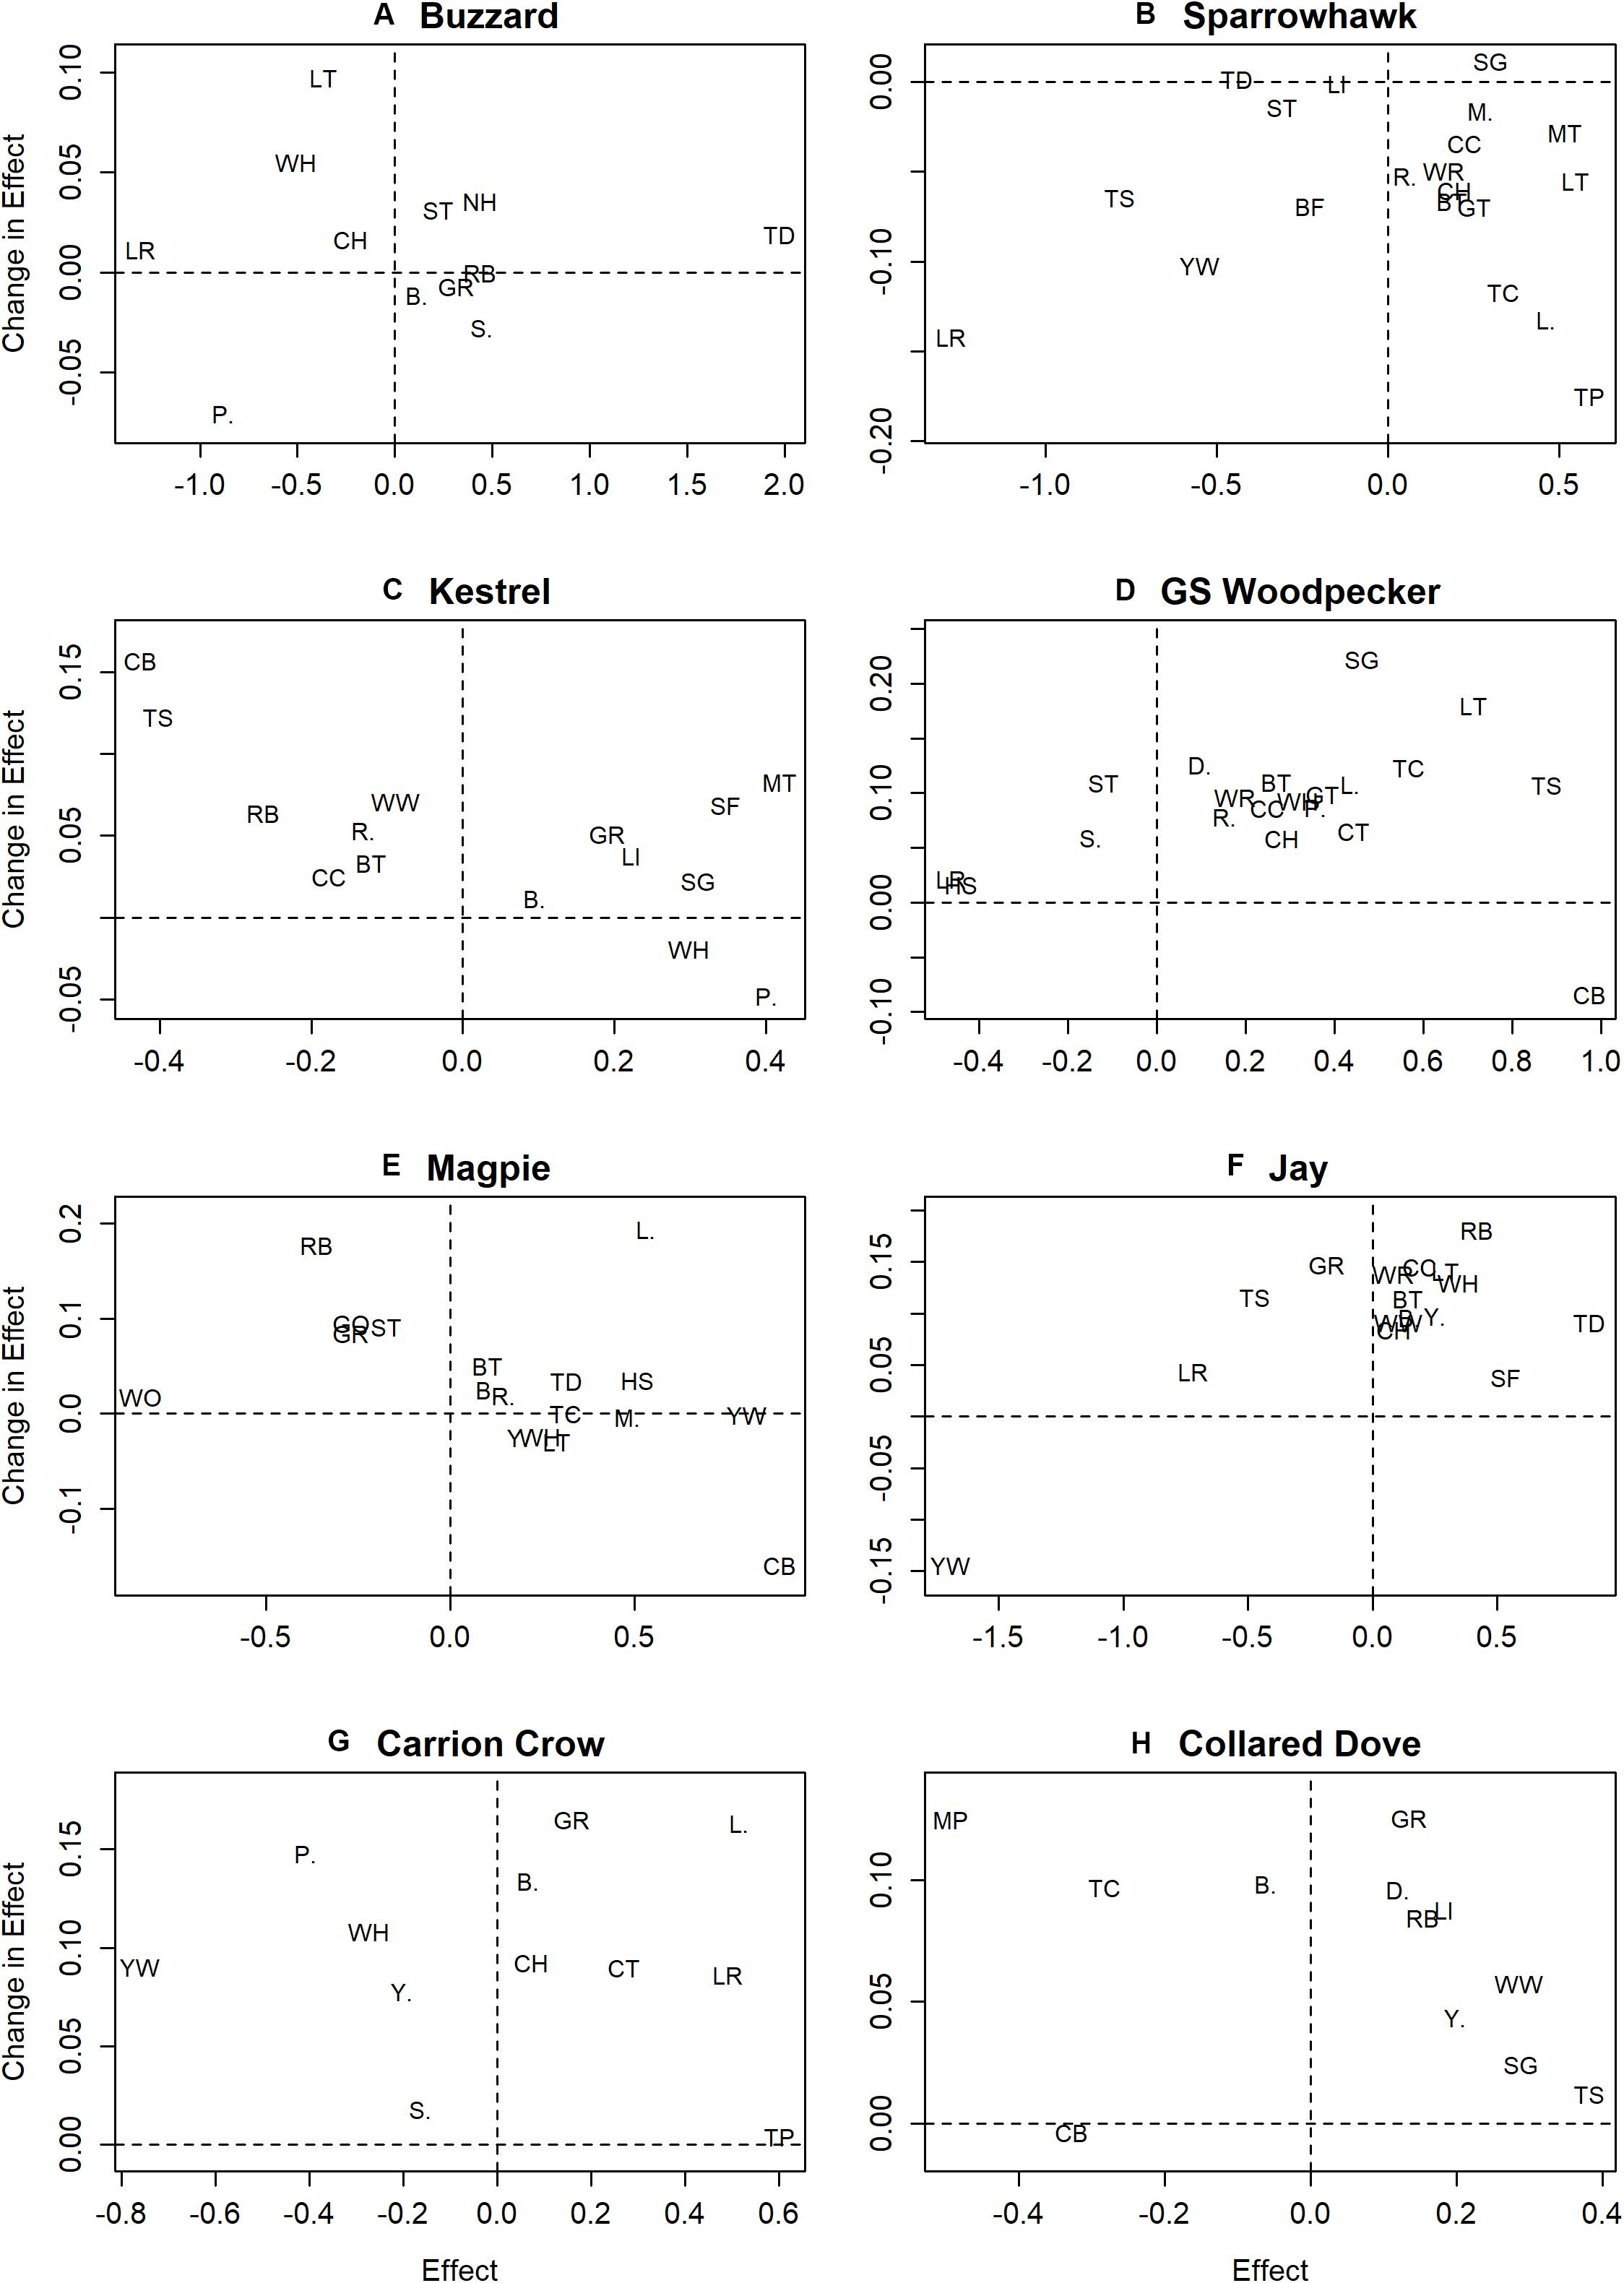
Figure 2. Plots of change in predator effect on deletion of biomass from the linear model against predator effect prior to deletion. Parts (A–H) show changes in effects of individual predators on prey species where the effect is significant prior to biomass deletion, with prey species denoted using standard British Trust for Ornithology codes (see Supplementary Table S1).
The temporal trend in mean predator abundance across sites is shown in Figure 3, and the prey population change predicted on the basis of estimated effects and change in the abundance of predators is plotted against actual prey population change for the period 1967–2000 in Figure 4. There is a significant positive relationship in the case of Sparrowhawk, but for all other predators it is non-significant (Table 4).
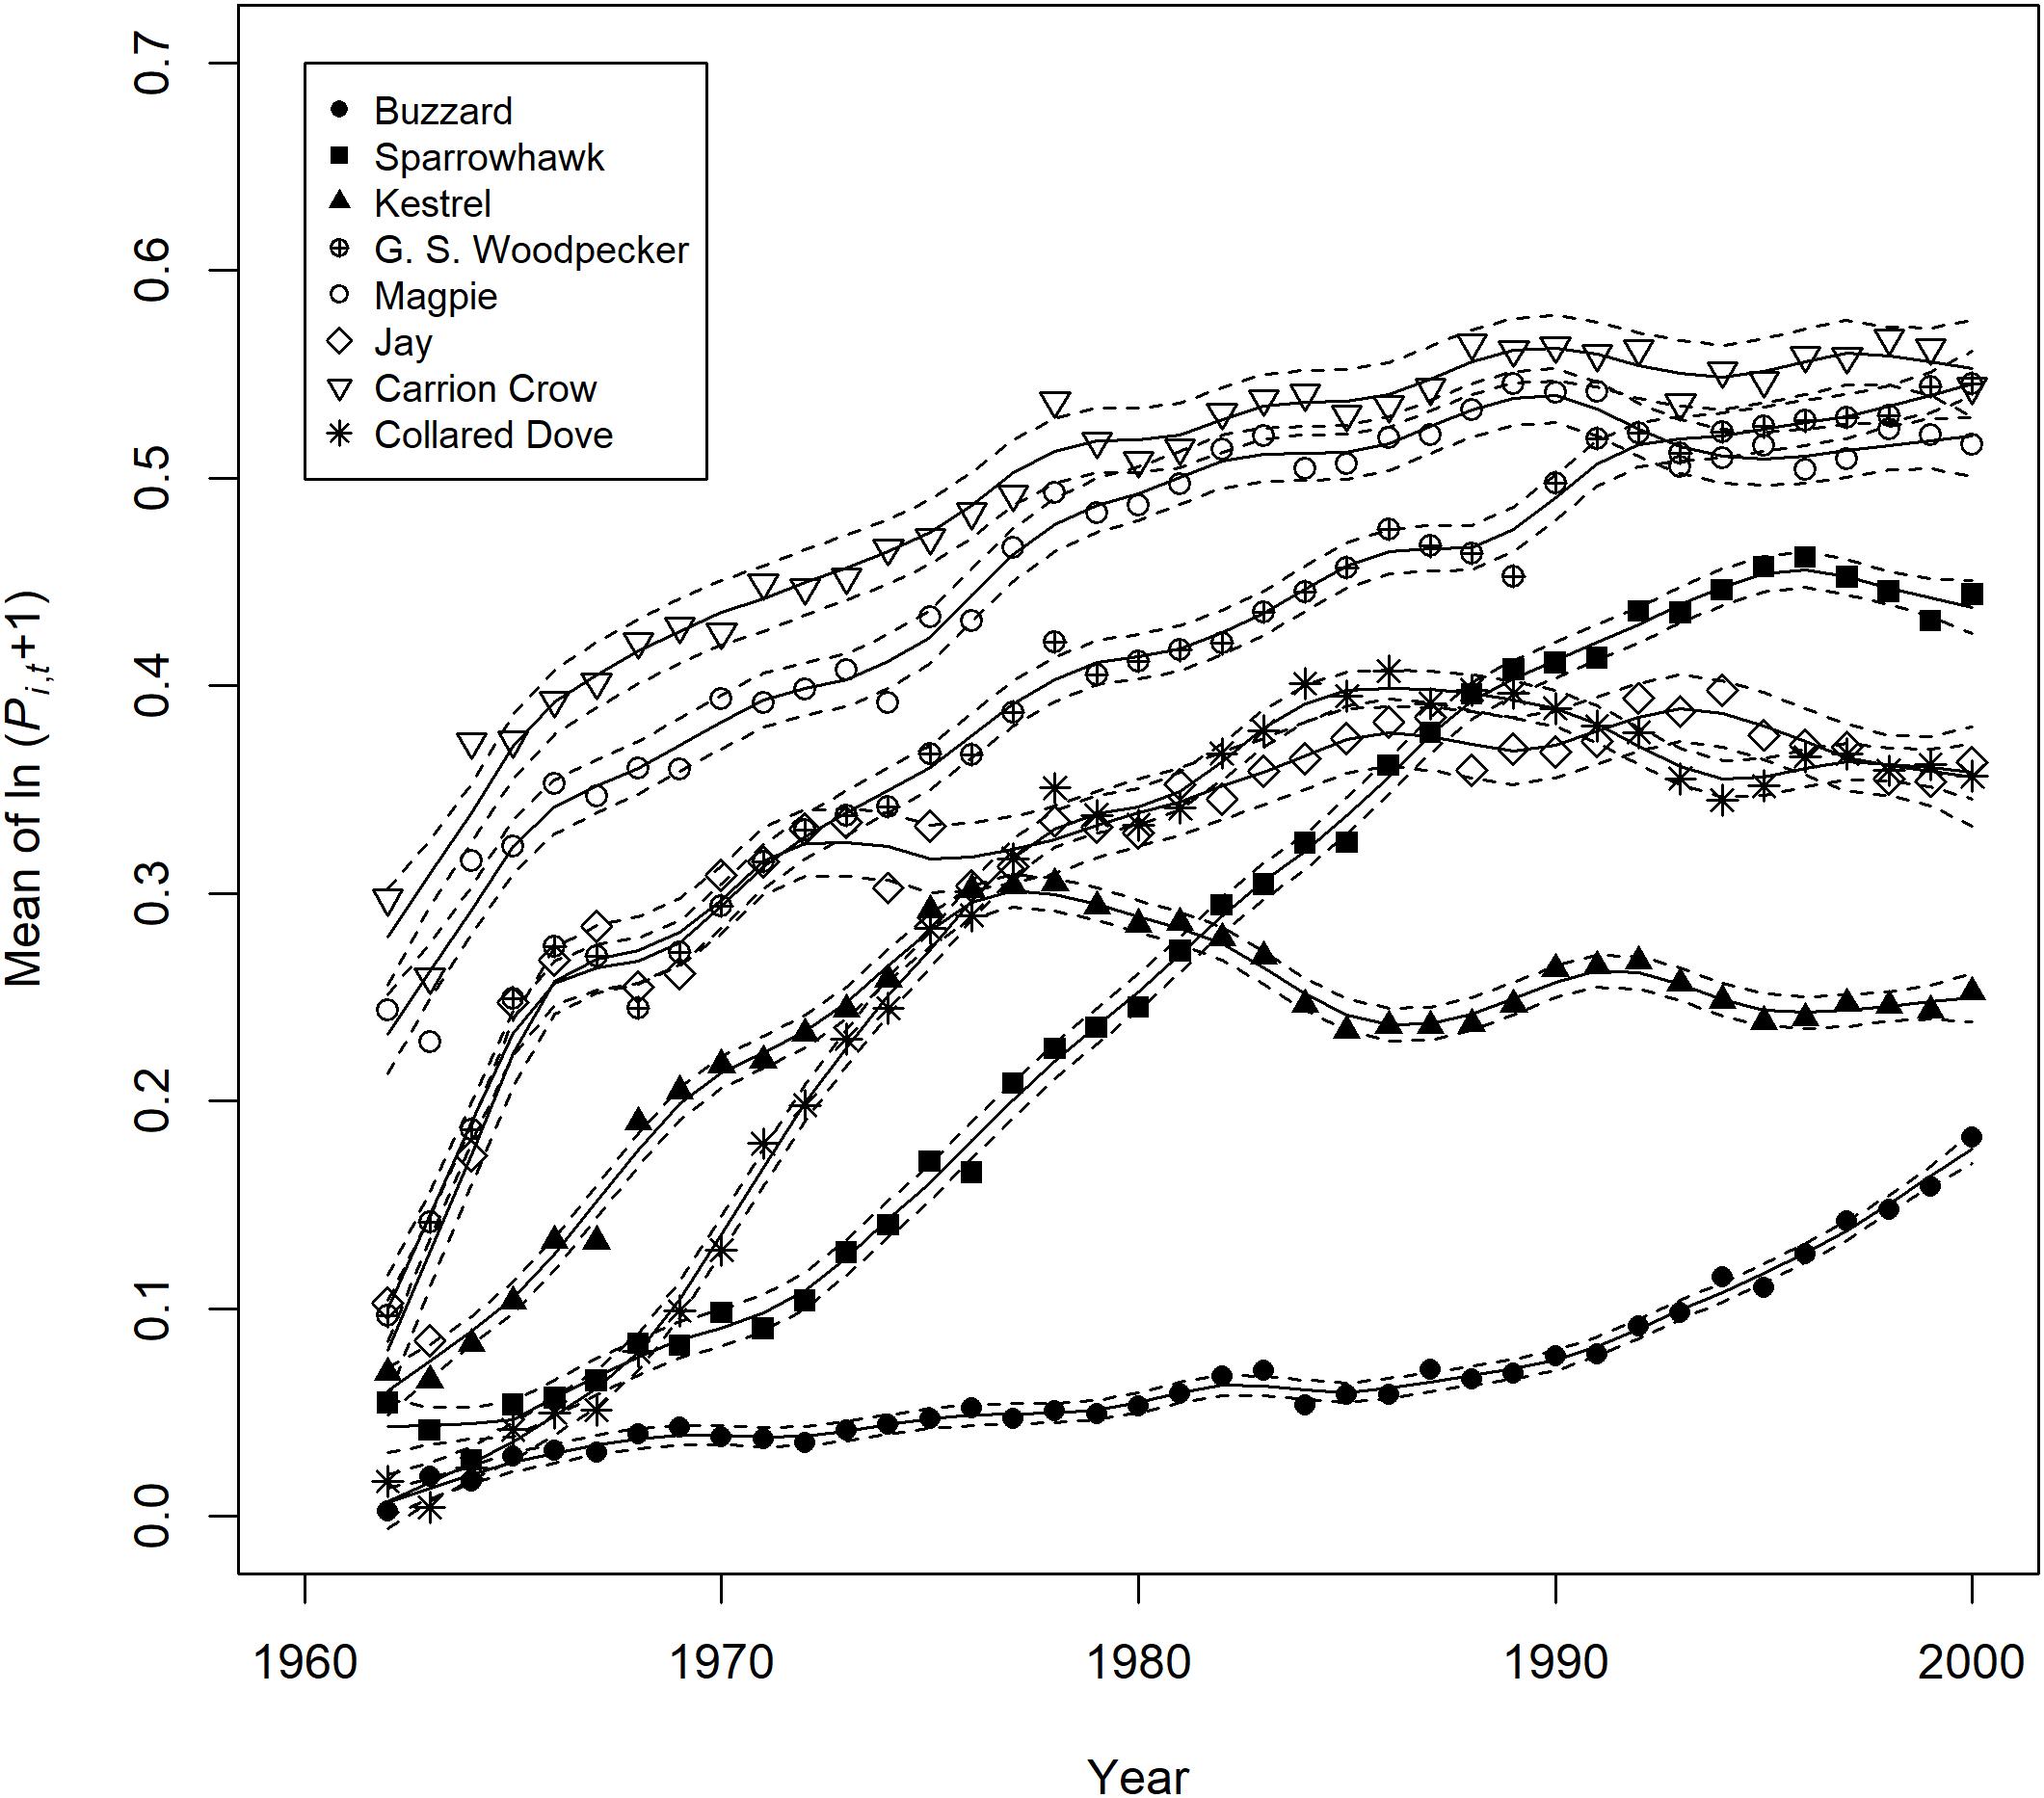
Figure 3. Trends in mean predator site occupation 1962–2000. This is expressed as the mean of ln(Pi,t + 1), where P is the year and site-specific estimate of predator activity derived from the binary logistic model (n.b. Pi,t + 1 is the unit measurement on which predator effect estimates are based). Trend lines ±2 standard errors were fitted with the loess smoother of the GAM package in R using a span of 0.2.
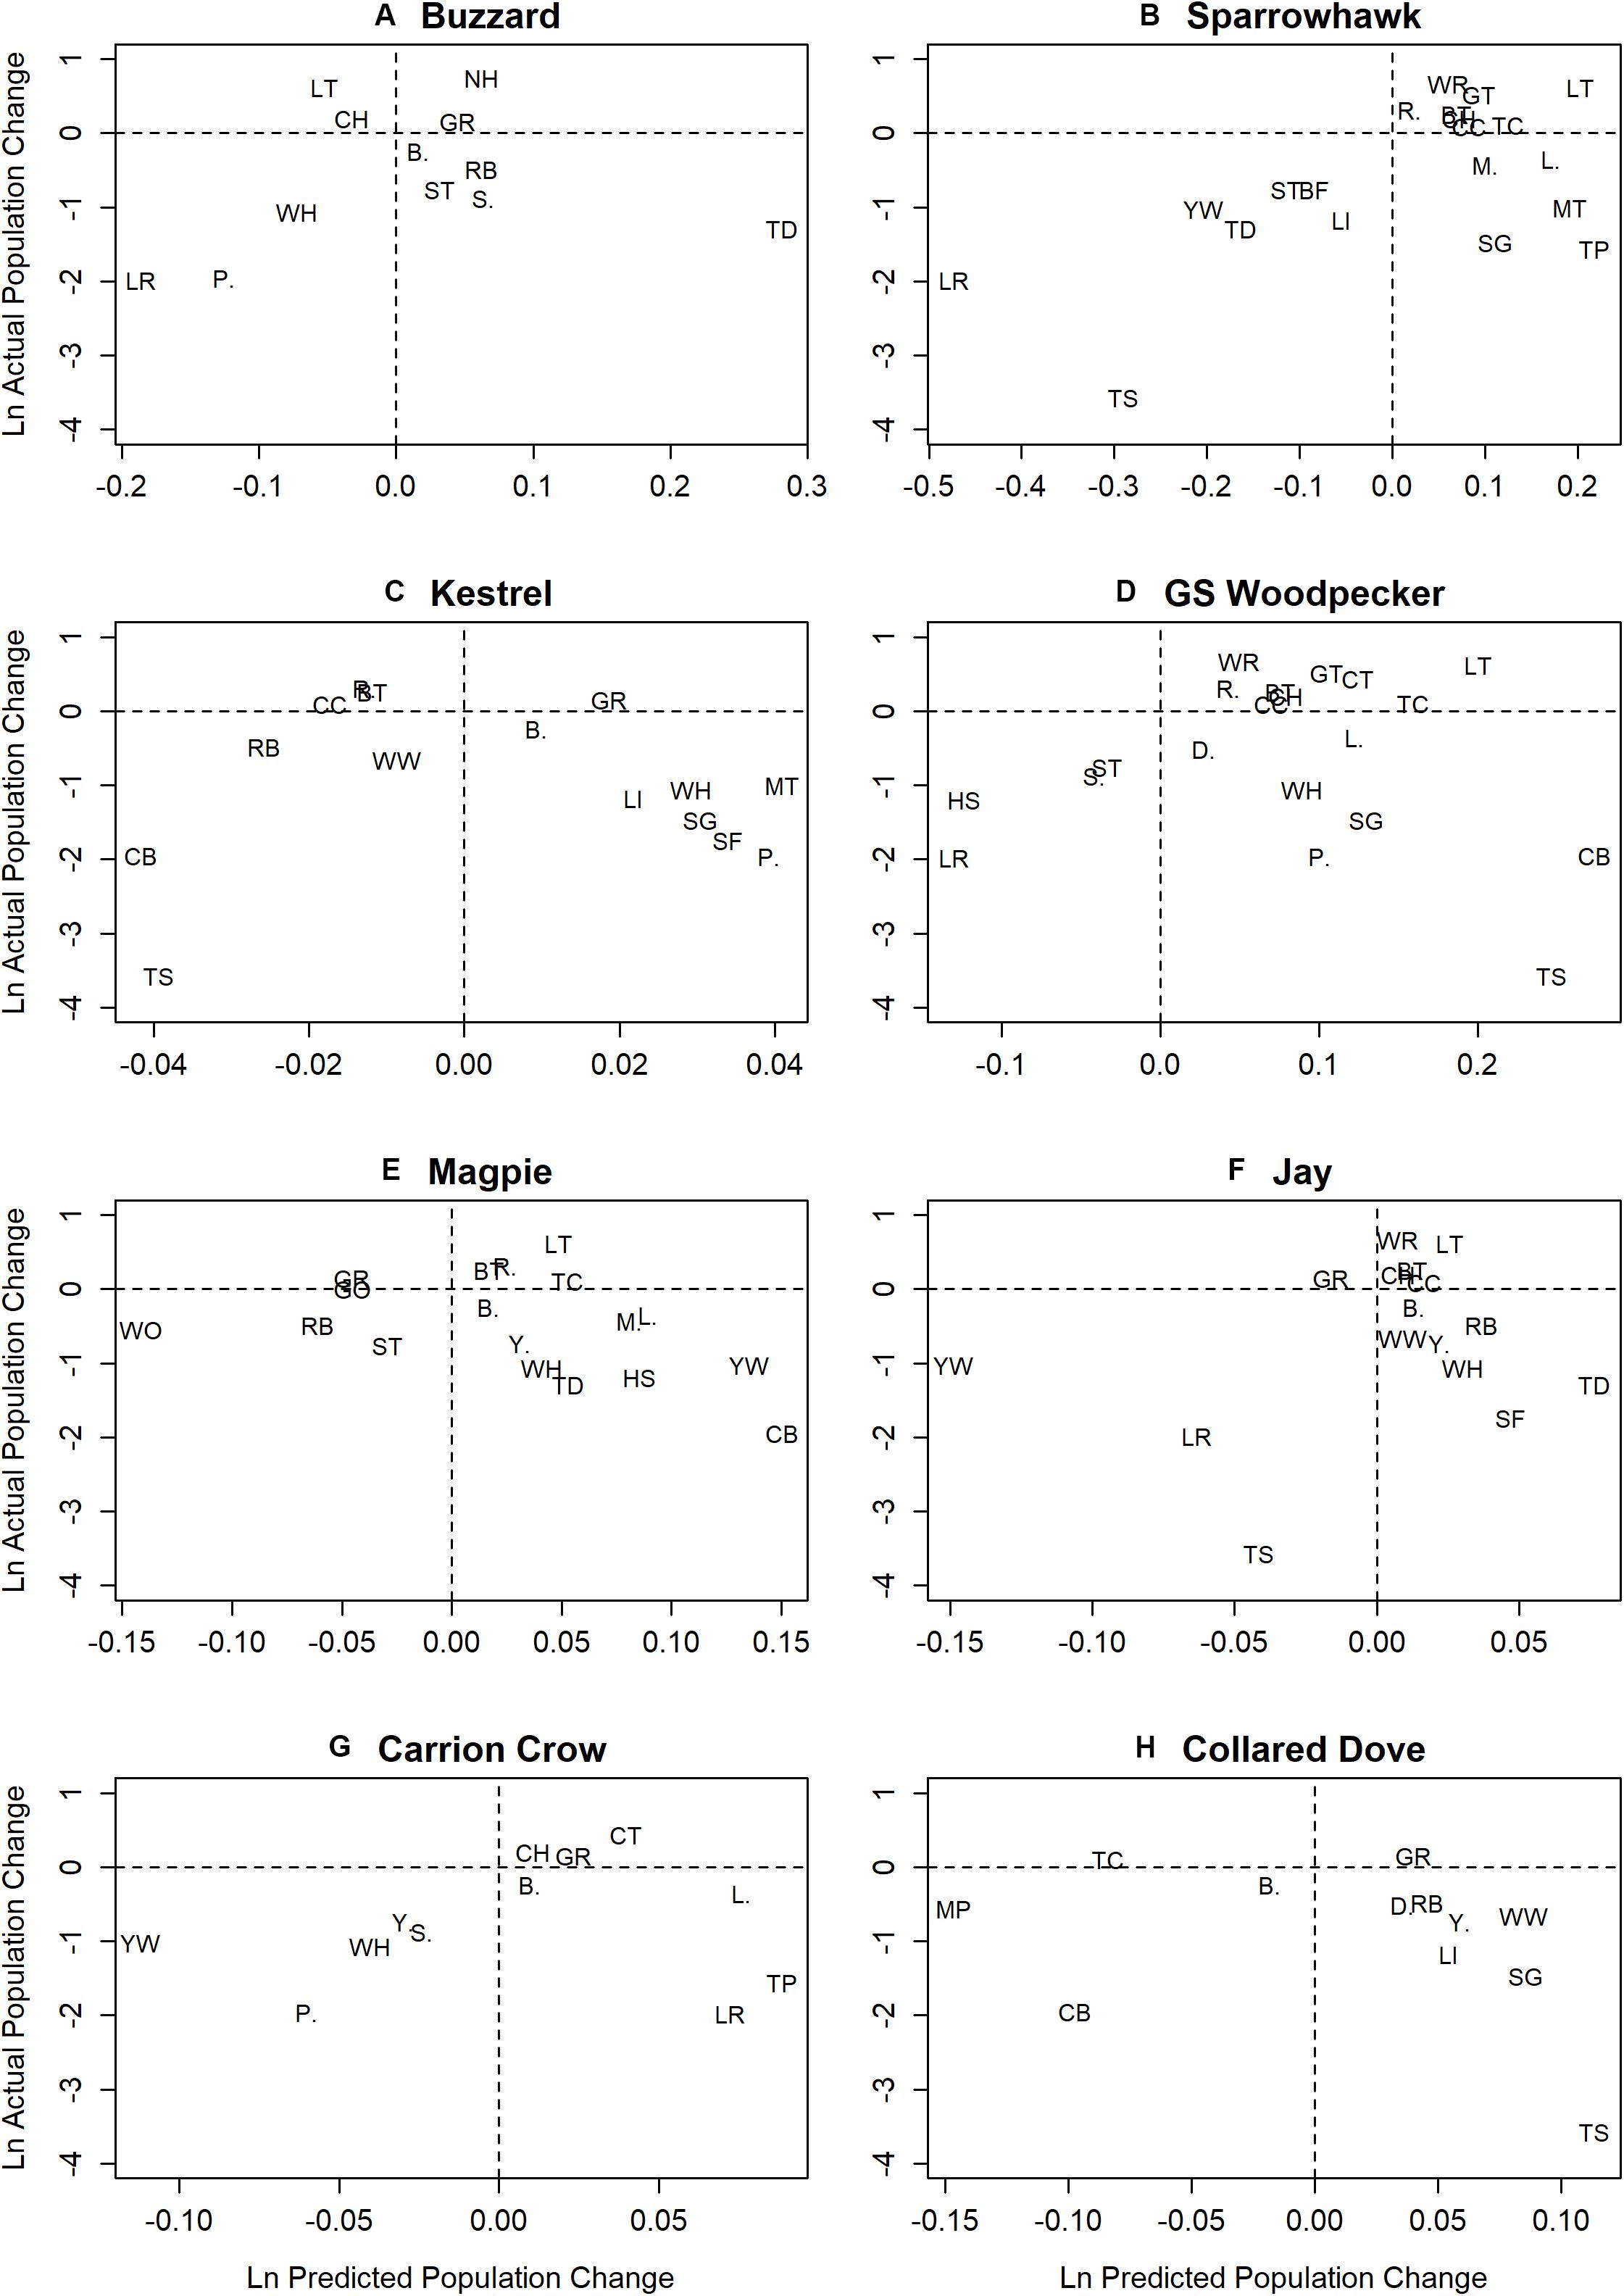
Figure 4. Plots of predicted ln prey population change across all census sites (ln Rprey) against ln actual population change for prey species with significant predator effects. Parts (A–H) show ln predicted prey population change from 1967–2000, as estimated from change in mean site occupation by individual predators and their prey-specific effect estimates, plotted against ln actual prey population change for the same period, except for prey species in which population estimates start later than 1967, i.e. House Sparrow (1976) and Wood Warbler (1994) (Woodward et al., 2018).
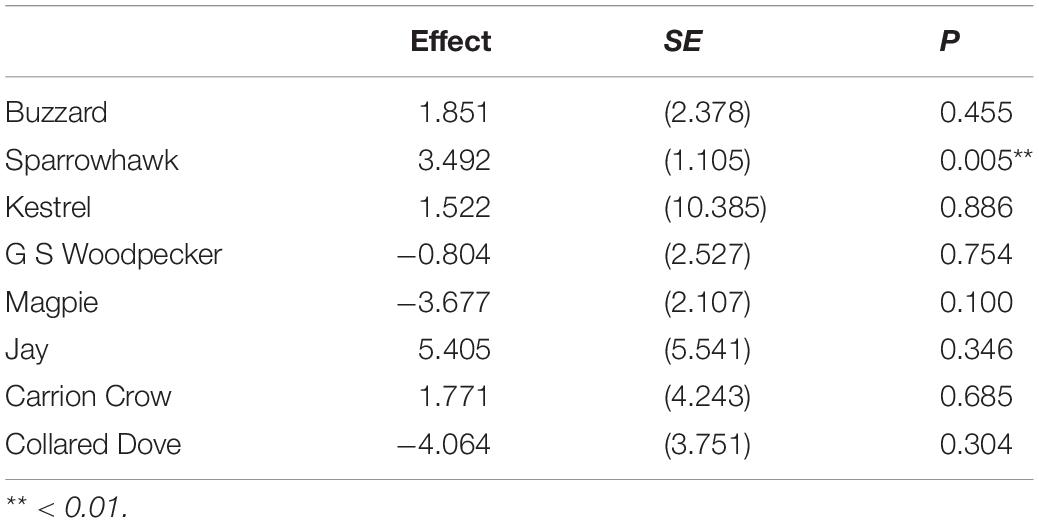
Table 4. Regression of loge actual prey population change against loge prey population change predicted from significant predator effects, given mean change in predator abundance.
Comparison With Previous Studies
The proportion of prey species with a significant overall predator effect is markedly higher than that reported by Newson et al. (2010), in which 9 of the 27 species covered by both studies (33%) proved significant, compared to 24 (89%) in the current analysis. Significant individual predator effects also occur at a higher frequency in the current study, with 27 negative (13%) and 61 positive (28%) effects among the 27 prey species, compared to 19 (9%) negative and 41 (19%) positive in Newson et al. (2010). Effect size estimates emerging from the two studies are uncorrelated except in Jay and Collared Dove (Table 5), and there is limited correspondence between the two studies as to which individual predator-prey interactions are significant, with agreement regarding significance on only 4 negative and 10 positive effects, and significant but opposite results in 6 cases (Table 6). Effect sizes reported in Newson et al. (2010) for predators represented by raw count data are markedly constrained around zero compared to those represented by modeled data, which comprise both the raptors in Newson et al. (2010) and all predators in the present study (Figure 5). Variance in effect estimates is therefore consistent between predator species in the present study (Fligner-Killeen test for homogeneity of variances: χ27 = 5.232, P = 0.632), but not in Newson et al. (2010) (χ27 = 95.241, P < < 0.001∗∗∗).
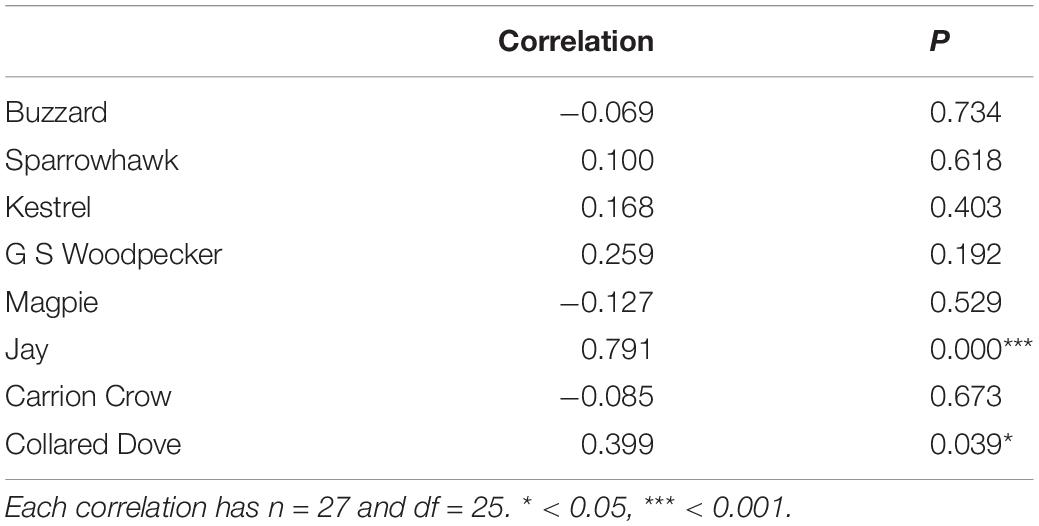
Table 5. Correlation between effect sizes reported in Newson et al. (2010) and current study.

Table 6. Correspondence of significant predator effects in Newson et al. (2010) and current study.
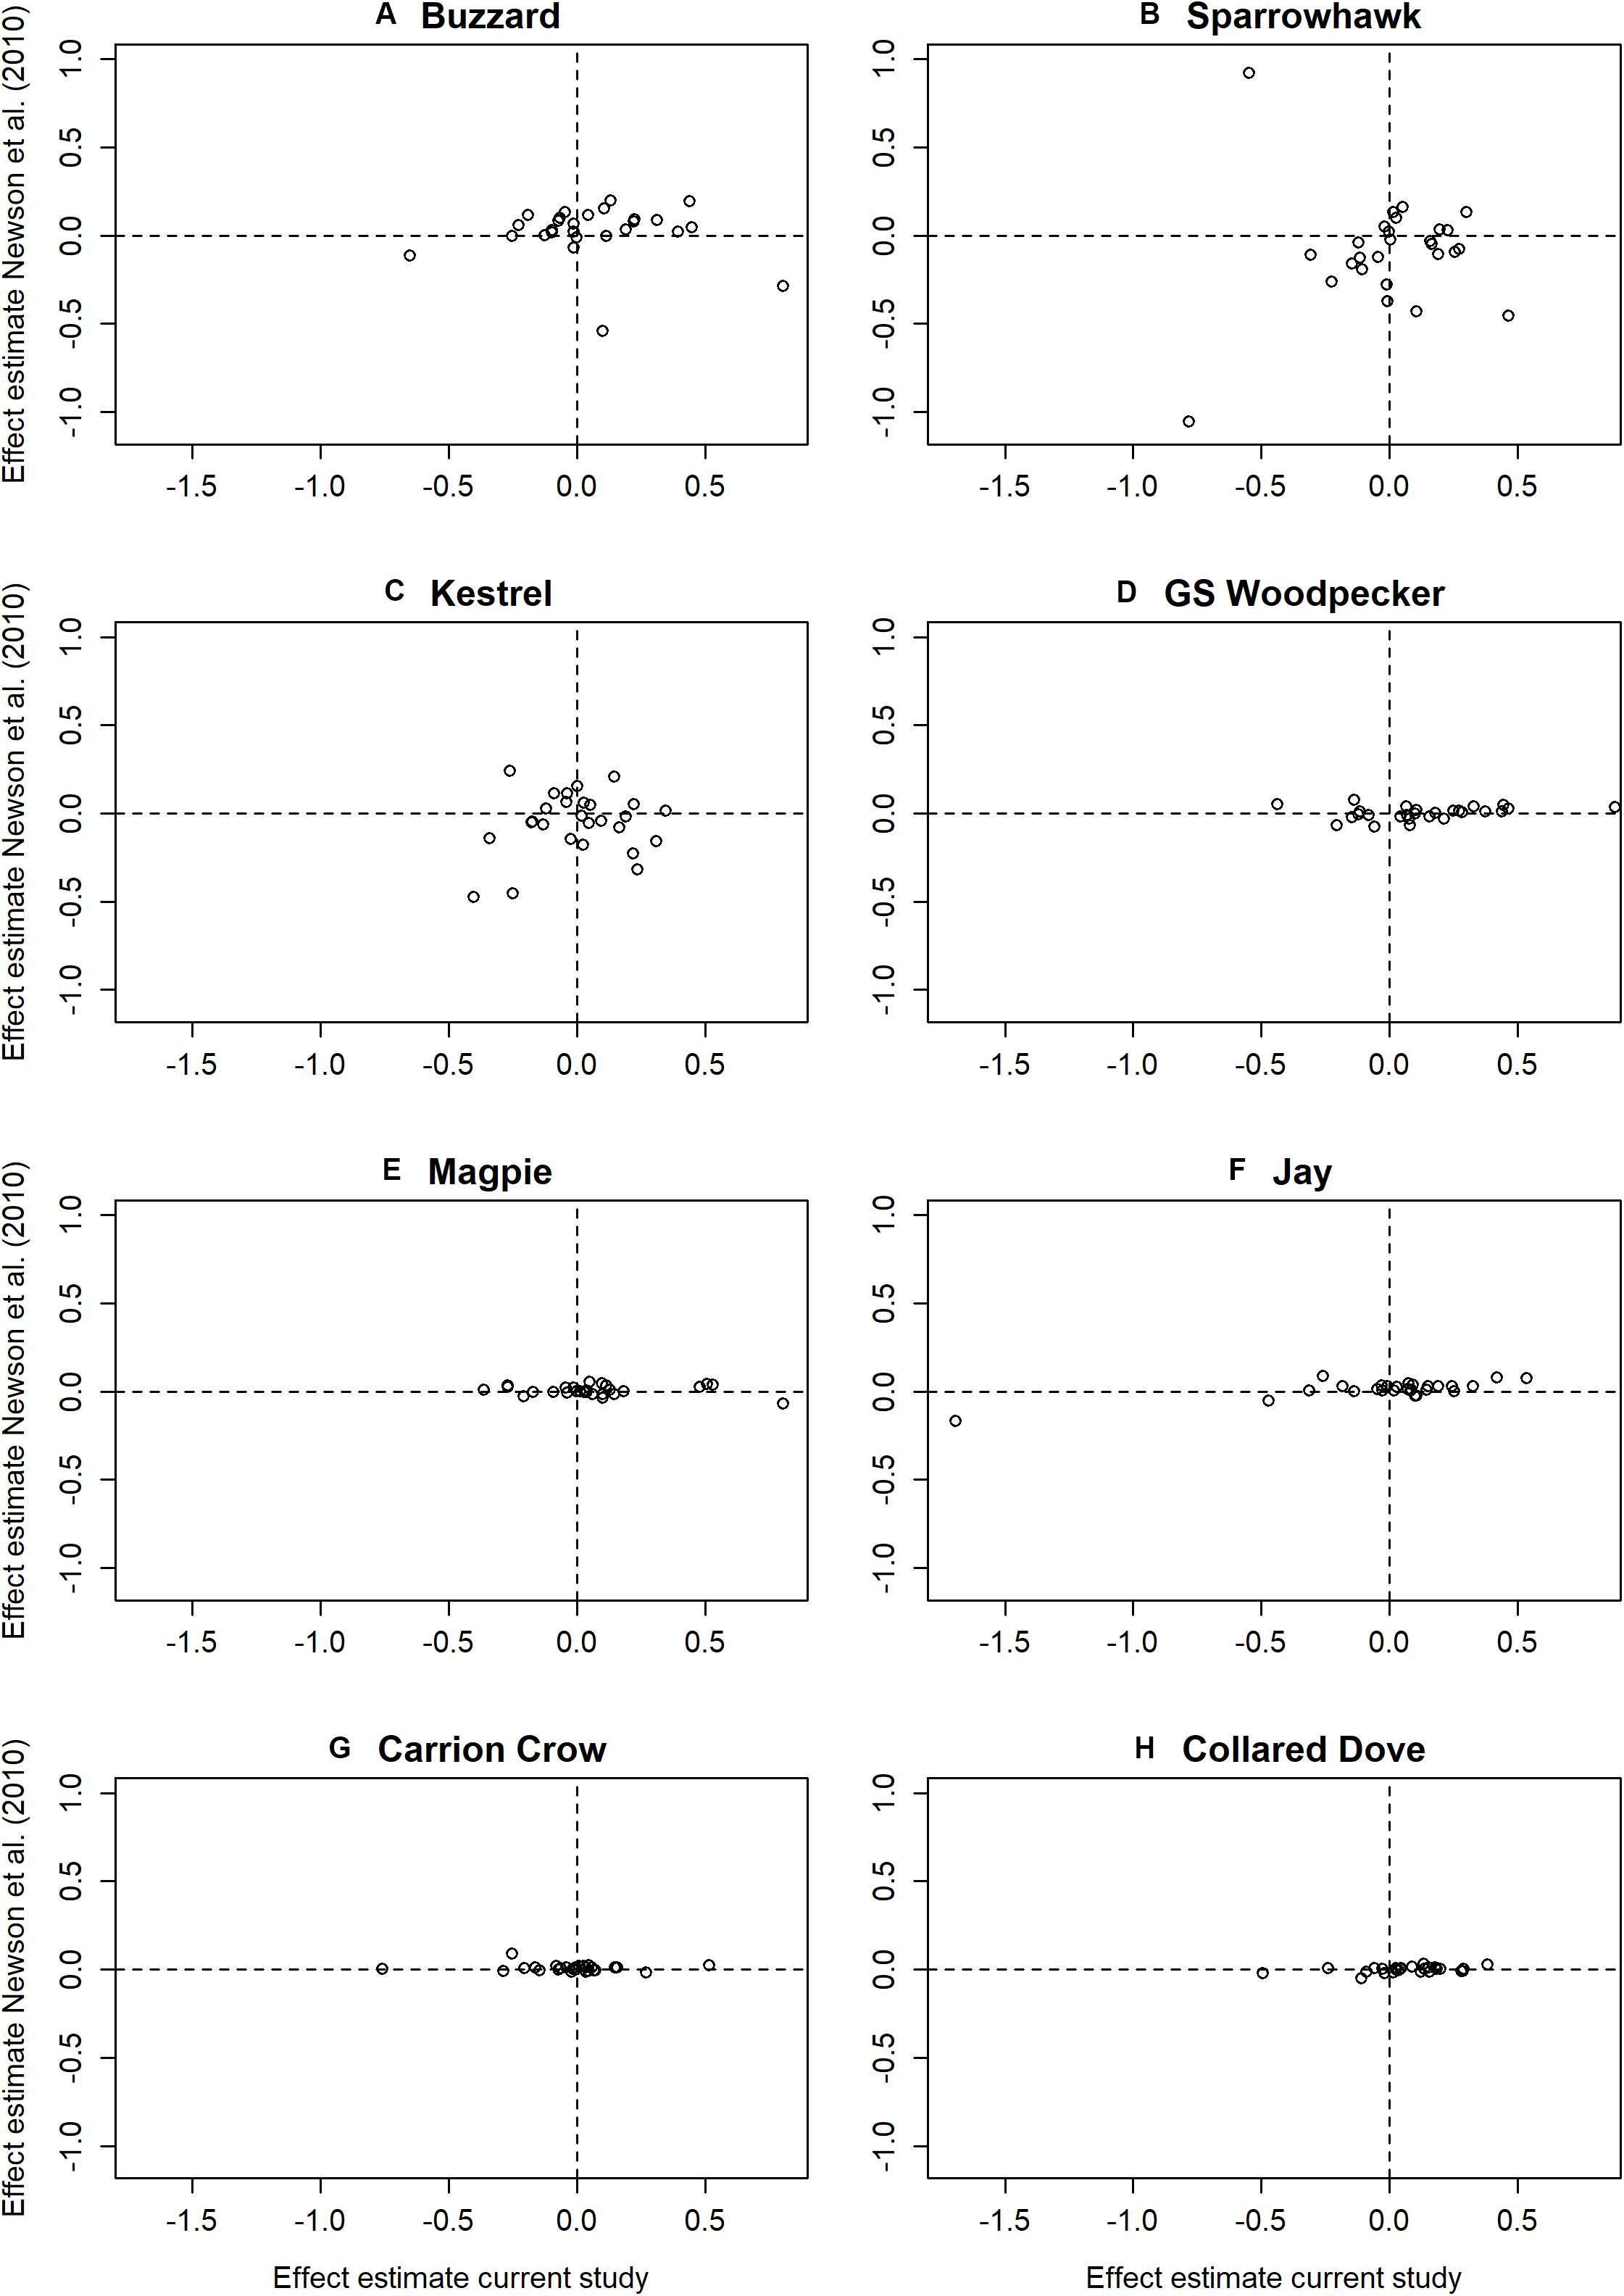
Figure 5. Plots of estimated predator effects on individual prey species from Newson et al. (2010) against equivalent estimates from the current study. Plots (A–H) show estimated effects of individual predator species on prey species covered by both studies.
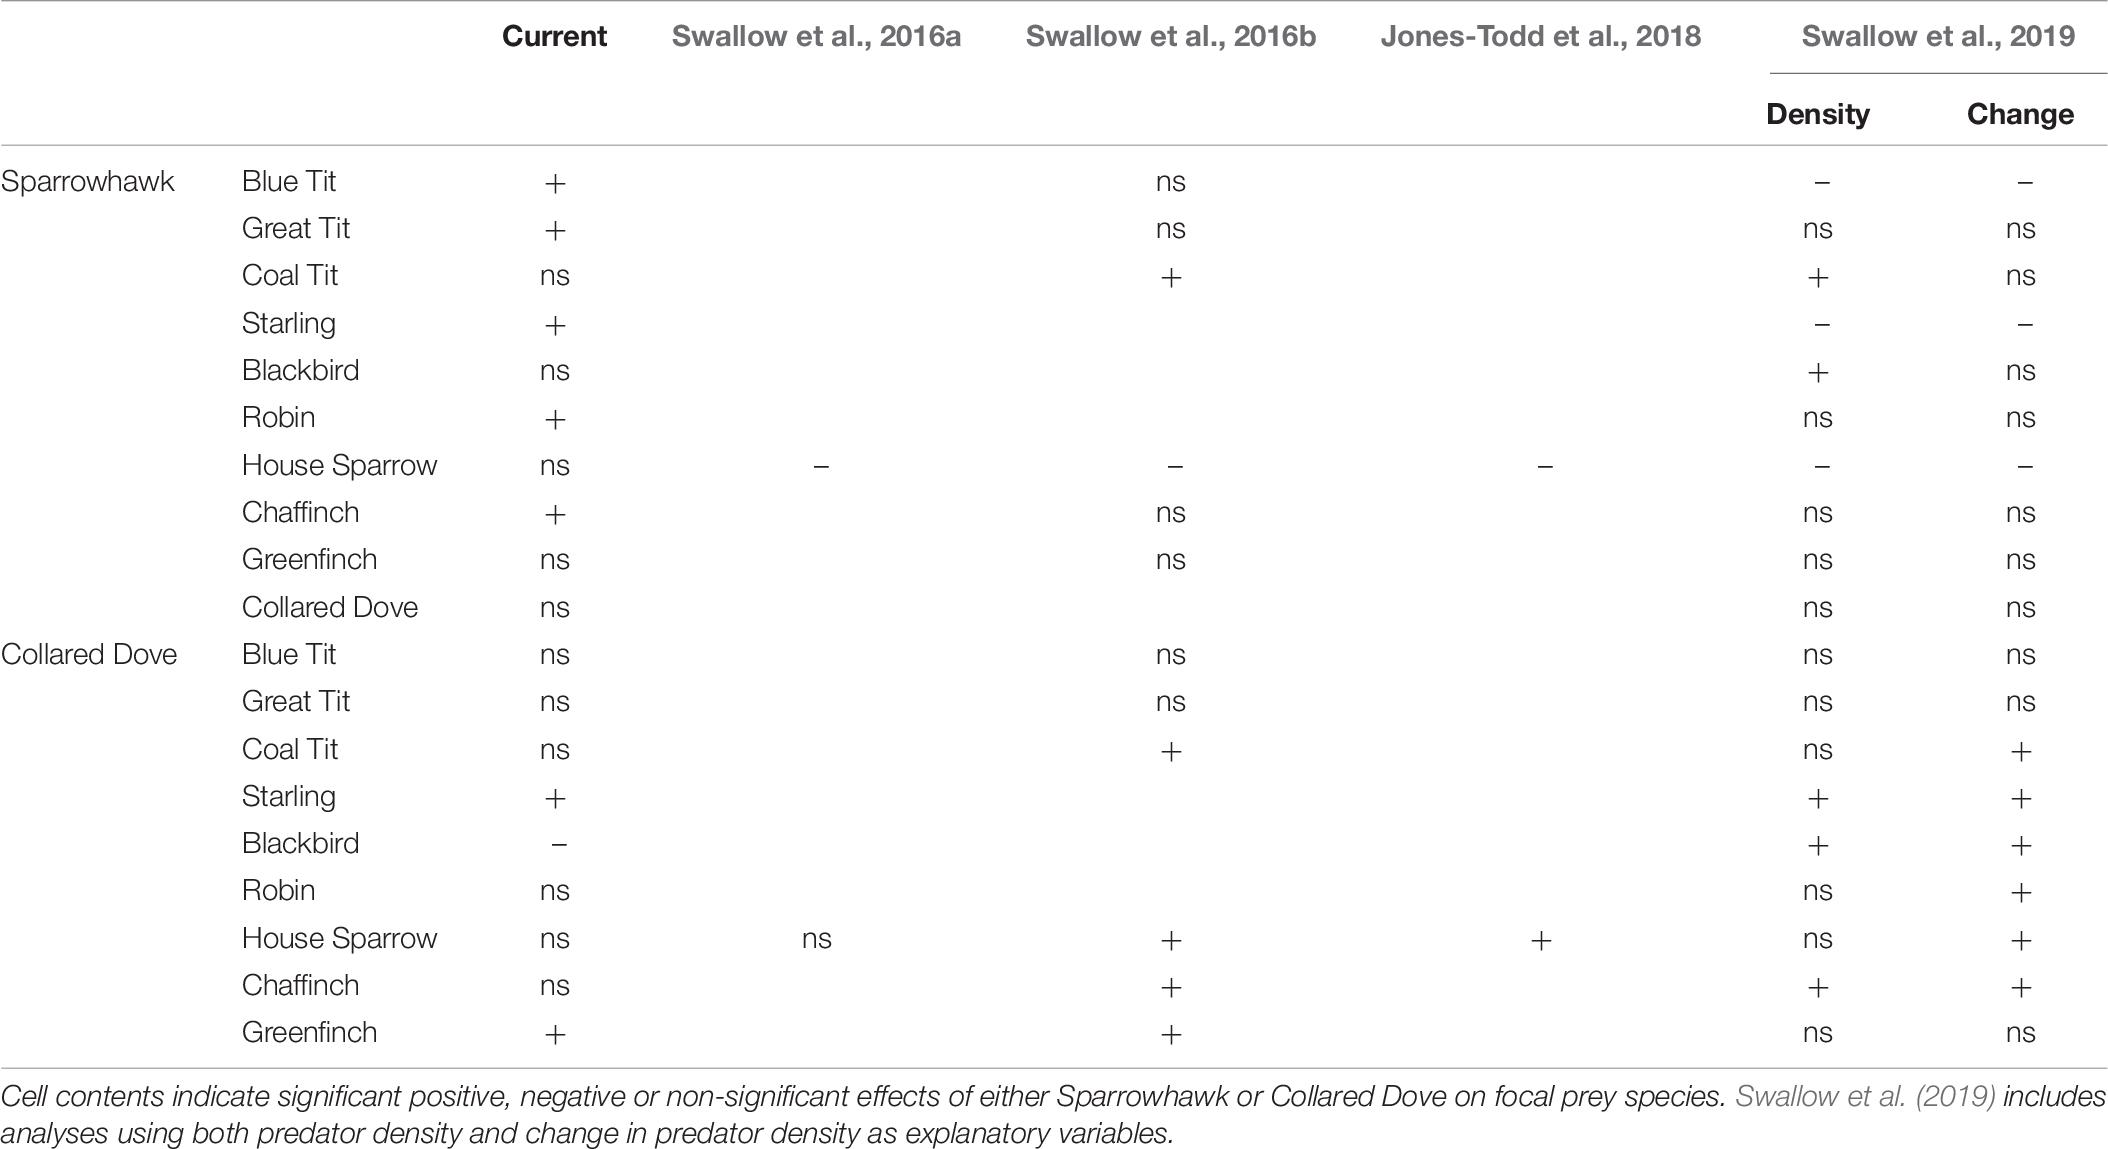
There are also substantial disparities with results emerging from more recent studies of predator effects using GBFS data (Table 7). Where results disagree for Sparrowhawk (21 out of 28 comparisons) GBFS studies tend to find outcomes that are more negative, i.e., either negative or non-significant for species with positive effects in the current study (Blue Tit, Great Tit, Starling, Robin, Chaffinch), or negative outcomes for species that are non-significant in the current study (House Sparrow). There are 9 agreements, which are all over non-significant outcomes, and 3 positive GBFS outcomes for species that were non-significant in the current study (Coal Tit, Blackbird).
Collared Dove shows a higher level of agreement, with 10 examples of agreed non-significance and 4 of agreed positive covariance. Among the disagreements GBFS outcomes tend to be more positive, with 9 examples of positive GBFS effects that were non-significant in the current study (Coal Tit, Robin, House Sparrow, Chaffinch) and two positive GBFS outcomes found here to be negative (both Blackbird), with only Greenfinch providing two instances of a non-significant GBFS outcome compared to a positive one here (Table 7).
Discussion
Comparison With Previous Studies
The results of this analysis bear limited resemblance to those of Newson et al. (2010), despite the fact that the two studies use substantially the same datasets and methodology. However, the effect sizes reported in Newson et al. (2010) are clearly dependent on the method used to estimate predator abundance, with restriction to a narrow range around zero for predators represented by raw count data compared to those represented by modeling in both Newson et al. (2010) and in the current study. This suggests a larger attenuation of effects resulting from error in the explanatory variables consisting of raw data, which is intuitively reasonable given that year to year variation in the underlying census estimates will inevitably include a large element of measurement error. Much of this measurement error will be partitioned as residual error in a model of predator abundance, and since it is the underlying trend in predator presence that is of interest as a predictor of prey population change, it makes sense that attenuation should be lower when it is represented by fitted values from a predator model. This can therefore explain the wider observed range of effect estimates among the modeled predator species, both in Newson et al. (2010) and the current study, although these will still be subject to some attenuation because of error in predator model estimates.
Although both studies use a modeling approach to estimate raptor abundance, they show less correspondence in effect estimates for raptors than for Jay and Collared Dove, which were both represented by raw data in Newson et al. (2010) (Table 5). However, the scale at which variation is measured is markedly different in the two studies. The CBC census plots used as the basis of spatial modeling by Newson et al. (2010) are typically tens of kilometers apart, and although they include an adjustment for habitat at the 1km square level, this can only capture local variation to a limited extent, and cannot account for random variation in local abundance or effects independent of habitat such as disturbance, all of which are captured by site-level modeling. These factors, together with the greater explanatory power of the analysis reported here, suggests that the site-level modeling approach used may have significant advantages over the mixture of spatial modeling and raw data used by Newson et al. (2010).
There are also major differences with the results of Swallow et al. (2016a,b, 2019), which themselves vary substantially (Table 7). However the results emerging from these studies may be of limited value, since the model used in each case has a common intercept across all years. This is contrary to indications emerging from Thomson et al. (1998) in favor of the inclusion of annual intercepts in the linear model, which has the effect of removing predator-prey covariance attributable to long-term national trends. The existence of such correlated trends provides the original motivation for analyses of this kind, but may represent a spurious relationship arising from separate and unconnected causal mechanisms, and since this potential source of covariance contributes to the effect sizes reported by Swallow et al. (2016a,b, 2019), this limits the inferences that can be drawn. In particular the negative associations reported for Blue Tit, Starling and House Sparrow with Sparrowhawk may simply reflect temporal covariance caused by declining attendance at bird feeders, which coincided with the increase in Sparrowhawk numbers but was somewhat later than the main period of Collared Dove increase.
The present study also contrasts with that of Jones-Todd et al. (2018), which reports that House Sparrow has a significant negative association with Sparrowhawk and a significant positive association with Collared Dove. However Jones-Todd et al. (2018) did not include any other predators or environmental covariates, and their result is the same as that which emerges using the methodology of the current study if such covariates are excluded (Bell, 2019).
Inference From Predator Effects
Although both positive and negative predator effects occur in the present study much more often than expected by chance, i.e., 13% negative and 26% positive (Table 1), compared to expected rates of 2.5% each, it is notable that positive effects occur at twice the rate of negative effects. Notwithstanding theoretical considerations relating to the ‘hydra effect’ (Abrams, 2009), it seems likely that such positive associations arise from the effect of prey abundance on predator activity rather than the other way around, as indicated by the generally positive covariance between predators and biomass (Supplementary Table S1). However this does not necessarily mean that increased predation is having no effect on a prey population, since it may be slowing the rate of prey increase or accelerating the rate of decline that would occur in response to change in habitat quality in the predator’s absence. Negative predator effects may therefore emerge only when they are sufficient to outweigh the fact that variation in local carrying capacity tends to produce positive covariance between predators and prey species.
Evidence for buffering in the form of reduction in predator effects following deletion of biomass is unevenly distributed and occurs mainly among negative predator effects, except in the case of Sparrowhawk where it occurs among positive effects (Figure 2). The former might be interpreted as evidence that the effect of predation on individual species is dependent on the abundance of alternative prey, and the latter that the same applies to the effect of individual prey species abundance on Sparrowhawk activity. However, biomass deletion also reduces negative effects associated with Collared Dove, including effects on Meadow Pipit, Treecreeper and Blackbird (Figure 2H), which are clearly not predation-related and seem unlikely to result from competition.
All such patterns might instead be explained by independent demographic trends, which manifest via sequential occupation or withdrawal from locations and/or habitats (Brown, 1969; Fretwell and Lucas, 1970, Figure 6). It is intuitive that if two species are independently increasing and expanding their range the result can be positive covariance in population change across a sample of census sites (cf. Figure 6A and upper right quadrant in Figure 4). However, the numerous instances of positive covariance between (increasing) predators and declining prey species (lower right quadrant, Figure 4) and the few instances of negative covariance with increasing prey species (upper left quadrant, Figure 4) can also be explained by independent demographic trends if the species involved differ in their core range or habitat. If, for example, increasing Great Spotted Woodpecker populations expanding from core wooded habitat to more open farmland encounter declining Corn Bunting and Tree Sparrow populations retreating in the same direction, this would lead to a positive correlation (Figure 4D) caused by contrast between stable woodpecker and declining bunting/sparrow populations in wooded farmland and increasing woodpecker and stable bunting/sparrow populations in open farmland (Figure 6D). Such independent demographic trends can also explain apparent buffering by biomass in the case of Corn Bunting (Figure 2D), which may decline more rapidly in poorer quality habitats supporting fewer birds of other species.
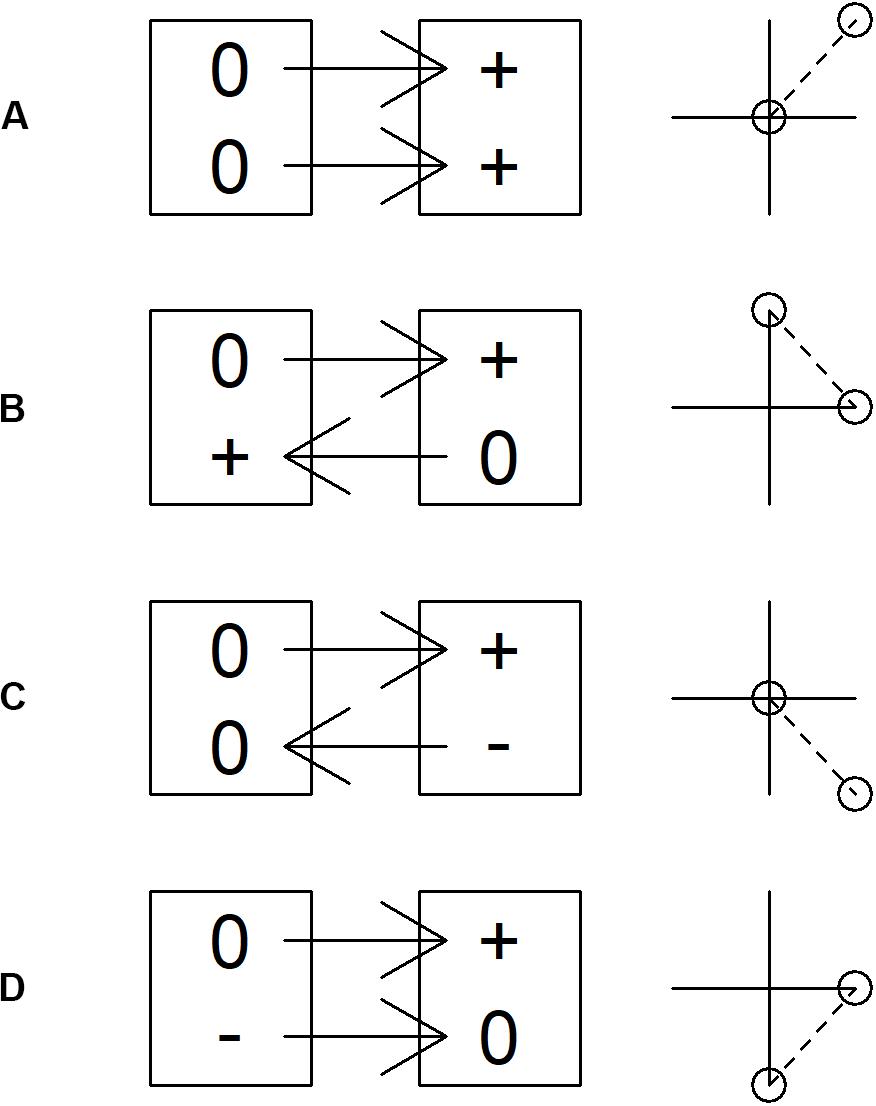
Figure 6. Spurious relationships resulting from simultaneous changes in species populations. Boxes represent habitats or census locations. 0, + and – represent change in population during a one year period for two species. The ‘correlation’ plot to the right represents relationships that emerge from a ‘change versus change’ analysis of the process illustrated. (A) Species share preferred habitat/core area and expand into marginal habitats/areas. (B) Species differ in preferred habitat/core area and expand into marginal habitats/areas. (C) Species share the same preferred habitat/core area and one expands into while another contracts from marginal habitat/areas. (D) Species differ in preferred habitat/core area and one expands while another contracts from marginal habitat/areas.
Another possible example concerns Buzzard populations that expanded from the west as Turtle Dove populations were retreating to the east (Massimino et al., 2019), which may have led to the observed positive correlation (Figure 4A) via contrast between stable Buzzard and declining Turtle Dove populations in the west, and stable Turtle Dove and increasing Buzzard populations in the east (Figure 6D). The negative association between increasing Collared Dove and Treecreeper populations (Figure 4H) could arise if each were relatively stable in their core habitat of suburbia and woodland respectively, while expanding into the other (Figure 6B). Collared Dove populations may also have expanded into farmland habitats that were marginal for retreating Corn Bunting and Meadow Pipit populations leading to a negative association (Figure 4H), with slower retreat in better quality habitat accounting for apparent buffering by biomass in Meadow Pipit (Figure 2H).
It is the case, therefore, that negative associations between increasing predators and decreasing prey species (lower left quadrant, Figure 4), which readily evoke direct interaction as an explanation, can also arise from independent demographic change (Figure 6C). Since the association between population change in predator and prey species is identical in either scenario, analysis of census data does not permit discrimination between them. It is nevertheless possible to identify associations that are more or less plausibly attributed to direct predation. For instance, declining Redpoll populations are negatively associated with Buzzard, Sparrowhawk, Great Spotted Woodpecker and Jay (Figures 4A,B,D,F), though by far the largest effect is that of Sparrowhawk, which also most plausibly attributed to predation on ecological grounds. The fact that Sparrowhawk is the only predator for which there is a significant relationship between predicted and actual population change at the national level also suggests that it is most likely to have contributed to general population decline among prey species.
Evaluation
Newson et al. (2010) were careful to frame inference from their results in terms of an absence of evidence for an impact of increased predator numbers on prey populations, but their conclusions carry the clear implication that widespread negative predator-prey associations should have emerged from their analysis if such impacts had occurred. The article has therefore been widely quoted as concluding that predators have little or no effect on prey populations (Bicknell et al., 2010; Eglington and Pearce-Higgins, 2012; Mallord et al., 2012), and the results it presents also have influence through inclusion in literature reviews on predation, in which the very large number of predator-prey cases it covers tends to overpower the influence of other studies (Madden et al., 2015; Roos et al., 2018).
The analysis presented here cast doubt on both the results and the inferences presented by Newson et al. (2010), since it demonstrates that change in predator abundance has much greater predictive power than was apparent in their analysis. It also shows that positive associations between predator and prey are widespread, suggesting that negative effects of predation might be undetectable against a general background of positive predator-prey covariance caused ultimately by common response to variation in habitat quality. Since it is also the case that negative associations may arise fortuitously as a result of contrasting patterns of sequential occupation of habitat or territory by expanding or contracting species populations, the utility of census data for investigation of predation effects may be limited.
In the absence of evidence to the contrary, the impact of increased numbers of predators therefore remains a viable hypothesis in relation to the bird population declines that occurred in Britain and elsewhere during the last quarter of the 20th century. It also gains credibility from the failure of farmland bird populations to recover following the widespread introduction of agri-environment schemes based on the prevailing hypothesis of farming-related food shortage (Davey et al., 2010). Predator numbers are seldom considered in the many studies linking farming practices with bird population declines, and because predator abundance is also largely determined by farming practice, it can potentially explain many aspects of bird decline that are routinely attributed to the direct influence of farming (Bell, 2011).
Since the publication of Newson et al. (2010), the study of predation and its potential for population regulation, particularly of songbirds, has been relatively neglected. However, the results presented here suggest an urgent need for the effect of predator abundance to be investigated alongside that of farming, and in particular for more experimental studies such as that of Sage and Aebischer (2017), in order to create a fund of evidence comparable to that which has clarified the role of predation in limiting gamebird and wader populations.
Data Availability Statement
The datasets generated for this study are not publicly available as they are only available under license through purchase from the British Trust for Ornithology.
Ethics Statement
Ethical review and approval was not required for the animal study because the study analyses historic bird census datasets and did not involve any novel interactions with any animal subject.
Author Contributions
The author confirms being the sole contributor of this work and has approved it for publication.
Funding
SongBird Survival made financial contributions towards the costs of the study.
Conflict of Interest
The author declares that the research was conducted in the absence of any commercial or financial relationships that could be construed as a potential conflict of interest.
Supplementary Material
The Supplementary Material for this article can be found online at: https://www.frontiersin.org/articles/10.3389/fevo.2020.00277/full#supplementary-material
Footnotes
References
Abrams, P. A. (2009). When does greater mortality increase population size? The long history and diverse mechanisms underlying the hydra effect. Ecol. Lett. 12, 462–474. doi: 10.1111/j.1461-0248.2009.01282.x
Bell, C. P. (2011). Misapplied ecology: investigations of population decline in the House Sparrow. Int. Stud. Sparrows 35, 24–34. doi: 10.1515/isspar-2015-0009
Bell, C. P. (2019). Evidence that population increase and range expansion by Eurasian Sparrowhawks has impacted avian prey populations. bioRxiv [Preprint] doi: 10.1101/491522
Bell, C. P., Baker, S. W., Parkes, N. G., Brooke, M. D. L., and Chamberlain, D. E. (2010). The Role of the Eurasian Sparrowhawk (Accipiter nisus) in the Decline of the House Sparrow (Passer domesticus) in Britain. Auk 127, 411–420. doi: 10.1525/auk.2009.09108
Berryman, A. A. (2004). Limiting Factors and Population Regulation. Oikos 105, 667–670. doi: 10.1111/j.0030-1299.2004.13381.x
Bicknell, J., Smart, J., Hoccom, D., Amar, A., Evans, A., Walton, P., et al. (2010). Impacts of Non-Native Gamebird Release in the UK: A Review. Sandy: RSPB.
Brown, J. L. (1969). The Buffer Effect and Productivity in Tit Populations. Am. Nat. 103, 347–354. doi: 10.1086/282607
Chamberlain, D. E., Glue, D. E., and Toms, M. P. (2009). Sparrowhawk Accipiter nisus presence and winter bird abundance. J. Ornithol. 150, 247–254. doi: 10.1007/s10336-008-0344-344
Davey, C. M., Vickery, J. A., Boatman, N. D., Chamberlain, D. E., Parry, H. R., and Siriwardena, G. M. (2010). Assessing the impact of Entry Level Stewardship on lowland farmland birds in England. Ibis 152, 459–474. doi: 10.1111/j.1474-919X.2009.01001.x
Eglington, S. M., and Pearce-Higgins, J. W. (2012). Disentangling the relative importance of changes in climate and land-use intensity in driving recent bird population trends. PLoS One 7:e30407. doi: 10.1371/journal.pone.0030407
Freeman, S. N., and Newson, S. E. (2008). On a log-linear approach to detecting ecological interactions in monitored populations. Ibis 150, 250–258. doi: 10.1111/j.1474-919X.2007.00770.x
Fretwell, S. D., and Lucas, H. L. (1970). On territorial behavior and other factors influencing habitat distribution in birds. Acta Biotheor. 19, 1–6.
Gibbons, D. W., Amar, A., Anderson, G. Q. A., Bolton, M., Bradbury, R. B., and Easton, M. A. (2007). The Predation of Wild Birds in the UK: A Review of Its Conservation Impact and Management RSPB Research Report No. 23. Sandy: RSPB.
Holt, A. R., Davies, Z. G., Tyler, C., and Staddon, S. (2008). Meta-analysis of the effects of predation on animal prey abundance: evidence from UK vertebrates. PLoS One 3:e2400. doi: 10.1371/journal.pone.0002400
Inger, R., Gregory, R., Duffy, J. P., Stott, I., Voøíšek, P., and Gaston, K. J. (2015). Common European birds are declining rapidly while less abundant species’ numbers are rising. Ecol. Lett. 18, 28–36. doi: 10.1111/ele.12387
Jones-Todd, C. M., Swallow, B., Illian, J. B., and Toms, M. (2018). A spatiotemporal multispecies model of a semicontinuous response. J. R. Stat. Soc. 67, 705–722. doi: 10.1111/rssc.12250
Madden, C. F., Arroyo, B., and Amar, A. (2015). A review of the impacts of corvids on bird productivity and abundance. Ibis 157, 1–16. doi: 10.1111/ibi.12223
Mallord, J. W., Orsman, C. J., Cristinacce, A., Butcher, N., Stowe, T. J., and Charman, E. C. (2012). Mortality of Wood Warbler Phylloscopus sibilatrix nests in Welsh Oakwoods: predation rates and the identification of nest predators using miniature nest cameras. Bird Study 59, 286–295. doi: 10.1080/00063657.2012.669359
Massimino, D., Woodward, I. D., Hammond, M. J., Harris, S. J., Leech, D. I., Noble, D. G., et al. (2019). BirdTrends 2019: Trends in Numbers, Breeding Success and Survival for UK Breeding Birds. Thetford: BTO.
Newson, S. E., Rexstad, E. A., Baillie, S. R., Buckland, S. T., and Aebischer, N. J. (2010). Population change of avian predators and grey squirrels in England: is there evidence for an impact on avian prey populations? J. Appl. Ecol. 47, 244–252. doi: 10.1111/j.1365-2664.2010.01771.x
R Core Team (2018). R: A Language and Environment for Statistical Computing. Vienna: R Foundation for Statistical Computing.
Robinson, R. A. (2005). BirdFacts: profiles of birds occurring in Britain & Ireland. Available at: http://www.bto.org/birdfacts (accessed on 15 February 2020).
Roos, S., Smart, J., Gibbons, D. W., and Wilson, J. D. (2018). A review of predation as a limiting factor for bird populations in mesopredator-rich landscapes: a case study of the UK. Biol. Rev. 93, 1915–1937. doi: 10.1111/brv.12426
Sage, R. B., and Aebischer, N. J. (2017). Does best-practice crow Corvus corone and magpie Pica pica control on UK farmland improve nest success in hedgerow-nesting songbirds? A field experiment. wbio 2017, 1–10. doi: 10.2981/wlb.00375 [Epub ahead of print].
Salo, P., Banks, P. B., Dickman, C. R., and Korpimäki, E. (2010). Predator manipulation experiments: impacts on populations of terrestrial vertebrate prey. Ecol. Monogr. 80, 531–546. doi: 10.1890/09-1260.1
Sibly, R. M., Barker, D., Denham, M. C., Hone, J., and Pagel, M. (2005). On the Regulation of Populations of Mammals. Birds, Fish, and Insects. Science 309, 607–610. doi: 10.1126/science.1110760
Smith, R. K., Pullin, A. S., Stewart, G. B., and Sutherland, W. J. (2010). Effectiveness of Predator Removal for Enhancing Bird Populations. Conserv. Biol. 24, 820–829. doi: 10.1111/j.1523-1739.2009.01421.x
Smith, R. K., Pullin, A. S., Stewart, G. B., and Sutherland, W. J. (2011). Is nest predator exclusion an effective strategy for enhancing bird populations? Biol. Conserv. 144, 1–10. doi: 10.1016/j.biocon.2010.05.008
Stanton, R. L., Morrissey, C. A., and Clark, R. G. (2018). Analysis of trends and agricultural drivers of farmland bird declines in North America: a review. Agricult. Ecosyst. Environ. 254, 244–254. doi: 10.1016/j.agee.2017.11.028
Swallow, B., Buckland, S. T., King, R., and Toms, M. P. (2016a). Bayesian hierarchical modelling of continuous non-negative longitudinal data with a spike at zero: an application to a study of birds visiting gardens in winter. Biom. J. 58, 357–371. doi: 10.1002/bimj.201400081
Swallow, B., King, R., Buckland, S. T., and Toms, M. P. (2016b). Identifying multispecies synchrony in response to environmental covariates. Ecol. Evol. 6, 8515–8525. doi: 10.1002/ece3.2518
Swallow, B., Buckland, S. T., King, R., and Toms, M. P. (2019). Assessing factors associated with changes in the numbers of birds visiting gardens in winter: are predators partly to blame? Ecol. Evol. 9, 12182–12192. doi: 10.1002/ece3.5702
Thomson, D. L., Green, R. E., Gregory, R. D., and Baillie, S. R. (1998). The widespread declines of songbirds in rural Britain do not correlate with the spread of their avian predators. Proc. Biol. Sci. 265, 2057–2062. doi: 10.1098/rspb.1998.0540
White, T. C. R. (2008). The role of food, weather and climate in limiting the abundance of animals. Biol. Rev. 83, 227–248. doi: 10.1111/j.1469-185X.2008.00041.x
Keywords: population limitation, spurious correlation, bird census data, raptors, corvids, songbirds
Citation: Bell CP (2020) Bird Census Data Do Not Indicate a Lack of Impact on Songbirds From the Growth of Avian Predator Populations in Britain in the Late 20th Century. Front. Ecol. Evol. 8:277. doi: 10.3389/fevo.2020.00277
Received: 01 March 2020; Accepted: 05 August 2020;
Published: 02 October 2020.
Edited by:
Cagan H. Sekercioglu, The University of Utah, United StatesReviewed by:
Bilal Habib, Wildlife Institute of India, IndiaAdrian Schiavini, Consejo Nacional de Investigaciones Científicas y Técnicas (CONICET), Argentina
Jaimie Dick, Queen’s University Belfast, United Kingdom
Copyright © 2020 Bell. This is an open-access article distributed under the terms of the Creative Commons Attribution License (CC BY). The use, distribution or reproduction in other forums is permitted, provided the original author(s) and the copyright owner(s) are credited and that the original publication in this journal is cited, in accordance with accepted academic practice. No use, distribution or reproduction is permitted which does not comply with these terms.
*Correspondence: Christopher Paul Bell, bWFpbEBjcGJlbGwuY28udWs=
 Christopher Paul Bell