 Jennifer L. Merems1
 Lisa A. Shipley2
 Taal Levi3
 Joel Ruprecht3
 Darren A. Clark4
 Michael J. Wisdom5
 Nathan J. Jackson6
 Kelley M. Stewart6
 Ryan A. Long1*
- 1Department of Fish and Wildlife Sciences, University of Idaho, Moscow, ID, United States
- 2School of the Environment, Washington State University, Pullman, WA, United States
- 3Department of Fisheries and Wildlife, Oregon State University, Corvallis, OR, United States
- 4Oregon Department of Fish and Wildlife, La Grande, OR, United States
- 5USDA Forest Service, Pacific Northwest Research Station, La Grande, OR, United States
- 6Department of Natural Resources and Environmental Science, University of Nevada, Reno, Reno, NV, United States
In heterogeneous landscapes, large herbivores employ plastic behavioral strategies to buffer themselves against negative effects of environmental variation on fitness. Yet, the mechanisms by which individual responses to such variation scale up to influence population performance remain uncertain. Analyses of space-use behaviors exemplify this knowledge gap, because such behaviors are often assumed, but rarely demonstrated, to have direct fitness consequences. We combined fine-scale data on forage biomass and quality with movement data and measures of somatic energy reserves to determine whether variation in use (the quantity of resource units, e.g., pixels on a landscape, that receive some level of investment by an animal during a specific sampling period) or selection (use of a resource unit relative to its availability to the animal during the same sampling period) of the nutritional landscape predicted early winter body condition of mule deer (Odocoileus hemionus). At the population level, mule deer exhibited stronger selection for high forage biomass at the landscape scale than at the home-range scale, and during summer than during spring. Use of the nutritional landscape varied among individual deer and had important consequences for early winter condition (an important determinant of survival and reproduction in capital-breeding ungulates). Females that consistently used vegetation communities that provided high biomass of preferred forage plants throughout spring and summer entered winter in better condition than females that used those vegetation communities less frequently. In contrast, selection (i.e., use relative to availability) of the nutritional landscape by individual deer was not significantly related to early winter condition at either the landscape or home-range scales. Our results highlight the value of using mechanistic, nutritional approaches to understand the potential fitness consequences of individual variation in behavior. In addition, our study suggests that patterns of forage use by ungulates may sometimes correlate more strongly with fitness than patterns of forage selection, which are scale-dependent and more vulnerable to biases stemming from the need to accurately quantify availability.
Introduction
In heterogeneous landscapes, free-ranging animals often are forced to make complex tradeoffs among factors that influence fitness (e.g., forage versus predation risk; Berger, 1991; Barten et al., 2001). In the most fundamental life-history tradeoff experienced by animals in resource-limited environments, individuals must balance the costs of current reproduction against future reproduction and survival (Stearns, 1992; Monteith et al., 2013). Behavioral plasticity is one key mechanism by which animals cope with this tradeoff and buffer themselves against environmental variation (Huey et al., 2003). An increasing body of evidence suggests that behavioral strategies used by animals to overcome environmental constraints on fitness often vary with endogenous traits such as age (Montgomery et al., 2013), nutritional condition (Monteith et al., 2011, 2013; Long et al., 2014), immune function (Downs et al., 2015), or personality (Dall et al., 2004; Stamps and Groothuis, 2010). Yet, the mechanisms by which individual responses to variation in resource availability scale up to influence population performance remain unclear.
In temperate and polar environments, large terrestrial herbivores exhibit life-history strategies that revolve around seasonal changes in resource availability and the energetic demands imposed by key life-history events (Monteith et al., 2013). These long-lived mammals must accrue sufficient energy and protein reserves during summer to replenish reserves lost over winter, while also meeting the demands of lactation without endangering future survival and reproduction (Therrien et al., 2008; Bårdsen et al., 2010; Tollefson et al., 2010; Bårdsen and Tveraa, 2012). Large herbivores use a variety of physiological and behavioral strategies for coping with these tradeoffs (Monteith et al., 2013), and maximizing energy intake during summer is among the most critical (Cook et al., 2004; Monteith et al., 2013; Long et al., 2014, 2016). Small differences in the ratio of energy intake to expenditure during summer can have a disproportionate influence (i.e., a multiplier effect; White, 1983; Cook et al., 2004) on early winter body mass and condition that directly influences survival and reproductive success (Festa-Bianchet et al., 1997; Côté and Festa-Bianchet, 2001; Cook et al., 2004; Monteith et al., 2014). Nevertheless, a variety of factors (e.g., competition and risk of predation) may limit the ability of herbivores to optimize their use of the nutritional landscape (i.e., variation in the density of energy and protein across space and time; Pretorius et al., 2011). Under these conditions, differences in use of the nutritional landscape among individuals can have important fitness consequences (van Beest and Milner, 2013; Long et al., 2016).
Because nutrition integrates the responses of ungulates to their environment (Parker et al., 2009), research approaches that are grounded in the mechanistic principles of nutritional ecology are useful for predicting fitness consequences of behavior. In particular, patterns of movement and space use can be linked to fitness via their effects on energy balance, and thus nutritional condition, of individuals (e.g., Long et al., 2016). Measuring such behaviors is complicated, however, and there are multiple metrics designed to quantify the responses of ungulates to variation in the quality, abundance, or distribution of resources. Two such metrics commonly derived from telemetry data are resource use (i.e., the quantity of resource units (e.g., pixels on a landscape) that receive some level of investment (e.g., time spent in the unit) by an animal during a specific sampling period; Manly et al., 2002; Lele et al., 2013) and resource selection (i.e., use of a resource unit relative to its availability to the animal during the same sampling period; Manly et al., 2002). In contrast to resource use, resource availability is scale-dependent, and thus patterns of selection can change across spatial scales (e.g., geographic range, landscape, or home range scales) even as use remains constant (Johnson, 1980; Manly et al., 2002). Moreover, environmental covariates with the greatest potential to influence fitness often are selected most strongly at the largest scales. For example, if predation is the primary factor limiting an herbivore population, then individuals will often first locate their home range in a part of the landscape that reduces predation risk (2nd-order selection; Johnson, 1980), and then select the best forage available within that home range (3rd-order selection; Johnson, 1980; Bowyer and Kie, 2006). Both resource use and resource selection have value for understanding the causes and consequences of ungulate behavior (Millspaugh et al., 2006), but to our knowledge no previous study has compared the relative value of these metrics for linking patterns of movement or space use to fitness correlates such as nutritional condition.
Metrics of individual performance such as body mass and condition have been repeatedly demonstrated to influence survival and reproductive success of adult ungulates (Gaillard et al., 2000; Cook et al., 2004). Early winter condition in particular strongly affects overwinter survival of capital-breeding ungulates by determining the availability of fat stores that can be catabolized for energy when high-quality forage is unavailable in winter (Cook et al., 2004). Relationships between condition and individual fitness also scale up to influence population performance. For example, using a long-term dataset on mule deer in the Sierra Nevada, Monteith et al. (2014) demonstrated that population growth rate was dependent on condition, and that the rate of population change transitioned from positive (λ > 1) to negative (λ < 1) at a mean condition of approximately 12.4% ingesta-free body fat.
Our objective was to understand whether individual variation in use or selection (i.e., use relative to availability) of the nutritional landscape translated into variation in early-winter condition of female mule deer (Odocoileus hemionus). We hypothesized that:
1. H1: Mule deer will show stronger selection for the nutritional landscape at the landscape scale (i.e., 2nd-order selection) than at the home-range scale (i.e., 3rd-order selection.
2. H2: Mule deer will show stronger selection for the nutritional landscape during summer than spring because high-quality forage resources are more evenly dispersed, and therefore more easily accessible, during spring.
3. H3: Strength of selection (use relative to availability) for the nutritional landscape at the landscape scale will be more strongly correlated with early-winter condition of individual deer than strength of selection at the home-range scale, because forage abundance and quality during summer are primary determinants of overwinter condition and survival of deer, and thus deer will select the nutritional landscape most strongly and consistently at the larger scale.
4. H4: Individual deer that use (i.e., spend more time in, independent of availability) vegetation communities with high biomass of preferred forages more consistently during spring and summer will enter winter in better condition than deer that spend less time in high-quality vegetation communities.
5. H5: Mean nutritional condition of mule deer in early winter will be above thresholds for maintaining positive population growth (∼12.4% ingesta-free body fat when λ = 1; Monteith et al., 2014) because mule deer are actively selecting areas where preferred forage plants are readily available (i.e., areas of high forage biomass).
Materials and Methods
Study Area
We conducted our study at the Starkey Experimental Forest and Range, Blue Mountains, northeastern Oregon (45° 12′N, 118° 3′W), United States, during May–August of 2016 and 2017. Starkey is surrounded by a 2.4-m high fence that prevents movement of ungulates into or out of the study area (Rowland et al., 1997). Starkey encompasses 10,125 ha of the Wallowa-Whitman National Forest and supports a variety of large herbivores and predators [mule deer, elk (Cervus canadensis), cattle, mountain lions (Puma concolor), American black bears (Ursus americanus), coyotes (Canis latrans) and bobcats (Lynx rufus)]. The estimated population size of female mule deer at Starkey was 51 deer (95% credible interval = 43 – 60), including yearlings, during the time of our study (T. D. Forrester, Oregon Department of Fish and Wildlife, unpublished data; 0.65 deer/km2). Drainages and vegetation communities create a complex and varied foraging landscape at Starkey. Elevations range from 1,120 to 1,500 m, and annual precipitation is 510 mm, falling primarily during winter as snow. The study area supports a mosaic of grasslands, wet meadows, shrublands, and coniferous forests. A more detailed description of the study area is provided by Rowland et al. (1997).
Animal Capture and Handling
To quantify use of the nutritional landscape by mule deer, we collected data on space-use behavior of adult females (n = 32) during spring and summer, and on nutritional condition of a subset (n = 9 animal years) of those deer during early winter, using a combination of global positioning system (GPS)-collars, ultrasonography, and palpation scoring. Three deer were monitored during both years of the study, and we considered condition measurements from those deer to be independent based on longitudinal condition data obtained from mule deer in Wyoming (n = 72 pairs of early-winter body condition measurements from female mule deer sampled in ≥2 consecutive years, R2 = 0.008 in a regression of condition in year t + 1 against condition in year t; K. L. Monteith, University of Wyoming, unpublished data). We baited adult female mule deer into wooden panel traps (Rowland et al., 1997) dispersed throughout the study area during mid-November to mid-December, or chemically immobilized them via darting (1–2 mL of the immobilization cocktail BAM: butorphanol, azaperone, and medetomidine; Miller et al., 2009). We hobbled (except during immobilizations, during which we placed deer in sternal recumbency) and blindfolded each deer to minimize stress. When all data were collected we were reversed immobilized deer with an intramuscular injection of 0.5 mL of naltrexone and 2–4 mL of atipamezole. During handling we removed GPS-collars from the previous year (if necessary), replaced them with new collars (model 4400S and 4500S, Lotek Wireless, Newmarket, ON, Canada or VERTEX Plus, Vectronic Aerospace GmbH, Berlin, Germany; Wisdom et al., 1993), measured body mass with an electronic scale (±1 kg), measured chest girth, and quantified nutritional condition using the methods of Cook et al. (2010). We programmed GPS-collars to record a location once every 90 min throughout most of the following year. We used ultrasonography (E.I. Medical Imaging, Ibex, with a 5-MHz linear transducer) to measure subcutaneous rump fat thickness (MAXFAT) and thickness of the bicep and loin muscles to the nearest 1 mm (Bishop et al., 2009; Monteith et al., 2011). In addition, we recorded a condition score via palpation of the sacrosciatic ligament (Cook et al., 2010). We combined condition data with data on body mass to estimate total percent ingesta-free body fat using the equations of Cook et al. (2010).
To quantify the effects of lactation status on nutritional condition of female mule deer in early winter, we monitored timing of parturition and subsequent survival of neonates born to a subset of GPS-collared females that represented ≥25% of the estimated adult female population at Starkey. We recaptured those deer (n = 9 animal years) in January–March, assessed them for pregnancy via ultrasonography, and fitted them with vaginal implant transmitters [VIT; M39/30L, Advanced Telemetry Solutions (ATS), Isanti, MN, United States] to monitor timing of parturition and aide in neonate capture (Bishop et al., 2007; Monteith et al., 2014). We captured neonates the following spring (typically within 48 h of parturition) and fitted them with an expandable very high frequency (VHF) radio-collar with a mortality sensor (M4210; Advanced Telemetry Solution, Isanti, MN, United States). We monitored neonates daily for survival during the first 2 months of life, and weekly thereafter. If mortality occurred, we located the carcass immediately and attempted to identify the cause of death (Walsh, 2016; Jackson, 2019).
Mapping the Nutritional Landscape
During spring (13 May–30 June) and summer (1 July–15 August) of 2016–2017, we conducted intensive vegetation sampling to map the nutritional landscape available to mule deer at Starkey. We used the Integrated Landscape Assessment Project (ILAP; Halofsky et al., 2014) potential vegetation layer to stratify Starkey into the following potential vegetation types (PVTs): xeric grasslands dominated by a few grass and forb species (e.g., onespike oatgrass (Danthonia unispicata), ventenata (Ventenata dubia), and low gumweed (Grindelia nana); ∼16% of the study area); xeric forests characterized by ponderosa pine (Pinus ponderosa; ∼8% of the study area); and mesic forests dominated by grand fir (Abies grandis; ∼31% of the study site), Douglas-fir (Pseudotsuga menziesii; ∼32% of the study site), or grand/subalpine fir (Abies spp.; ∼12% of the study site). We then selected transect locations for sampling mule deer forage using a stratified random design, wherein the number of transects within each PVT was proportional to the relative area of the PVT within Starkey. We also stratified our sampling by season (spring vs. summer) in each year, and transects did not overlap between seasons or years (i.e., sampling was without replacement). Transects were 100 m long and included five 4 × 10 m plots centered on the transect line and spaced at 10-m intervals. Each plot contained two 1-m2 quadrats, located in opposite corners. We sampled quadrats to quantify forage biomass, and plots to quantify nutritional quality of key forage species for mule deer along each transect. We used published (Damiran, 2006; Stewart et al., 2011) and unpublished (R. C. Cook, National Council for Air and Stream Improvement; L.A. Shipley, Washington State University; unpublished data) data on mule deer diets in similar ecosystems to identify key forage species for mule deer at Starkey (i.e., forage plants that are commonly used proportionally greater than their availability (selected) or in proportion to their availability (neutral) by mule deer; Supplementary Appendix A).
We estimated green (i.e., uncured) biomass of forage species along each transect using the clip-and-weigh (CW) method (Butler and Wayne, 2007) and a double sampling scheme (Bonham, 1989). We started by visually estimating percent horizontal cover (Bonham, 1989) of each forage species within each 1-m2 quadrat along a transect. We then selected the two most species-rich quadrats for biomass clipping. We clipped all forage species in those two quadrats at ground level, separated them by plant part (e.g., leaves and inflorescences for graminoids and forbs, and leaves and current annual growth for shrubs) and placed them into paper bags for drying. At the end of each day we placed biomass samples into a forced convection oven to dry at 100°C for 24 h. At the end of each drying period we removed and weighed samples using a Mettler platform scale (±0.1 g). We tallied biomass samples at the end of each season and conducted additional sampling at random locations within the associated PVT when necessary to ensure a minimum species-specific sample size of n = 10. When field sampling was completed, we estimated biomass of forage species in all unclipped quadrats by fitting simple linear regression models (Neter et al., 1996) to the biomass (response variable) and cover (predictor variable) data for each species (Supplementary Appendix B). We fit separate models for each season, and species with <10 paired biomass and cover measurements were grouped with similar species in either the same genus or family.
We quantified nutritional quality of forage along each transect by clipping additional samples within the 4 × 10 m plots. We used visual cover estimates (Bonham, 1989) from each transect to identify the 10 most abundant selected species and the 10 most abundant neutral species (separated by individual species). When necessary we also separated species by plant parts (e.g., stems and leaves of shrubs). We placed nutrition samples into paper bags and dried them at 40° C in a forced convection oven for 24 h; we dried all samples within 24 h of collection to minimize effects of respiration and fermentation. We aggregated nutrition samples at the PVT level within seasons by combining samples across transects for each species. We then ground composited samples in a Wiley Mill (1-mm screen) and analyzed them for crude protein (CP,%), neutral detergent fiber (NDF,%), and acid detergent lignin (ADL,%; Dairy One Forage Lab, Ithaca, NY, United States).
We obtained additional forage samples for analysis of protein-precipitating capacity of condensed tannins in the forage (mg Bovine Serum Albumin precipitate/mg forage) at the junction of the spring and summer seasons in 2017. We collected tannin samples opportunistically from each PVT and stored them in a freezer at −18° C. We subsequently freeze-dried those samples for 24 h, ground them in a Wiley Mill (1-mm screen), and analyzed them for tannin precipitation using the precipitation assay of Martin and Martin (1982) at the Wildlife Habitat Nutrition Laboratory at Washington State University. We were not able to obtain samples of all forage species for tannin analysis, and thus we used published values (Lopez-Perez, 2006; Wagoner, 2011; Ulappa, 2015) to estimate tannin precipitation for species not sampled in 2017. We were unable to obtain field estimates of ash (AIA, %) and gross energy (GE; kJ/g), so we obtained values from the same set of published data. We estimated the dry matter digestibility (DMD; %) using the summative equations of Robbins et al. (1987), which integrated our data on NDF, ADL, BSA precipitate, AIA, GE and tannins. We then calculated digestible energy (DE) content (kJ/g) of each composited forage sample from GE × DMD (Ulappa, 2015).
We used generalized additive models (GAMs; Zuur et al., 2009) to produce spatiotemporally dynamic maps of the nutritional landscape available to mule deer at Starkey during spring (15 May–30 June) and summer (1 July–15 August), 2016–2017 (Supplementary Appendix C). We used mean (averaged across quadrats) total biomass (kg/ha) of selected and neutral forage plants at each transect location as the response variable, and evaluated a suite of different spatial and temporal covariates as predictors of forage biomass. We constructed separate models for each year and season (four models total). We then applied each model to the Starkey landscape during the appropriate season and year to calculate spatiotemporally explicit estimates of predicted forage biomass (i.e., predicted biomass of selected and neutral forage plants) available to mule deer within each 30-m pixel in the study area (Figure 1).
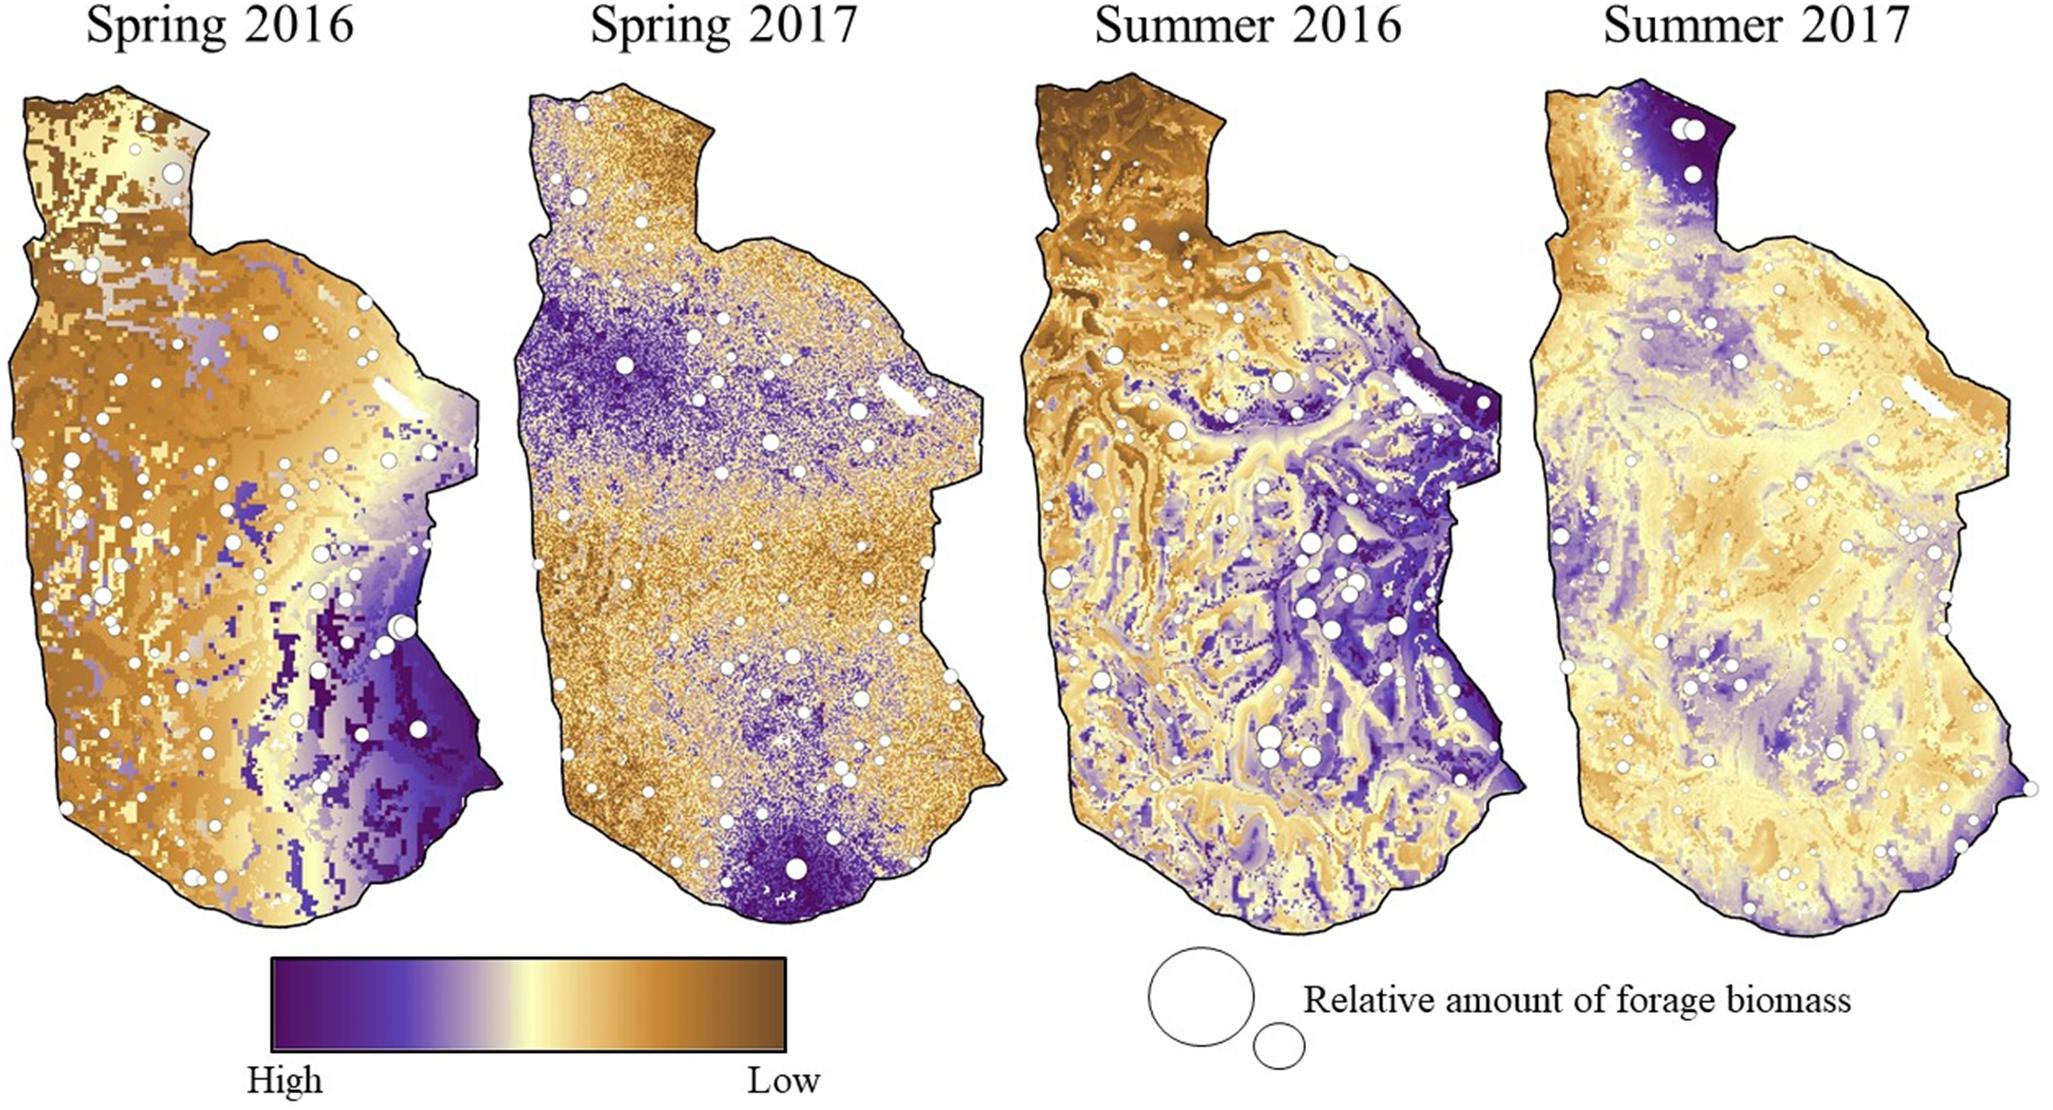
Figure 1. Predicted spatiotemporal variation in the nutritional landscape (biomass of selected and neutral forage plants) available to mule deer during a representative week in mid-spring (29 May–5 June) and mid-summer (15–22 July), 2016 and 2017, at the Starkey Experimental Forest and Range, Oregon, United States.
Selection of the Nutritional Landscape by Mule Deer
We used resource selection functions (RSFs) to quantify strength of selection for the nutritional landscape by mule deer at the 2nd and 3rd orders of selection (Johnson, 1980). At the landscape scale (i.e., 2nd-order selection), we employed a use-availability design wherein GPS locations from individual mule deer (2016: n = 18; 2017: n = 14) represented used locations (coded 1 in our analyses), and randomly generated locations (coded 0 in our analyses; 750 total random locations/week, determined using the methods of Long et al., 2014) served as an index to availability of the nutritional landscape within the Starkey enclosure. To estimate RSFs we fit generalized linear mixed models with a logit link function and binomial error distribution to the used and random locations for mule deer (Gillies et al., 2006; Long et al., 2014). We extracted the model-predicted values of forage biomass on a week-by-week basis to the used and random locations, and we included a random intercept and an uncorrelated random slope (Zuur et al., 2009) for the nutritional landscape (the sole predictor variable), both of which were grouped by individual animal nested within week. This approach allowed us to account for autocorrelation among GPS locations within animals, and to ensure that use and availability of the nutritional landscape were compared at the appropriate time scale (exploratory analyses indicated that a weekly time step was sufficient for capturing changes in forage conditions through time; Long et al., 2014). The random slopes also facilitated subsequent analysis of selection at the individual level. We fit separate RSFs for each year and season (four models), and standardized the nutritional predictor variable prior to model fitting to facilitate direct comparison of coefficients across years and seasons. Statistical significance was inferred based on alpha ≤0.1.
At the home-range scale (i.e., 3rd-order selection) we used a 95% fixed-kernel home-range estimator (Horne et al., 2007) to delineate seasonal home-range boundaries for each individual mule deer within Starkey. We cast random locations within each home range based on its size, and in direct proportion to the point density used at the landscape scale. We then estimated 3rd-order RSFs using methods identical to those described for estimating 2nd-order RSFs. We evaluated the predictive strength of each model using k-fold cross-validation (Boyce et al., 2002). We conducted ten iterations for each model in which the model was fit to 80% of the data (i.e., 80% of the animals in the dataset) and the remaining 20% were held out as test data. In each iteration we grouped random locations from the test data into 10 equal bins based on their predicted probability of use (calculated from the model fit to the training data). We then compared the median predicted value of each bin to the number of actual used locations that fell into that bin using Spearman-rank correlation. We averaged Spearman-rank correlation coefficients (rs) across all 10 iterations as a measure of the predictive strength of each model (Boyce et al., 2002).
As a measure of selection for the nutritional landscape at the individual level we extracted the random slopes for each individual deer and week from both the 2nd- and 3rd-order RSFs. Those conditional slopes represented, for each individual deer, strength of selection for the nutritional landscape relative to the population-level mean during each week of the study (Gillies et al., 2006; Long et al., 2014). We therefore used those conditional parameter estimates in subsequent analyses of the relationship between selection of the nutritional landscape and early-winter condition of individual deer.
Relating Use and Selection of the Nutritional Landscape to Early-Winter Condition of Deer
We used simple linear regression (Neter et al., 1996) to relate use and selection (both 2nd- and 3rd-order selection) of the nutritional landscape during spring and summer to early-winter condition of a subset of collared mule deer (n = 9 animal years). To quantify use of the nutritional landscape by deer we extracted the appropriate model-predicted values of the nutritional landscape (i.e., biomass of selected and neutral forage plants) to each deer’s GPS locations. We chose to use all GPS locations from each deer (as opposed to, for example, nighttime locations only) because deer at Starkey do not exhibit strong diel variation in space-use behavior and may forage throughout the 24-h day (Ager et al., 2003). We then averaged those predicted use values across locations obtained during spring and summer to quantify the degree to which each deer consistently utilized high-quality foraging locations. We fit separate linear regression models for use, 2nd-order selection, and 3rd-order selection (we quantified selection using the conditional parameter estimates from the RSFs as described previously), and in each model early-winter condition (i.e., % ingesta-free body fat) of deer was the response variable. In addition, because of small sample size and the potential for outliers to influence regression results, we performed a jackknife analysis of each regression wherein we iteratively removed one point at a time from each dataset, refit the regression model, and recorded the resulting r2 and P-values. For each jackknife analysis we report the mean r2 and the percentage of regression iterations that produced a positive, statistically significant slope.
Results
Forage Biomass
Mean estimates of forage biomass at sampled locations consistently were higher in spring than in summer across PVTs, but also were highly variable within PVTs (Figure 2). As a result, differences in biomass among PVTs rarely were significant within a season and year (based on overlap of 90% CIs; Figure 2). Models of the nutritional landscape performed considerably better during summer (adjusted R2 = 0.39–0.66) than during spring (adjusted R2 = 0.21–0.38; Table 1), because high-quality forage was more evenly dispersed across the landscape during spring. Top models for all year × season combinations included spatial and temporal smoothing terms, although the best-performing temporal smoother differed among models (Table 1 and Supplementary Appendix D). The only spatial covariate that was retained in all four models was PVT (although at least one metric of topography also was included in all four models), suggesting that the different vegetation types at Starkey were not all equally valuable as foraging habitat for mule deer (Table 1 and Figure 2). Model results also indicated that forage biomass varied among years, with available biomass peaking during spring in 2016 but during early summer in 2017, due to greater snowpack delaying phenology in 2017 (Figure 1).
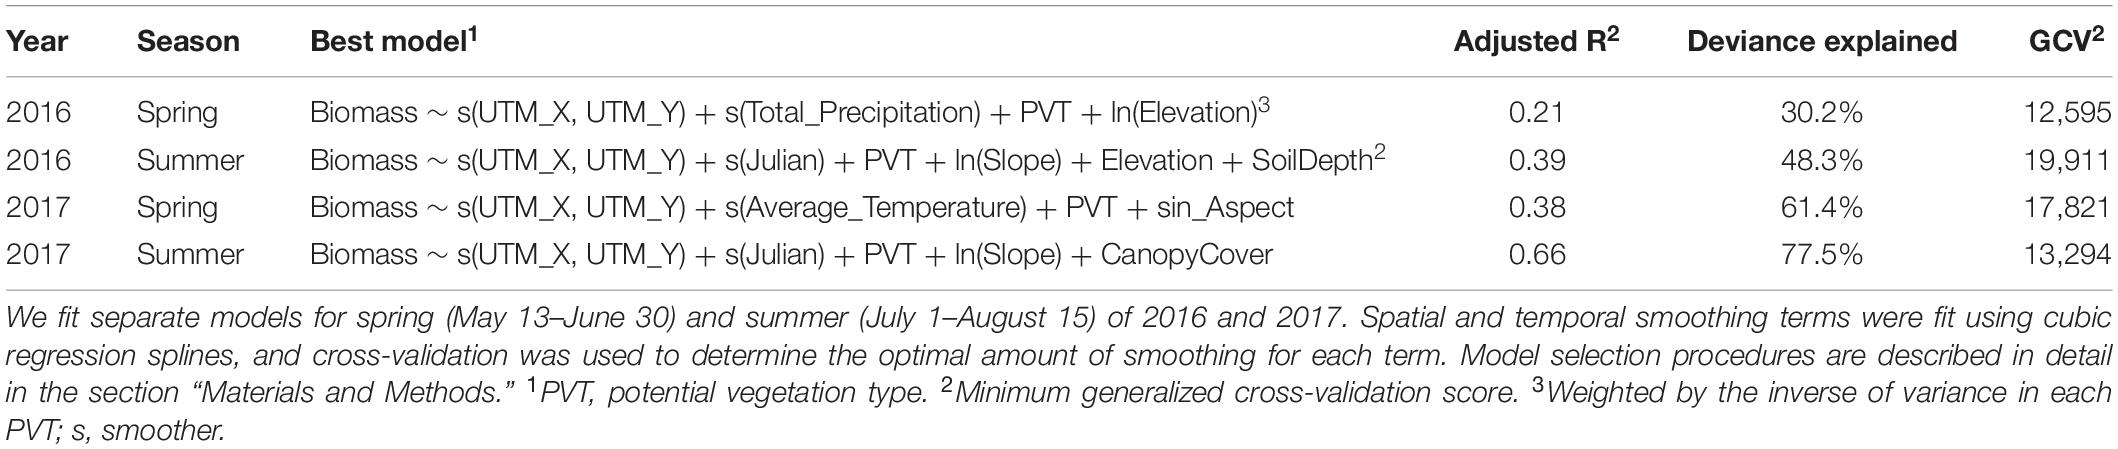
Table 1. Generalized additive models (GAMs) used to predict spatiotemporal variation in the nutritional landscape (i.e., biomass of selected and neutral forage plants) available to mule deer at the Starkey Experimental Forest and Range, Oregon, United States.
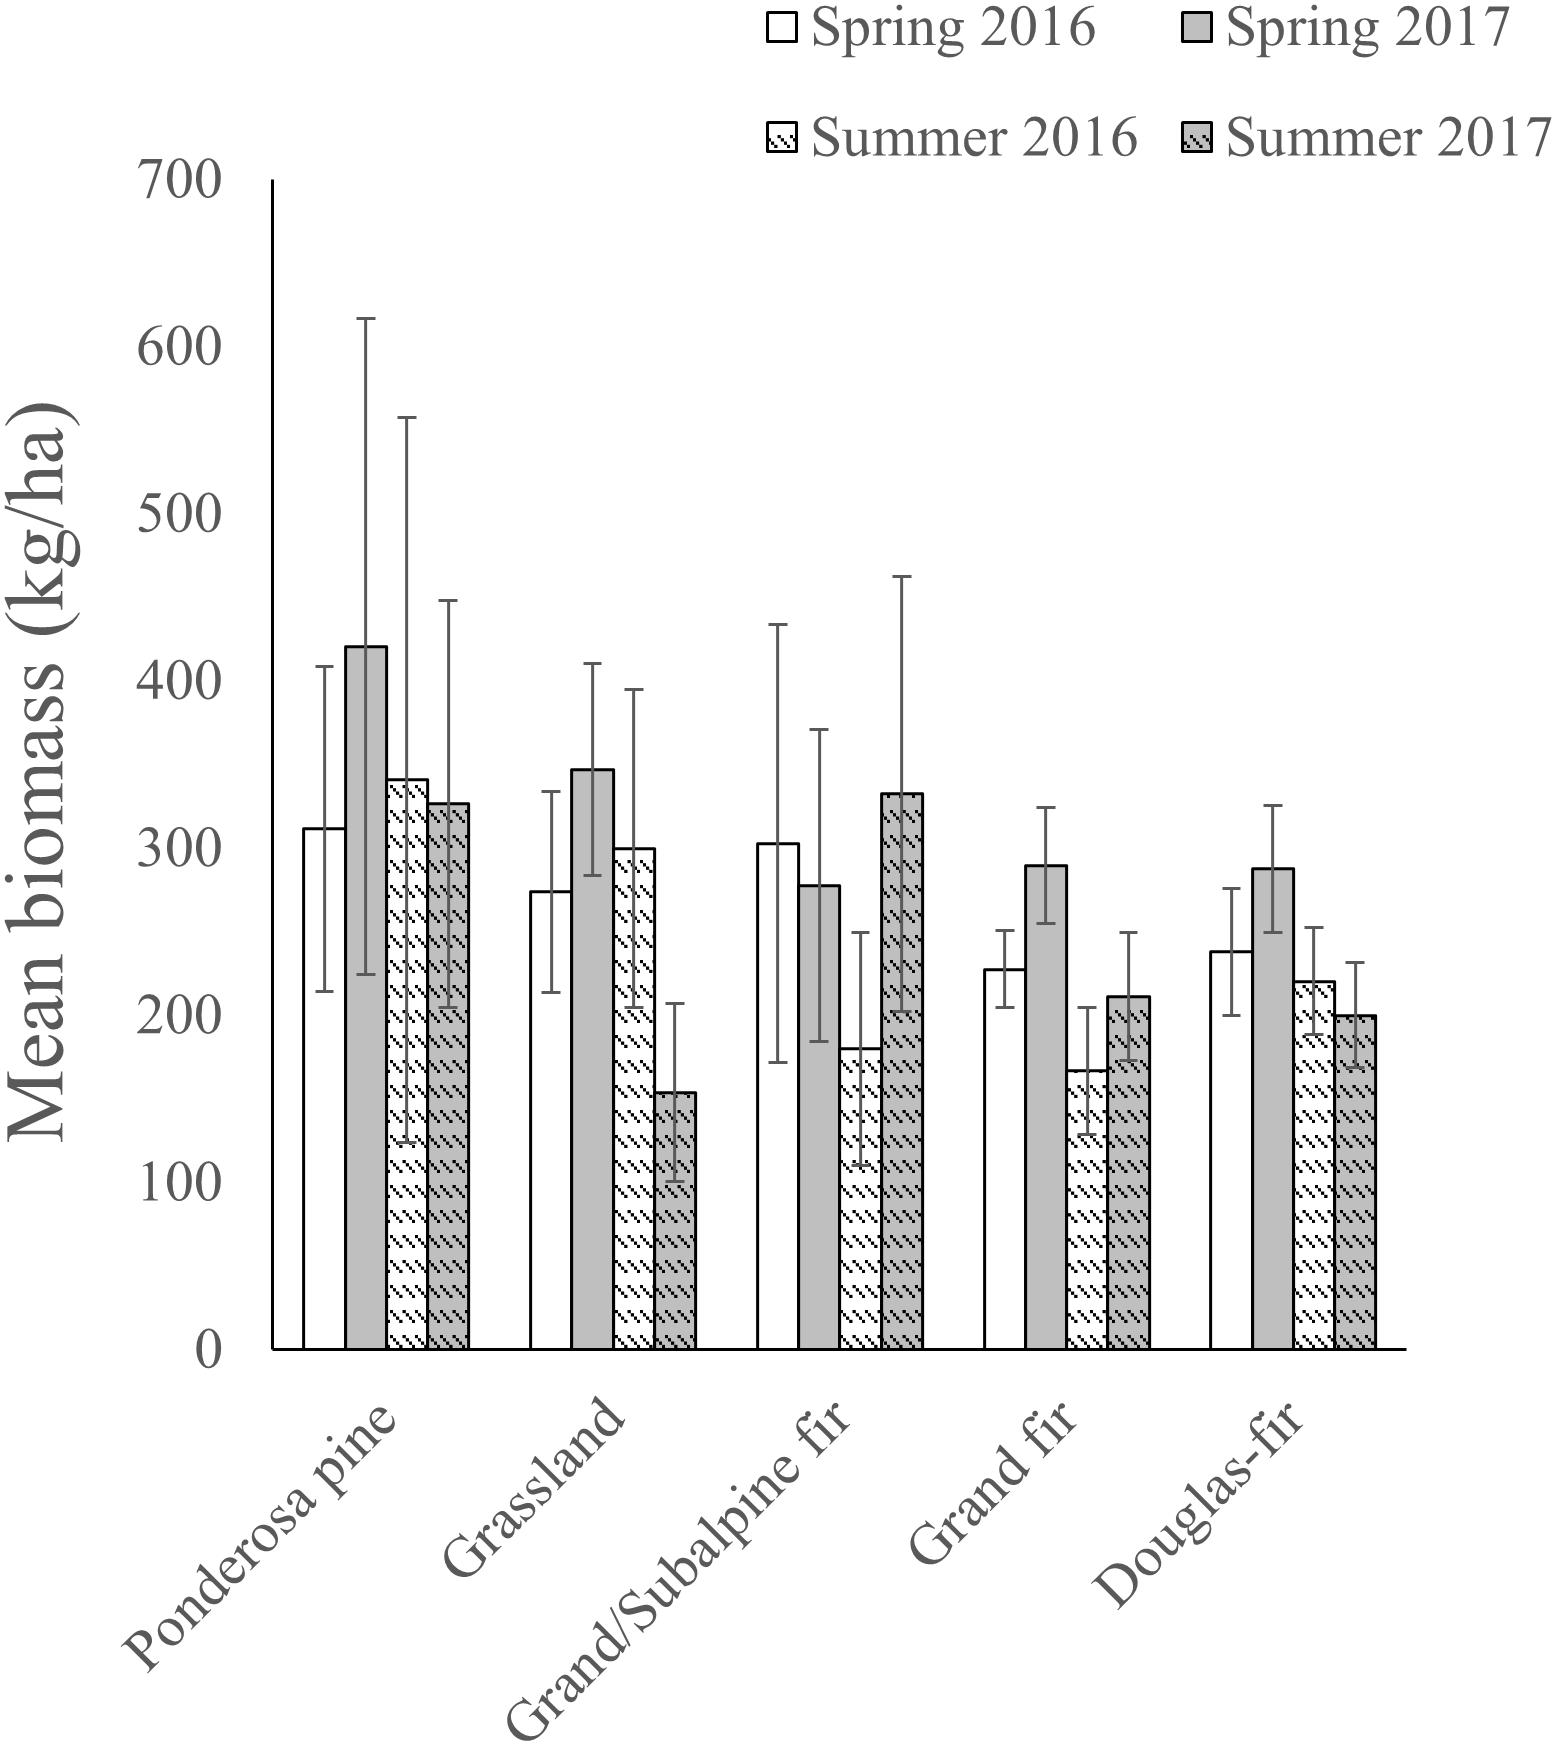
Figure 2. Mean (±90% CI) biomass (kg/ha) of selected and neutral forage plants at transects sampled within each potential vegetation type during spring (13 May–30 June) and summer (1 July–11 August), 2016 and 2017, at the Starkey Experimental Forest and Range, Oregon, United States.
Nutritional Quality
Mean nutritional quality (i.e., CP and DE of selected and neutral forage plants) of forage at sampled transect locations consistently was higher in spring than in summer across PVTs and years (Figure 3). Similar to forage biomass, however, forage quality also was highly variable within PVTs (Figure 3), and thus differences in CP and DE among PVTs generally were not significant (based on overlap of 90% CIs; Figure 3). When averaged across years, CP was higher in dry (i.e., xeric) PVTs than in wet (i.e., mesic) PVTs during spring, but this pattern was reversed during summer ( spring: dry = 11.16 ± 0.50%, wet = 10.85 ± 0.42%; summer: dry = 9.87 ± 0.53%, wet = 9.93 ± 0.44%). In contrast, DE was highest in the dry PVTs during both seasons (spring: dry = 9.83 ± 0.29 kJ/g, wet = 9.64 ± 0.25 kJ/g; summer: dry = 9.11 ± 0.30 kJ/g, wet = 9.05 ± 0.26 kJ/g). Mean CP in forage during spring was higher in 2017 than in 2016 across all PVTs, whereas the opposite was true for mean DE in spring (CP: spring 2017 = 11.18 ± 0.41%, spring 2016 = 10.83 ± 0.51%; DE: spring 2017 = 9.51 ± 0.25 kJ/g, spring 2016 = 9.96 ± 0.27 kJ/g). During summer, however, both CP and DE were higher in 2016 than in 2017 (CP: summer 2017 = 9.81 ± 0.45%, summer 2016 = 9.98 ± 0.50%; DE: summer 2017 = 8.89 ± 0.27 kJ/g, summer 2016 = 9.27 ± 0.28 kJ/g).
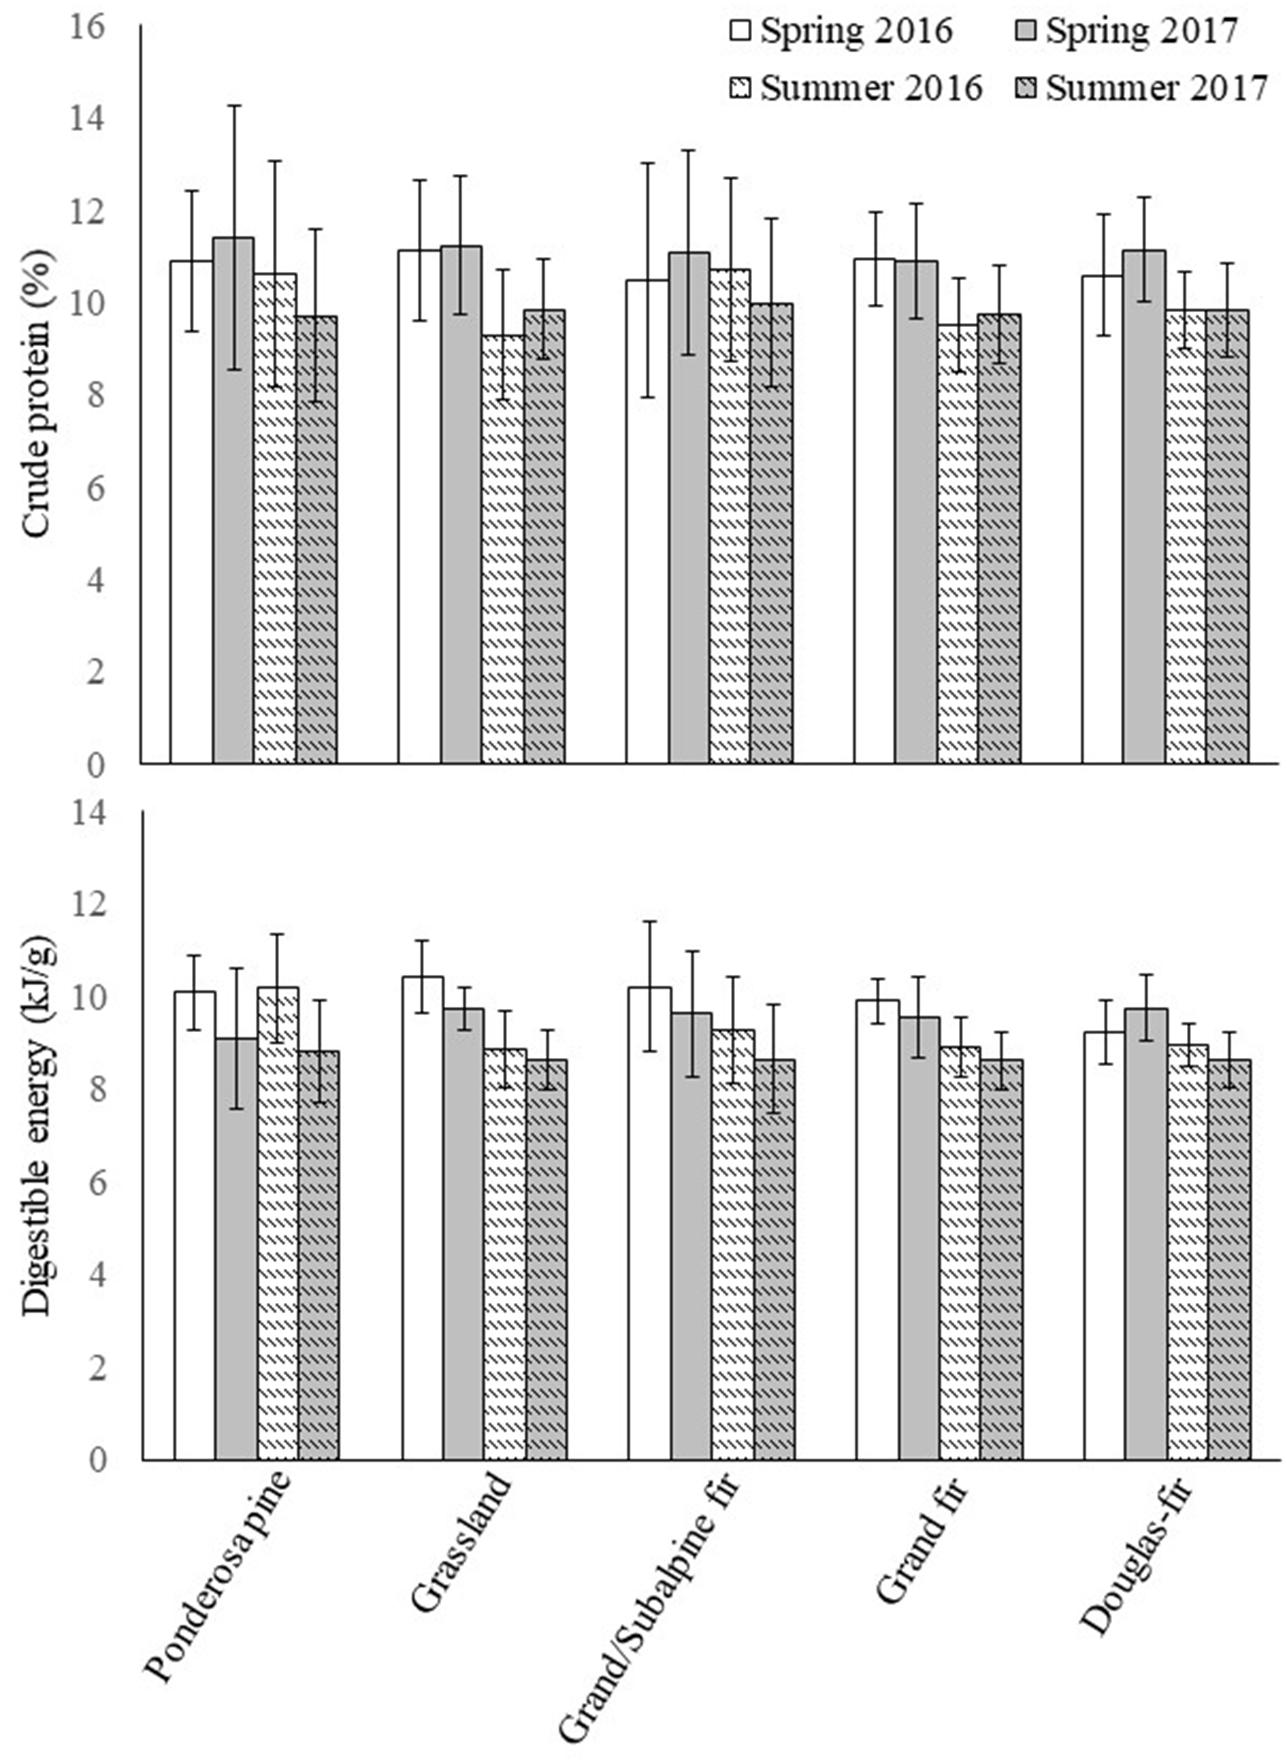
Figure 3. Mean (±90% CI) values of crude protein (%) and digestible energy (kJ/g) in selected and neutral forage plants combined at transects sampled within each potential vegetation type during spring (13 May–30 June) and summer (1 July–11 August), 2016 and 2017, at the Starkey Experimental Forest and Range, Oregon, United States.
Selection of the Nutritional Landscape by Mule Deer
At the landscape scale (i.e., 2nd-order selection), mule deer showed significant selection for the nutritional landscape in summer during both years (summer 2016 β = 1.29, P < 0.001; summer 2017 β = 0.98, P < 0.001; Figure 4). In contrast, mule deer were either indifferent to or avoided areas of high forage biomass during spring of both years (spring 2016 β = 0.08, P = 0.25; spring 2017 β = −0.16, P = 0.02; Figure 4). K-fold cross validation results also reflected this seasonal pattern; Spearman rank correlation coefficients averaged −0.01 and 0.47 across 10 iterations during spring of 2016 and 2017, respectively, whereas those coefficients averaged 0.73 and 0.63 during summers of those two years. These results suggest that deer selected for the nutritional landscape more strongly during summer, when availability of preferred forages declined.
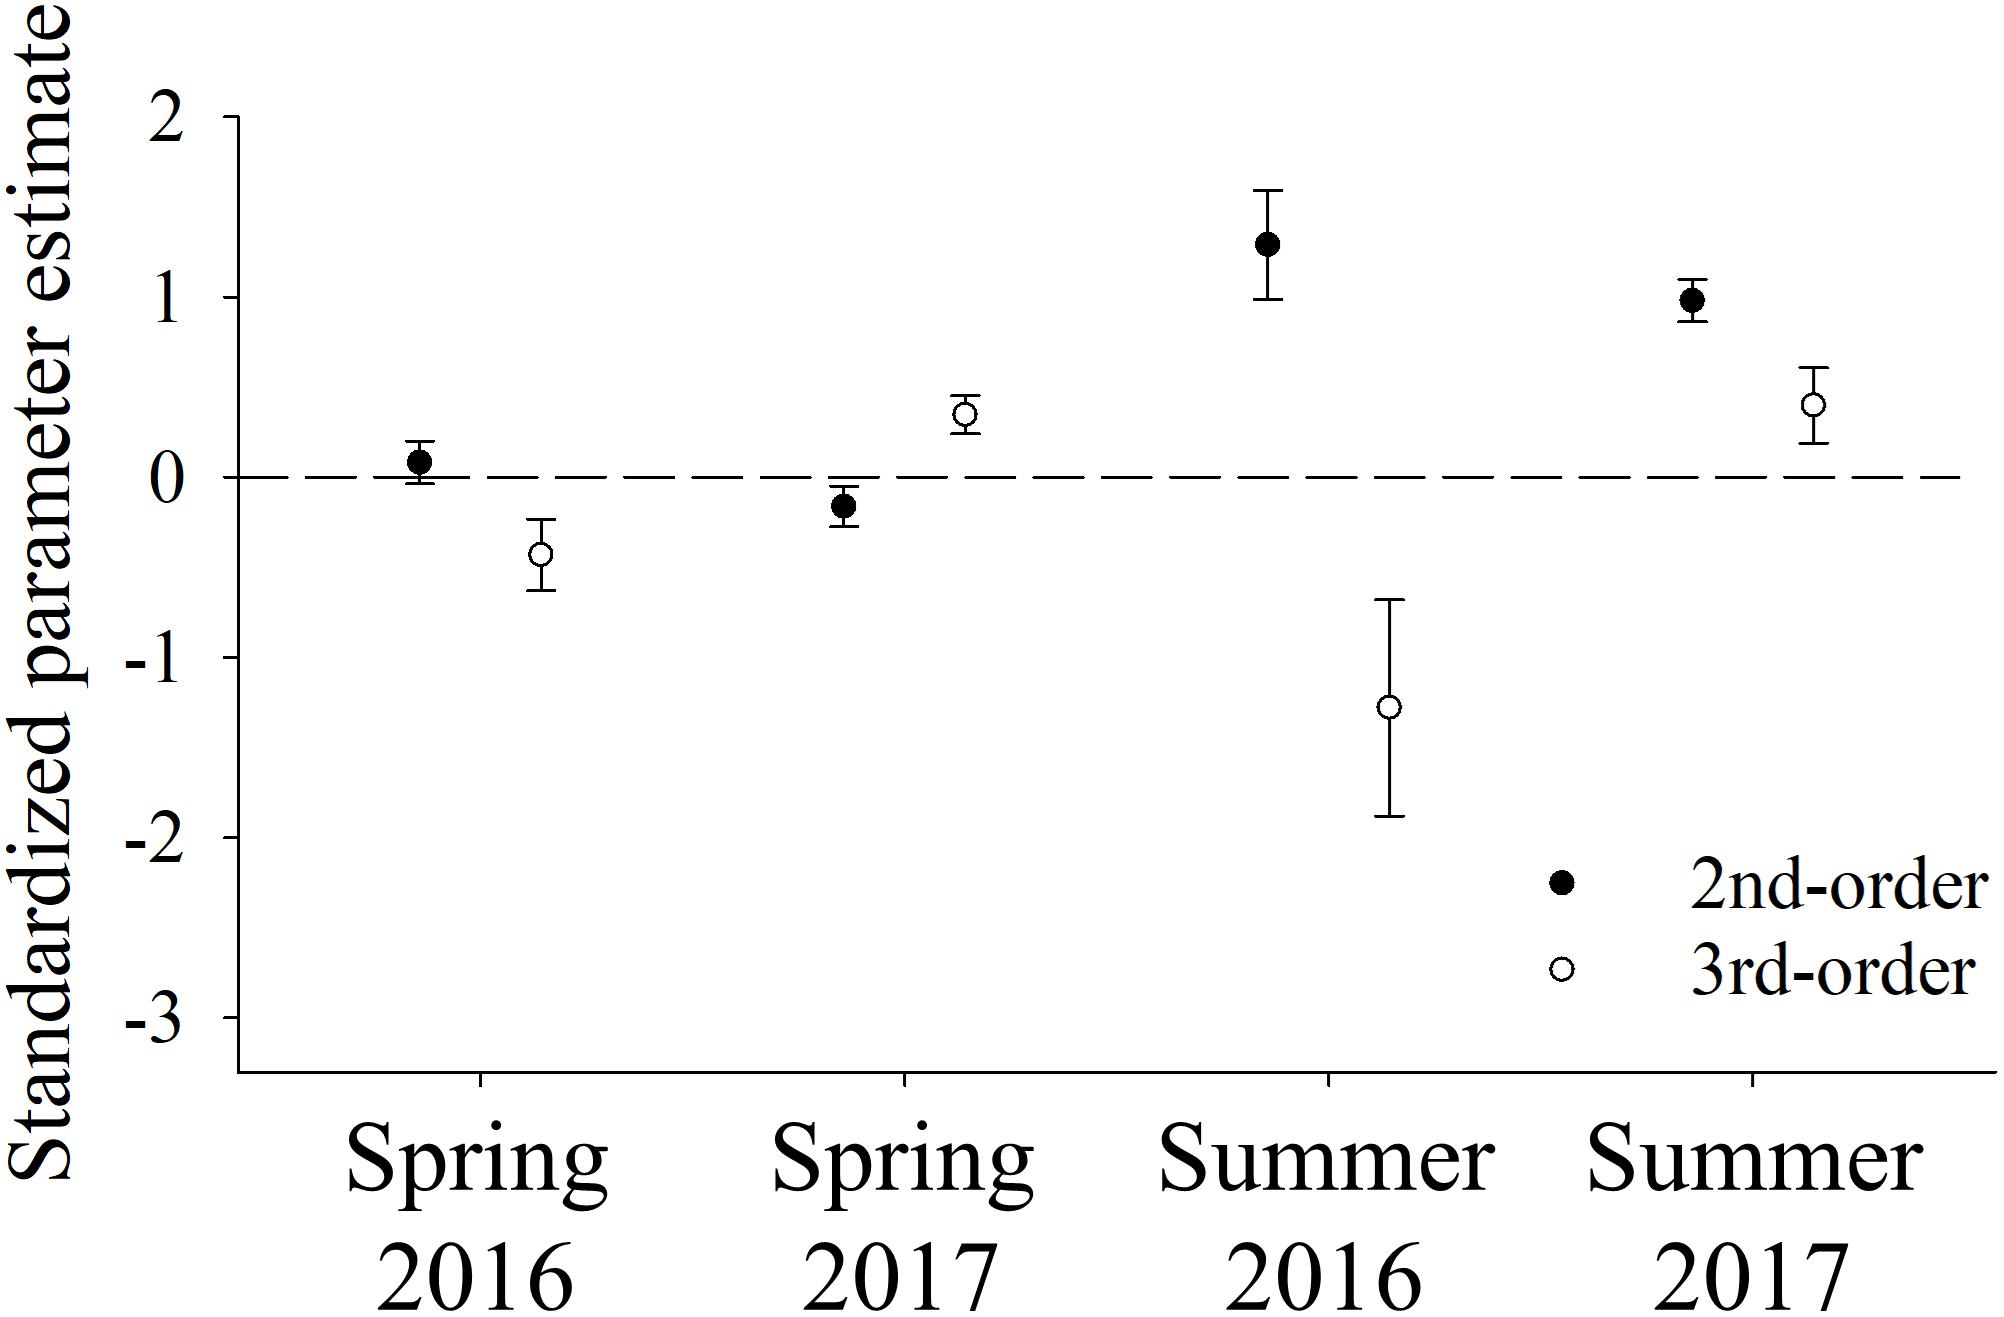
Figure 4. Standardized parameter estimates (β) and associated 90% confidence intervals from 2nd- and 3rd-order resource selection functions that quantified the influence of forage biomass (i.e., biomass of selected and neutral forage plants) on space use by female mule deer during spring (13 May–30 June) and summer (1 July–11 August), 2016 (n = 18) and 2017 (n = 13), at the Starkey Experimental Forest and Range, Oregon, United States.
Patterns of selection were less consistent at the home-range scale. During 2017 mule deer showed significant selection for the nutritional landscape within their home ranges during both spring and summer (spring 2017 β = 0.34, P < 0.001; summer 2017 β = 0.40, P = 0.002; Figure 4). In contrast, deer did not show selection for the nutritional landscape within their home ranges in either season during 2016 (spring 2016 β = −0.43, P < 0.001; summer 2016 β = −1.28, P < 0.001; Figure 4). Moreover, none of the 3rd-order models were highly predictive of patterns of space use by deer within their home ranges; Spearman rank correlation coefficients averaged 0.18 and 0.32 across 10 iterations during springs, and 0.29 and 0.27 during summers of 2016 and 2017, respectively. In addition, during the one season/year in which deer showed significant selection for the nutritional landscape at both scales (summer 2017), the standardized coefficient was more than twice as large in the 2nd-order model than in the 3rd-order model (Figure 4). Together, these results suggest that biomass of preferred forages had a greater influence on space-use decisions by mule deer at the landscape scale than at the home-range scale.
At the individual level, use of the nutritional landscape by deer during spring and summer was a significant predictor of early-winter condition (P = 0.074, r2 = 0.39; Figure 5). Every 1-kg/ha increase in mean forage biomass at locations used by deer was predicted to produce a 2.84% increase in ingesta-free body fat in early winter (Figure 5). Mean r2 from the jackknife analysis was 0.40, and 89% of regression iterations produced a positive, statistically significant relationship between use of the nutritional landscape and early-winter condition of deer. In contrast to use, selection of the nutritional landscape by individual deer was not significantly related to early-winter condition at either spatial scale (Figure 5), and this result held across all iterations of the jackknife analyses for selection. Duration of lactation did not significantly affect early-winter condition of deer in multiple regression models that included either use or selection of the nutritional landscape, likely because all but three of the female deer in our early-winter sample lost their fawns within 4 weeks of parturition, and thus our data encompassed minimal variation in lactation costs.
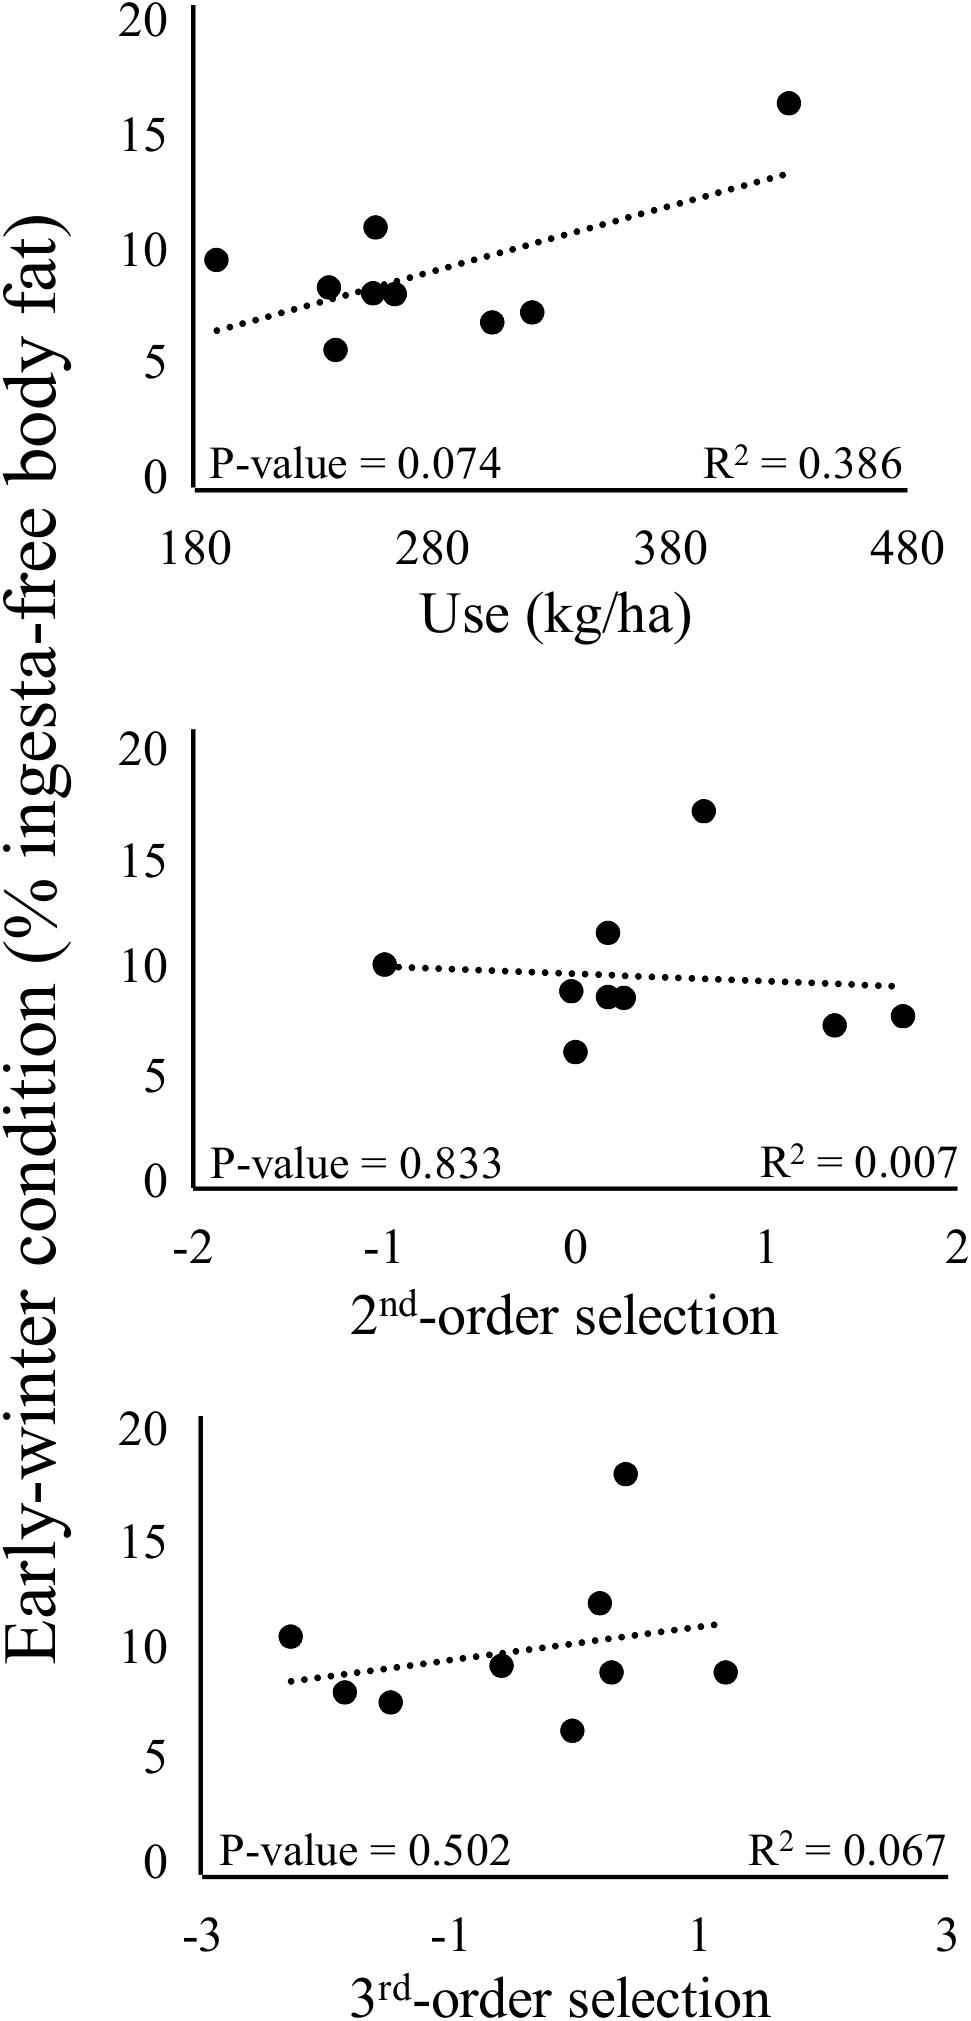
Figure 5. Simple linear regression models of the effects of use (mean predicted biomass of selected and neutral forage plants at all locations used by each individual deer; first panel), 2nd-order selection (individual-level coefficients from landscape-scale mixed-effects RSFs; second panel), and 3rd-order selection (individual-level coefficients from home-range scale mixed-effects RSFs; third panel) of the nutritional landscape on early-winter nutritional condition (% ingesta-free body fat) of female mule deer (n = 9 animal years) at the Starkey Experimental Forest and Range, Oregon, United States.
Mean (± SE)% ingesta-free body fat of female mule deer in early winter was 8.48% ± 0.52 (Table 2). This estimate of condition is below the threshold for maintaining positive population growth (i.e., λ > 1) in mule deer reported by Monteith et al. (2014). Although our sample size for quantifying early-winter condition of deer was relatively small (n = 9 animal years), it likely represented ≥25% of the adult female population at Starkey), which has been declining for more than a decade.
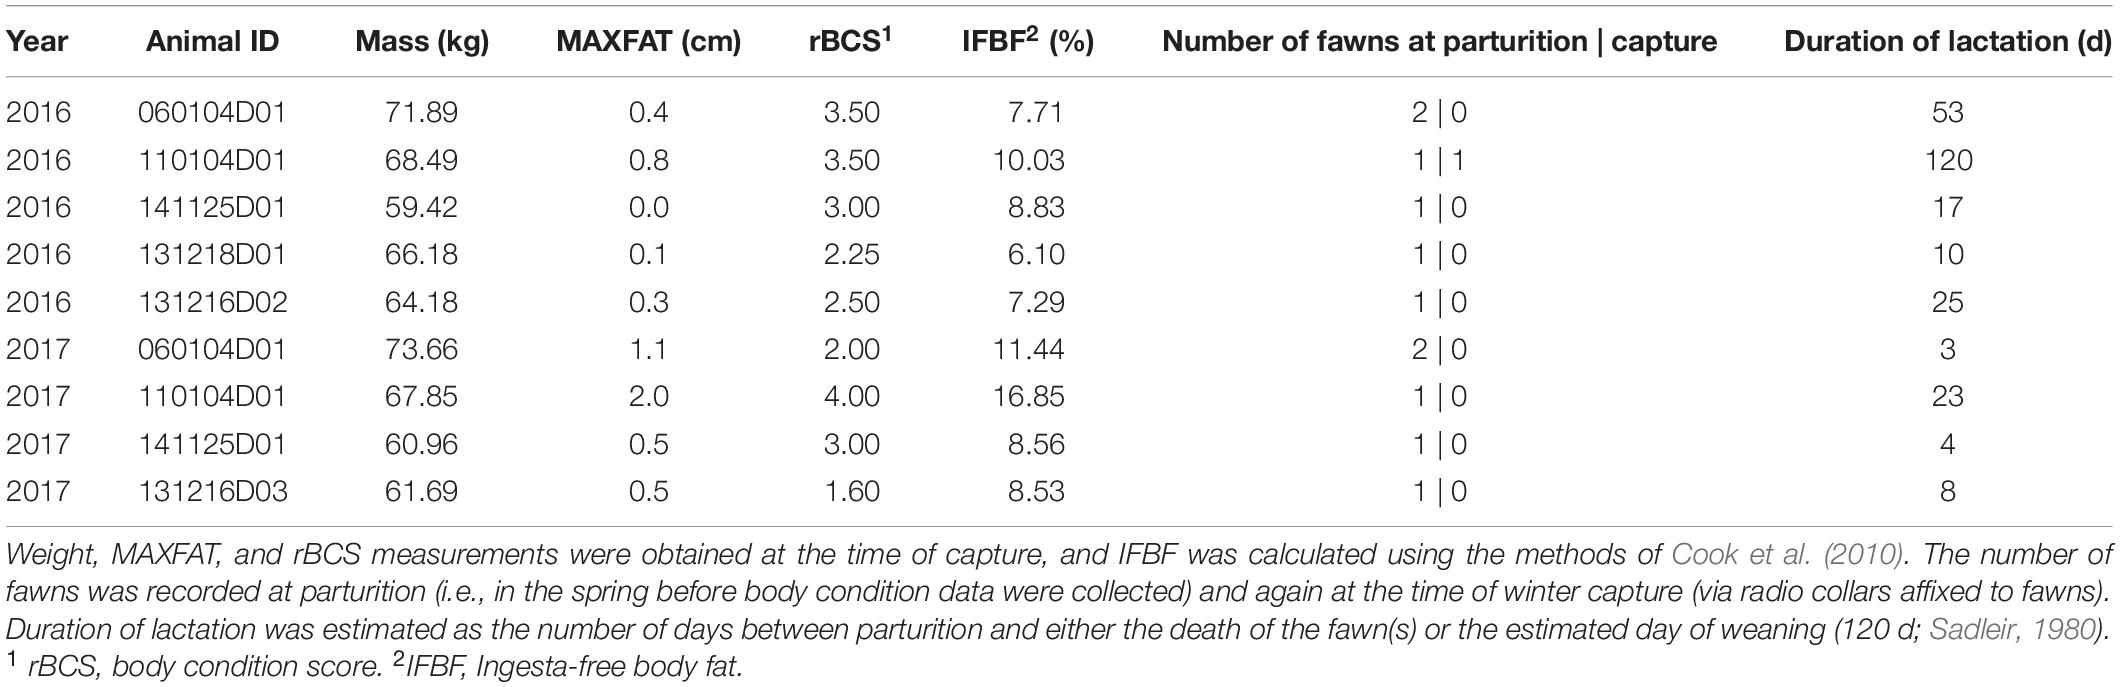
Table 2. Body mass and condition metrics for female mule deer recaptured in early winter 2016 (November 22–December 18; n = 5) and 2017 (1–6 December; n = 4) at the Starkey Experimental Forest and Range, Oregon, United States.
Discussion
Mule deer consistently showed stronger selection for high forage biomass at the landscape scale (2nd-order selection) than at the home-range scale (3rd-order selection), suggesting that deer chose to locate their home ranges in areas that provided ready access to high-quality forage, possibly limiting the need to strongly select those vegetation communities within their home ranges (Bowyer and Kie, 2006). This observation provides support for our first hypothesis (i.e., that selection for forage would be strongest at the largest scale) and highlights the importance of evaluating patterns of selection at multiple spatial scales (Long et al., 2008; Laforge et al., 2015; McGarigal et al., 2016). Because space-use decisions at smaller scales are constrained by choices made at larger scales (Bowyer and Kie, 2006; Mayor et al., 2009), and foraging decisions are scale-dependent (Senft et al., 1987), natural selection may favor behavioral strategies in which environmental covariates with the greatest effect on fitness (e.g., variables that influence energy acquisition or vulnerability to predation) are selected at the largest scales (Bowyer and Kie, 2006). In combination with our measurements of early-winter condition of deer, the scale-dependent pattern of selection for the nutritional landscape we documented at Starkey suggests the potential for nutritional limitation during summer.
Our second hypothesis, that mule deer would show stronger selection for the nutritional landscape during summer than spring, also was supported. Strength of selection for the nutritional landscape by mule deer (quantified by standardized parameter estimates from the resource selection models, and by results of k-fold cross validation) was considerably greater in summer than spring during both 2016 and 2017 (Figure 4). This seasonal change in behavior was due to the greater availability and more even dispersion of forage during spring. These conditions obviated the need for mule deer to select specific foraging areas during spring at the broad spatial scales we analyzed, because high-quality forage was readily available throughout the study area. Moreover, summer is a critical period for capital-breeding ungulates like mule deer because they must replenish energy and protein reserves lost over winter while meeting the demands of lactation (Therrien et al., 2008; Bårdsen et al., 2010; Tollefson et al., 2010; Bårdsen and Tveraa, 2012), even as availability of high-quality forage declines (Cook et al., 2004; Monteith et al., 2013). This suggests the potential for strong evolutionary pressure to forage more selectively during summer to maximize energy intake in the face of a senescent forage base.
Our third hypothesis, that strength of selection (i.e., use relative to availability) for the nutritional landscape at the landscape scale would be more strongly correlated with early-winter condition of individual deer than strength of selection at the home-range scale, was not supported. Instead, strength of selection for the nutritional landscape by individual deer was unrelated to early-winter condition at both scales of analysis. This facet of our individual-level results highlights several important distinctions between analyses of resource use and resource selection. Analyses of resource selection have a long and diverse history of application in wildlife ecology (McLoughlin et al., 2010; McGarigal et al., 2016). Yet, one persistent criticism of studies that rely on RSFs is a failure to produce evidence in support of their most fundamental assumption; that patterns of resource selection have fitness consequences (Morrison, 2001; Manly et al., 2002). Although this failure commonly results from the many logistical challenges of directly relating complex behaviors to hard-to-measure components of fitness, our results suggest that even when it is possible to collect the necessary data, analyses of use may sometimes prove more useful than analyses of selection per se (Millspaugh et al., 2006). Even our relatively coarse measure of forage use by deer, which assumed that deer that used better foraging areas did, in fact, consume more high-quality forage, was sufficient to capture a significant relationship between behavior and condition at the individual level. When those measures of use were adjusted for availability in the context of a complex statistical model (RSF), however, we were no longer able to detect that relationship, despite the fact that strong selection for the nutritional landscape was evident at the population level, especially during summer and at the landscape scale. There are several potential explanations for this result. For example, available locations were randomly cast at both the landscape and home-range scales, which could have led to the inclusion of locations in the available sample that were not accessible to deer for either physical (e.g., topography) or behavioral (e.g., aversion behavior) reasons. Alternatively, despite increased availability of quality forage, individuals may switch their selection to other environmental features when necessary (i.e., select for vegetation communities that provide increased cover for thermoregulation or predator avoidance; Bjørneraas et al., 2012). Patterns of resource selection also may be density-dependent, although this seems unlikely at Starkey given the extremely low density of deer (0.65 female deer/km2, including yearlings). Regardless, we suggest that future efforts to understand the fitness consequences of ungulate space-use behavior focus more strongly on quantifying what resources are actually used by animals in the context of testable, mechanistic hypotheses about how different patterns of use should influence nutrition and energy balance of individuals.
Our analysis of how individual-level responses to the nutritional landscape affected early-winter condition of mule deer was based on a relatively small sample size with correspondingly low statistical power. Nevertheless, the mule deer population at Starkey was similarly small, and our sample likely represented ≥25% of the adult female population. Moreover, despite our small sample size we detected a statistically significant relationship between use of the nutritional landscape and early-winter condition of female deer, suggesting that our test of this relationship was not underpowered (Rowland et al., 2018). Individuals that used, on average, areas that provided greater biomass of preferred forage plants during spring and summer entered winter in better condition. These results support our fourth hypothesis, and add to a small but growing body of literature linking space-use behaviors of ungulates to important correlates of fitness (Long et al., 2016). Similarly, our results highlight the value of nutritional approaches to understanding the fitness consequences of behavior, and in particular the measurement of nutritional condition, which integrates a suite of complex responses of ungulates to their environment (Parker et al., 2009; Cook et al., 2010; Monteith et al., 2013; Long et al., 2016).
Our study suggests that mule deer in northeastern Oregon may be nutritionally limited despite showing significant selection for the nutritional landscape at the population level; mean nutritional condition of mule deer in early winter was well below the estimated threshold for maintaining positive population growth (Monteith et al., 2014). These results refute our fifth hypothesis (i.e., that condition of deer would be high enough to promote population growth), and have important implications for mule deer in general, which have been declining throughout much of their range for several decades (Johnson et al., 2000; Manning, 2010; Bergman et al., 2015). One hypothesis for explaining poor condition of female mule deer in our study is that even the highest-quality forage available at Starkey is insufficient for supporting positive population growth. Critical thresholds of CP and DE for a female mule deer at peak lactation (with one fawn) are 12% CP and 11.5 kJ/g DE (Parker et al., 1999; Hanley et al., 2012). After peak lactation those thresholds drop to 8% CP and 9.5 kJ/g DE (Hanley et al., 1992, 2012; Parker et al., 1999). Maximum mean values of CP and DE available in PVTs at Starkey during spring were 10.97 and 9.73 kJ/g, respectively. During summer, maximum mean CP and DE were 9.90 and 8.94 kJ/g, respectively, suggesting that the ability of female mule deer to support lactation during summer could be limited by either CP or DE (although mule deer have considerable ability to locate the highest-quality forage available when mean quality is low; Ulappa, 2015; Hull, 2018). Nutritional limitation of this nature is one plausible explanation for our observation that few mule deer in our study successfully recruited a fawn, or even reared a fawn for more than 8 weeks. Total precipitation and spring snow-water-equivalent were both below long-term averages during 2016 and 2017. As a result, the limiting effects of low forage quality on mule deer reproduction may have been more pronounced during our study. In addition, the second winter of our study was characterized by later-than-normal snowfall, which delayed the onset of spring greenup. Variation in the timing, amount, and spatial distribution of precipitation can have marked effects on the distribution and quality of forage (Figure 1), and on ungulate vital rates and population dynamics (Hurley et al., 2014). This underscores the importance of mechanistic, nutritional approaches to explaining variation in performance of ungulate populations.
An alternative hypothesis for explaining nutritional limitation in our study area is that despite showing significant selection for the nutritional landscape at the population level, mule deer at Starkey faced tradeoffs between nutrition and other factors with potential to affect fitness. Previous researchers have hypothesized that inadequate nutrition may result indirectly from avoidance of competitors or predators (Cook et al., 2007). Interference competition with elk has been hypothesized to be a leading cause of mule deer population declines (Lindzey et al., 1997; Manning, 2010). Interference competition often produces strong patterns of avoidance or displacement that can dictate species’ distributions, patterns of resource exploitation, and relative abundances (Johnson et al., 2000; Berger and Gese, 2007), and numerous studies have reported that mule deer avoid elk in space and time (Stewart et al., 2002; Ager et al., 2003; Manning, 2010). Direct and indirect effects of predators on mule deer behavior also may have contributed to the decline of this species (Salwasser, 1979; Lindzey et al., 1997). Mountain lions are a primary predator of mule deer across much of their range in North America (Ballard et al., 2001; Forrester and Wittmer, 2013) and rely on concealment to successfully kill prey (Laundré et al., 2014). This hunting mode limits the ability of mule deer to directly detect mountain lions, thus increasing their reliance on indirect cues of predation risk (Preisser et al., 2007; Schmitz et al., 2008). The result is a landscape of fear in which the perception of predation risk strongly influences patterns of space use (Brown et al., 1999; Kauffman et al., 2007; Laundré et al., 2014). During our study, Starkey supported the highest-density elk population in Oregon and abundant mountain lions, and thus strong potential existed for behaviorally mediated effects of competitors, predators, or both on nutritional condition of mule deer. Future research designed to shed light on the nutritional mechanisms by which predators and competitors indirectly influence fitness of mule deer would provide valuable insight into the complex causes of their range-wide decline.
Our results suggest that limited availability, whether absolute or functional (i.e., resulting from avoidance of predators or competitors), of high-quality forage during summer has resulted in poor early-winter condition of deer, which likely has contributed to the decline of mule deer at Starkey, despite those deer showing selection for the nutritional landscape during summer. More broadly, our work highlights the value of integrating the mechanistic principles of nutritional ecology with the theory and concepts that currently define our understanding of resource use and selection. We propose that an increased focus on understanding the nutritional consequences of individual resource-use behaviors could motivate new lines of inquiry and provide important and novel insights into the fitness consequences and evolutionary underpinnings of the diverse behavioral strategies exhibited by ungulates.
Data Availability Statement
The datasets generated for this study are available on request to the corresponding author.
Ethics Statement
The animal study was reviewed and approved by the University of Idaho Institutional Animal Care and Use Committee.
Author Contributions
JM, DC, MW, and RL conceived and designed the study. JM, JR, NJ, and KS collected the field data. JM, LS, and RL conducted the nutritional analyses. JM, TL, and RL conducted analyses of space use. JM and RL wrote the manuscript with input from all authors.
Funding
This research was funded by Federal Aid in Wildlife Restoration Grants, the Oregon Department of Fish and Wildlife and the U.S. Forest Service, Pacific Northwest Research Station.
Conflict of Interest
The authors declare that the research was conducted in the absence of any commercial or financial relationships that could be construed as a potential conflict of interest.
Acknowledgments
This research would not have been possible without the support provided by the larger collaborative Starkey Project research group. We are indebted to B. L. Dick, R. Kennedy, D. Rea, P. K. Coe, J. M. Hafer, and B. J. Naylor for data structure and preparation from the United States Forest Service, Pacific Northwest Research Station, E. K. Strand from the University of Idaho, P. K. Coe from the Oregon Department of Fish and Wildlife, R. C. Cook from NCASI, and the many technicians and volunteers.
Supplementary Material
The Supplementary Material for this article can be found online at: https://www.frontiersin.org/articles/10.3389/fevo.2020.00098/full#supplementary-material
References
Ager, A. A., Johnson, B. K., Kern, J. W., and Kie, J. G. (2003). Daily and seasonal movements and habitat use by female Rocky Mountain elk and mule deer. J. Mammal. 84, 1076–1088. doi: 10.1644/bba-020
Ballard, W. B., Lutz, D., Keegan, T. W., Carpenter, L. H., and deVos, J. C. Jr. (2001). Deer-predator relationships: a review of recent Noth American studies with emphasis on mule deer and black-tailed deer. Wildl. Soc. Bull. 29, 99–115.
Bårdsen, B. J., and Tveraa, T. (2012). Density-dependence vs. density-independence – linking reproductive allocation to population abundance and vegetation greenness. J. Anim. Ecol. 81, 364–376. doi: 10.1111/j.1365-2656.2011.01913.x
Bårdsen, B. J., Tveraa, T., Fauchald, P., and Langeland, K. (2010). Observation evidence of risk-sensitive reproductive allocation in a long-lived mammal. Oecologia 162, 627–639. doi: 10.1007/s00442-009-1537-0
Barten, N. L., Bowyer, R. T., and Jenkins, K. J. (2001). Habitat use by female caribou: tradeoffs associated with parturition. J. Wildl. Manage. 65, 77–92.
Berger, J. (1991). Pregnancy incentives, predation constraints and habitat shifts: experimental and field evidence for wild bighorn sheep. Anim. Behav. 41, 61–77. doi: 10.1016/s0003-3472(05)80503-2
Berger, K. M., and Gese, E. M. (2007). Does interference competition with wolves limit the distribution and abundance of coyotes? J. Anim. Ecol. 76, 1075–1085. doi: 10.1111/j.1365-2656.2007.01287.x
Bergman, E. J., Doherty, P. F. Jr., White, G. C., and Freddy, D. J. (2015). Habitat and herbivore density: response of mule deer to habitat management. J. Wildl. Manage. 79, 60–68. doi: 10.1002/jwmg.801
Bishop, C. J., Freddy, D. J., White, G. C., Stepheson, T. R., Wolfe, L. L., and Watkins, B. E. (2007). Using vaginal implant transmitters to aid in capture of mule deer neonates. J. Wildl. Manage. 71, 945–954. doi: 10.2193/2006-123
Bishop, C. J., White, G. C., Freddy, D. J., Watkins, B. E., and Stepheson, T. R. (2009). Effect of enhanced nutrition on mule deer population rate of change. Wildl. Monogr. 172, 1–28. doi: 10.2193/2008-107
Bjørneraas, K., Herfindal, I., Solberg, E. J., Sæther, B. E., van Moorter, B., and Rolandsen, C. M. (2012). Habitat quality influences population distribution, individual space use and functional responses in habitat selection by a larger herbivore. Oecologia 168, 231–243. doi: 10.1007/s00442-011-2072-3
Bonham, C. D. (1989). Measurements for Terrestrial Vegetation. New York, NY: John Wiley and Sons, 338.
Bowyer, R. T., and Kie, J. G. (2006). Effects of scale on interpreting life-history characteristics of ungulates and carnivores. Divers. Distribut. 12, 244–257. doi: 10.1111/j.1366-9516.2006.00247.x
Boyce, M. S., Vemier, P. R., Nielsen, S. E., and Schmiegelow, F. K. A. (2002). Evaluating resource selection functions. Ecol. Modell. 157, 281–300. doi: 10.1016/s0304-3800(02)00200-4
Brown, J. S., Laundré, J. W., and Gurung, M. (1999). The ecology of fear: Optimal foraging, game theory, and trophic interactions. J. Mammal. 80, 385–399. doi: 10.2307/1383287
Butler, B. W., and Wayne, C. (2007). “The fire environment – innovations, management, and policy; conference proceedings,” in Proceedings of the RMRS-P-46CD, Destin, FL (Fort Collins, CO: U.S. Department of Agriculture, Forest Service, Rocky Mountain Research Station), 662.
Cook, J. G., Johnson, B. K., Cook, R. C., Riggs, R. A., Delcurto, T., Bryant, L. D., et al. (2004). Effects of summer-autumn nutrition and parturition date on reproduction and survival of elk. Wildl. Monogr. 155, 1–61.
Cook, R. C., Cook, J. G., Stephenson, T. R., Myers, W. L., Mccorquodale, S. M., Vales, D. J., et al. (2010). Revisions of rump fat and body scoring indices for deer, elk and moose. J. Wildl. Manage. 74, 880–896. doi: 10.2193/2009-031
Cook, R. C., Stephenson, T. R., Myers, W. L., Cook, J. G., and Shipley, L. (2007). Validating predictive models of nutritional condition for mule deer. J. Wildl. Manage. 71, 1934–1943. doi: 10.2193/2006-262
Côté, S. D., and Festa-Bianchet, M. (2001). Birthdate, mass and survival in mountain goat kids: effects of maternal characteristics and forage quality. Oecologia 127, 230–238. doi: 10.1007/s004420000584
Dall, S. R. X., Houston, A. I., and McNamara, J. M. (2004). The behavioural ecology of personality: consistent individual differences from an adaptive perspective. Ecol. Lett. 7, 734–739. doi: 10.1111/j.1461-0248.2004.00618.x
Damiran, D. (2006). Influence of Previous Cattle and Elk Grazing on the Subsequent Diet Quality and Nutrient Intake Rate of Cattle, Deer, and Elk Grazing Late-Summer Mixed-Conifer Rangelands. Ph.D. Dissertation., Oregon State University, Corvallis.
Downs, C. J., Stewart, K. M., and Dick, B. L. (2015). Investment in constitutive immune function by North American elk experimentally maintained at two different population densities. PLoS ONE 10:e0125586. doi: 10.1371/journal.pone.0125586
Festa-Bianchet, M., Jorgenson, J. T., Bérubé, C. H., Portier, C., and Wishart, W. D. (1997). Body mass and survival of bighorn sheep. Can. J. Zool. 75, 1372–1379. doi: 10.1139/z97-763
Forrester, T. D., and Wittmer, H. U. (2013). A review of the population dynamics of mule deer and black-tailed deer Odocoileus hemionus in North America. Mamm. Rev. 43, 292–308. doi: 10.1111/mam.12002
Gaillard, J. M., Festa-Bianchet, M., Yoccoz, N. G., Loison, A., and Toigo, C. (2000). Temporal variation in fitness components and population dynamics of large herbivores. Annu. Rev. Ecol. Systemat. 31, 367–393. doi: 10.1146/annurev.ecolsys.31.1.367
Gillies, C. S., Hebblewhite, M., Nielson, S. E., Krawchuk, M. A., Aldridge, C. L., Frair, J. L., et al. (2006). Application of random effects to the study of resource selection by animals. J. Anim. Ecol. 75, 887–898. doi: 10.1111/j.1365-2656.2006.01106.x
Halofsky, J. E., Creutzburg, M. K., and Hemstrom, M. A. (2014). Integrating Social, Economic, and Ecological Values Across Large Landscapes. Gen.Tech. Rep. PNW-GTR-896. Portland, OR: U.S. Department of Agriculture, Forest Service, Pacific Northwest Research Station, 206.
Hanley, T. A., Robbins, C. T., Hagerman, A. E., and MacArthur, C. (1992). Predicting digestible protein and digestible dry matter in tannin-containing forages consumed by ruminants. Ecology 73, 537–541. doi: 10.2307/1940759
Hanley, T. A., Spalinger, D. E., Mock, K. J., Weaver, O. L., and Harris, G. M. (2012). Forage Resource Evaluation System for Habitat – Deer: an Interactive Deer-Habitat Model: General Technical Report PNW-GTR-858. Portland, OR: USDA Forest Service, Pacific Northwest Research Station.
Horne, J. S., Garton, E. O., and Sager-Fradkin, K. A. (2007). Correcting home-range models for observation bias. J. Wildl. Manage. 71, 996–1001. doi: 10.2193/2005-678
Huey, R. B., Hertz, P. E., and Sinervo, B. (2003). Behavioral drive versus behavioral inertia in evolution: a null model approach. Am. Nat. 161, 357–366. doi: 10.1086/346135
Hull, I. T. (2018). Influences of Fuel Reduction Treatments on the Nutritional Ecology of Deer in Northeastern Washington. Masters thesis., Washington State University, Pullman.
Hurley, M. A., Hebblewhite, M., Gaillard, J.-M., Dray, S., Taylor, K. A., Smith, W. K., et al. (2014). Functional analysis of normalized difference vegetation index curves reveals overwinter mule deer survival is driven by both spring and autumn phenology. Philos. Trans. R. Soc. B 369:20130196. doi: 10.1098/rstb.2013.0196
Jackson, N. J. (2019). Effects of Enhanced Winter Nutrition and Climatic Variation on Population Performance of A Large Herbivore. Masters Thesis., University of Nevada-Reno, Reno.
Johnson, B. L., Kern, J. W., Wisdom, M. J., Findholt, S. L., and Kie, J. G. (2000). Resource selection and spatial separation of mule deer and elk during spring. J. Wildl. Manage. 64, 685–697.
Johnson, D. H. (1980). The comparison of usage and availability measurements for evaluating resource preference. Ecology 61, 65–71. doi: 10.2307/1937156
Kauffman, M. J., Varley, N., Smith, D. W., Stahler, D. R., MacNulty, D. R., and Boyce, M. S. (2007). Landscape heterogeneity shapes predation in a newly restored predator-prey system. Ecol. Lett. 10, 690–700. doi: 10.1111/j.1461-0248.2007.01059.x
Laforge, M. P., Vander Wall, E., Brook, R. K., Bayne, E. M., and McLoughlin, P. D. (2015). Process-focused, multi-grain resource selection functions. Ecol. Modell. 305, 10–21. doi: 10.1016/j.ecolmodel.2015.03.003
Laundré, J. W., Hernández, L., Medina, P. L., Campanella, A., López-Portillo, J., González-Romero, A., et al. (2014). The landscape of fear: the missing link to understand top-down and bottom-up controls of prey abundance? Ecology 95, 1141–1152. doi: 10.1890/13-1083.1
Lele, S. R., Merrill, E. H., Keim, J., and Boyce, M. S. (2013). Selection, use, choice and occupancy: clarifying concepts in resource selection studies. J. Anim. Ecol. 82, 1183–1191. doi: 10.1111/1365-2656.12141
Lindzey, F. G., Hepworth, W. G., Mattson, T. A., and Reeve, A. F. (1997). Potential for Competitive Interactions Between Mule Deer and Elk in the Western United States and Canada. Laramie, WY: Wyoming Cooperative Wildlife Research Unite.
Long, R. A., Bowyer, R. T., Porter, W. P., Mathewson, P., Monteith, K. L., Findholt, S. L., et al. (2016). Linking habitat selection to fitness-related traits in herbivores: the role of the energy landscape. Oecologia 181, 709–720. doi: 10.1007/s00442-016-3604-7
Long, R. A., Bowyer, R. T., Porter, W. P., Mathewson, P., Monteith, K. L., and Kie, J. G. (2014). Behavior and nutritional condition buffer a large-bodied endotherm against direct and indirect effects of climate. Ecol. Monogr. 84, 513–532. doi: 10.1890/13-1273.1
Long, R. A., Rachlow, J. T., and Kie, J. G. (2008). Effects of season and scale on response of elk and mule deer to habitat manipulation. J. Wildl. Manage. 72, 1133–1142. doi: 10.2193/2007-337
Lopez-Perez, E. (2006). Natural Selenium and Planted Forages: Effects on Mule Deer and Elk in Washington. Ph.D. Dissertation., Washington State University, Pullman.
Manly, B. F. J., McDonald, L. L., Thomas, D. L., MacDonald, T. L., and Erickson, W. P. (2002). Resource Selection by Animals. Statistical Design and Analysis for Field Studies. London: Kluwer Academic Publisher.
Manning, J. A. (2010). Population Dynamics of Rocky Mountain Elk and Mule Deer: Competition, Habitat Selection, Wolf Predation, and Predictions Under Climate Change. Ph.D. Dissertation., University of Idaho, Moscow.
Martin, J. S., and Martin, M. M. (1982). Tannin assays in ecological studies: lack of correlation between phenolics, proanthocyanidins and protein-precipitating constituents in mature foliage of six oak species. Oecologia 54, 205–211. doi: 10.1007/bf00378394
Mayor, S. J., Schneider, D. C., Schaefer, J. A., and Mahoney, S. P. (2009). Habitat selection at multiple scales. Écoscience 16, 238–247. doi: 10.2980/16-2-3238
McGarigal, K., Wan, H. Y., Zeller, K. A., Timm, B. C., and Cushman, S. A. (2016). Multi-scale habitat selection modelling: a review and outlook. Landsc. Ecol. 31, 1161–1175. doi: 10.1007/s10980-016-0374-x
McLoughlin, P. D., Morris, D. W., Fortin, D., Vander Wal, E., and Contasti, A. L. (2010). Considering ecological dynamics in resources selection functions. J. Anim. Ecol. 79, 4–12. doi: 10.1111/j.1365-2656.2009.01613.x
Miller, B. F., Osborn, D. A., Lance, W. R., Howze, M. B., Warren, R. J., and Miller, K. V. (2009). Butorphanol-azaperone-medetomidine for immobilization of captive white-tailed deer. J. Wildl. Dis. 45, 457–467. doi: 10.7589/0090-3558-45.2.457
Millspaugh, J. J., Nielson, R. M., McDonald, L., Marzluff, J. M., Gitzen, R. A., Rittenhouse, C. D., et al. (2006). Analysis of resource selection using utilization distributions. J. Wildl. Manage. 70, 384–395. doi: 10.2193/0022-541x(2006)70%5B384:aorsuu%5D2.0.co;2
Monteith, K. L., Bleich, V. C., Stephenson, T. R., Pierce, B. M., Conner, M. M., Kie, J. G., et al. (2014). Life-History characteristics of mule deer: effects of nutrition in a variable environment. Wildl. Monogr. 186, 1–56.
Monteith, K. L., Bleich, V. C., Stephenson, T. R., Pierce, B. M., Conner, M. M., Klaver, R. W., et al. (2011). Timing of seasonal migration in mule deer: effects of climate, plant phenology, and life-history characteristics. Ecosphere 2:art47. doi: 10.1890/es10-00096.1
Monteith, K. L., Stephenson, T. R., Bleich, V. C., Conner, M. M., Pierce, B. M., and Bowyer, R. T. (2013). Risk-sensitive allocation in seasonal dynamics of fat and protein reserves in a long-lived mammal. J. Anim. Ecol. 82, 377–388. doi: 10.1111/1365-2656.12016
Montgomery, R. A., Vucetich, J. A., Peterson, R. O., Roloff, G. J., and Millenbah, K. F. (2013). The influence of winter severity, predation and senescence on moose habitat use. J. Anim. Ecol. 82, 301–309. doi: 10.1111/1365-2656.12000
Morrison, M. L. (2001). A proposed research emphasis to overcome the limits of wildlife-habitat relationship studies. J. Wildl. Manage. 65, 613–623.
Neter, J., Kutner, M. H., Nachtsheim, C. J., and Wasserman, W. (1996). Applied Linear Statistical Models, 4th Edn. Boston: McGraw-Hill.
Parker, K. L., Barboza, P. S., and Gillingham, M. P. (2009). Nutrition integrates environmental responses of ungulates. Funct. Ecol. 23, 57–69. doi: 10.1111/j.1365-2435.2009.01528.x
Parker, K. L., Gillingham, M. P., Hanley, T. A., and Robbins, C. T. (1999). Energy and protein balance of free-ranging black-tailed deer in a natural forest environment. Wildl. Monogr. 143, 1–18.
Preisser, E. L., Orrock, J. L., and Schmitz, O. J. (2007). Predator hunting mode and habitat domain alter nonconsumptive effects in predator-prey interactions. Ecology 88, 2744–2751. doi: 10.1890/07-0260.1
Pretorius, Y., de Boer, F. W., van der Waal, C., de Knegt, H. J., Grant, R. C., Knox, N. M., et al. (2011). Soil nutrient status determines how elephant utilize trees and shape environments. J. Anim. Ecol. 80, 875–883. doi: 10.1111/j.1365-2656.2011.01819.x
Robbins, C. T., Mole, S., Hagerman, A. E., and Hanley, T. A. (1987). Role of tannins in defending plants against ruminants: reduction in dry matter digestion? Ecology 68, 1606–1615. doi: 10.2307/1939852
Rowland, M. M., Bryant, L. D., Johnson, B. K., Noyes, J. H., Wisdom, M. J., and Thomas, J. W. (1997). The Starkey Project History, Facilities, and Data Collection Methods for Ungulate Research: Technical Report PNW-GTR-396. Estacada, OR: United States Department of Agriculture Forest Service.
Rowland, M. M., Wisdom, M. J., Nielson, R. M., Cook, J. G., Cook, R. C., Johnson, B. K., et al. (2018). Modeling elk nutrition and habitat use in western Oregon and Washington. Wildl. Monogr. 199, 1–69. doi: 10.1002/wmon.1033
Salwasser, H. (1979). The Ecology and Management of the Devil’s Garden Interstate Deer Herd and its Range. Dissertation., Berkeley, CA: University of California, Berkeley.
Schmitz, O. J., Grabowski, J. H., Peckarsky, B. L., Preisser, E. L., Trussell, G. C., and Vonesh, J. R. (2008). From individuals to ecosystem function: toward an integration of evolutionary and ecosystem ecology. Ecology 89, 2436–2445. doi: 10.1890/07-1030.1
Senft, R. L., Coughenour, M. B., Bailey, D. W., Rittenhouse, L. R., Sala, O. E., and Swift, D. M. (1987). Large herbivore foraging and ecological hierarchies. BioScience 37, 789–795+798–799.
Stamps, J., and Groothuis, T. G. G. (2010). The development of animal personality: relevance, concepts and perspectives. Biol. Rev. 85, 301–325. doi: 10.1111/j.1469-185x.2009.00103.x
Stewart, K. M., Bowyer, R. T., Dick, B. L., and Kie, J. G. (2011). Effects of density dependence on diet composition of North America Elk Cervus elaphus and Mule Deer Odocoileus hemionus: an experimental manipulation. Wildl. Biol. 17, 417–430. doi: 10.2981/10-122
Stewart, K. M., Bowyer, T. R., Kie, J. G., Cimon, N. J., and Johnson, B. K. (2002). Temporospatial distributions of elk, mule deer, and cattle: resource partitioning and competitive displacement. J. Mammal. 83, 229–244. doi: 10.1093/jmammal/83.1.229
Therrien, J. F., Côté, S. D., Festa-Bianchet, M., and Ouellet, J. P. (2008). Maternal care in white-tailed deer: trade-off between maintenance and reproduction under food restriction. Anim. Behav. 75, 235–243. doi: 10.1016/j.anbehav.2007.04.030
Tollefson, T. N., Shipley, L. A., Myers, W. L., Keisler, D. H., and Dasgupta, N. (2010). Influence of summer and autumn nutrition on body condition and reproduction in lactating mule deer. J. Wildl. Manage. 74, 974–986. doi: 10.2193/2008-529
Ulappa, A. C. (2015). Using Foraging Dynamics to Answer Landscape Management Questions: The Nutritional Ecology of Black-Tailed Deer. Ph.D. Dissertation., Pullman: Washington State University.
van Beest, F. M., and Milner, J. M. (2013). Behavioural responses to the thermal conditions affect seasonal mass change in a heat-sensitive northern ungulate. PLoS ONE 8:e65972. doi: 10.1371/journal.pone.0065972
Wagoner, S. J. (2011). The Effects of Spring Cattle Grazing on the Nutritional Ecology of Mule Deer (Odocoileus hemionus) in eastern Washington. Ph.D. Dissertation., Pullman: Washington State University.
Walsh, D. R. (2016). Birth Site Selection and Neonate Survival of Mule Deer in the Blue Mountains of Oregon. Masters Thesis., University of Nevada-Reno, Reno.
White, R. G. (1983). Foraging patterns and their multiplier effects on productivity of northern ungulates. Oikos 40, 377–384.
Wisdom, M. G., Cook, J. G., Rowland, M. M., and Noyes, J. H. (1993). Protocols for Care and Handling of Deer and Elk at the Starkey Experimental Forest and Range: General Technical Report PNW-GTR-311. Portland, OR: U.S. Forest Service.
Keywords: crude protein, digestible energy, forage biomass, mule deer, nutritional condition, Odocoileus hemionus, Oregon, resource selection function
Citation: Merems JL, Shipley LA, Levi T, Ruprecht J, Clark DA, Wisdom MJ, Jackson NJ, Stewart KM and Long RA (2020) Nutritional-Landscape Models Link Habitat Use to Condition of Mule Deer (Odocoileus hemionus). Front. Ecol. Evol. 8:98. doi: 10.3389/fevo.2020.00098
Received: 02 December 2019; Accepted: 26 March 2020;
Published: 21 April 2020.
Edited by:
Paul Richard Krausman, The University of Arizona, United StatesReviewed by:
Mark Hebblewhite, University of Montana, United StatesPerry S. Barboza, Texas A&M University, United States
Copyright © 2020 Merems, Shipley, Levi, Ruprecht, Clark, Wisdom, Jackson, Stewart and Long. This is an open-access article distributed under the terms of the Creative Commons Attribution License (CC BY). The use, distribution or reproduction in other forums is permitted, provided the original author(s) and the copyright owner(s) are credited and that the original publication in this journal is cited, in accordance with accepted academic practice. No use, distribution or reproduction is permitted which does not comply with these terms.
*Correspondence: Ryan A. Long, cmFsb25nQHVpZGFoby5lZHU=