 Dorothy Borowy
 Christopher M. Swan
- Geography and Environmental Systems Department, University of Maryland, Baltimore County, Baltimore, MD, United States
Mounting evidence indicates that the inclusion of intraspecific trait variability (ITV) can strengthen the signal of trait-environment relationships, as well as provide insights into the eco-evolutionary strategies that allow species to establish and persist in different environments. Such information is particularly valuable in urban systems where unique environmental conditions impose strong filtering effects on resident species and where, despite such pressures, high proportions of non-native species persist. In an effort to elucidate functional trait patterns of an urban species pool, we experimentally assessed the effect of soil on trait patterns of 56 plant species collected as seeds from vacant land in Baltimore City, MD, United States. We assessed the relative importance of explained trait variation at different ecological levels by decomposing the variance of six measured traits into three levels: within-species (ITV), between-species (BTV), and across functional groups (FGTV). We then compared functional responses – classified by differences in mean and variance patterns of trait values – across species, traits, and functional groups. Mean trait values varied in response to species and soil (urban vs. potting soil) for all traits, except root ash-free dry mass (AFDM) for soil. Variance decomposition of the species factor into each level showed that variance patterns for species were trait-specific, however, ITV explained a substantial proportion of the total variance for the majority of study traits. When accounting for mean and variance trait patterns between soil types, we found that species with specialized strategies (i.e., C4 photosynthesis and legumes) exhibited functional responses consistent with preadaptation, as defined by no change in the mean or the variance of trait values between soil types, for all traits. Native species showed higher proportions of trait divergence, as defined by shifts in mean trait values between soil types, but not change in variance, relative to introduced species, which showed higher proportions of preadaptation for all traits except specific leaf area (SLA). Species exhibiting trait constriction, or no shift in the mean but a significant change in the variance between soil types, consistently showed decreased variance in urban soil, which supports the idea that urban soils impose strong filtering effects that constrain species trait values. Overall, our study indicates that accounting for ITV, and how it relates to general functional responses associated with changes in the mean and variance of trait values, can provide a clearer understanding of the eco-evolutionary dynamics of plant species in urban environments.
Introduction
Longstanding theories in evolutionary biology underscore the importance of phenotypic variation for evolutionary processes (Darwin, 1868; Wright, 1931). Although this knowledge embodies a core facet of the natural sciences, the concept of variability largely remains implicit in ecology, and its effects are seldom considered or explored outside of evolutionary studies. Functional ecology, for example, has developed under the tacit assumption that trait differences among co-occurring species (i.e., between-species trait variation; BTV) or, in a few cases, groups of functionally similar species (i.e., functional group trait variation; FGTV) are more important for inferring the causes and consequences of species coexistence and biodiversity patterns than within-species or intraspecific trait variation (ITV) (McGill et al., 2006; Bolnick et al., 2011). This assumption has been dually promoted through methodological and quantitative techniques, such as the use of global databases and functional diversity metrics, which currently operate on the mathematical basis of mean field theory – the study of mean patterns without explicit consideration of the variance – and thus do not account for ITV in community-based analyses (Violle et al., 2012). In fact, evidence for the hierarchical structure of community assembly processes stems from approaches that relied on average trait values estimated for species or whole communities (e.g., Clark et al., 2012; de Bello et al., 2013).
Consequently, several recent reviews have argued that intraspecific trait patterns afford more consideration in ecology, as they can inform focal topics regarding species coexistence, environmental filtering, invasion, and community resistance and resilience to disturbance (Calloway et al., 2003; Bolnick et al., 2011; Violle et al., 2012 and references therein). An experimental study of specific leaf area (SLA) in sapling communities in Brazil found that although BTV – measured as community-weighted mean (CWM) values – explained the most variance in SLA (63%), accounting for intraspecific variation in trait values (37% variance explained) reinforced patterns in mean values and substantially improved the predictability of trait responses along a canopy openness gradient (Carlucci et al., 2015). Jung et al. (2010) also found that incorporating ITV into community analyses strengthened the signal of environmental filtering effects and niche differentiation; although, the relative influence of ITV was trait-dependent. These results not only highlight the general importance of ITV in community assembly, but they also show that functional trait patterns are dependent upon the study system, species, and traits measured (Auger and Shipley, 2013). Expanding our conceptual and quantitative view of functional traits in ways that incorporate intraspecific responses in both the mean and the variance of expressed trait values may, therefore, identify key evolutionary strategies for species survival in different environments, while also helping to advance the theoretical foundation of ecology.
Consideration of intraspecific functional trait responses is particularly relevant in urban systems, where human-mediated changes directly influence eco-evolutionary dynamics of inhabiting species. Several studies have already shown that urban environmental conditions can impose strong selection pressures that induce phenotypic changes in urban populations of different taxa; for example, seed morphology (Cheptou et al., 2008) and heavy metal tolerance (Pollard, 1980) in two common urban plant species [Crepis sancta (L.) Bornm. and Plantago lanceolata L., respectively]; wing and beak shape in European blackcap birds (Sylvia atricapilla) (Rolshausen et al., 2009); and limb-length in urban-dwelling populations of anole lizards (Anolis cristatellus) (Winchell et al., 2016). Such knowledge is essential for forecasting the fate of species in human-dominated landscapes, which will aid in the development of a more predictive framework for addressing both the ecological and evolutionary effects of urbanization on biodiversity. To date, however, the characterization of species-specific trait patterns has only focused on a select few species and traits and, therefore, has not been systematically explored across an urban pool of species and multiple traits. This has limited our understanding of how functional trait responses influence species establishment and persistence in urban habitats, which, more broadly, informs the context of multi-species dynamics. Even without this explicit knowledge, the success of plant species in urban environments is often attributed to two factors (1) preadaptation and (2) high levels of ITV via phenotypic plasticity or heritable genetic variation. Preadaptation suggests that species express a narrow dimension of optimal trait values that allow them to establish and persist in similar environments outside of their native range by exploiting common resources (Thuiller et al., 2005; Marco et al., 2009). This concept was first introduced by Baker (1965) who described the hypothetical “ideal weed” according to a suite of characteristics that allows it to perform well in both its native and introduced range. For example, many species that originate from warmer climates, such as Portulaca oleracea L. (N. Africa; Holm et al., 1977), Cynodon dactylon (L.) Pers. (N. Africa and India; Holm et al., 1979), and Bromus tectorum L. (Mediterranean, southern Europe, Asia, and N. Africa; Mack, 1981), are commonly found in urban environments, which typically have higher average temperatures and drier soil conditions than proximal non-urban areas. Conversely, in heterogeneous environments, which characterizes many urban areas (Pickett et al., 2001), high ITV may be an important strategy for allowing individuals to adaptively respond to highly variable and unfavorable conditions, through the expression of advantageous phenotypes (Hoffmann and Merilä, 1999). In fact, high ITV is often implicated as a key factor in promoting invasion success because it allows individuals to establish in a broad range of habitats (Sexton et al., 2002; Rejmanek et al., 2005).
Functional patterns are typically defined by species or community-weighted averages (e.g., Kahmen and Poschlod, 2004; Jiang and Ma, 2015); however, incorporating both the mean and the variance of trait values into analyses can provide additional information for testing the rigor of ecological theory (Laughlin et al., 2012). Conceptually, when considering both the mean and variance of trait values, there are four types of functional responses to different environmental conditions (Figure 1). (1) Preadaptation reflects no significant changes in the mean or variance of trait values between groups, which is due to equivalent responses to different conditions (Figure 1A); (2) ITV that is maintained by phenotypic plasticity or heritable genetic variation, reflects a shift in mean trait values under different environmental conditions, but no change in the variance (i.e., trait divergence) (Figure 1B); (3) ITV that results in trait constriction suggests that abiotic conditions in different environments restrict the range of expressed trait values, which is reflected by differences in trait variance between groups, but no shift in the mean (Figure 1C); and finally, (4) mixed response reflects changes in both the mean and the variance (Figure 1D), which may be due to the combined effects of trait divergence and trait constriction.
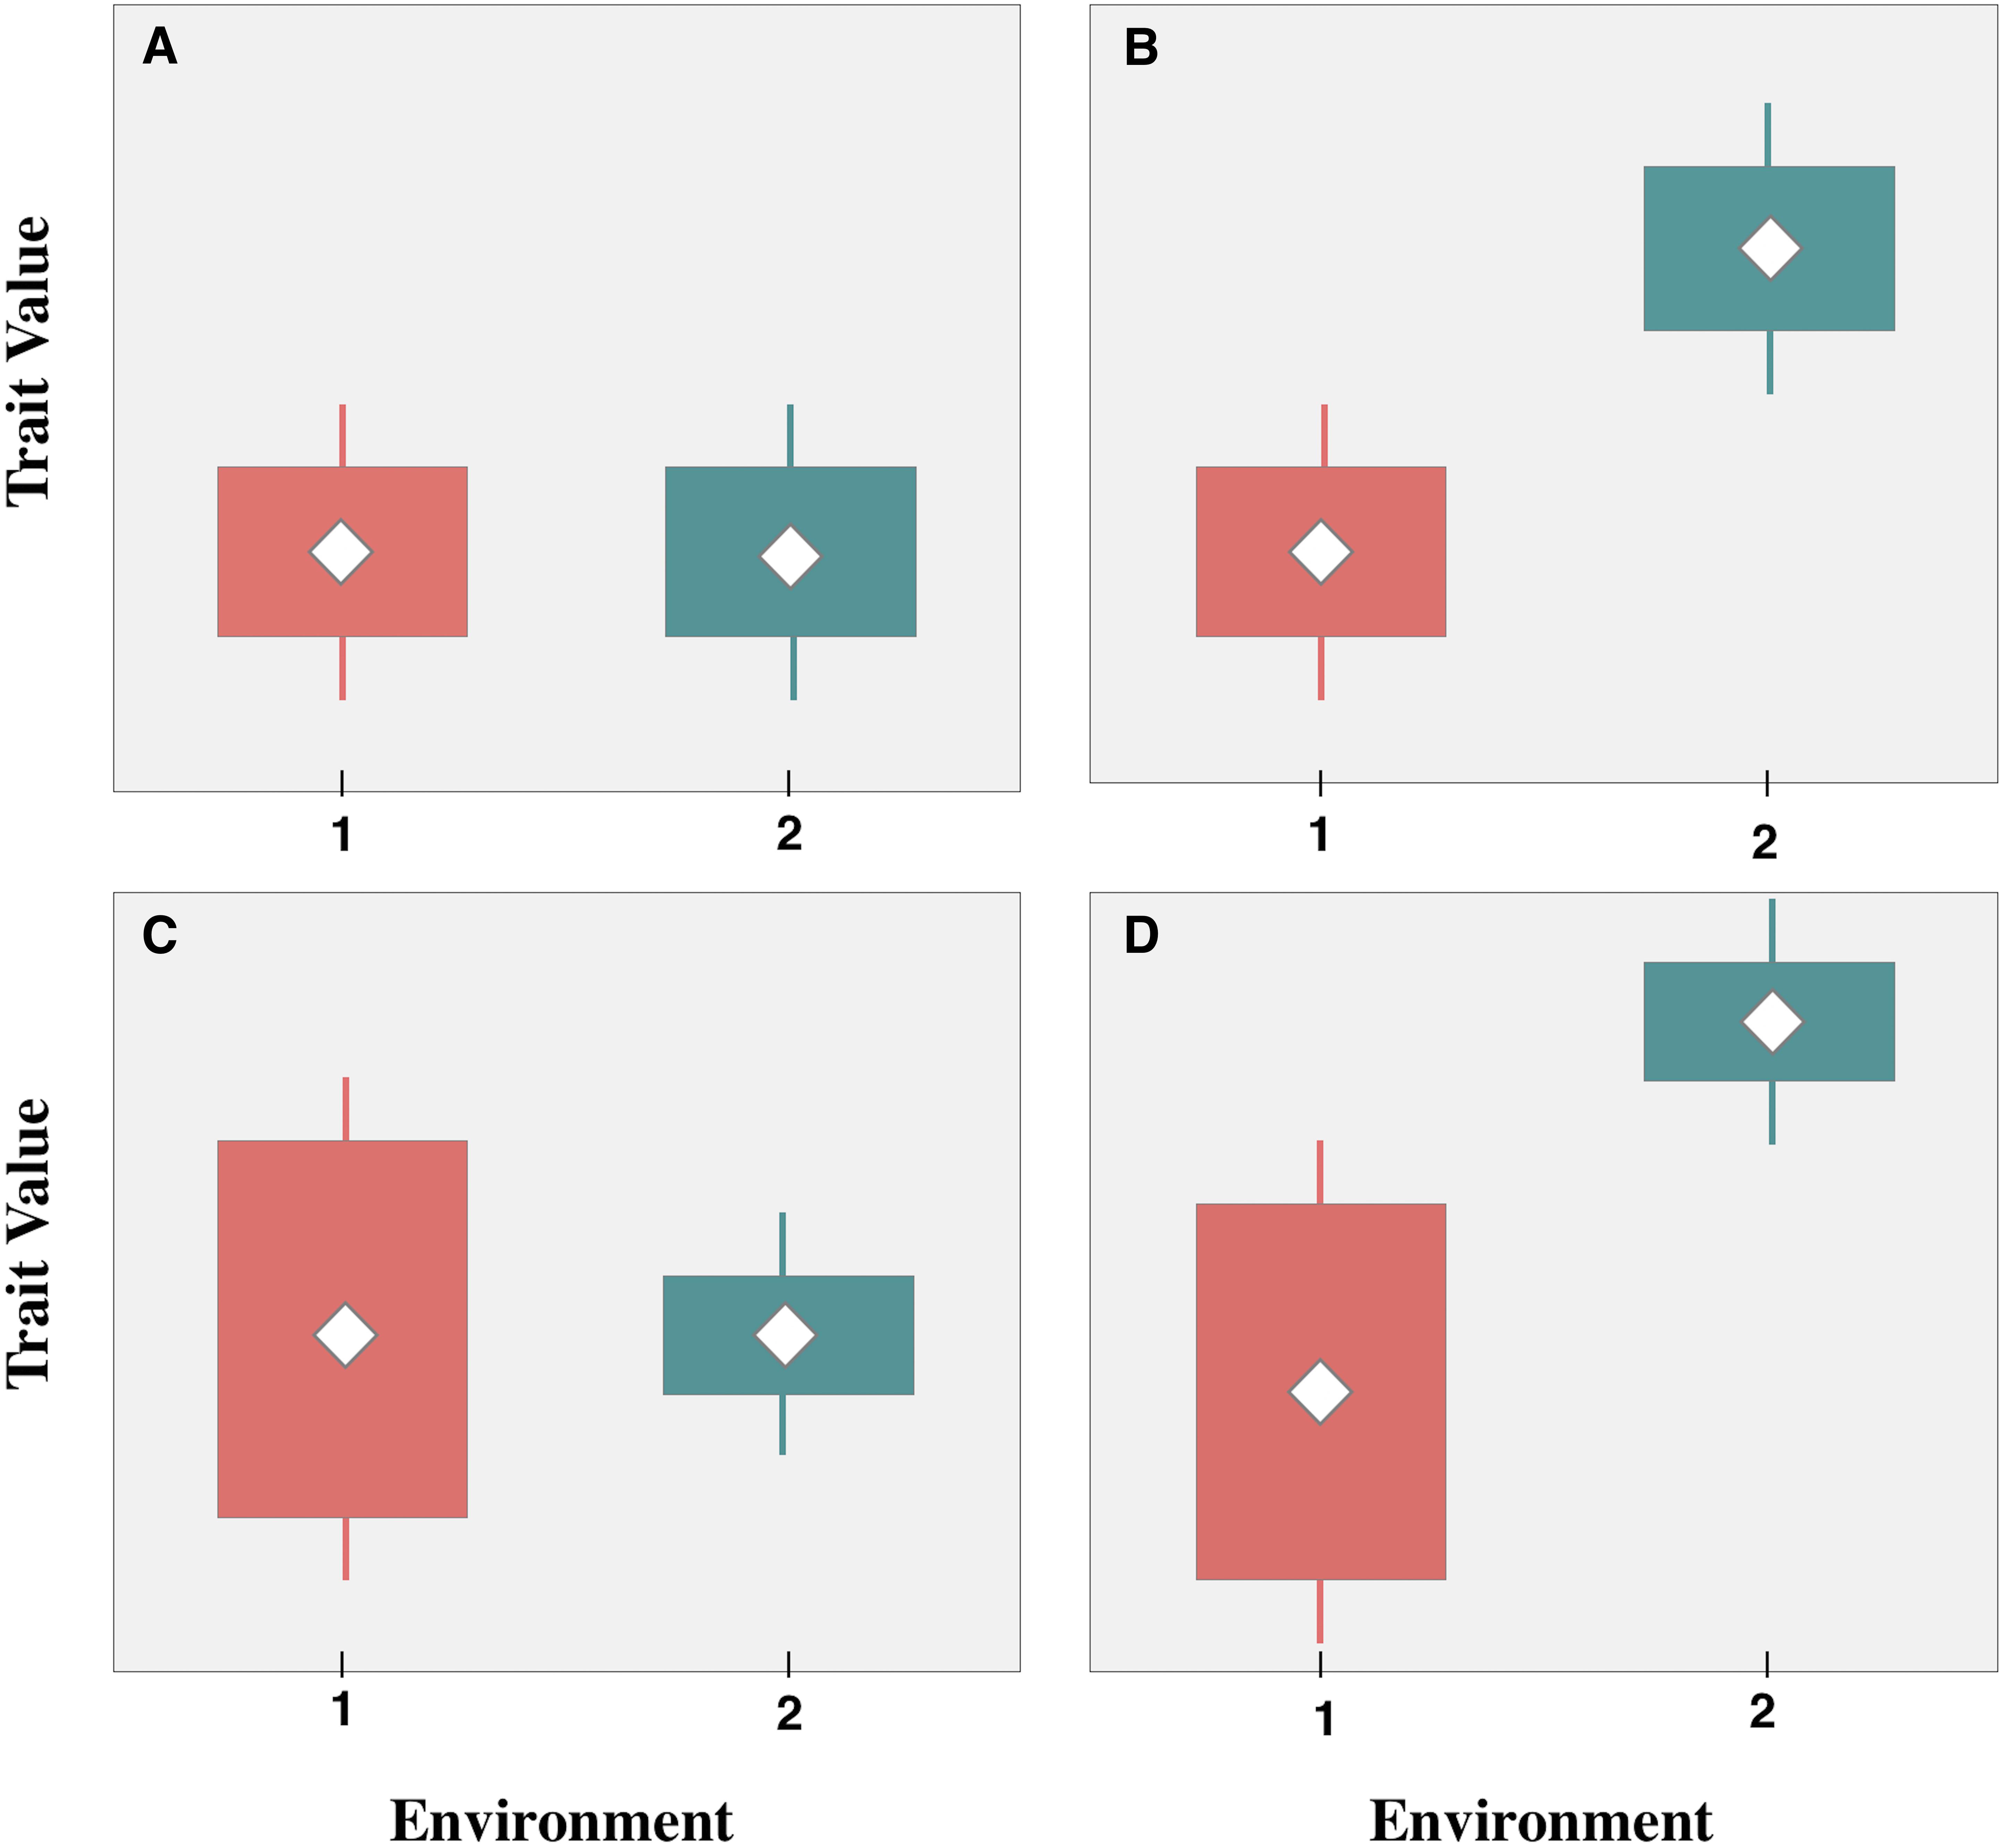
Figure 1. Conceptual illustration of functional trait responses to different environments. (A) Preadaptation: no change in trait means or variances between environments; (B) trait divergence: shift in means, no change in variances; (C) trait convergence: no change in means, shift in variances; (D) Mixed response: change in both trait means and variances. Adapted from Lin et al. (2011).
Based on these ideas, we conducted an experimental greenhouse study to assess intraspecific functional responses of a pool of urban plant species to different environmental conditions. Because soil is both a highly altered urban feature and fundamental to plant establishment and survival (Yesilonis et al., 2015), we focused on soil quality as the main environmental factor in the study. By focusing on intraspecific trait responses of urban plant species to different soils, this study broadly evaluates current explanations for the success of plant species in urban environments, while exploring the usefulness of current trait-based measures for urban studies. Here, we aimed to assess the relative magnitude of ITV, BTV, and FGTV of an urban plant species pool, as well as characterize functional responses at the species, trait, and functional group level. Although mean differences among species (BTV) are assumed to play a dominant role in driving functional responses in different environments, we expected ITV would play an important role in driving trait patterns (H1a). We also expected the relative influence of between-species (BTV), within-species (ITV), and functional group trait variation (FGTV) to differ among traits, as traits are conserved at different levels and thus are not likely to respond analogously to abiotic and biotic conditions (H1b). The literature has also identified multiple strategies for conferring successful establishment and persistence of species in different environments, including preadaptation and a high capacity for adaptive phenotypic plasticity. We therefore expected functional responses to vary among functional groups predictably. Specifically, we expected species representing functional strategies associated with persistence in warmer environments (i.e., species utilizing a C4 photosynthetic pathway) and leguminous species, which can persist in nutrient-poor soils due to their ability to symbiotically fix nitrogen, would exhibit functional responses that are associated with preadaptation (H2a). Conversely, species with more general functional strategies (i.e., C3 species) would have higher proportions of trait divergence and trait constriction (H2b). We also expected the majority of species exhibiting trait constriction would show a decreased range of trait values in urban vacant lot soil due to innately harsher conditions that are characterized by lower soil moisture retention and organic matter compared to potting soil.
Prior studies have identified functional differences between native and invasive species in the expression of trait means and the capacity for phenotypic plasticity (Godoy et al., 2012; Gross et al., 2013). However, we hypothesized that this trend would not be evident in our pool of urban species, as all represented species (both native and introduced) have ruderal, “weedy” characteristics and are commonly found in the urban environment (H3). We also hypothesized that functional responses will vary across traits. Namely, we expected SLA, height (Hmax), and germination success to show higher proportions of ITV mediated by trait divergence than biomass-associated traits (i.e., aboveground biomass, root AFDM, root:shoot ratio). SLA and height are resource acquisition traits that have been identified as highly plastic in the literature (Gratani, 2014; Siebenkäs et al., 2015). Likewise, compared to biomass-associated traits, which are collectively influenced by a number of abiotic and biotic factors, germination success is strongly associated with abiotic soil conditions (Finch-Savage and Leubner-Metzger, 2006) (H4).
Materials and Methods
Study System and Experimental Design
Our study focused on plant communities in urban vacant lot habitats. Vacant lots represent parcels of property that once supported built infrastructure (e.g., residential homes), which has since been demolished and left undeveloped. In most “shrinking cities,” such as Baltimore, these areas are ubiquitous features; Baltimore City has > 14,000 vacant lots with more added each year (Baltimore Housing, n.d.). Despite minimal planning and irregular maintenance, vacant lots support substantial amounts of plant diversity (Johnson et al., 2015). These habitats thus likely capture a large proportion of the spontaneous urban regional species pool, which makes them an ideal study system for addressing general questions about urban plant species diversity and functional trait patterns.
We conducted our study over two 15-week (mid-July to late-November) growing seasons in 2014–2015 in a cold frame hoop-house with open sidewall ventilation on the campus of the University of Maryland, Baltimore County (UMBC), MD, United States. Soil treatments consisted of low-quality, field-collected urban vacant lot soil and a peat-based potting soil mix (Sungro Sunshine® Mix 1; Agawam, MA, United States) that is often used in greenhouse experiments as a neutral comparison (e.g., Arancon et al., 2004). We collected representative “urban soil” from vacant lots located in the Harlem Park neighborhood of West Baltimore City, MD, United States (Figure 2). This neighborhood was selected because it contains a high density of vacant lots nested within multi-story, residential, row home housing blocks and because it is the location of several urban-focused studies (Becker et al., 2014; Johnson et al., 2015, 2018; Rega-Brodsky and Nilon, 2016). Due to logistical constraints, we were only able to collect soil from four vacant lots, however, we selected lots that were located on different blocks to maximize the potential for capturing soil variability within the study extent. Additionally, these lots are not expected to be highly variable in soil conditions, as the demolition process is standardized and fill material for vacant lot demolition projects in Baltimore City is typically sourced from the same contractor (Johnson et al., 2015). Within each lot, we collected approximately 36 L of soil at a depth of 5–20 cm from three random locations. All samples were taken from sections of the lot where the row home once stood (the “building footprint”) (Johnson et al., 2015, 2018). Unlike the respective backyards of these lots (“remnant gardens”), building footprint soil is considered to be lower-quality and more disturbed due to legacy effects from the building demolition process. Before potting, all urban soil samples were homogenized to reduce fine-scale variability, sieved through a 1 cm wire mesh screen to remove course rubble and debris, and mixed at a 1:1 ratio with coarse sand (Quickrete® All-Purpose Sand) to improve drainage (Spomer, 1990). Soils were not bulked prior to homogenization.
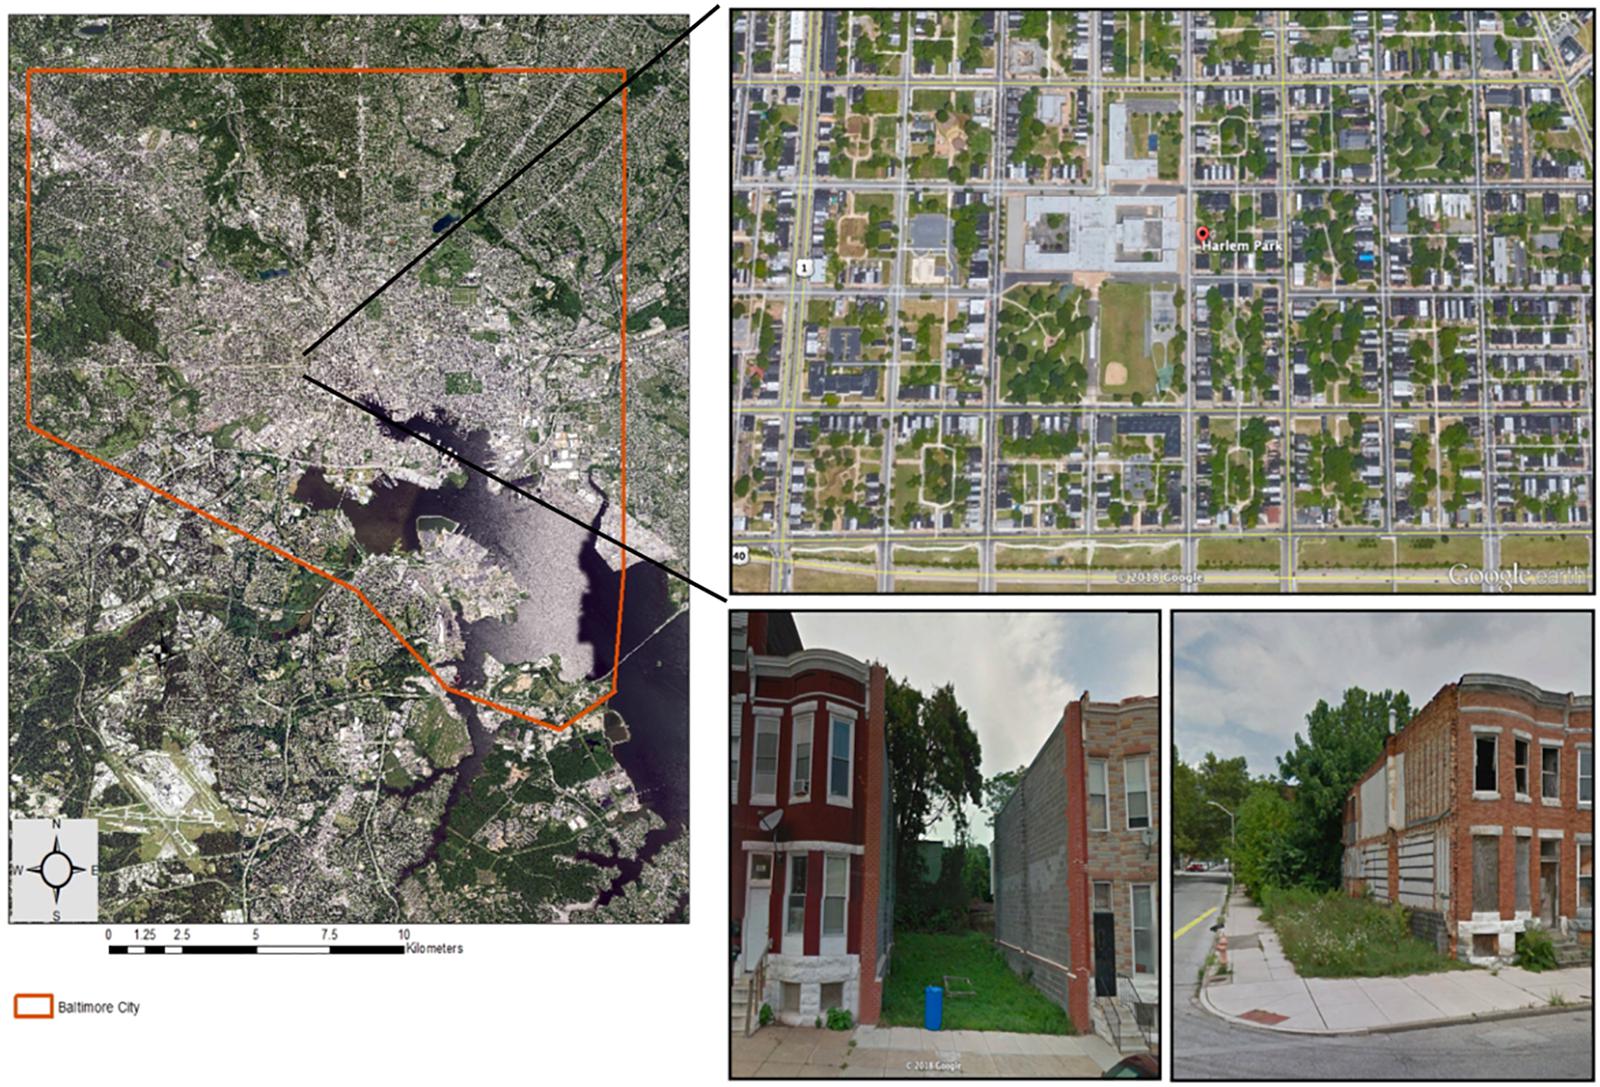
Figure 2. Map of Harlem Park neighborhood with photos showing the typical form and arrangement of vacant lots in West Baltimore City, MD, United States. Neighborhood boundary is superimposed over aerial images of tree canopy cover (green) and street layout. Map was generated in ArcGIS® [Environmental Systems Research Institute (ESRI), 2012, Access date: July 18, 2018] using data layers from imap.maryland.gov. Aerial and street view neighborhood images accessed from Google Earth (Access date: Sept. 21, 2018).
We collected all herbaceous plant species used in the study as seeds from single-source populations growing on vacant land in Baltimore City, MD, United States. In order to capture seasonal variations in seed production, we collected seeds during late-summer (June–August 2013) and mid-fall (October–November 2014), when the majority of plant species set seed in the region. This extended collection time is the main reason why we conducted the experiment over two seasons; i.e., seeds from fall-fruiting plant species were not available at the start of the 2014 experiment. Prior to sowing, we placed soil in 250 ml plastic form pots, and all pots were watered daily to initiate germination of soil seed bank species, which we subsequently hand-weeded over a 4-week period. In total, 56 plant species were sown at a density of 6–10 seeds per pot, depending on seed availability, in mid-July 2014 and 2015. Each treatment was replicated 10 times per species for a total of 1,120 experimental units. Several species required a cold stratification period to initiate germination. This process was conducted in May 2015 under controlled conditions following a standard protocol (Appendix S1 and Supplementary Table S1).
Once seedlings from target species established and could be accurately identified, they were thinned to one individual per pot to control for the effects of intraspecific competition. All pots were watered daily using overhead misters set on a timer for 10 min at 0500 h. We randomized pots weekly to control for potential microclimate effects inside the hoop house. Air temperature was measured over the 15-week study period during both study seasons. Temperatures did not vary across the two seasons and ranged from 11 to 46°C with a mean temperature of 24°C. Halfway through the study (7 weeks), we fertilized all pots with 4 equal-sized pellets of slow-release Osmocote (14-14-14; Scotts Co., Marysville, OH, United States). This maintenance dose replenished nutrients lost throughout the study without initiating additional growth, which would influence trait measures.
In order to characterize each soil treatment group, we sent soil samples to the Cornell Nutrient Analysis Laboratory (Ithaca, NY, United States) for analysis of nutrients, heavy metal concentrations, and abiotic characteristics using the Mehlich-I extraction method (Burt, 2004). Soil samples were collected from six random replicate pots at the end of the study period (15 weeks) in November 2015, composite mixed, and air-dried before analysis. We report the following soil characteristics in the results: soil moisture (measured as the ability to retain water), pH, organic matter content (OM), Al, As, B, Ca, Cd, Cr, Cu, Fe, K, Mg, Na, Ni, P, Pb, and Se (Supplementary Figure S1 and Supplementary Table S2). Although measuring soil properties at the beginning and end of the study would have provided a comparison of soil properties over time, the results from our soil analysis were analogous to Johnson et al. (2015), who analyzed soil, without manipulation, from the same lots in our study.
Trait Selection and Measurements
We selected traits that are associated with plant establishment and persistence in the literature, which included SLA, maximum vegetative height (Hmax), germination success, aboveground biomass, root ash-free dry mass (AFDM) and root:shoot mass ratio (Weiher et al., 1999; Table 1). SLA is considered both an establishment and persistence trait, and is part of the “leaf economic spectrum,” which describes a range of strategies associated with photosynthetic capacity, resource acquisition, and water use efficiency (Westoby et al., 2002; Wright et al., 2004). Height is a persistence trait that relates to competition for light and relative growth rate (Weiher et al., 1999; Cornelissen et al., 2003). Due to their strong associations with plant resource strategies, SLA and height have been identified as fundamental traits for characterizing species according to resource requirements and competitive ability (Westoby, 1998). Germination success – measured as the proportion of seeds that germinated during the study – is associated with seedling establishment. Aboveground biomass is a persistence trait that relates to fecundity and competition for space and light; whereas, root AFDM is associated with competition for soil nutrients and water (Weiher et al., 1999). Because aboveground biomass and root AFDM are negatively correlated, due to resource optimization (Bloom et al., 1985), we also included root:shoot ratio as a whole-plant economics trait that captures the tradeoff in resource allocation between aboveground vegetative and belowground root structures (Ågren and Franklin, 2003). We measured all traits at the conclusion of the study (15 weeks), except germination success, which was measured weekly, prior to thinning seedlings.
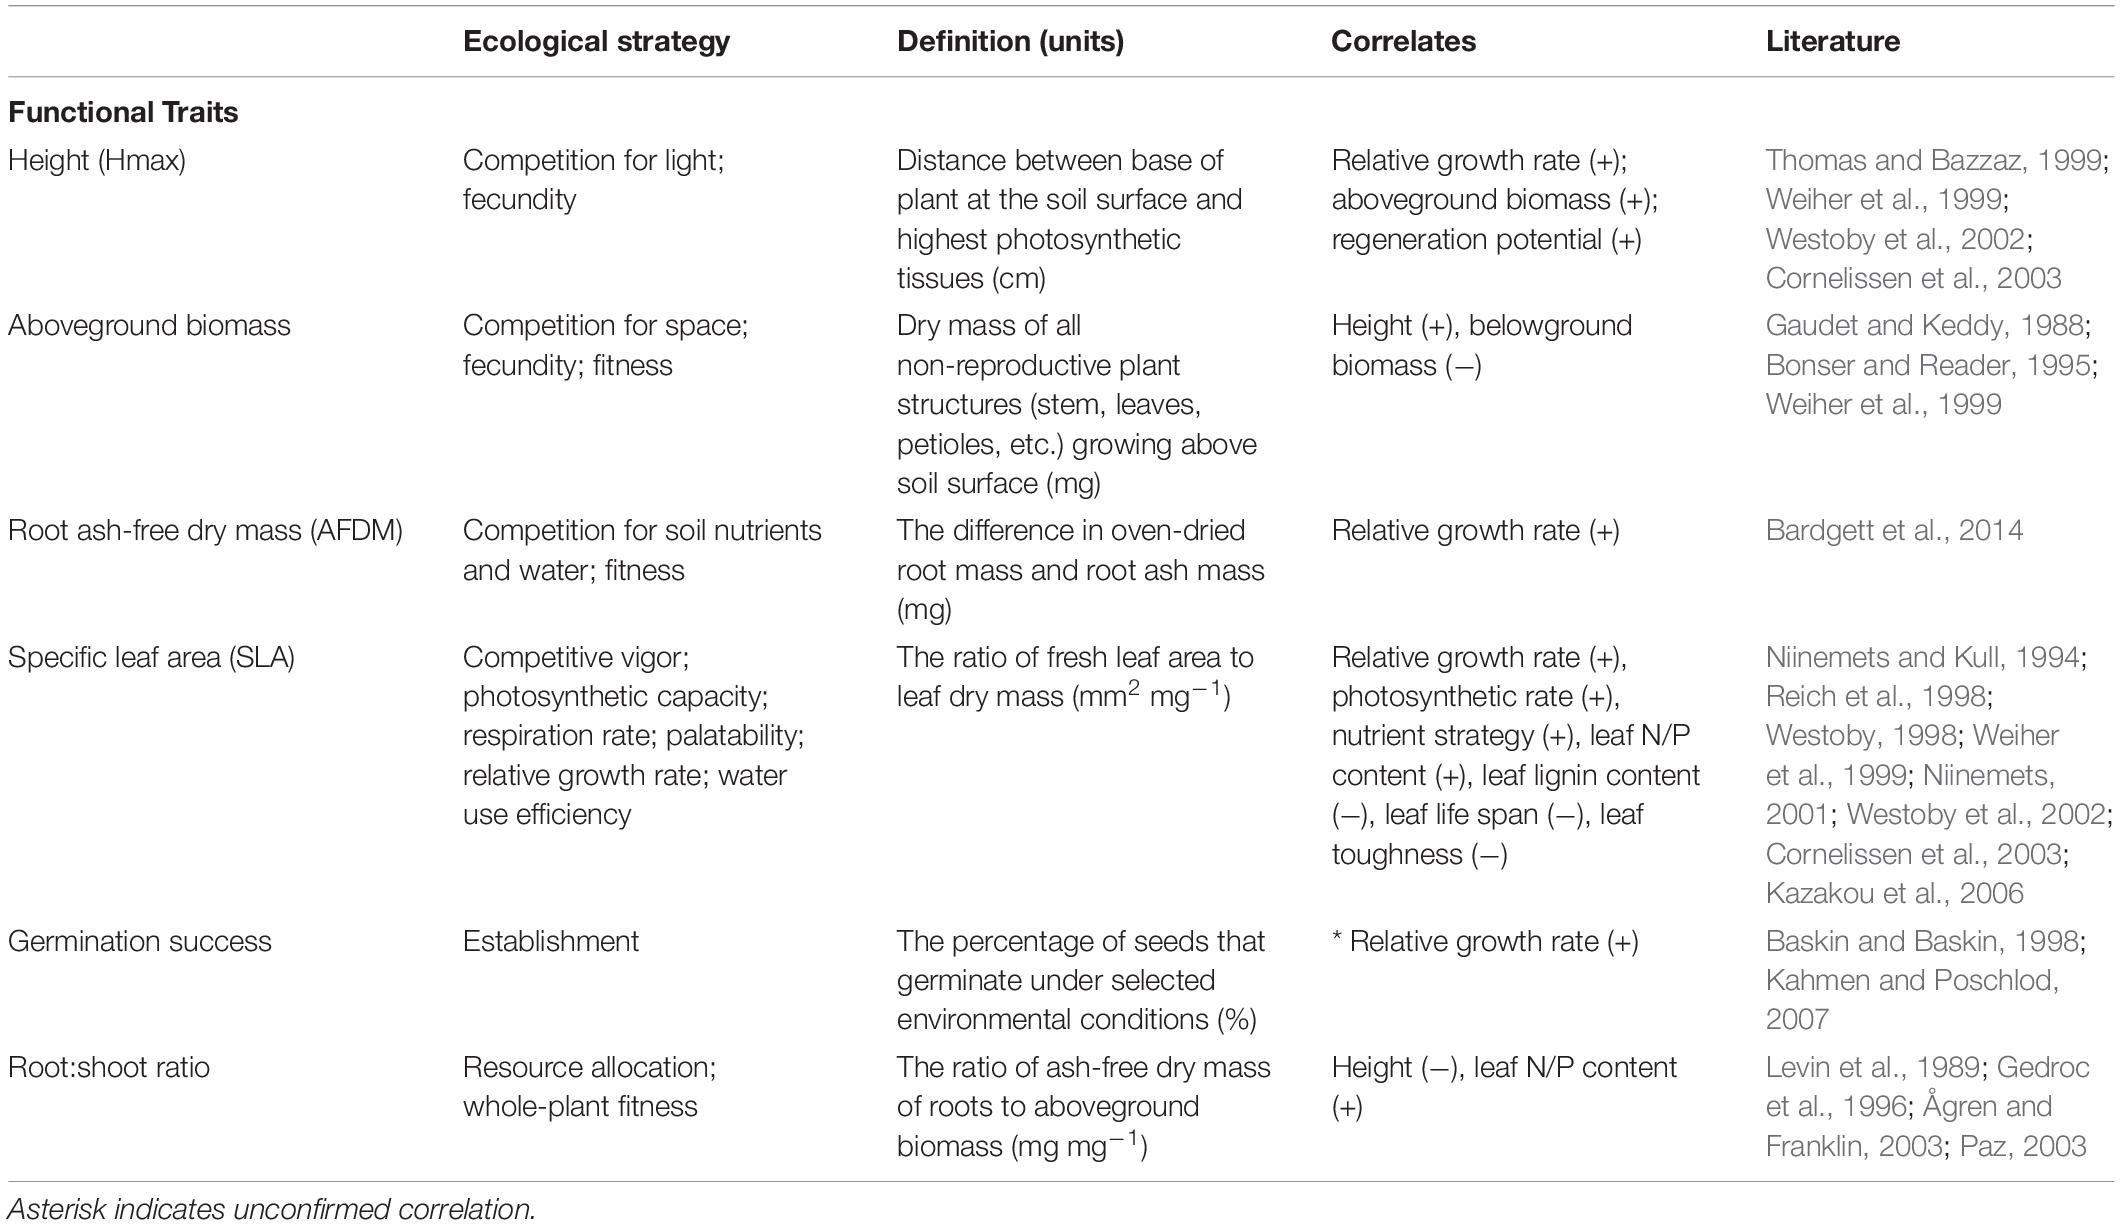
Table 1. List of functional traits and their definition, ecological strategy, and correlates (signs indicate the direction of the correlation).
Trait measures followed standard protocols (Cornelissen et al., 2003; Pérez-Harguindeguy et al., 2013). All biomass and leaf samples were oven dried at 70°C for a minimum of 72 h prior to weighing. SLA is a composite measure that is calculated by dividing the total area of a leaf by its dry mass. For each plant, we measured SLA on three fully expanded, undamaged leaves, including petiole. Leaves were scanned at 600 dpi using a Canon (CanoScan LiDe 110) scanner in the field, and leaf area was calculated for each image using ImageJ v 1.50 (Abramoff et al., 2004). Root:shoot ratio was determined by dividing the aboveground biomass of each plant by its root ash-free dry mass (AFDM). All root samples were processed by rinsing roots through a 1.18 mm sieve in order to capture fine root fragments and then drying and weighing each sample. Root AFDM was determined by combusting oven-dried root samples at 450°C for 4 h in a Thermolyne muffle furnace (Thermo Scientific; Model: F30400) and then subtracting the root ash weight from the oven-dried root weight in mg.
Statistical Analysis
To assess whether soil and species had an overall influence on trait patterns, we first performed factorial analysis of variance (ANOVA) tests that compared the functional response for each measured trait (i.e., Hmax, aboveground biomass, root AFDM, SLA, germination success, and root:shoot ratio) to soil type (urban vs. potting soil), species, and soil type x species interaction. All traits, except for germination success, were log10+1-transformed prior to analysis to satisfy the assumption of normality. Because some individuals did not germinate over the course of the study, we based our ANOVA tests on Type II sums of squares, which is preferred for unbalanced designs (Langsrud, 2003).
In order to test the relative magnitude of trait patterns beyond the species-level (H1) – which is most often considered in ecological studies – we used linear mixed models fit with Restricted Maximum Likelihood (REML) estimation (Bolker et al., 2009; Zuur et al., 2010) using the “lme” function in the nlme R package v 3.1 (Pinheiro et al., 2017). In each model, we included functional group (i.e., photosynthetic pathway: C3, C4; status: native, introduced; life form: forb, graminoid, legume, vine, shrub) as a fixed effect and species as a nested random effect. We then performed variance component estimates for each trait by decomposing the amount of explained variance across three nested ecological levels: within-species level (ITV), between-species level (BTV) and functional group level (FGTV) (Messier et al., 2010; Vilà-Cabrera et al., 2015), using the “varcomp” function available in the R package ape v 4.1 (Paradis et al., 2004). For each trait, we fitted two models – one that included within-species (i.e., individual replicates for each species) and species, and the other including within-species, species, and each functional group. We calculated 95% confidence intervals (CIs) for the percentage of variance explained at each level via bootstrapping with 1000 iterations (with replacement) for each trait (Manly, 2006; Crawley, 2007).
We tested H2-H4 using mixed effects ANOVAs that compared species in each functional group between soil types. For each model, we included soil type as a fixed effect and species as a nested random effect. Thus, ANOVA tests that grouped species according to photosynthetic pathway and “legume” life form addressed H2a and H2b, respectively; whereas, ANOVAs that grouped species by status addressed H3. We tested H4 directly using each trait as a response variable in the models. When ANOVA results indicated a significant effect (alpha = 0.05), we performed planned contrasts – using the “emmeans” function in the emmeans package in R v 1.2.1 (Lenth, 2018) – to test only those pairwise comparisons of trait values between soil types that are relevant to our hypotheses. Because pairwise comparisons were restricted to independent groups and comparisons across species were not considered in our analyses, post hoc corrections for multiple comparisons, such as sequential Bonferroni tests (Rice, 1989), were not necessary. Therefore, the alpha level remained at 0.05 for all pairwise comparisons.
We used Bartlett’s and Levene’s tests to assess homogeneity of variance for each response variable (alpha = 0.05). Significant results indicated differences in the spread of functional trait values, which was interpreted as trait constriction, resulting from differences in environmental filtering effects between soil types. Results for both tests were comparable; therefore, we only reported p-values for Bartlett’s tests in the following sections.
To identify associations between pairs of functional traits at each level, we calculated Pearson’s correlation coefficient across all levels (ITV, BTV, and FGTV). Variables with Pearson | r| > 0.7 are interpreted as having a strong correlation (Dormann et al., 2013). We performed all analyses in R software v 3.3.3 (R Core Team, 2017).
Results
Two species did not successfully germinate over the course of the study, Hedera helix L. and Commelina communis L. The reasons for failed germination are not known, however, both species exhibited signs of fungal infection on seeds prior to sowing. Therefore, a total of 54 species were included in the analysis (Supplementary Table S3).
The Effect of Soil on Species Trait Values
Soil significantly influenced species trait values for all traits except root AFDM [F(1, 855) = 0.24, P = 0.626]. Trends indicate that species tended to have greater aboveground biomass [F(1, 857) = 5.69, P = 0.017] and grew taller (greater Hmax) [F(1, 833) = 16.1, P = 6.5e-05] in urban soil. Conversely, species had lower SLA [F(1, 710) = 48.44, P = 7.8e-12], germination success [F(1, 971) = 82.87, P < 2.2e-16], and root:shoot ratio [F(1, 841) = 6.95, P = 0.009] in urban soil compared to potting mix. Species and soil x species interaction also had a significant effect on all traits (P < 0.0001), indicating that the effect of soil on trait values is dependent on species identity (Table 2). Variance partitioning of model factors showed that although soil had a significant effect on most traits (with the exception of root AFDM), species explained a substantially greater proportion of the total variance in trait values (Figure 3).
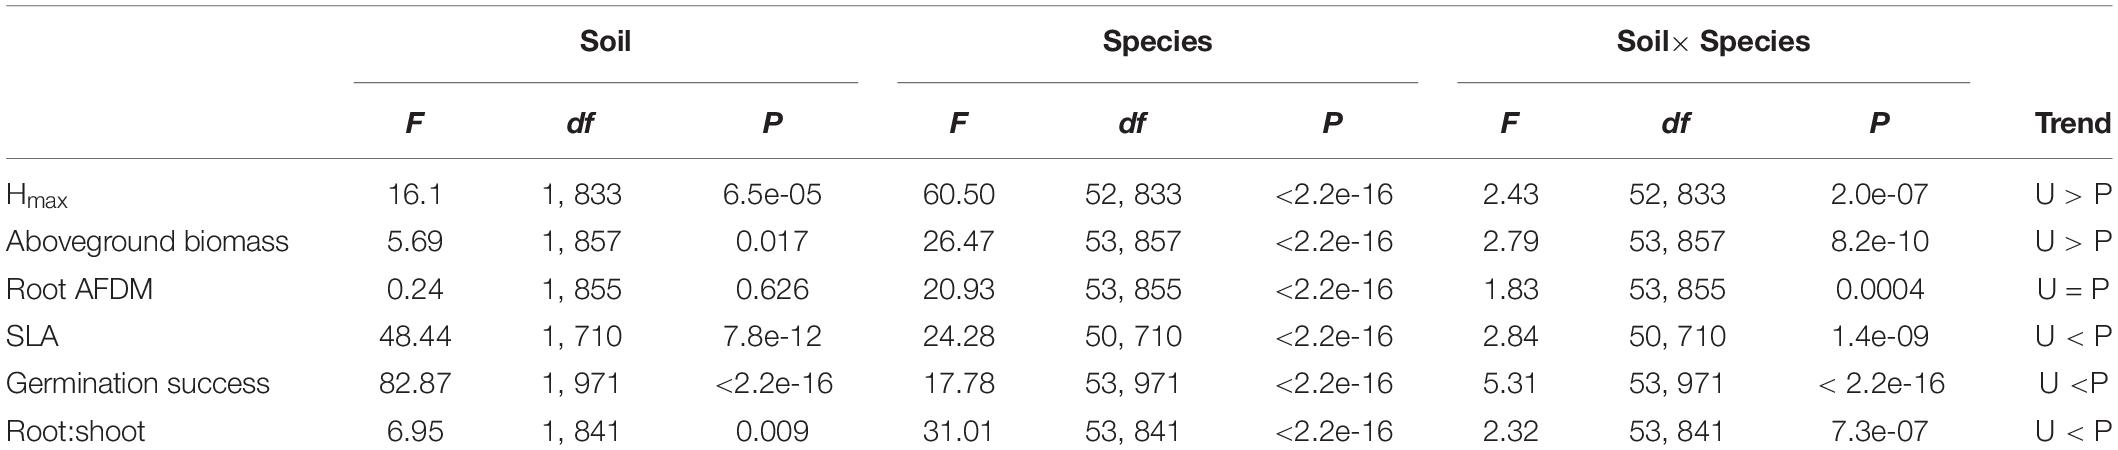
Table 2. ANOVA (Type II SS) results testing the effect of soil type, species, and soil × species interactions on functional trait responses, including trends for mean trait values between soil treatment groups.
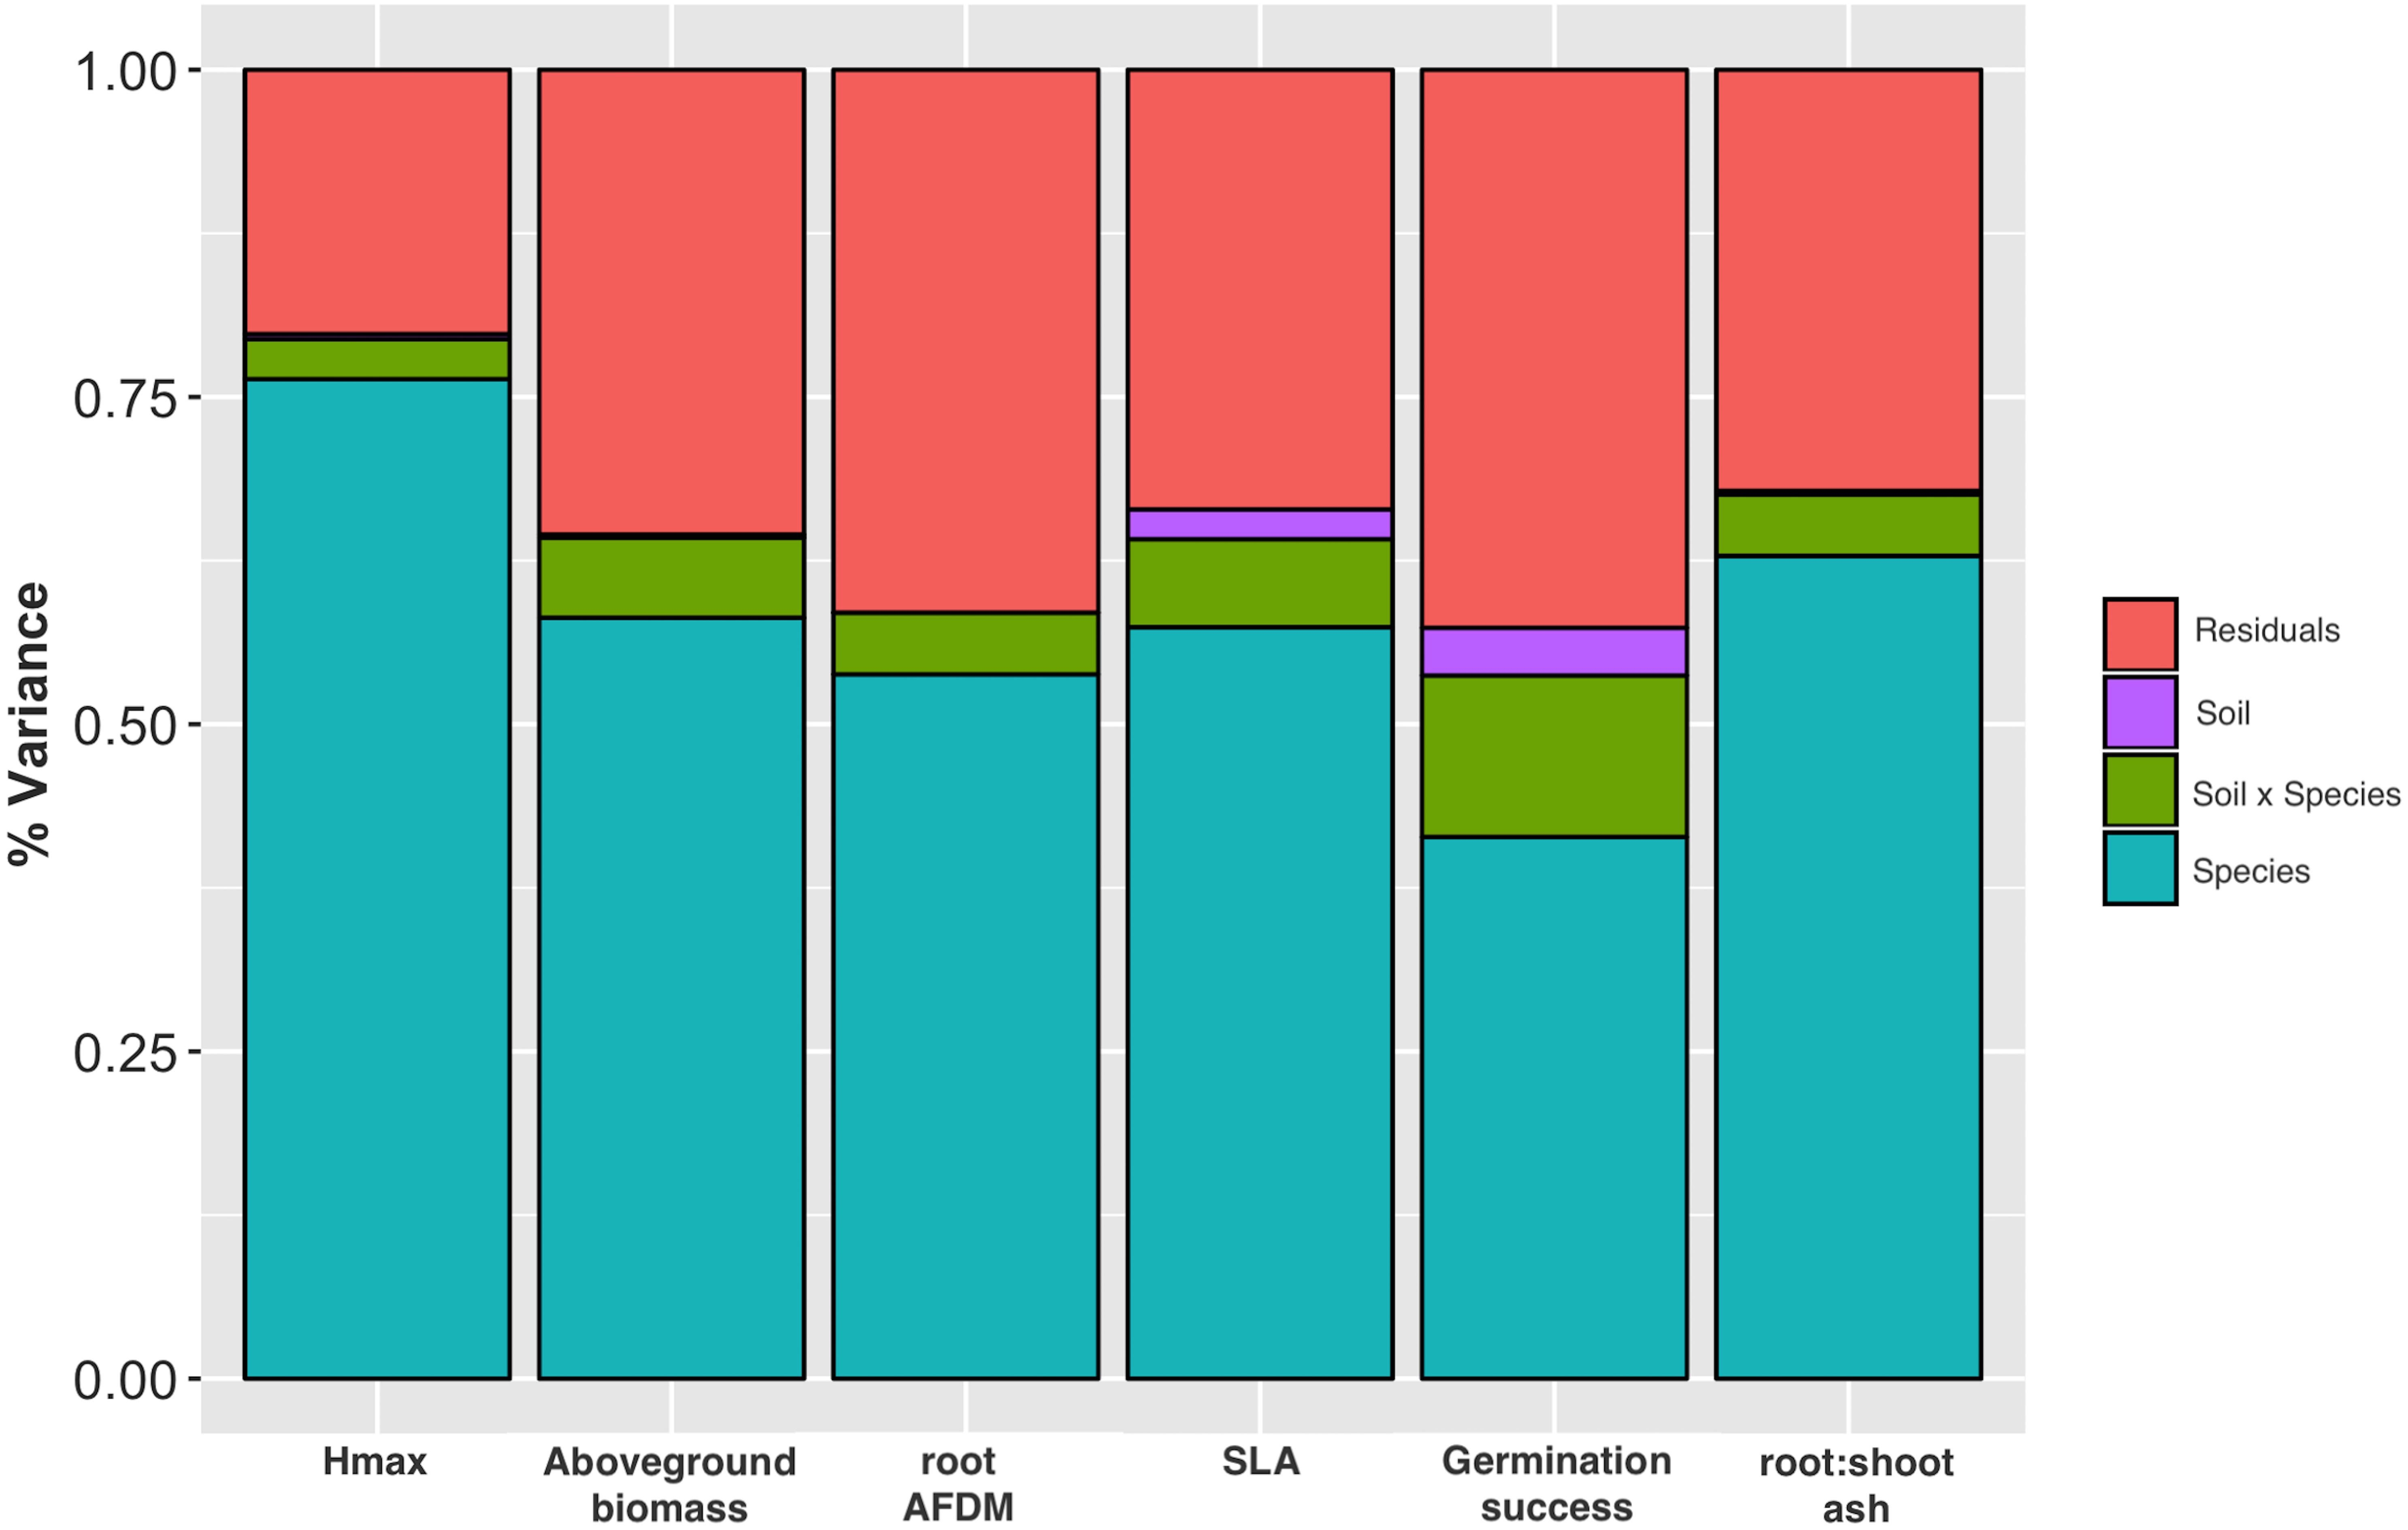
Figure 3. Stacked plot of ANOVA results showing variance partitioning for Hmax, aboveground biomass, root AFDM, SLA, germination success, and root:shoot ratio into species and soil factors, site x species interaction, and residuals. Species, soil type, and species x soil interaction had a significant effect on all traits except soil on root AFDM (P > 0.05).
The Importance of ITV, BTV, and FGTV in an Urban Species Pool (H1)
Variance decomposition of the species factor into between-species (BTV) and within-species (ITV) components showed that BTV captured approximately 38–76% of the variance in trait values, while 24–62% of the variance was explained by ITV (Table 3A). In addition, the relative influence of ITV and BTV varied among the six functional traits. Aboveground biomass, root AFDM, and SLA showed similar patterns with equivalent partitioning of variance between and within species, although confidence intervals did not overlap for aboveground biomass. Conversely, the proportion of variance explained for Hmax and root:shoot ratio was greater at the between-species level than within-species (Hmax: BTV, 76.3 [69.0, 80.7]; ITV, 23.7 [19.5, 31.0]) (root:shoot: BTV, 60.4 [54.6, 63.6]; ITV, 39.6 [36.4, 45.5]). Germination also showed marked differences in variance partitioning between levels; however, the pattern was opposite from Hmax, showing a greater proportion of variance explained among individuals (within-species) compared to between-species (ITV, 61.6 [61.0, 68.6]; BTV, 38.4 [31.4, 39.1]). General patterns in variance partitioning did not differ considerably for each trait when the functional group (FGTV) level was included in variance component analyses – BTV and ITV still collectively explained the most variance among functional groups and their relative effects remained the same. In general, status (native, introduced) explained a nominal proportion of the variance for all traits (<17%) (Table 3C), while only photosynthetic pathway (C3, C4) for Hmax and SLA (Hmax: 25.6 [20.0, 31.4]; SLA: 21.0 [11.0, 32.4]) and life form (forb, graminoid, legume, vine, shrub) for aboveground biomass (29.4 [21.5, 37.8]) explained an appreciable proportion of the variance at the functional group level (Tables 3B,D, respectively).
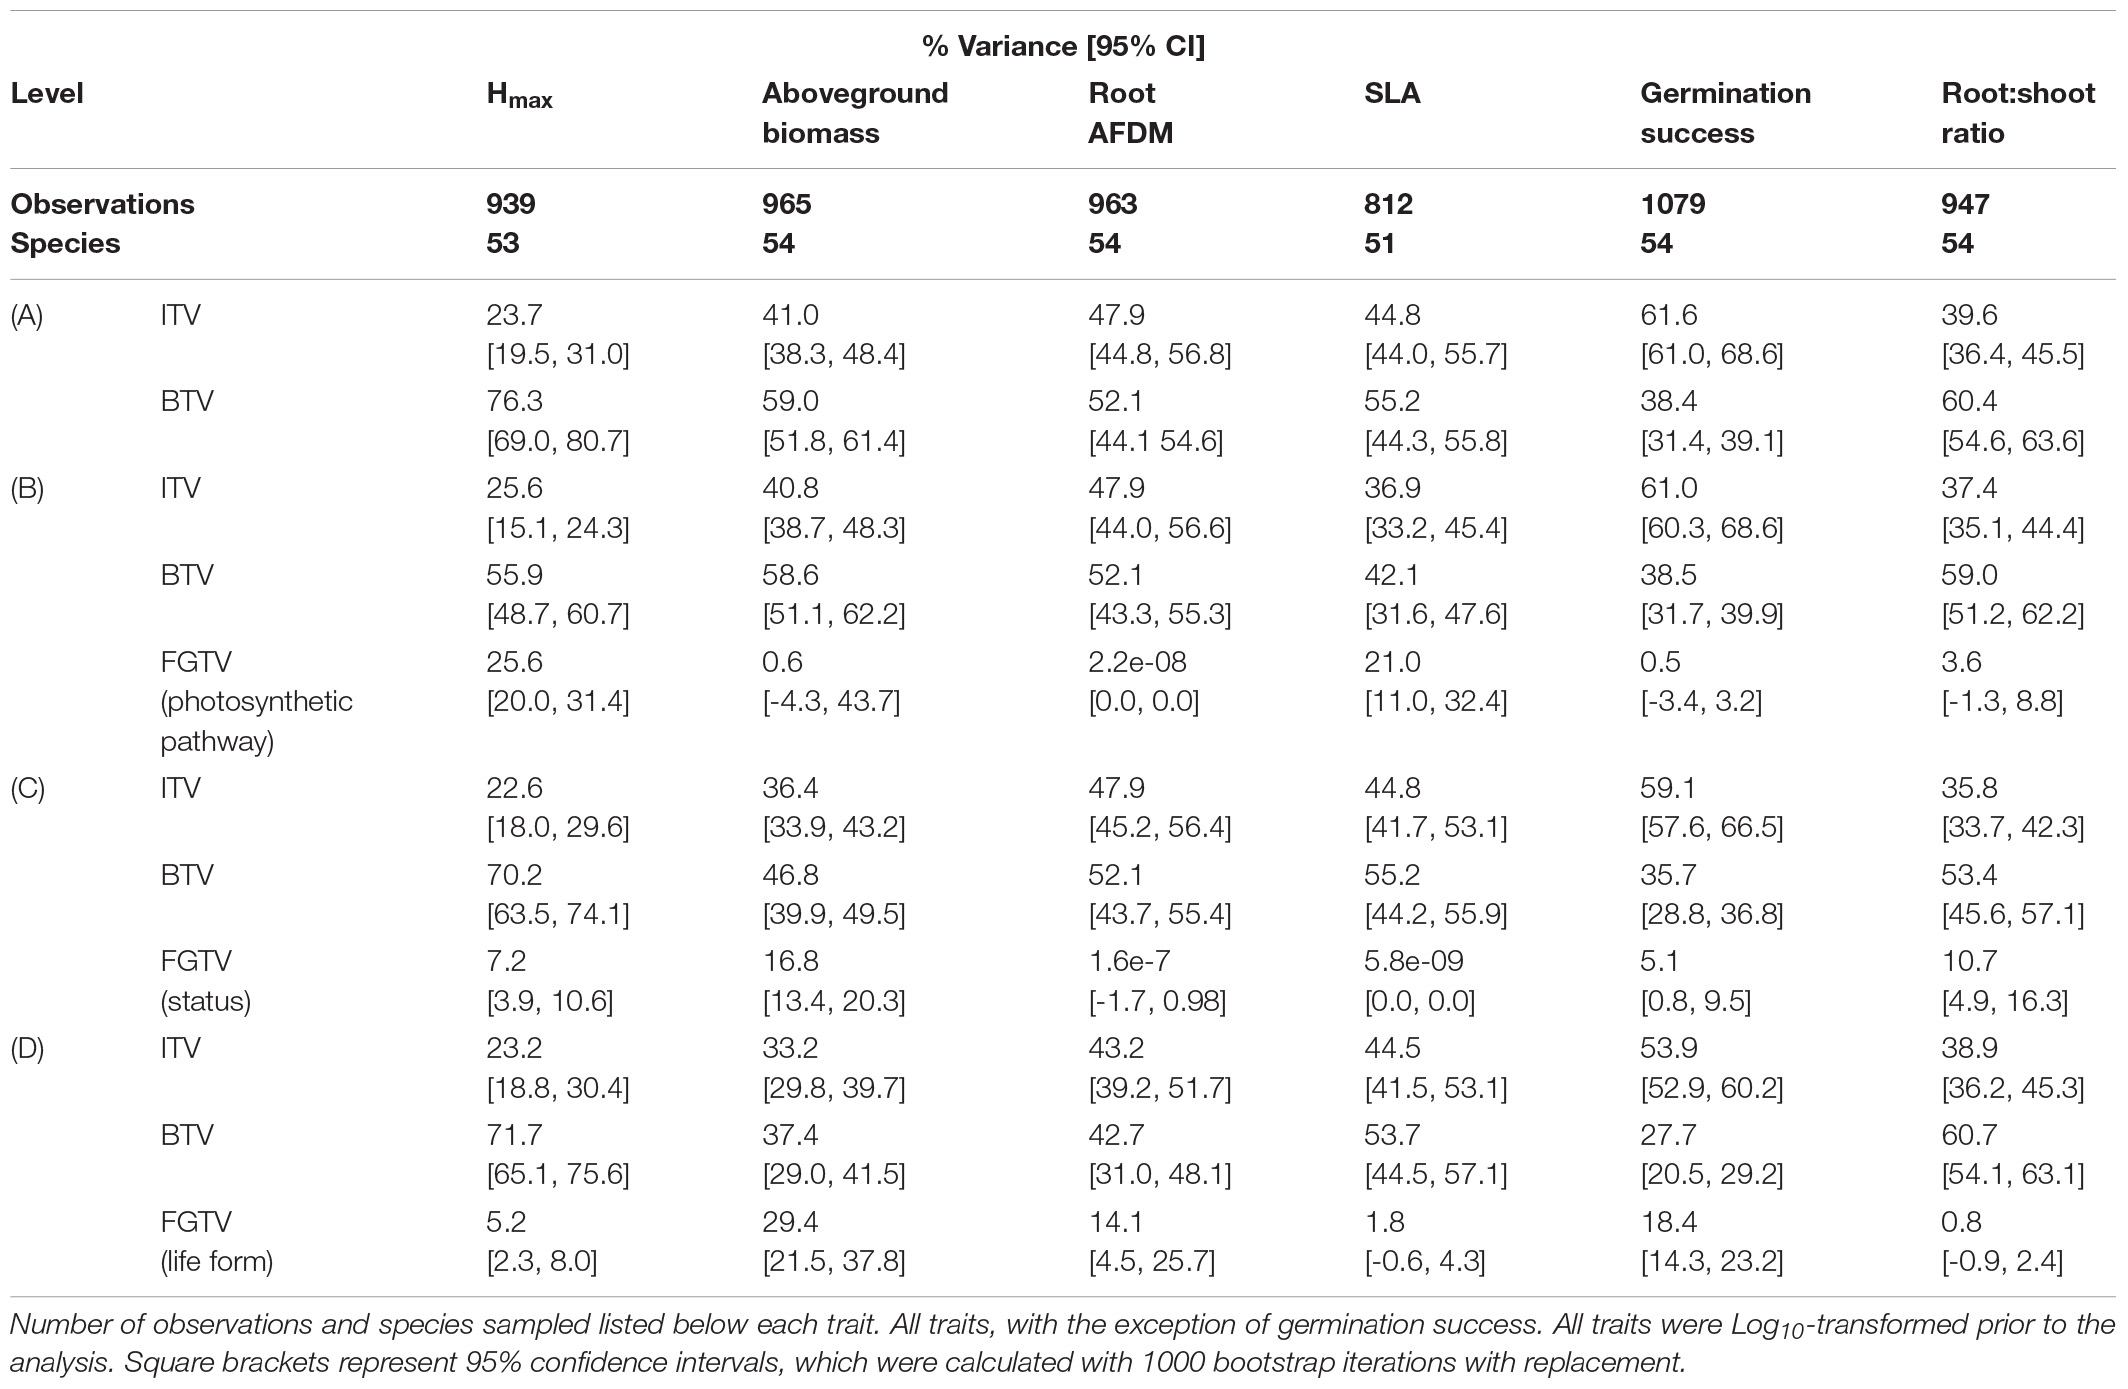
Table 3. Variance partitioning for Hmax, aboveground biomass, AFDM, SLA, germination success, and root:shoot ratio functional traits at the (A) within-species (ITV) and between-species levels, and (B) photosynthetic pathway (C3, C4), (C) status (native, introduced), (D) life form (forb, graminoid, legume, vine, shrub) functional group (FGTV) levels.
Functional Group Responses (H2-H3)
Legumes and species that utilize C4 photosynthesis exhibited functional responses associated with preadaptation for all traits, which is indicated by no significant change in either the mean or the variance of functional trait values between soil types (Figures 4A–F, 5A–F, respectively) Conversely, functional responses varied among traits for C3 species (Figures 6A–F). Among all traits, preadaptation was the most common functional response for C3 species, with 43–68% of species exhibiting this pattern, depending on the trait. Trait divergence was the second most common functional response with 18–45% of C3 species showing significant differences in mean trait values between soil types. Trait constriction was represented in all measured traits, with 6–18% of all C3 species showing significant differences in variance between soil types. In addition, the majority of species exhibiting trait constriction responses had constrained variance in urban soil (trait constriction urban, TC U), which supports the general conclusion that urban soil acts as a harsh environmental filter that selects species based on a subset of trait values (Williams et al., 2009). Few C3 species (2%) exhibited a mixed functional response, which is characterized by significant changes in both the mean and the variance of trait values, and only for aboveground biomass and root AFDM.
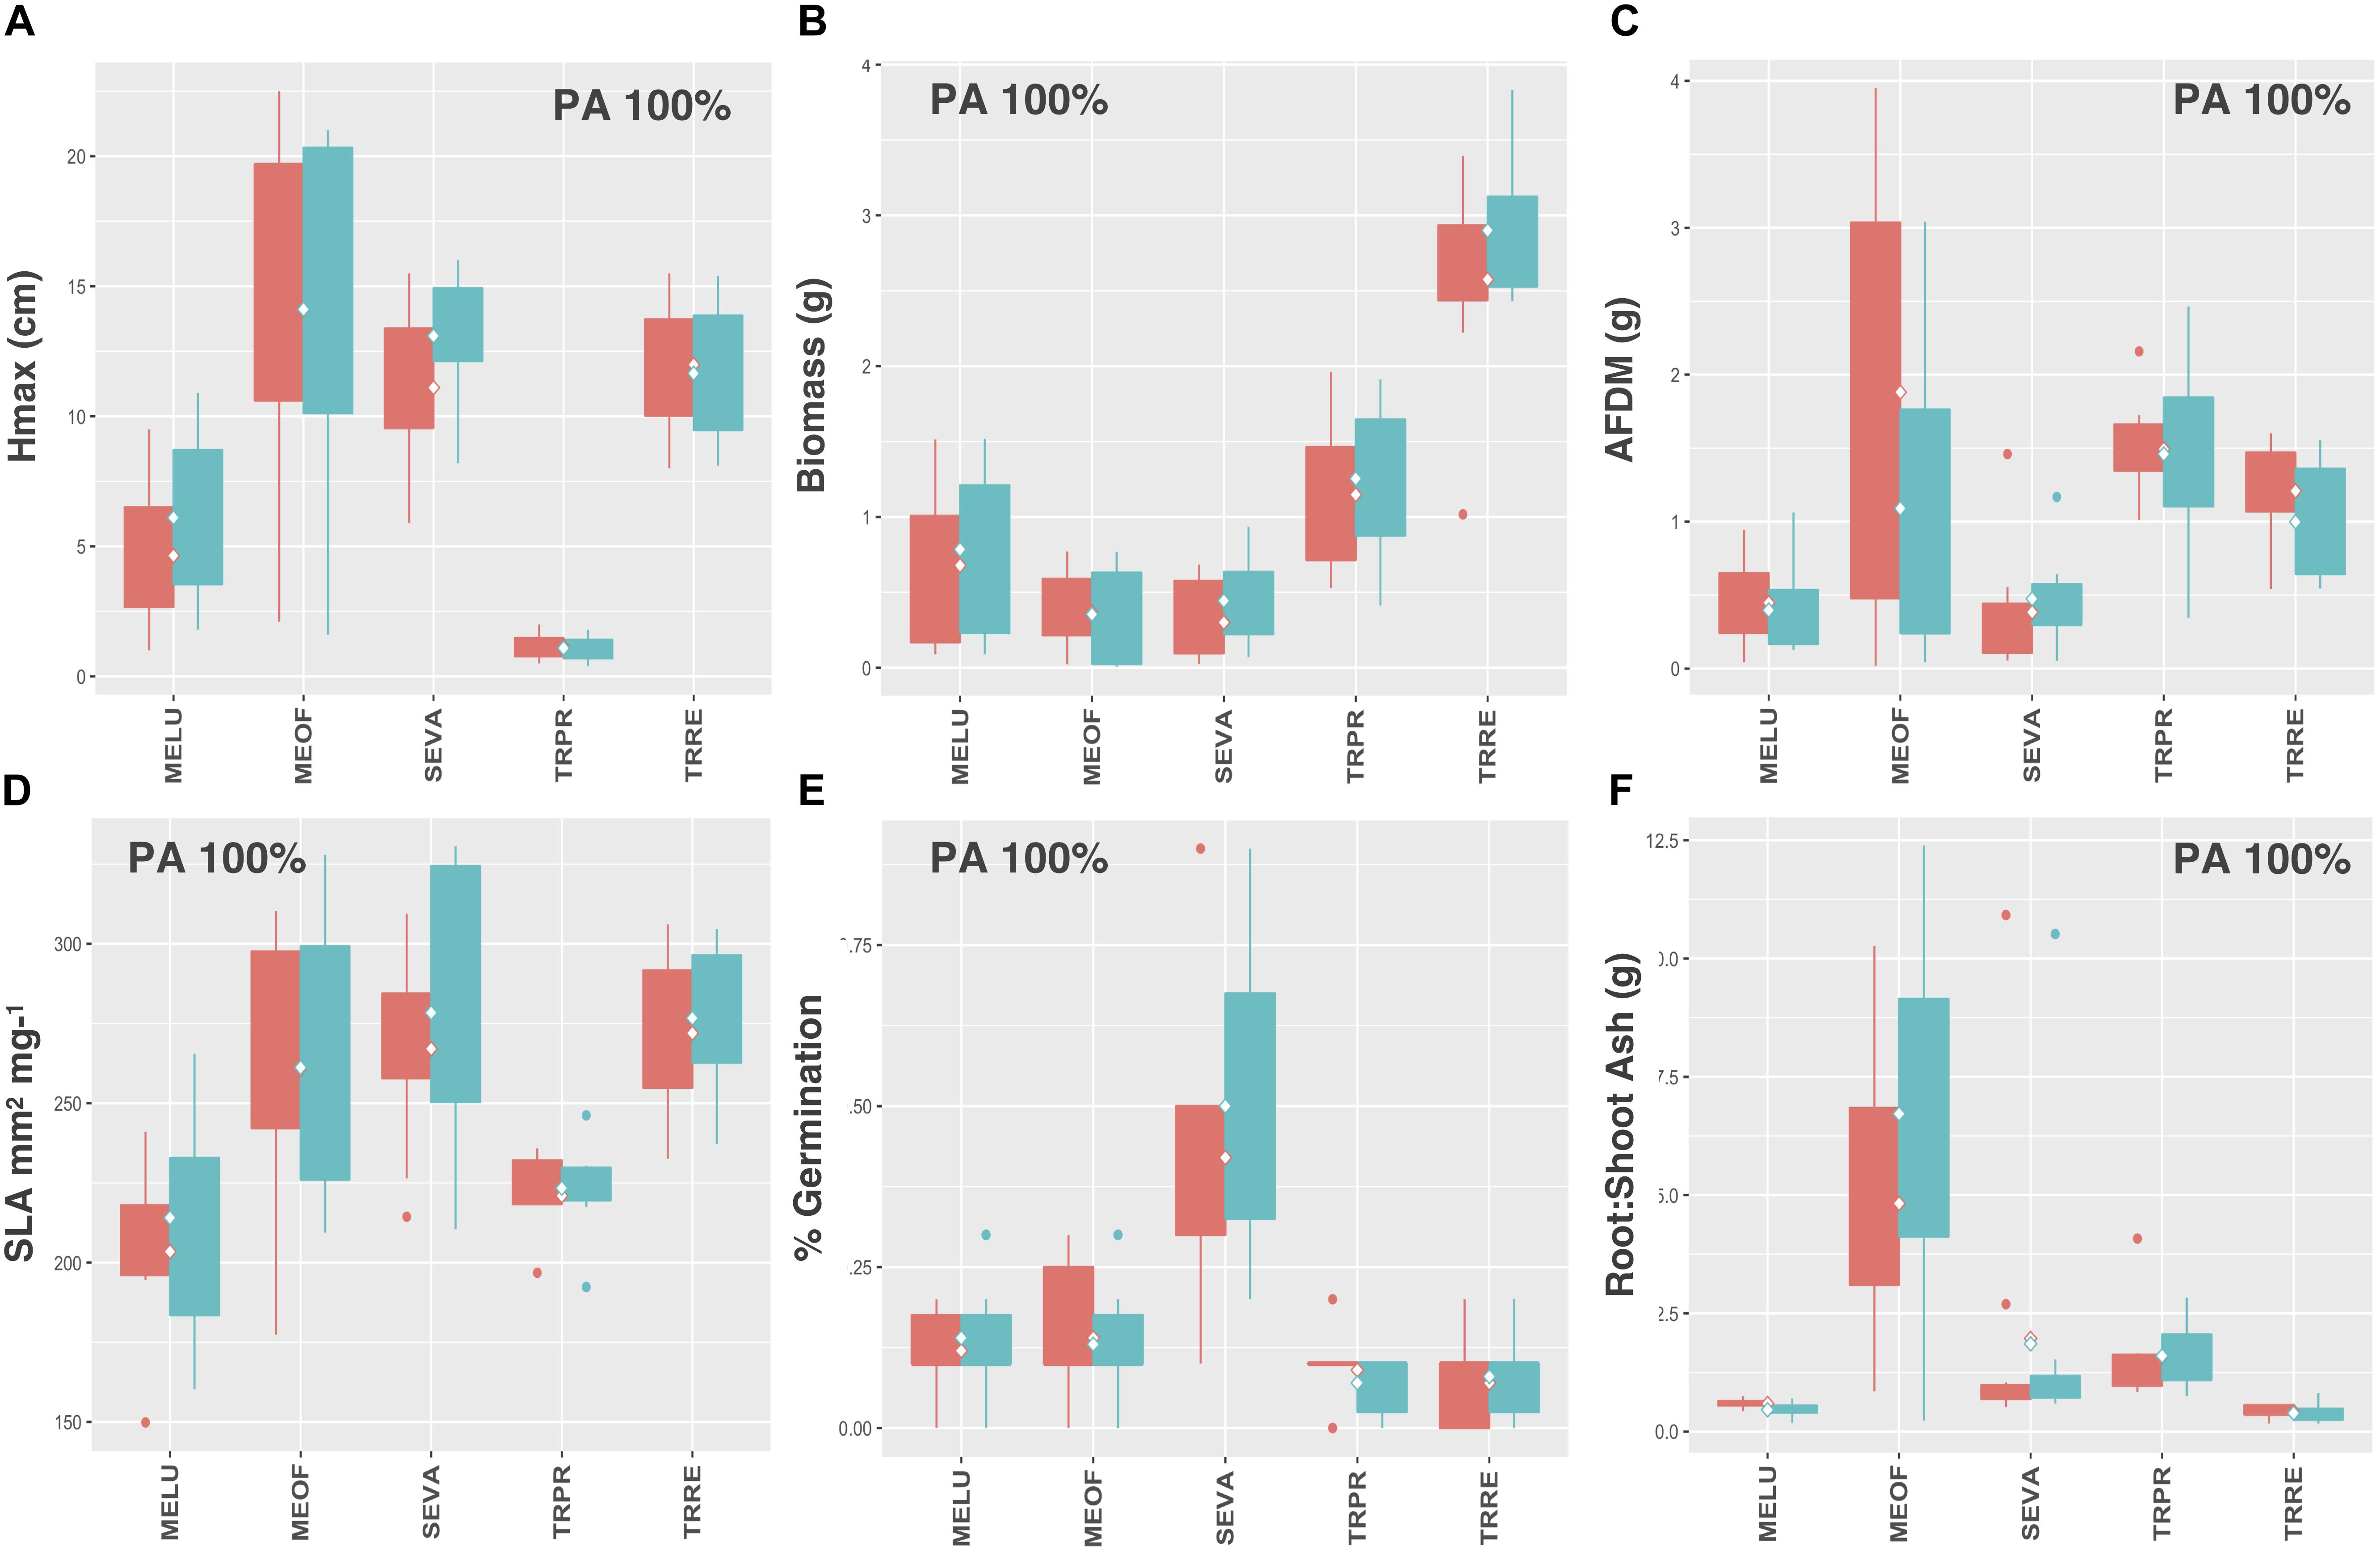
Figure 4. Leguminous species trait values for (A) Hmax, (B) aboveground biomass, (C) root AFDM, (D) SLA, (E) germination success, (F) root:shoot ratio. Only preadaptation (PA) is displayed in the boxplots, as all species utilizing C4 photosynthesis exhibited this functional response, and across all traits. Boxplots showing mean (white diamond), interquartile range (box), minimum and maximum (whiskers) and outliers (dots) between urban (red) and potting soil (blue). (Note: medians not shown). For clarity, boxplots were sub-grouped according to functional response type, i.e., (1) preadaptation (PA), (2) trait divergence (TD U, TD P), (3) trait constriction (TC U, TC P), and (4) mixed response. “U” and “P” labels indicate proportional differences between urban and potting soil within a functional response group. Specifically, TD U (“trait divergence urban”) represents the proportion of species that exhibited trait divergence with higher mean values in urban soil; whereas, TD P (“trait divergence potting”) represents the proportion of species with higher mean trait values in potting soil. TC U (“trait constriction urban”) indicates a narrower range of trait values in urban soil treatments compared to potting soil; conversely, TC P (“trait constriction potting”) indicates constrained trait values in potting soil. Percentages display the proportion of species exhibiting each functional response. Species are coded according to the first two letters of the genus and the species name (see Supplementary Table S3 for a list of species and associated code).
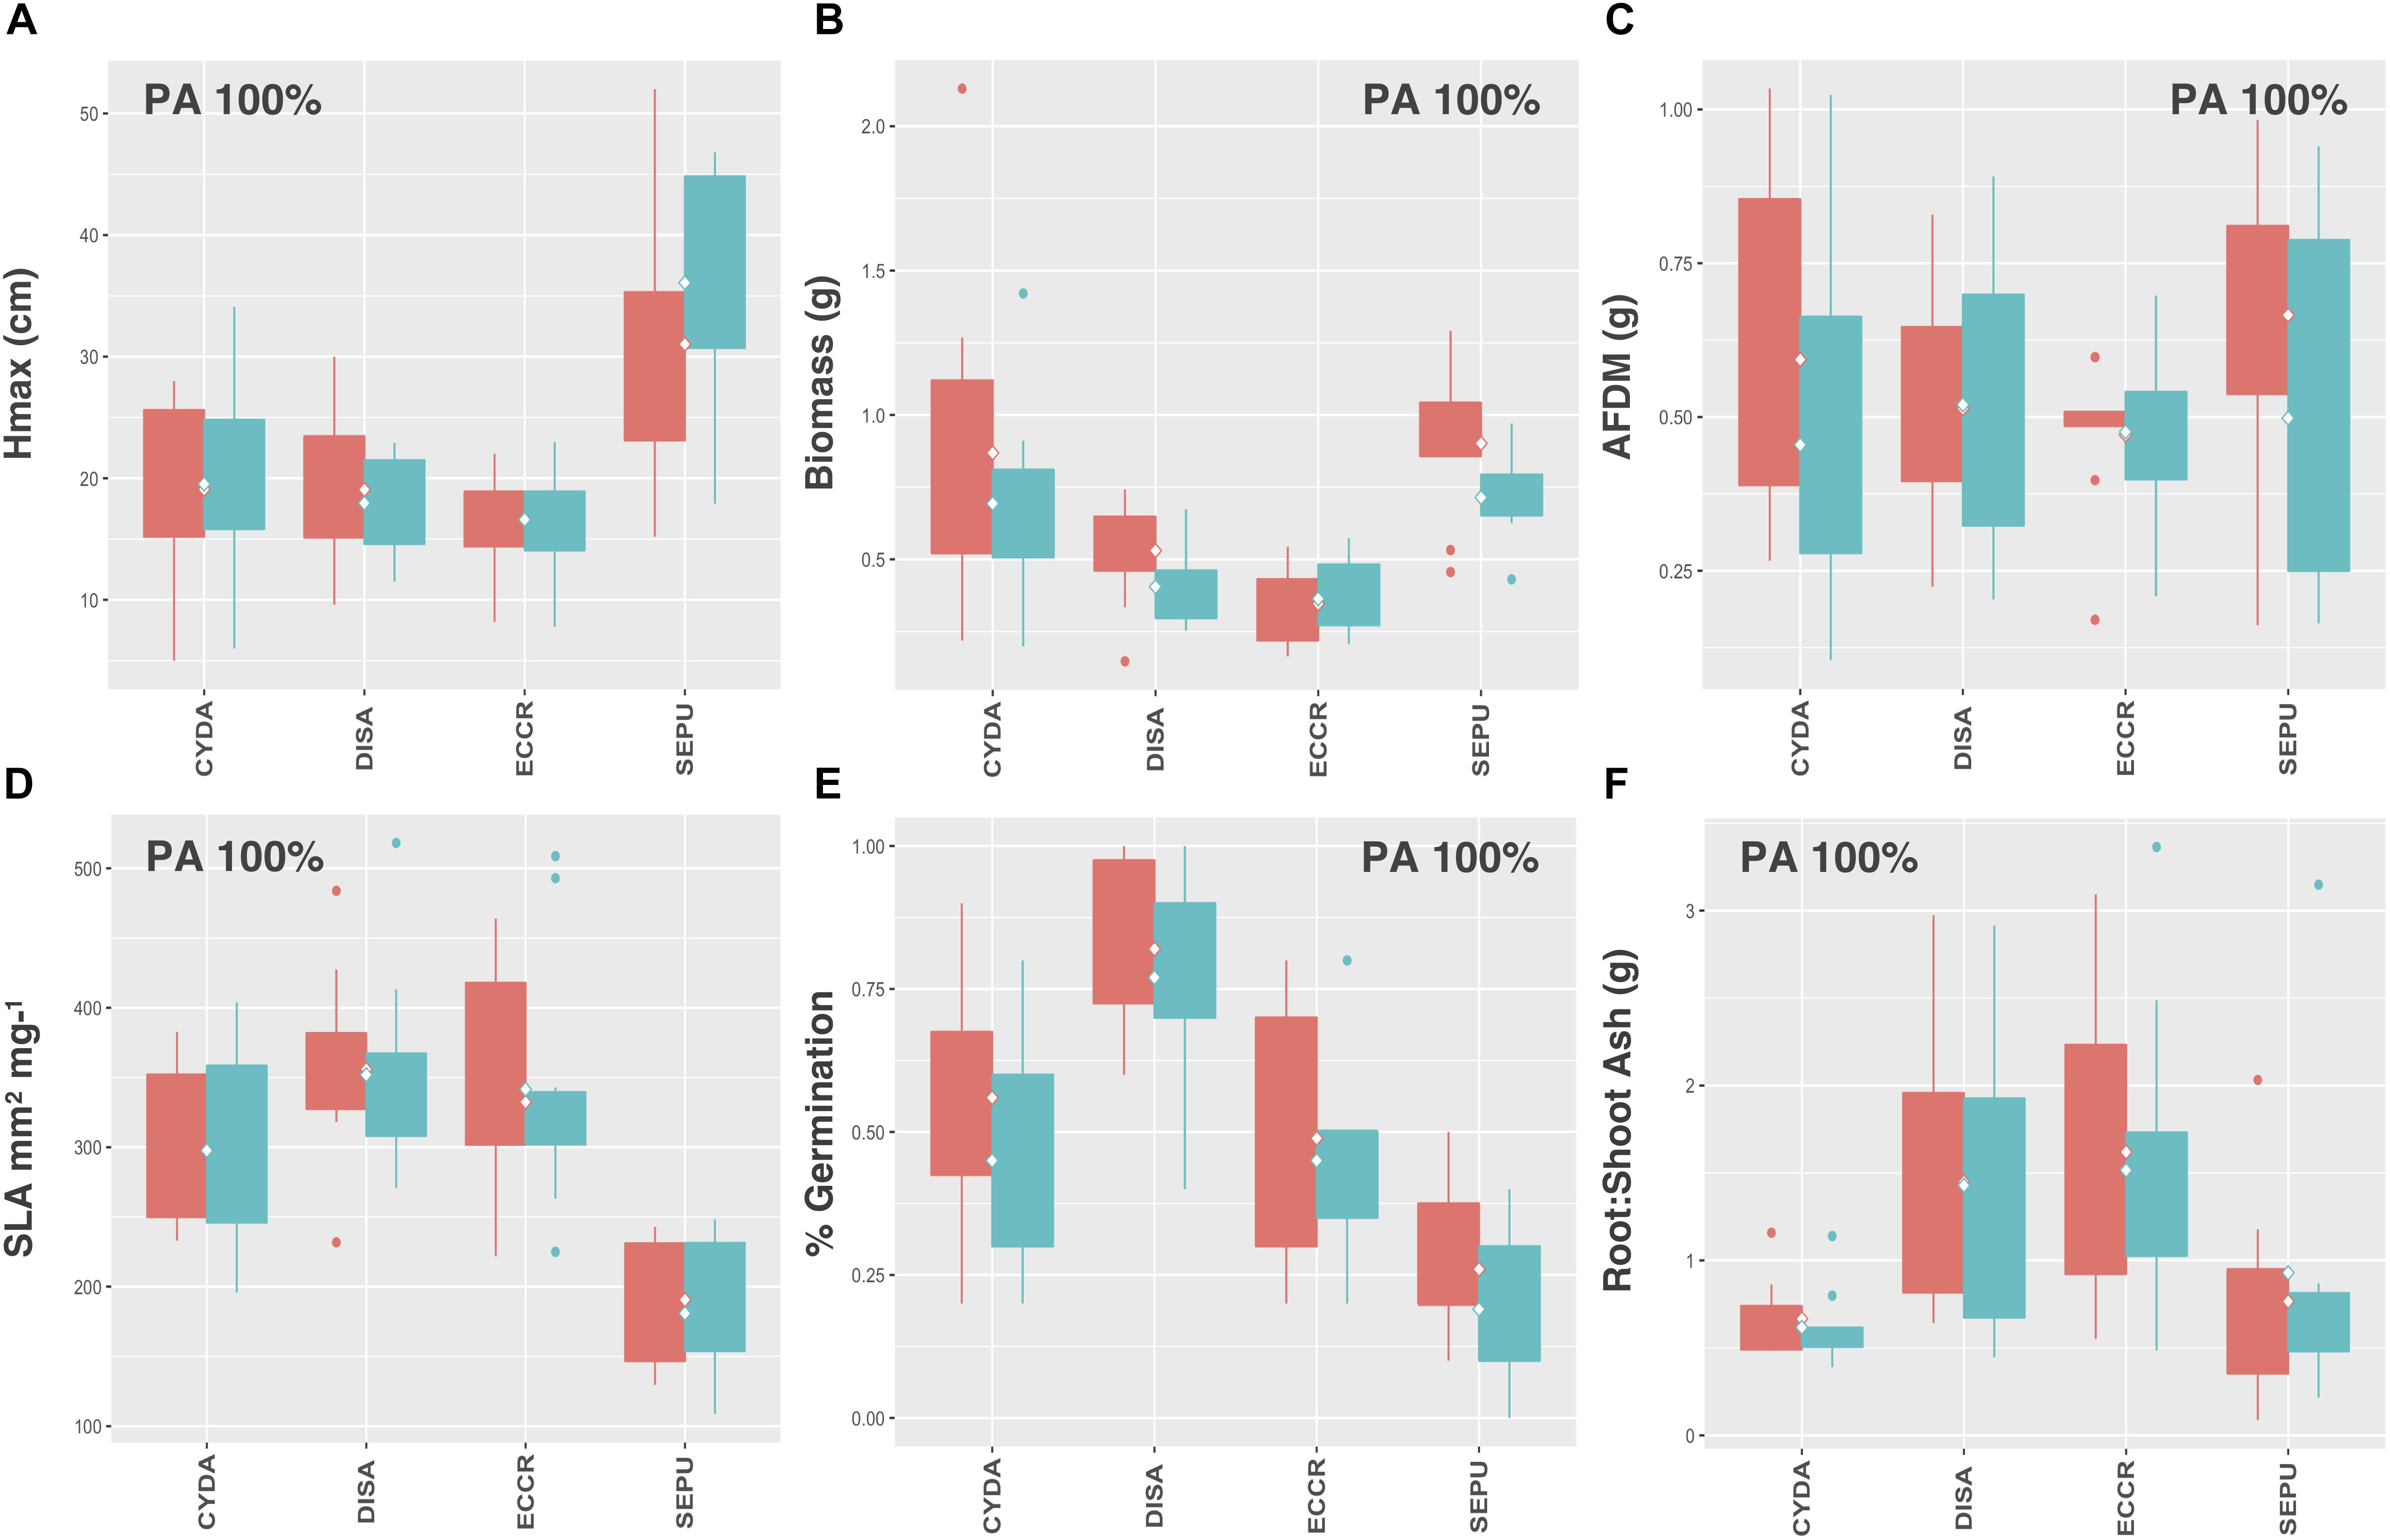
Figure 5. C4 species trait values for (A) Hmax, (B) aboveground biomass, (C) root AFDM, (D) SLA, (E) germination success, (F) root:shoot ratio. Only preadaptation (PA) is displayed in the boxplots, as all species utilizing C4 photosynthesis exhibited this functional response, and across all traits. Boxplots showing mean (white diamond), interquartile range (box), minimum and maximum (whiskers) and outliers (dots) between urban (red) and potting soil (blue). (Note: medians not shown). For clarity, boxplots were sub-grouped according to functional response type, i.e., (1) preadaptation (PA), (2) trait divergence (TD U, TD P), (3) trait constriction (TC U, TC P), and (4) mixed response. “U” and “P” labels indicate proportional differences between urban and potting soil within a functional response group. Specifically, TD U (“trait divergence urban”) represents the proportion of species that exhibited trait divergence with higher mean values in urban soil; whereas, TD P (“trait divergence potting”) represents the proportion of species with higher mean trait values in potting soil. TC U (“trait constriction urban”) indicates a narrower range of trait values in urban soil treatments compared to potting soil; conversely, TC P (“trait constriction potting”) indicates constrained trait values in potting soil. Percentages display the proportion of species exhibiting each functional response. Species are coded according to the first two letters of the genus and the species name (see Supplementary Table S3 for a list of species and associated code).
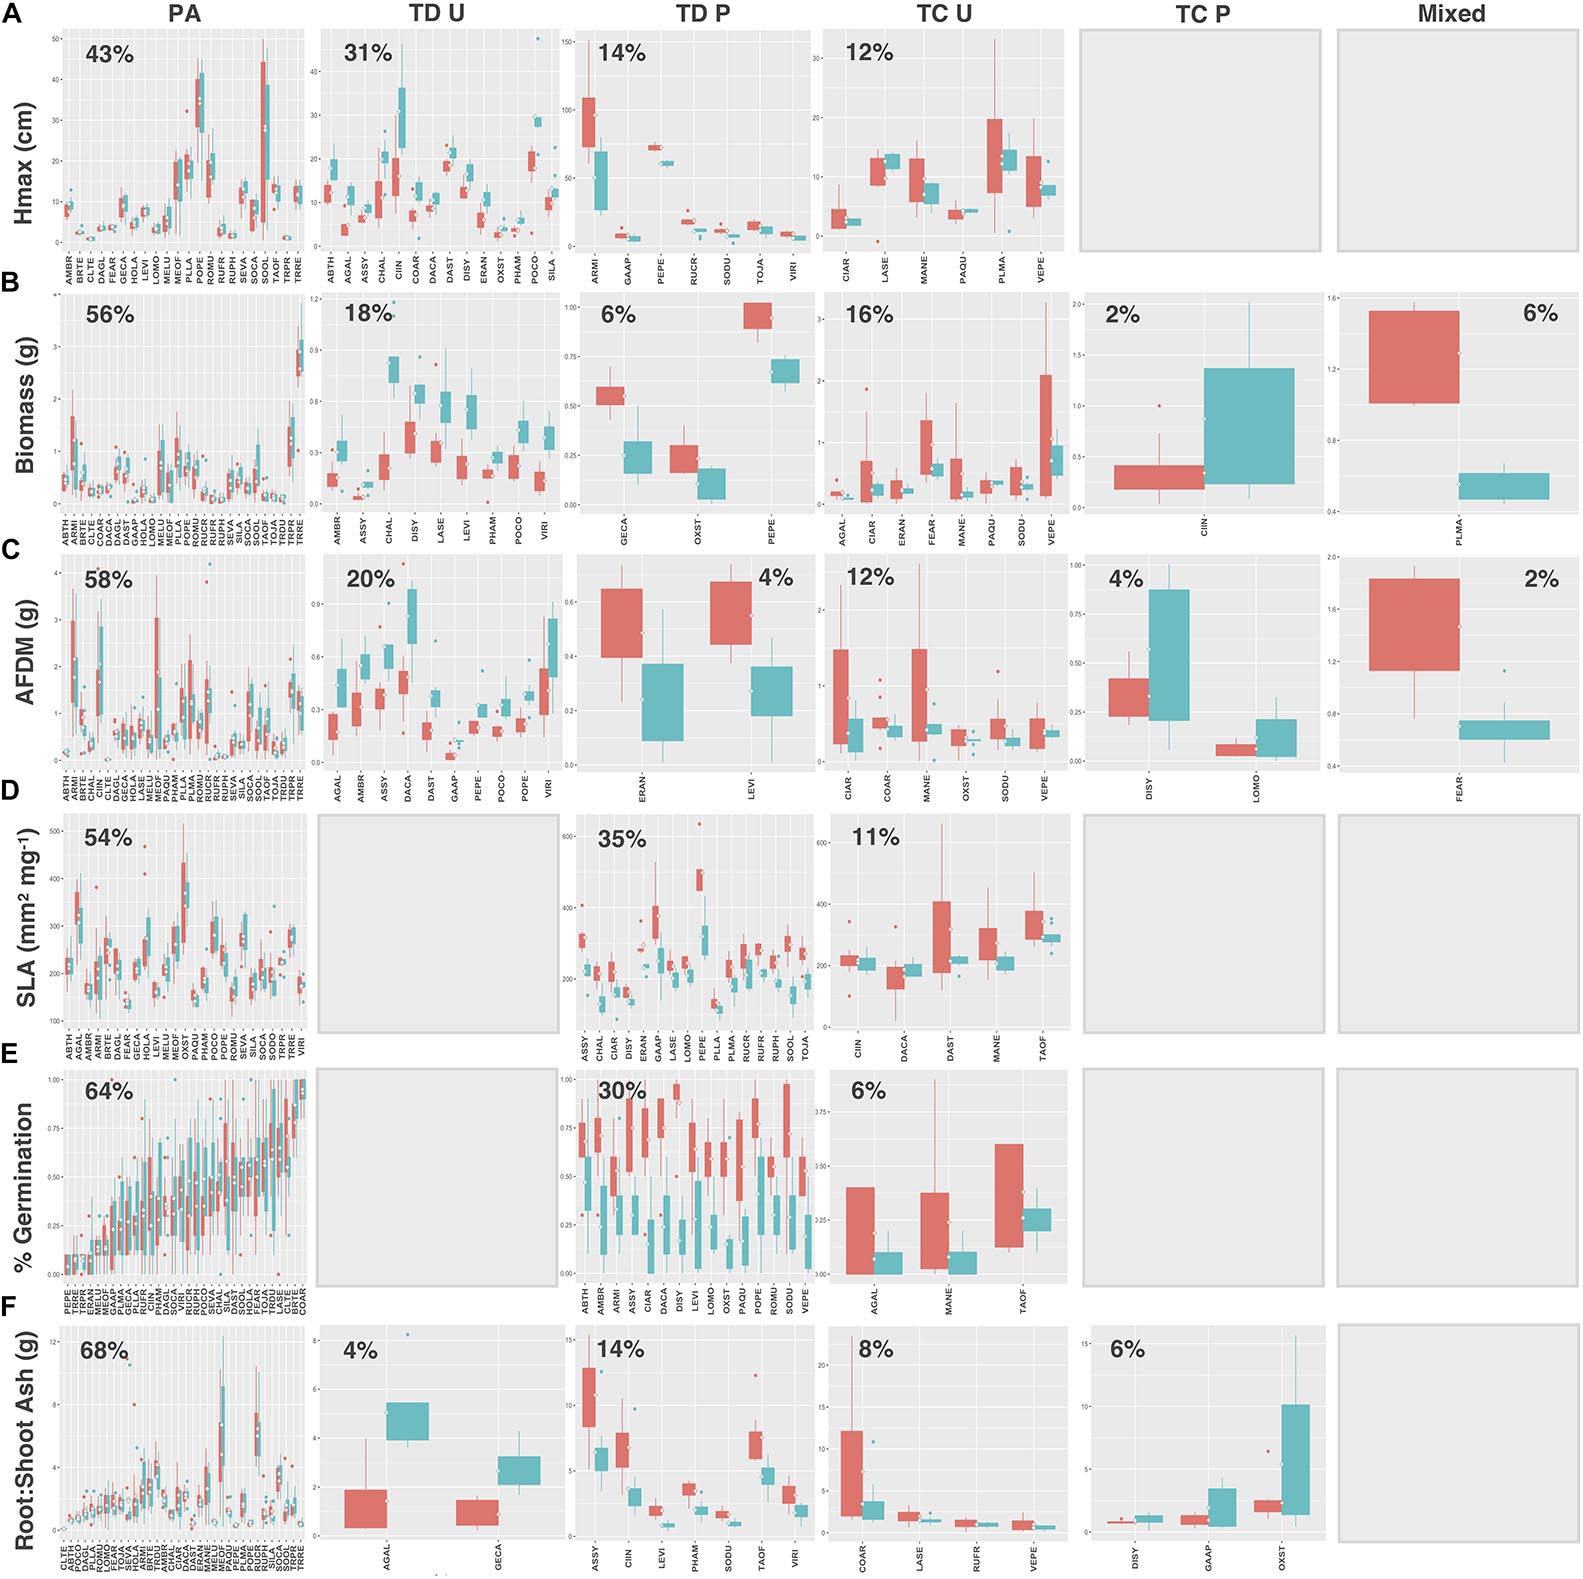
Figure 6. C3 species trait values for (A) Hmax, (B) aboveground biomass, (C) root AFDM, (D) SLA, (E) germination success, (F) root:shoot ratio. Blank plots indicate that no species exhibited the associated functional response. Boxplots showing mean (white diamond), interquartile range (box), minimum and maximum (whiskers), and outliers between urban (red) and potting soil (blue). (Note: medians not shown). For clarity, boxplots were sub-grouped according to functional response type, i.e., (1) preadaptation (PA), (2) trait divergence (TD U, TD P), (3) trait constriction (TC U, TC P), and (4) mixed response. “U” and “P” labels indicate proportional differences between urban and potting soil within a functional response group. Specifically, TD U (“trait divergence urban”) represents the proportion of species that exhibited trait divergence with higher mean values in urban soil; whereas, TD P (“trait divergence potting”) represents the proportion of species with higher mean trait values in potting soil. TC U (“trait constriction urban”) indicates a narrower range of trait values in urban soil treatments compared to potting soil; conversely, TC P (“trait constriction potting”) indicates constrained trait values in potting soil. Percentages display the proportion of species exhibiting each functional response. Species are coded according to the first two letters of the genus and the species name (see Supplementary Table S3 for a list of species and associated code).
Natives exhibited higher proportions of trait divergence for Hmax (64%), aboveground biomass (55%), root AFDM (54%), germination success (36%), and root:shoot ratio (55%), relative to introduced species, which showed higher proportions of preadaptation for all traits except SLA (introduced species: 33%; natives: 73%) (Figures 7, 8A–F). Mixed response was the least common functional response among both native and introduced species. No native species exhibited changes in both the mean and variance; whereas, only 2 introduced species, Plantago major L. and Festuca arundinacea Schreb., exhibited a mixed response, and only for aboveground biomass and root AFDM, respectively (Figures 8B,C). Native and introduced species showed slightly higher proportions of trait constriction (9–27%) compared to introduced species (5–17%). Between both groups, decreased variance in urban soil was the most common trait constriction response.
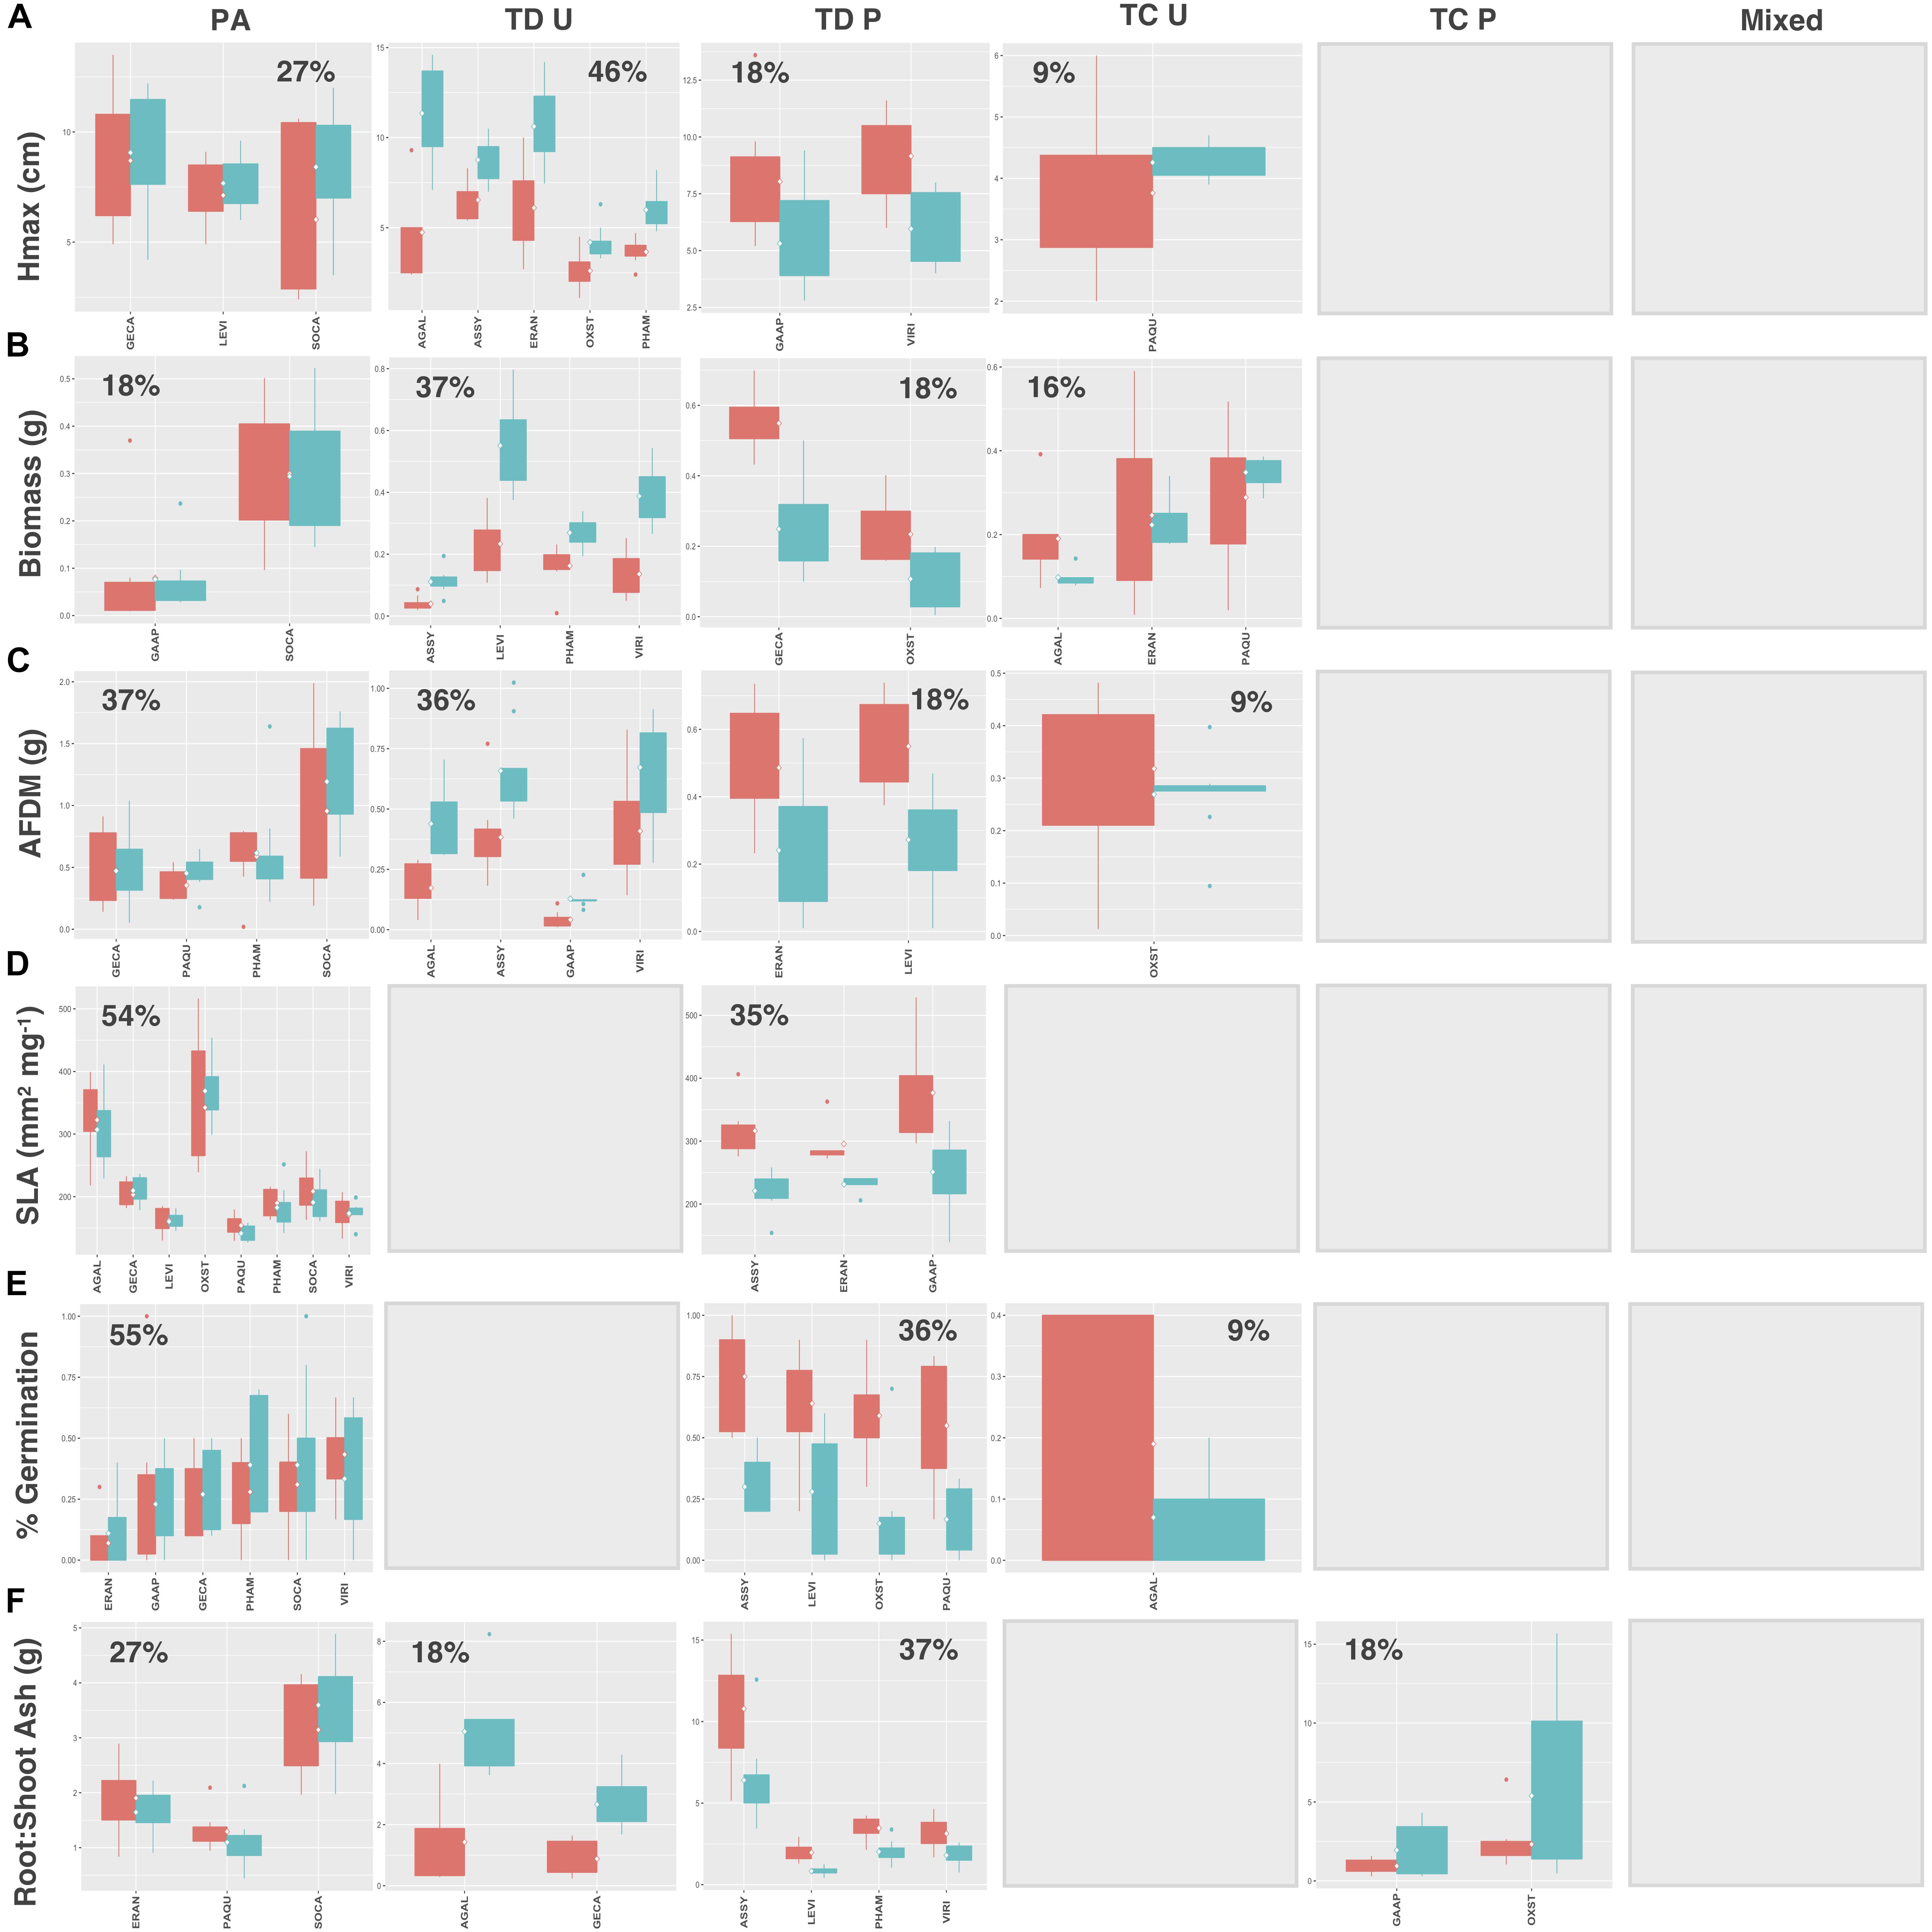
Figure 7. Native species trait values for (A) Hmax, (B) aboveground biomass, (C) root AFDM, (D) SLA, (E) germination success, (F) root:shoot ratio. Blank plots indicate that no species exhibited the associated functional response. Boxplots showing mean (white diamond), interquartile range (box), minimum and maximum (whiskers), and outliers between urban (red) and potting soil (blue). (Note: medians not shown). For clarity, boxplots were sub-grouped according to functional response type, i.e., (1) preadaptation (PA), (2) trait divergence (TD U, TD P), (3) trait constriction (TC U, TC P), and (4) mixed response. “U” and “P” labels indicate proportional differences between urban and potting soil within a functional response group. Specifically, TD U (“trait divergence urban”) represents the proportion of species that exhibited trait divergence with higher mean values in urban soil; whereas, TD P (“trait divergence potting”) represents the proportion of species with higher mean trait values in potting soil. TC U (“trait constriction urban”) indicates a narrower range of trait values in urban soil treatments compared to potting soil; conversely, TC P (“trait constriction potting”) indicates constrained trait values in potting soil. Percentages display the proportion of species exhibiting each functional response. Species are coded according to the first two letters of the genus and the species name (see Supplementary Table S3 for a list of species and associated code).
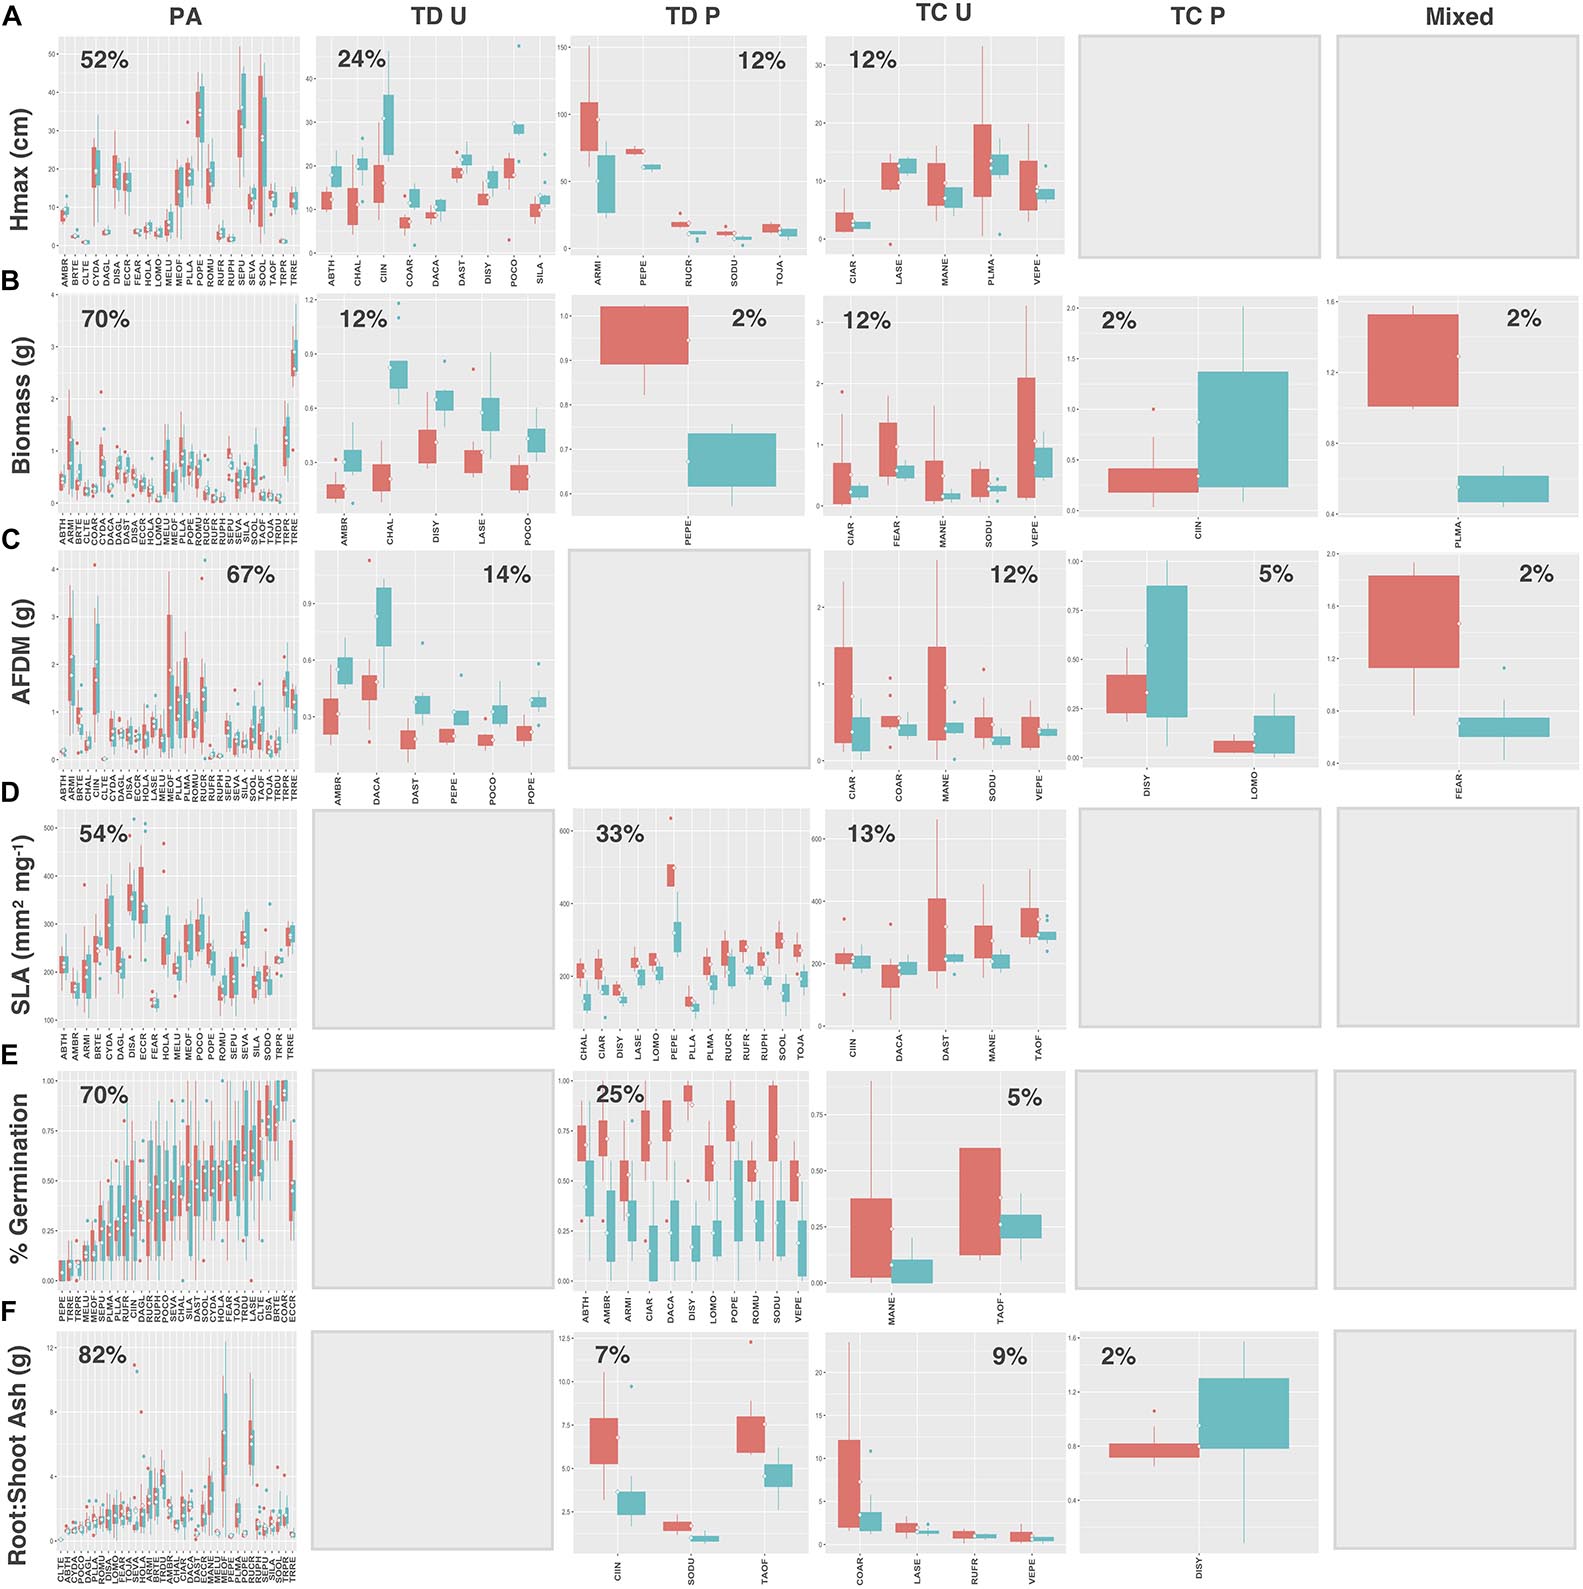
Figure 8. Introduced species trait values for (A) Hmax, (B) aboveground biomass, (C) root AFDM, (D) SLA, (E) germination success, (F) root:shoot ratio. Blank plots indicate that no species exhibited the associated functional response. Boxplots showing mean (white diamond), interquartile range (box), minimum and maximum (whiskers), and outliers between urban (red) and potting soil (blue). (Note: medians not shown). For clarity, boxplots were sub-grouped according to functional response type, i.e., (1) preadaptation (PA), (2) trait divergence (TD U, TD P), (3) trait constriction (TC U, TC P), and (4) mixed response. “U” and “P” labels indicate proportional differences between urban and potting soil within a functional response group. Specifically, TD U (“trait divergence urban”) represents the proportion of species that exhibited trait divergence with higher mean values in urban soil; whereas, TD P (“trait divergence potting”) represents the proportion of species with higher mean trait values in potting soil. TC U (“trait constriction urban”) indicates a narrower range of trait values in urban soil treatments compared to potting soil; conversely, TC P (“trait constriction potting”) indicates constrained trait values in potting soil. Percentages display the proportion of species exhibiting each functional response. Species are coded according to the first two letters of the genus and the species name (see Supplementary Table S3 for a list of species and associated code).
Functional Responses Across Traits (H4)
When species and functional groups were collectively assessed for each measured trait, patterns in the proportion of species exhibiting each functional response were analogous (Figures 9A–F). In general, preadaptation was the dominant functional response across all traits, with 46–70% of the urban species pool exhibiting no change in the mean or variance of trait values between soil types. Trait divergence was the second most common response (22–40%) followed by trait convergence (5–17%). Species exhibiting trait divergence patterns generally grew taller and had greater aboveground biomass and root AFDM (although non-significant) in urban soil, while having higher average germination success, SLA, and root:shoot ratios in potting soil. Trait constriction patterns indicated that most species exhibited decreased variance in urban soil for all traits. As reported previously, the mixed functional response, was consistently underrepresented in our urban vacant land species pool, with only two species (2%) exhibiting changes in both the mean and variance of trait values for aboveground biomass and root AFDM. Hmax, SLA, and germination traits did not have any species showing a mixed functional response (Figures 9A,D,E, respectively).
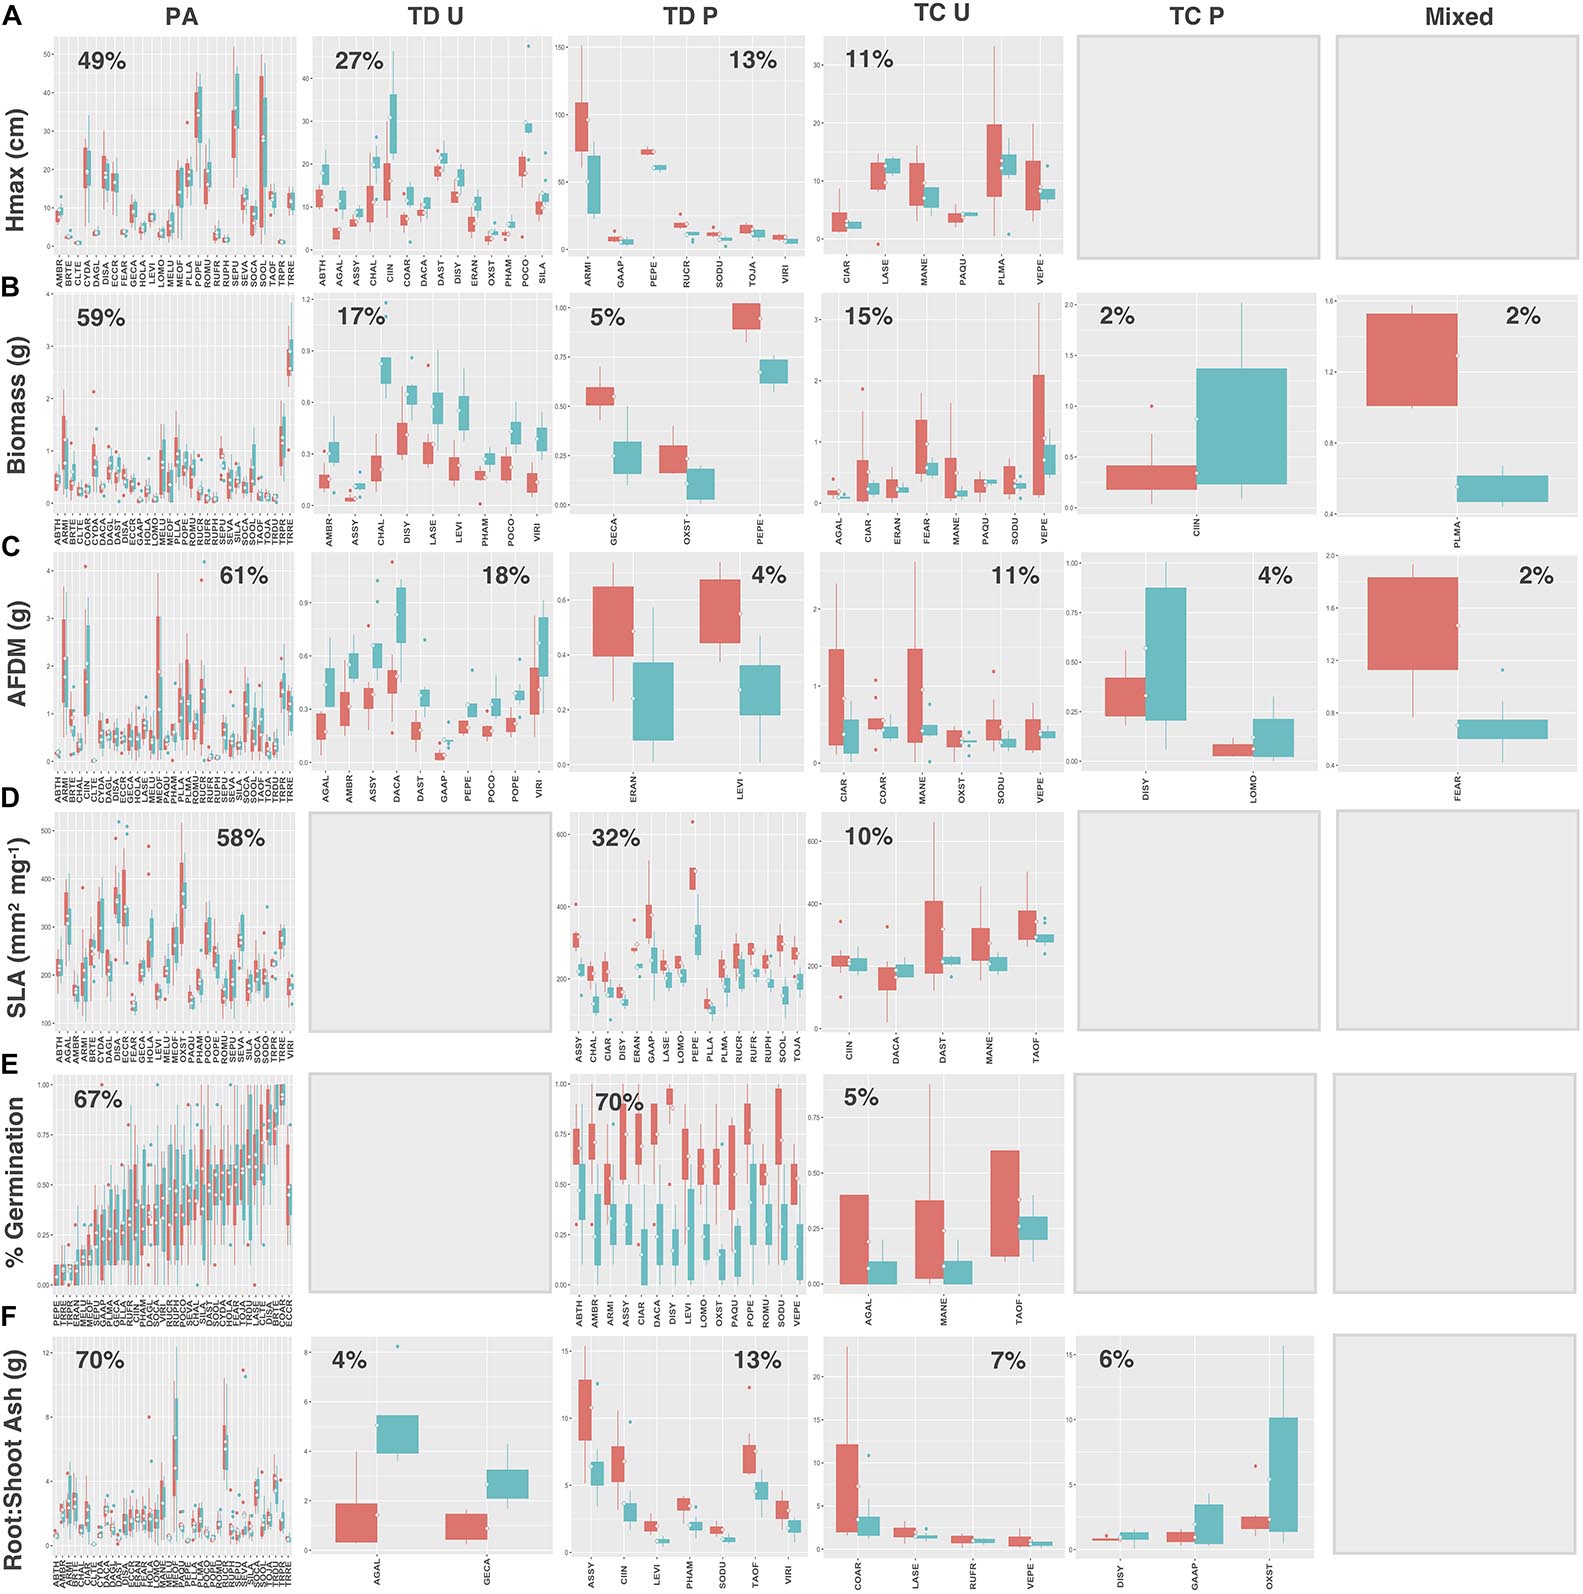
Figure 9. Trait values for (A) Hmax, (B) aboveground biomass, (C) root AFDM, (D) SLA, (E) germination success, (F) root:shoot ratio across all species. Boxplots showing mean (white diamond), interquartile range (box), minimum and maximum (whiskers) and outliers (dots) of trait values for all species in urban (red) and potting soil (blue). (Note: medians not shown). For clarity, boxplots were sub-grouped according to functional response type, i.e., (1) preadaptation (PA), (2) trait divergence (TD U, TD P), (3) trait constriction (TC U, TC P), and (4) mixed response. “U” and “P” labels indicate proportional differences between urban and potting soil within a functional response group. Specifically, TD U (“trait divergence urban”) represents the proportion of species that exhibited trait divergence with higher mean values in urban soil; whereas, TD P (“trait divergence potting”) represents the proportion of species with higher mean trait values in potting soil. TC U (“trait constriction urban”) indicates a narrower range of trait values in urban soil treatments compared to potting soil; conversely, TC P (“trait constriction potting”) indicates constrained trait values in potting soil. Percentages display the proportion of species exhibiting each functional response. Species are coded according to the first two letters of the genus and the species name (see Supplementary Table S3 for a list of species and associated code). Blank plots indicate that no species exhibited the associated functional response.
Discussion
Within-Species Variation (ITV) Plays an Important Role in Functional Trait Patterns (H1)
In our study, we found that soil type and species had a strong effect on most measured traits (except for soil on root AFDM), indicating that both local soil conditions and species identity collectively influence mean trait values. Although soil had a significant effect on most traits, a greater proportion of the variance was explained by species. These results broadly support the use of functional traits as a comprehensive tool for assessing how species respond to their environment. The utility of trait-based investigations has been corroborated by numerous studies that identified key associations between plant species’ traits and, for example, invasiveness (Grotkopp et al., 2002; Hamilton et al., 2005), soil fertility (Bergholz et al., 2015), habitat disturbance (Haddad et al., 2008), and urbanization (Duncan et al., 2011; Kalusová et al., 2016). These studies, however, characterized species or groups of functionally similar species according to mean trait values. By decomposing the species factor in our model into within-species (ITV), between-species (BTV), and functional group (FGTV) levels, we found that ITV explained a substantial proportion of the variance in most traits. Furthermore, variance decomposition patterns were trait-specific. These results suggest that different processes operating at each ecological level uniquely influence trait variation patterns (Vilà-Cabrera et al., 2015). A global meta-analysis of plant traits sampled from 44 natural and semi-natural areas by Siefert et al. (2015) also found that plant functional traits are unevenly variable. In contrast to our study, however, the authors found that, within communities, ITV was greater for whole-plant traits, such as height, than leaf morphological traits (e.g., SLA, leaf area, and thickness). This discrepancy may indicate that, compared to more natural systems, urban environments differentially influence the degree of trait variation at within- and between-species levels. Although the literature has identified relationships between several of the traits in our study, which could influence observed relationships at each ecological level (ITV, BTV, FGTV), Pearson correlation results showed that strong correlations (| r| > 0.07) were only evident at the coarsest level, FGTV (Supplementary Table S4), suggesting that ITV and BTV trait patterns were independent.
Overall, we found support for our hypotheses that ITV plays an important role in influencing functional trait patterns (H1a) and variance decomposition patterns differ among functional traits (H1b). Our results contradict the general assumption that functional variation between species (BTV) or functional groups (FGTV) is inherently greater, and thus more informative than within-species variation (ITV). Several prior studies have substantiated our results in flooded meadows (Jung et al., 2010), subalpine grasslands (Jung et al., 2013), and Mediterranean (Vilà-Cabrera et al., 2015) and tropical forests (Hulshof and Swenson, 2010; Messier et al., 2010), but this study is the first, to our knowledge, to consider the role of trait variation across nested ecological levels of a large urban plant species pool, consisting of 54 species. In contrast to our findings, the majority of prior studies showed that between-species variation (BTV) was still greater than individual variation within-species (ITV) (but see Harzé et al., 2016). This indicates that trait variation may not only differ among species and traits but that different environments can also influence the relative degree of BTV and ITV (Harzé et al., 2016). Within-species variation, therefore, should not be considered as a replacement for species-level measures, but including it in trait-based studies can strengthen the signal of trait-environment relationships (Jung et al., 2013; Kraft et al., 2014), particularly for traits that vary most among individuals, such as germination success.
We could not find any studies that examined variation at the functional group level, however, Vilà-Cabrera et al. (2015) showed that grouping species by family explained more variance than between- and within-species levels, although it should be noted that only two family groups were considered in their study. Conversely, Siefert et al. (2015) found that growth form (woody vs. herbaceous) could not reliably explain patterns in ITV. In our study, variance partitioning at the functional group level (FGTV) was consistently low for most traits. These findings suggest trait conservatism is high among closely related species, but this association does not extend to species that share similar functional strategies. Low trait conservatism at the functional group level thus challenges the validity of relying on higher-level functional groupings for understanding and predicting biodiversity patterns, community dynamics, and responses to environmental change in urban ecosystems.
Functional Response Patterns Differ According to Functional Group
Photosynthetic Pathway (H2)
The rank order of dominance in functional responses was consistent across functional groups and traits, except for C4 species and legumes. In general, preadaptation was the most common functional response, followed by trait divergence and trait constriction. Mixed functional response was consistently underrepresented in all species groups. As predicted, we found that legumes and species utilizing C4 photosynthesis exclusively exhibited preadaptation across all traits (H1a), whereas higher proportions of trait divergence and trait constriction were evident in species with more general strategies (i.e., C3 species) (H2b).
These results indicate that species in different functional groups rely on various strategies for establishing and persisting in urban environments. C4 photosynthesis is a specialized strategy common in warm, dry environments where plants must balance their capacity to fix CO2 with water loss via transpiration by limiting photorespiration (Sage, 2004). Representative C4 species in our vacant lot species pool included Cynodon dactyon (L.) Pers., Digitaria sanguinalis (L.) Scop., Echinochloa crus-galli (L.) P.Beauv., and Setaria pumila (Poir.) Roem. & Schult. All of these species are introduced grasses that are native to tropical or warm temperate regions of Europe, Asia, and Africa (CABI, 2018) where C4 photosynthesis is an adaptive trait. C4 photosynthesis also confers a fitness and competitive advantage in urban environments, which have higher ambient temperatures than surrounding non-urban areas, as well as dry, compacted soil conditions, which are typical of many urban vacant land habitats (Johnson et al., 2015).
Legumes in our study pool included Medicago lupulina L., Melilotus officinalis (L.) Pall., Securigera varia (L.) Lassen, Trifolium pratens L., and Trifolium repens L. The ability to fix nitrogen via mutualistic relationships with bacteria offers legumes a competitive advantage in nitrogen deficient soils. Legumes are thus often prevalent in newly disturbed habitats with poor soil conditions. Over time, as soil nutrient conditions improve these early-successional species are replaced by competitively dominant perennial forbs and grasses (Tilman, 1982; Bazzaz, 1996). This suggests that competition from later-successional species has a stronger influence on the establishment and persistence of legumes in urban vacant environments than environmental filtering effects, which further explains why these species did not adjust their trait values in response to different soil conditions, when grown individually under experimental conditions.
We note that substantially more C3 and introduced species (50 and 43 species, respectively) were present in our urban vacant lot species pool, compared to species utilizing C4 photosynthesis (4 species), legumes (5 species), and native species (11 species). Typically, such disparities in sampled group numbers presents a statistical challenge associated with unbalanced comparisons (Shaw and Mitchell-Olds, 1993). Species numbers in our functional groups, however, are proportional to estimates found in most environments. C4 photosynthesis, for example, is only found in 3% of all terrestrial plant species and is most common in graminoids (Sage et al., 1999; Sage, 2004). Although legumes have historically been an important crop species in global agriculture production, due to their fast growth and ability to replenish soil nitrogen, outside of human use, they do not dominate most natural ecosystems (Cohn et al., 1989; Tow and Lazenby, 2001). Several urban studies have also found that the proportion of introduced plant species increases compared to natives along an urbanization gradient (Pyšek, 1993; Kowarik, 1995; Aronson et al., 2014). Because our study was aimed at characterizing general patterns in trait variation and functional responses of urban plant species, it was more important that our sampled species pool was representative of plant communities in urban vacant land rather than having balanced comparisons.
Native and Introduced Species (H3)
Native and introduced species exhibited different functional response patterns between soil types. In general, trait divergence was more commonly associated with natives, compared to introduced species, which exhibited higher proportions of preadaptation. Patterns were consistent across all traits, except SLA, which showed equal proportions of trait divergence between natives and introduced species, and had a higher proportion of preadapted natives than introduced species. These results contradict our hypothesis that introduced and native species will show similar functional responses, based on the rationale that urban plant species often have similar ruderal strategies that allow them to persist in heterogeneous habitats with high rates of disturbance (Sukopp and Werner, 1983).
Our results thereby suggest that natives and introduced species rely on different strategies for establishing and persisting in urban vacant lot habitats. In particular, phenotypic plasticity and/or genetic-based differences may allow native species to respond to variable environmental conditions between native and “engineered” urban soils with human-mediated legacy effects. Conversely, introduced species that exhibited analogous trait patterns between soil types may be successful in urban vacant lot habitats because they are adapted to similar conditions in their native range. In fact, the majority of introduced species in our urban vacant lot species pool originate from warm and seasonally dry regions of northern Africa, Europe, and Asia (Supplementary Table S3), thus in urban habitats, which are often characterized by highly-compacted, exposed, and dry soil conditions, the expression of similar sets of optimal trait values is likely to confer a fitness advantage.
Our results differ from several studies that compared functional trait patterns of natives and invasive species. For example, Bossdorf et al. (2008) found that invasive populations of a widespread urban plant species (Senecio inaequidens D.C.) displayed high phenotypic plasticity, despite having lower genetic diversity. In contrast, Godoy et al. (2011) found that invasive species and native congeners had similarly high capacities for phenotypic plasticity; although, invasives had mean trait values that enhanced overall performance over a wider-range of environmental conditions, which corresponds with the general concept of preadaptation. Other studies have found that differences in environmental factors between native and introduced ranges strongly limit invasion success, with the majority of introduced species (66.6%) showing decreased performance outside of their native range (Colautti et al., 2014). Thus, observed differences in functional responses between native and introduced species may be a combined function of intrinsic variations in trait expression and extrinsic factors associated with habitat-matching between native and introduced ranges.
Our study focuses on urban plant populations, which have seldom been investigated in an experimental context. However, an increasingly well-documented series of urban evolution studies have found that strong urban environmental pressures can induce dramatic evolutionary changes over relatively short timescales. For example, Cheptou et al. (2008) found that Crepis sancta (L.) Bornm. – a common urban plant species with heteromorphic seeds – is capable of evolving different seed dispersal mechanisms in response to habitat isolation after only five generations. Although the time of introduction is not documented for most of our species, many urban plants were introduced via trade or agricultural practices that were in place prior to urbanization (Baker, 1986; Mack, 1991). Therefore, it is possible that the observed functional trait patterns in our species pool may not be a consequence of inherent differences associated with status (native vs. introduced), but more recent adaptive evolutionary changes that occurred after introduction by humans. This potential factor emphasizes the need for more studies focused on mapping the evolutionary history of urban plant species, as well as their capacity for different functional responses, in order to better understand how urban environments influence plant species over time.
Likewise, the potential importance of succession in driving functional trait patterns should not be overlooked. Here we characterized species according to different functional groups, however, it’s likely that species grouped by successional type (i.e., early-successional vs. late-successional species) would display unique patterns in functional responses. Early-successional species, for example, are likely to display greater variability in traits – a strategy that confers an adaptive advantage in changing environments – whereas, trait variation is likely to decrease in late-successional species, as habitat conditions stabilize over time.
Trait Patterns (H4)
Although preadaptation was the most common functional response among study traits, trait divergence was associated more with Hmax, germination success, and SLA than other measured traits. These results support our hypothesis that a greater proportion of species will exhibit significant shifts in mean trait values for these traits. Vegetative traits have been identified as having a high capacity for phenotypic plasticity in some plant species in response to nutrients, light availability, and other environmental variables (Pigliucci et al., 1997; Meziane and Shipley, 1999; Rozendaal et al., 2006; Gratani, 2014). Likewise, germination and seedling development are more closely associated with local abiotic factors, such as soil moisture and organic matter, than biomass-associated traits (e.g., aboveground biomass, root AFDM, root:shoot ratio), which are strongly influenced by competition for water and nutrients (Zobel and Zobel, 2002 and references therein). Soil analysis results showed that urban vacant lot soil had higher pH and lower% moisture, organic matter, and secondary macronutrient concentrations (i.e., calcium, Ca; magnesium, Mg; and potassium, K) than potting soil (Supplementary Figure S1 and Supplementary Table S2). Under these urban conditions, plants are expected to allocate more resources to water conservation strategies (e.g., decreased SLA) and root production at the expense of aboveground growth and stem elongation. Likewise, in dry, nutrient poor soils, germination success is expected to be low; particularly for small-seeded, ruderal species – which make up the majority of our species pool – that lack stored resources (endosperm) or protection from desiccation in the form of a thick seed coat (Leishman et al., 2000 and references therein).
Interestingly, our study results did not fully conform to expected trait patterns; in general, species that exhibited trait divergence had lower germination success and SLA, but greater Hmax in urban soil, compared to potting mix. This suggests that although plant species may have overall lower germination success in vacant lot habitats, once established, they implement strategies for persisting under unfavorable conditions, including decreasing leaf lamina size and/or increasing thickness to conserve water, as well as allocating resources to vertical growth, even in low soil nutrient conditions. Although fewer species exhibited trait divergence for aboveground biomass and root:shoot ratio, there were significant trends for these traits; namely, species tended to have greater aboveground biomass and lower root:shoot ratios in urban soil, compared to potting mix. This is not surprising given that above- and belowground vegetative traits are strongly correlated (although correlations among Hmax, aboveground biomass, and root:shoot ratio were only evident at the functional group level in our study) and, thus, respond predictably under different environmental conditions.
Overall, the observed differences in functional responses of traits support the conclusion that community assembly processes can influence phenotypes in different ways, and along independent axes of plant function (Swenson, 2013). Although we attempt to assess a variety of traits representing different functional strategies in our study, it is possible that incorporating a different set of functional traits would change our results and subsequent interpretations. Therefore, in order to gain a comprehensive understanding of community assembly patterns in different environments, we encourage future urban trait-based studies to compare functional responses of a range of traits under different environmental conditions.
Conclusion
Urbanization imposes strong environmental filtering effects that directly affect the establishment and persistence of plant species. Environmental effects not only influence mean differences in trait values between-species (BTV) – the ecological level most commonly considered in trait-based studies – but our study indicates that trait patterns in urban vacant lot plant communities are strongly influenced by within-species trait variation (ITV). In addition, within-species functional responses differed among functional groups, indicating that species employ different strategies for establishing and persisting in urban environments. Overall, our study establishes that trait responses to local environmental conditions vary among species and traits; therefore, future research should focus on drawing tighter links between different environmental conditions and species’ trait responses at different ecological levels. Specifically, the inclusion of intraspecific patterns relating to both the mean and variance of trait values will allow researchers to more accurately interpret species responses to human-modified environments and improve community assembly predictions.
Data Availability Statement
The raw data supporting the conclusions of this article will be made available by the authors, without undue reservation, to any qualified researcher.
Author Contributions
DB and CS conceived the ideas and study methodology, contributed critically to the drafts, and gave final approval for the publication. DB collected and analyzed the data, and led the writing of the manuscript.
Funding
This research was jointly funded by the NSF Long-term Ecological Research (LTER) Program (Grant No. DEB-1027188) and the NSF Sustainability Research Network (SRN) Cooperative Agreement (Grant No DEB-1444758). Any opinions, findings and conclusions or recommendations expressed in this material are those of the authors and do not necessarily reflect the views of the National Science Foundation.
Conflict of Interest
The authors declare that the research was conducted in the absence of any commercial or financial relationships that could be construed as a potential conflict of interest.
Acknowledgments
We thank Steven Pearce, Rikke Jepson, Stephen Sroka Jr., Amber Evans, Nicole Voelker, and April Sparkman for their invaluable assistance in the field and processing of samples in the laboratory.
Supplementary Material
The Supplementary Material for this article can be found online at: https://www.frontiersin.org/articles/10.3389/fevo.2020.00068/full#supplementary-material
References
Abramoff, M. D., Magalhaes, P. J., and Ram, S. J. (2004). Image Processing with ImageJ. Biophoton. Int. 11, 36–42.
Ågren, G. I., and Franklin, O. (2003). Root:shoot ratios, optimization and nitrogen productivity. Ann. Bot. 92, 795–800. doi: 10.1093/aob/mcg203
Arancon, N. Q., Edwards, C. A., Atiyeh, R., and Metzger, J. D. (2004). Effects of vermicomposts produced from food waste on the growth and yields of greenhouse peppers. Bioresour. Technol. 93, 139–144. doi: 10.1016/j.biortech.2003.10.015
Aronson, M. F. J., Handel, S. N., La Puma, I. P., and Clemants, S. E. (2014). Urbanization promotes non-native woody species and diverse plant assemblages in the New York metropolitan region. Urban Ecosyst. 18, 31–45. doi: 10.1007/s11252-014-0382-z
Auger, S., and Shipley, B. (2013). Inter-specific and intra-specific trait variation along short environmental gradients in an old-growth temperate forest. J. Vegetation Sci. 24, 419–428. doi: 10.1111/j.1654-1103.2012.01473.x
Baker, H. G. (1965). “Characteristics and modes of origin of weeds,” in The Genetics of Colonizing Species, eds H. G. Baker and J. L. Stebbins (New York, NY: Academic Press), 147–168.
Baker, H. G. (1986). “Patterns of plant invasion in North America,” in Ecology of Biological Invasions in North America and Hawaii, eds H. A. Mooney and J. A. Drake (New York, NY: Springer-Verlag), 44–57. doi: 10.1007/978-1-4612-4988-7_3
Baltimore Housing (n.d.). Housing Authority of Baltimore City: Department of Housing and Community Development. Available online at: http://www.baltimorehousing.org/vtov_faq Google Scholar
Bardgett, R. D., Mommer, L., and De Vries, F. T. (2014). Going underground: root traits as drivers of ecosystem processes. Trends Ecol. Evol. 129, 692–699. doi: 10.1016/j.tree.2014.10.006
Baskin, C. C., and Baskin, J. M. (1998). Seeds – Ecology, Biogeography, and Evolution of Dormancy and Germination. San Diego, CA: Academic Press.
Bazzaz, F. A. (1996). Plants in Changing Environments: Linking Physiological, Population, and Community Ecology. Cambridge: Cambridge University Press.
Becker, B., Leisnham, P. T., and LaDeau, S. L. (2014). A tale of two city blocks: differences in immature and adult mosquito abundances between socioeconomically different urban blocks in Baltimore (Maryland, USA). Int. J. Environ. Res. Public Health 11, 3256–3270. doi: 10.3390/ijerph110303256
Bergholz, K., Jeltsch, F., Weiss, L., Pottek, J., Geißler, K., and Ristow, M. (2015). Fertilization affects the establishment ability of species differing in seed mass via direct nutrient addition and indirect competition effects. Oikos 124, 1547–1554. doi: 10.1111/oik.02193
Bloom, A. J., Chapin, I. I. I. T. S., and Mooney, H. A. (1985). Resource limitation in plants – an economic analogy. Annu. Rev. Ecol. Systemat. 16, 363–392. doi: 10.1146/annurev.es.16.110185.002051
Bolker, B. M., Brooks, M. E., Clark, C. J., Geange, S. W., Poulsen, J. R., Stevens, M. H. H., et al. (2009). Generalized linear mixed models: a practical guide for ecology and evolution. Trends Ecol. Evol. 24, 127–135. doi: 10.1016/j.tree.2008.10.008
Bolnick, D. I., Amarasekare, P., Araújo, M. S., Bürger, R., Levine, J. M., Novak, M., et al. (2011). Why intraspecific trait variation matters in community ecology. Trends Ecol. Evol. 26, 183–192. doi: 10.1016/j.tree.2011.01.009
Bonser, S. P., and Reader, R. J. (1995). Plant competition and herbivory in relation to vegetation biomass. Ecology 76, 2176–2183. doi: 10.2307/1941691
Bossdorf, O., Lipowsky, A., and Prati, D. (2008). Selection of preadapted populations allowed Senecio inaequidens to invade Central Europe. Divers. Distribut. 14, 676–685. doi: 10.1111/j.1472-4642.2008.00471.x
CABI (2018). Invasive Species Compendium. Wallingford: CAB International. www.cabi.org/isc
Calloway, R. M., Pennings, S. C., and Richards, C. L. (2003). Phenotypic plasticity and interactions among plants. Ecology 84, 1115–1128. doi: 10.1890/0012-9658(2003)084[1115:ppaiap]2.0.co;2
Carlucci, M. B., Debastiani, V. J., Pillar, V. D., and Duarte, L. D. S. (2015). Between- and within-species trait variability and the assembly of sapling communities in forest patches. J. Veg. Sci. 26, 21–31. doi: 10.1111/jvs.12223
Cheptou, P.-O., Carrue, O., Rouifed, S., and Cantarel, A. (2008). Rapid evolution of seed dispersal in an urban environment in the weed Crepis sancta. Proc. Natl. Acad. Sci. U.S.A. 105, 3796–3799. doi: 10.1073/pnas.0708446105
Clark, C. M., Flynn, D. F. B., Butterfield, B. J., and Reich, P. B. (2012). Testing the link between functional diversity and ecosystem functioning in a Minnesota grassland experiment. PLoS ONE 7:e52821. doi: 10.1371/journal.pone.0052821
Cohn, E. J., Van Auken, O. W., and Bush, J. K. (1989). Competitive interactions between Cynodon dactylon and Acacia smallii seedlings at different nutrient levels. Am. Midland Naturalist 121, 265–272.
Colautti, R., Parker, J. D., Cadotte, M. W., Pyšek, P., Brown, C. S., Sax, D., et al. (2014). Quantifying the invasiveness of species. NeoBiota 21, 7–27. doi: 10.3897/neobiota.21.5310
Cornelissen, J. H. C., Lavorel, S., Garnier, E., Díaz, S., Buchmann, N., Gurvich, D. E., et al. (2003). A handbook of protocols for standardised and easy measurement of plant functional traits worldwide. Austr. J. Bot. 51, 335–380.
de Bello, F., Lavorel, S., Lavergne, S., and Albert, C. H. (2013). Hierarchical effects of environmental filters on the functional structure of plant communities: a case study in the French Alps. Ecography 36, 393–402. doi: 10.1111/j.1600-0587.2012.07438.x
Dormann, C. F., Elith, J., Bacher, S., Buchmann, C., Carl, G., Carré, G., et al. (2013). Collinearity: a review of methods to deal with it and a simulation study evaluating their performance. Ecography 36, 27–46. doi: 10.1111/j.1600-0587.2012.07348.x
Duncan, R. P., Clemants, S. E., Corlett, R. T., Hahs, A. K., McCarthy, M. A., McDonnell, M. J., et al. (2011). Plant traits and extinction in urban areas: a meta-analysis of 11 cities. Glob. Ecol. Biogeogr. 20, 509–519. doi: 10.1111/j.1466-8238.2010.00633.x
Finch-Savage, W. E., and Leubner-Metzger, G. (2006). Seed dormancy and the control of germination. New Phytol. 171, 501–523.
Gaudet, C. L., and Keddy, P. A. (1988). A comparative approach to predicting competitive ability from plant traits. Nature 334, 242–243. doi: 10.1038/334242a0
Gedroc, J. J., McConnaughay, K. D., and Coleman, J. S. (1996). Plasticity in root/shoot partitioning: optimal, ontogenetic, or both? Funct. Ecol. 1, 44–50.
Godoy, O., Valladares, F., and Castro-Díez, P. (2011). Multispecies comparison reveals that invasive and native plants differ in their traits but not in their plasticity. Funct. Ecol. 25, 1248–1259. doi: 10.1111/j.1365-2435.2011.01886.x
Godoy, O., Valladares, F., and Castro-Díez, P. (2012). The relative importance for plant invasiveness of trait means, and their plasticity and integration in a multivariate framework. New Phytol. 195, 912–922. doi: 10.1111/j.1469-8137.2012.04205.x
Gratani, L. (2014). Plant phenotypic plasticity in response to environmental factors. Adv. Bot. 2014:17.
Gross, N., Börger, L., Duncan, R. P., and Hulme, P. E. (2013). Functional differences between alien and native species: do biotic interactions determine the functional structure of highly invaded grasslands? Funct. Ecol. 27, 1262–1272. doi: 10.1111/1365-2435.12120
Grotkopp, E., Rejmánek, M., and Rost, T. L. (2002). Toward a causal explanation of plant invasiveness: seedling growth and life-history strategies of 29 pine (Pinus) species. Am. Nat. 159, 396–419. doi: 10.1086/338995
Haddad, N. M., Holyoak, M., Mata, T. M., Davies, K. F., Melbourne, B. A., and Preston, K. (2008). Species’ traits predict the effects of disturbance and productivity on diversity. Ecol. Lett. 11, 348–356. doi: 10.1111/j.1461-0248.2007.01149.x
Hamilton, M. A., Murray, B. R., Cadotte, M. W., Hose, G. C., Baker, A. C., Harris, C. J., et al. (2005). Life-history correlates of plant invasiveness at regional and continental scales. Ecol. Lett. 8, 1066–1074. doi: 10.1111/j.1461-0248.2005.00809.x
Harzé, M., Mahy, G., and Monty, A. (2016). Functional traits are more variable at the intra-than inter-population level: a study of four calcareous dry-grassland plant species. Tuexenia 36, 321–336.
Hoffmann, A. A., and Merilä, J. (1999). Heritable variation and evolution under favourable and unfavourable conditions. Trends Ecol. Evol. 14, 96–101. doi: 10.1016/s0169-5347(99)01595-5
Holm, L., Pancho, J. V., Herberger, J. P., and Plucknett, D. L. (1979). A Geographical Atlas of World Weeds. New York, NY: John Wiley & Sons.
Holm, L. G., Plucknett, D. L., Pancho, J. V., and Herberger, J. E. (1977). The World’s Worst Weeds. Distribution and biology. Honolulu, HI: University Press of Hawaii.
Hulshof, C. M., and Swenson, N. G. (2010). Variation in leaf functional trait values within and across individuals and species: an example from a Costa Rican dry forest. Funct. Ecol. 24, 217–223. doi: 10.1111/j.1365-2435.2009.01614.x
Jiang, Z., and Ma, K. (2015). Environmental filtering drives herb community composition and functional trait changes across an elevational gradient. Plant Ecol. Evol. 148, 301–310. doi: 10.5091/plecevo.2015.1124
Johnson, A. L., Borowy, D., and Swan, C. M. (2018). Land use history and seed dispersal drive divergent plant community assembly patterns in urban vacant lots. J. Appl. Ecol. 178, 451–464.
Johnson, A. L., Tauzer, E. C., and Swan, C. M. (2015). Human legacies differentially organize functional and phylogenetic diversity of urban herbaceous plant communities at multiple spatial scales. Appl. Veg. Sci. 18, 513–527. doi: 10.1111/avsc.12155
Jung, V., Albert, C. H., Violle, C., Kunstler, G., Loucougaray, G., and Spiegelberger, T. (2013). Intraspecific trait variability mediates the response of subalpine grassland communities to extreme drought events. J. Ecol. 102, 45–53. doi: 10.1111/1365-2745.12177
Jung, V., Violle, C., Mondy, C., Hoffmann, L., and Muller, S. (2010). Intraspecific variability and trait-based community assembly. J. Ecol. 98, 1134–1140. doi: 10.1111/j.1365-2745.2010.01687.x
Kahmen, S., and Poschlod, P. (2004). Plant functional trait responses to grassland succession over 25 years. J. Veg. Sci. 15, 21–32. doi: 10.1111/j.1654-1103.2004.tb02233.x
Kahmen, S., and Poschlod, P. (2007). Germination success differ with respect to seed mass and germination season? Experimental testing of plant functional trait responses to grassland management. Ann. Bot. 101, 541–548. doi: 10.1093/aob/mcm311
Kalusová, V., Čeplová, N., and Lososová, Z. (2016). Which traits influence the frequency of plant species occurrence in urban habitat types? Urban Ecosyst. 20, 65–75. doi: 10.1007/s11252-016-0588-3
Kazakou, E., Vile, D., Shipley, B., Gallet, C., and Garnier, E. (2006). Co-variations in litter decomposition, leaf traits and plant growth in species from a Mediterranean old-field succession. Funct. Ecol. 20, 21–30. doi: 10.1111/j.1365-2435.2006.01080.x
Kowarik, I. (1995). “On the role of alien species in urban flora and vegetation,” in Plant Invasions: General Aspects and Special Problems, eds P. Pyšek, K. Prach, M. Rejmánek, and M. Wade (Amsterdam: SPB Academic Publishing), 85–103.
Kraft, N. J. B., Crutsinger, G. M., Forrestel, E. J., and Emery, N. C. (2014). Functional trait differences and the outcome of community assembly: an experimental test with vernal pool annual plants. Oikos 123, 1391–1399. doi: 10.1111/oik.01311
Langsrud, Ø (2003). ANOVA for unbalanced data: use type II instead of type III sums of squares. Stat. Comput. 13, 163–167.
Laughlin, D. C., Joshi, C., van Bodegom, P. M., Bastow, Z. A., and Fulé, P. Z. (2012). A predictive model of community assembly that incorporates intraspecific trait variation. Ecol. Lett. 15, 1291–1299. doi: 10.1111/j.1461-0248.2012.01852.x
Leishman, M. R., Wright, I. J., Moles, A. T., and Westoby, M. (2000). “The evolutionary ecology of seed size,” in Seeds—The Ecology of Regeneration in Plant Communities, 2nd Edn, ed. M. Fenner (Wallingford: CAB International), 31–57. doi: 10.1079/9780851994321.0031
Lenth, R. (2018). Emmeans: Estimated Marginal Means, Aka Least-Squares Means. R package version 1.2.1. Available at: https://CRAN.R-project.org/package=emmeans.
Levin, S. A., Mooney, H. A., and Field, C. (1989). The dependence of plant root: shoot ratios on internal nitrogen concentration. Ann. Bot. 64, 71–75. doi: 10.1093/oxfordjournals.aob.a087810
Lin, B. B., Flynn, D. F. B., Bunker, D. E., Uriarte, M., and Naeem, S. (2011). The effect of agricultural diversity and crop choice on functional capacity change in grassland conversions. J. Appl. Ecol. 48, 609–618. doi: 10.1111/j.1365-2664.2010.01944.x
Mack, R. N. (1981). Invasion of Bromus tectorum L. into western North America: an ecological chronicle. Agro-Ecosyst. 7, 145–165. doi: 10.1016/0304-3746(81)90027-5
Mack, R. N. (1991). The commercial seed trade: an early disperser of weeds in the United States. Econ. Bot. 45, 257–273. doi: 10.1007/bf02862053
Manly, B. F. J. (2006). Randomization, Bootstrap and Monte Carlo Methods in Biology. Boca Raton, FL: Chapman & Hall.
Marco, A., Lavergne, S., Dutoit, T., and Bertaudiere-Montes, V. (2009). From the backyard to the backcountry: how ecological and biological traits explain the escape of garden plants into Mediterranean old fields. Biol. Invasions 12, 761–779. doi: 10.1007/s10530-009-9479-3
McGill, B. J., Enquist, B. J., and Weiher, E. M. (2006). Rebuilding community ecology from functional traits. Trends Ecol. Evol. 21, 178–185. doi: 10.1016/j.tree.2006.02.002
Messier, J., McGill, B. J., and Lechowicz, M. J. (2010). How do traits vary across ecological scales? A case for trait-based ecology. Ecol. Lett. 13, 838–848. doi: 10.1111/j.1461-0248.2010.01476.x
Meziane, D., and Shipley, B. (1999). Interacting determinants of specific leaf area in 22 herbaceous species: effects of irradiance and nutrient availability. Plant Cell Environ. 22, 447–459. doi: 10.1046/j.1365-3040.1999.00423.x
Niinemets, Ü (2001). Global-scale climatic controls of leaf dry mass per area, density and thickness in trees and shrubs. Ecology 82, 453–469. doi: 10.1890/0012-9658(2001)082[0453:gsccol]2.0.co;2
Niinemets, Ü, and Kull, K. (1994). Leaf weight per area and leaf size of 85 Estonian woody species in relation to shade tolerance and light availability. For. Ecol. Manage. 70, 1–10. doi: 10.1016/0378-1127(94)90070-1
Paradis, E., Claude, J., and Strimmer, K. (2004). APE: analyses of phylogenetics and evolution in R language. Bioinformatics 20, 289–290. doi: 10.1093/bioinformatics/btg412
Paz, H. (2003). Root/Shoot allocation and root architecture in seedlings: variation among Forest Sites, Microhabitats, and Ecological Groups. Biotropica 35, 318–332. doi: 10.1111/j.1744-7429.2003.tb00586.x
Pérez-Harguindeguy, N., Díaz, S., Garnier, E., Lavorel, S., Poorter, H., Jaureguiberry, P., et al. (2013). New handbook for standardised measurement of plant functional traits worldwide. Aust. J. Bot. 61, 167–234.
Pickett, S. T., Cadenasso, M. L., Grove, J. M., Nilon, C. H., Pouyat, R. V., Zipperer, W. C., et al. (2001). Urban ecological systems: linking terrestrial ecological, physical, and socioeconomic components of metropolitan areas. Annu. Rev. Ecol. Systemat. 32, 127–157. doi: 10.1146/annurev.ecolsys.32.081501.114012
Pigliucci, M., Diiorio, P., and Schlichting, C. D. (1997). Phenotypic plasticity of growth trajectories in two species of Lobelia in response to nutrient availability. J. Ecol. 1, 265–276.
Pinheiro, J., Bates, D., DebRoy, S., and Sarkar, D. (2017). Nlme: Linear and Nonlinear Mixed Effects Models. R package version 3.1–131. Available at: https://cran.r-project.org/web/packages/nlme/nlme.pdf.
Pollard, A. J. (1980). Diversity of metal tolerances in Plantago lanceolata L. from the southeastern United States. N. Phytol. 86, 109–117. doi: 10.1111/j.1469-8137.1980.tb00783.x
Pyšek, P. (1993). Factors affecting the diversity of flora and vegetation in central European settlements. Vegetatio 106, 89–100. doi: 10.1007/bf00044860
R Core Team (2017). R: A Language and Environment for Statistical Computing. Vienna: R Core Team. Available at: https://www.R-project.org/
Rega-Brodsky, C. C., and Nilon, C. H. (2016). Vacant lots as a habitat resource: nesting success and body condition of songbirds. Ecosphere 7, 1–11.
Reich, P. B., Ellsworth, D. S., and Walters, M. B. (1998). Leaf structure (specific leaf area) modulates photosynthesis-nitrogen relations: evidence from within and across species and functional groups. Funct. Ecol. 12, 948–958. doi: 10.1046/j.1365-2435.1998.00274.x
Rejmanek, M., Richardson, D. M., and Pysek, P. (2005). Plant invasions and invasibility of plant communities. Veg. Ecol. 20, 332–355.
Rice, W. R. (1989). Analyzing tables of statistical tests. Evolution 43, 223–225. doi: 10.1111/j.1558-5646.1989.tb04220.x
Rolshausen, G., Segelbacher, G., Hobson, K. A., and Schaefer, H. M. (2009). Contemporary evolution of reproductive isolation and phenotypic divergence in sympatry along a migratory divide. Curr. Biol. 19, 2097–2101. doi: 10.1016/j.cub.2009.10.061
Rozendaal, D. M. A., Hurtado, V. H., and Poorter, L. (2006). Plasticity in leaf traits of 38 tropical tree species in response to light; relationships with light demand and adult stature. Funct. Ecol. 20, 207–216. doi: 10.1111/j.1365-2435.2006.01105.x
Sage, R. F., Li, M. R., Monson, R. K., Sage, R. F., and Monson, R. K. (eds) (1999). The Taxonomic Distribution of C4 Photosynthesis. San Diego, CA: Academic Press, 551–584.
Sexton, J. P., McKay, J. K., and Sala, A. (2002). Plasticity and genetic diversity may allow salt cedar to invade cold climates in North America. Ecol. Appl. 12, 1652–1660. doi: 10.1890/1051-0761(2002)012[1652:pagdma]2.0.co;2
Shaw, R. G., and Mitchell-Olds, T. (1993). ANOVA for unbalanced data: an overview. Ecology 74, 1638–1645. doi: 10.2307/1939922
Siebenkäs, A., Schumacher, J., and Roscher, C. (2015). Phenotypic plasticity to light and nutrient availability alters functional trait ranking across eight perennial grassland species. AoB Plants 7, 1–15.plv029.
Siefert, A., Violle, C., Chalmandrier, L., Albert, C. H., Taudiere, A., Fajardo, A., et al. (2015). A global meta-analysis of the relative extent of intraspecific trait variation in plant communities. Ecol. Lett. 18, 1406–1419.
Spomer, L. A. (1990). Evaluating “drainage” in container and other shallow-drained horticultural soils. Commun. Soil Sci. Plant Anal. 21, 221–235. doi: 10.1080/00103629009368227
Sukopp, H., and Werner, P. (1983). “Urban environments and vegetation,” in Man’s Impact on Vegetation, eds W. Holzner, M. J. A. Werger, and I. Ikusima (The Hague: Junk Publishers), 247–260. doi: 10.1007/978-94-009-7269-8_19
Swenson, N. G. (2013). The assembly of tropical tree communities–the advances and shortcomings of phylogenetic and functional trait analyses. Ecography 36, 264–276. doi: 10.1111/j.1600-0587.2012.00121.x
Thomas, S. C., and Bazzaz, F. A. (1999). Asymptotic height as a predictor of photosynthetic characteristics in Malaysian rain forest trees. Ecology 80, 1607–1622. doi: 10.1890/0012-9658(1999)080[1607:ahaapo]2.0.co;2
Thuiller, W., Richardson, D. M., Pysek, P., Midgley, G. F., Hughes, G. O., and Rouget, M. (2005). Niche-based modelling as a tool for predicting the risk of alien plant invasions at a global scale. Global Change Biol. 11, 2234–2250. doi: 10.1111/j.1365-2486.2005.001018.x
Tilman, D. (1982). Resource Competition and Community Structure. Monographs in Population Biology. Princeton, NJ: Princeton University Press.
Tow, P. G., and Lazenby, A. (eds.) (2001). Competition and Succession in Pastures. New York, NY: CABI Publishing.
Vilà-Cabrera, A., Martínez-Vilalta, J., and Retana, J. (2015). Functional trait variation along environmental gradients in temperate and Mediterranean trees. Global Ecol. Biogeogr. 24, 1377–1389. doi: 10.1111/geb.12379
Violle, C., Enquist, B. J., McGill, B. J., Jiang, L., Albert, C. H., Hulshof, C., et al. (2012). The return of the variance: intraspecific variability in community ecology. Trends Ecol. Evol. 27, 244–252. doi: 10.1016/j.tree.2011.11.014
Weiher, E., Werf, A., Thompson, K., Roderick, M., Garnier, E., and Eriksson, O. (1999). Challenging theophrastus: a common core list of plant traits for functional ecology. J. Veg. Sci. 10, 609–620. doi: 10.2307/3237076
Westoby, M. (1998). A leaf-height-seed (LHS) plant ecology strategy scheme. Plant Soil 199, 213–227.
Westoby, M., Falster, D. S., Moles, A. T., Vesk, P. A., and Wright, I. J. (2002). Plant ecological strategies: some leading dimensions of variation between species. Annu. Rev. Ecol. Systemat. 33, 25–159.
Williams, N. S. G., Schwartz, M. W., Vesk, P. A., McCarthy, M. A., Hahs, A. K., Clemants, S. E., et al. (2009). A conceptual framework for predicting the effects of urban environments on floras. J. Ecol. 97, 4–9. doi: 10.1111/j.1365-2745.2008.01460.x
Winchell, K. M., Reynolds, R. G., Prado-Irwin, S. R., Puente-Rolón, A. R., and Revell, L. J. (2016). Phenotypic shifts in urban areas in the tropical lizard Anolis cristatellus. Evolution 70, 1009–1022. doi: 10.1111/evo.12925
Wright, I. J., Reich, P. B., Westoby, M., Ackerly, D. D., Baruch, Z., Bongers, F., et al. (2004). The worldwide leaf economics spectrum. Nature 428, 821–827.
Yesilonis, I. D., Pouyat, R. V., Russell-Anelli, J., and Powell, E. (2015). The effects of landscape cover on surface soils in a low density residential neighborhood in Baltimore, Maryland. Urban Ecosyst. 19, 115–129. doi: 10.1007/s11252-015-0502-4
Zobel, M., and Zobel, K. (2002). Studying plant competition: from root biomass to general aims. J. Ecol. 90, 578–580. doi: 10.1046/j.1365-2745.2002.00693.x
Zuur, A. F., Ieno, E. N., Walker, N. J., Saveliev, A. A., and Smith, G. M. (2010). “Mixed effects modelling for nested data,” in Mixed Effects Models and Extensions in Ecology with R, eds A. F. Zuur, E. N. Ieno, N. J. Walker, A. A. Saveliev, and G. M. Smith (New York, NY: Springer), 101–142. doi: 10.1007/978-0-387-87458-6_5
Keywords: eco-evolutionary dynamics, functional responses, interspecific variation, intraspecific variation, plant functional traits, urban ecology, vacant land, variance partitioning
Citation: Borowy D and Swan CM (2020) A Multi-Trait Comparison of an Urban Plant Species Pool Reveals the Importance of Intraspecific Trait Variation and Its Influence on Distinct Functional Responses to Soil Quality. Front. Ecol. Evol. 8:68. doi: 10.3389/fevo.2020.00068
Received: 01 November 2019; Accepted: 02 March 2020;
Published: 24 March 2020.
Edited by:
Jeremy Lundholm, Saint Mary’s University, CanadaReviewed by:
Nicholas Williams, The University of Melbourne, AustraliaSamiya Tabassum, Macquarie University, Australia
Copyright © 2020 Borowy and Swan. This is an open-access article distributed under the terms of the Creative Commons Attribution License (CC BY). The use, distribution or reproduction in other forums is permitted, provided the original author(s) and the copyright owner(s) are credited and that the original publication in this journal is cited, in accordance with accepted academic practice. No use, distribution or reproduction is permitted which does not comply with these terms.
*Correspondence: Dorothy Borowy, YmRvcm8xQHVtYmMuZWR1