 Yongbin Wu
 Youhua Chen
 Tsung-Jen Shen
- 1College of Forestry and Landscape Architecture, South China Agricultural University, Guangzhou, China
- 2CAS Key Laboratory of Mountain Ecological Restoration and Bioresource Utilization and Ecological Restoration and Biodiversity Conservation Key Laboratory of Sichuan Province, Chengdu Institute of Biology, Chinese Academy of Sciences, Chengdu, China
- 3Institute of Statistics and Department of Applied Mathematics and Center of Science Education, National Chung Hsing University, Taichung, Taiwan
Ecological communities are assembled by various mechanisms, including a tradeoff between colonization and extinction processes. However, it is still unclear how this tradeoff influences pairwise beta diversity patterns. Herein, we propose a novel likelihood framework to disentangle the compound impacts of species’ colonization and extinction rates on community-level compositional dissimilarity, which are ignored by traditional indices. The framework infers two parameters of colonization and extinction rates, allowing ecologists to study their latitudinal or broad-scale spatial variation patterns and test the relative influences of associated environmental factors. More importantly, the likelihood-based model showed that multi-site beta diversity is essentially identical to the local colonization failure or extinction rate of species in newly colonized sites but is not related to species’ colonization rates. Profoundly, the present likelihood model allows ecologists to explicitly infer the independent species’ colonization rate parameter and test its underpinning mechanisms, as it can be proven that this parameter would be only implicitly measured if used to compute multi-site beta diversity indices.
Introduction
Beta diversity, which characterizes between-site differences in species compositions, has become a key biodiversity component in understanding the maintenance of biodiversity and the community structure of species assemblages (Condit et al., 2002; Baselga, 2010; Anderson et al., 2011; Kraft et al., 2011; Legendre and Legendre, 2012; Baselga and Leprieur, 2015; Chen, 2015). However, its underlying ecological mechanisms have not been well elucidated (Xu et al., 2015; Xing and He, 2018). Previous studies showed that some biotic and abiotic factors, like species abundance distributions, environmental heterogeneity, and distributional aggregation, can influence broad-scale or latitudinal beta diversity patterns (Kraft et al., 2011; Qian et al., 2013; Xu et al., 2015; Ulrich et al., 2017; Xing and He, 2018). However, little is known about the impacts of other ecological mechanisms, particularly dynamic biological processes, on beta diversity and community patterns. More importantly, beta diversity indices developed in most previous studies (Koleff et al., 2003; Diserud and Ødegaard, 2007; Baselga, 2010; Chen, 2015; Ensing and Pither, 2015) are non-parametric, making it difficult to deeply quantify the influences of the underpinning biological mechanisms on structuring community patterns of ecological assemblages.
Among the many non-parametric beta diversity indices, Jaccard (βJac) and Sorensen (βSor) indices (Jaccard, 1912; Sorensen, 1948) might be the most widely used ones in ecology and evolution in both pairwise and multi-site calculations of beta diversity (Table 1). In comparison to the Jaccard index (Jaccard, 1912), the denominator of which is the total number of species found in a pair of sites, the Sorensen index (Sorensen, 1948) gives more weight to the number of shared species (Table 1). In addition, Baselga (2010) presented and developed many useful metrics that can be computed at the multi-site setting. Two of these metrics, which will be compared in the present study, include βBalsega, which was the extension of the Sorensen index for the multi-site setting, and the βLennon, which was the extension of the Lennon richness-based dissimilarity index (Lennon et al., 2001; Koleff et al., 2003; Baselga, 2010). Some multi-site indices are computed without pairwise comparison (Chen, 2016), and a typical one was the Whittaker’s beta diversity metric denoted by βWhittaker (Whittaker, 1960). Calculation formulas for all the mentioned indices (βJac,βSor,βBalsega,βLennon,βWhittaker) are presented in Table 1.
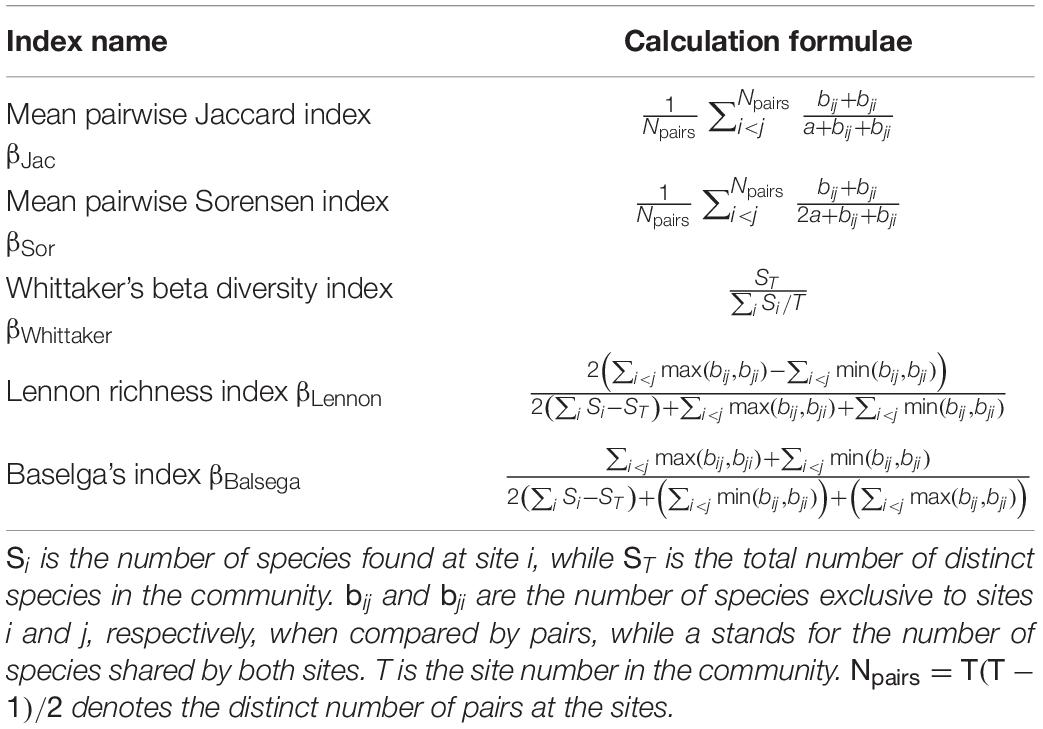
Table 1. Multi-site beta diversity indices used in the present study.
There are indeed other beta diversity indices at both pairwise and multi-site settings (Koleff et al., 2003; Diserud and Ødegaard, 2007; Baselga, 2010; Chen, 2015; Ensing and Pither, 2015), but many of them presented some degrees of similarity or correlation. For simplicity, the present study only used the above metrics to compare with the novel parametric likelihood model as proposed below.
Biodiversity is maintained by various dynamic processes, including species- or population-level colonization and extinction processes (MacArthur and Wilson, 1967; Levins, 1969; Hanski, 1998, 1999; Dune and Williams, 2009; Leibold and Chase, 2018). Beta diversity reflects the turnover of species between sites, implying that both local colonization and extinction events can contribute to spatial variations in community compositions (Podani and Schmera, 2011; Carvalho et al., 2013; Baselga and Leprieur, 2015). Further, it can be hypothesized that if more species are expected to actively colonize different sites, compositional similarity will become high, and thus beta diversity is expected to be low. In contrast, if more species are expected to go extinct within sites, more species are expected to be uniquely found in some specific sites, resulting in higher beta diversity patterns.
However, particularly from a quantitative perspective, it is still unclear how the tradeoff between colonization and extinction influences beta diversity and community structure (Lu et al., 2019; Ontiveros et al., 2019), even though their influences on metapopulation or metacommunity dynamics are generally well appreciated (MacArthur and Wilson, 1967; Hanski, 1999; Leibold and Chase, 2018). In this study, we developed a novel but simple statistical framework that can explicitly incorporate the independent influences of colonization and extinction on pairwise beta diversity patterns. We will compare the proposed parametric likelihood model for characterizing pairwise beta diversity patterns to the previously discussed non-parametric indices (Table 1) at the multi-site setting, in order to show the similarities and differences among them through mathematical derivation and numerical simulations.
Materials and Methods
The Proposed Likelihood Model
For a pair of sampling sites with total ST species, the probability of observing a species shared by both sites i and j, conditioned on the fact that each, from the targeted site, can colonize and survive in another site in the pair (two possible independent events), is given by [2r(1−e)]a. The probability of observing b (or c) species that are unique to sites i (or j), respectively, conditioned on the fact that each tries to colonize but fails to survive in the other site j (or i), is given by [re]b (or [re]c). Finally, the probability of observing d species being absent from both sites is given by [1−2r]d. Note that ST = a + b + c + d. Figure 1 provides a visual cartoon demonstrating the calculation of the above probabilities and relevant colonization and extinction events in a hypothetical example with only four species in a pair of sites.
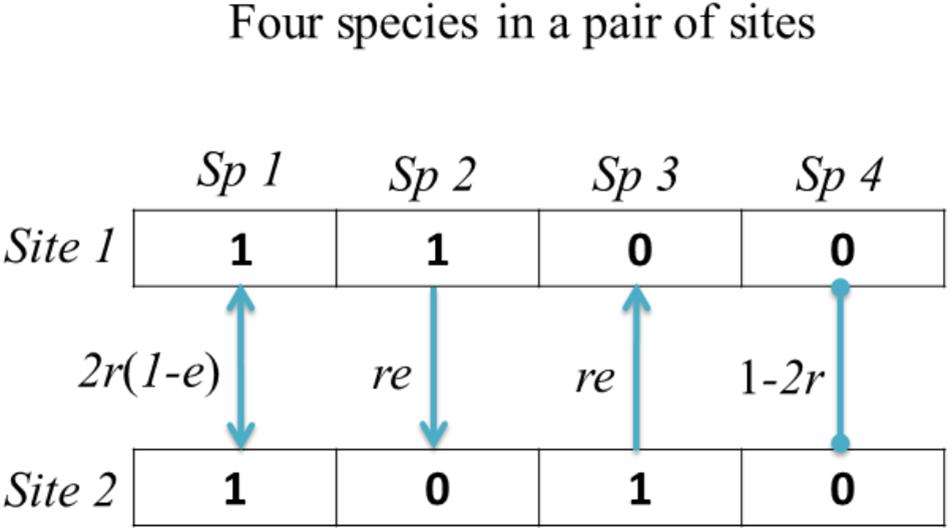
Figure 1. A schematic map showing the modeling framework of the colonization and extinction events in a pair of sites. Solid lines with arrow endpoints denote respective dispersal directions, while lines with circle endpoints denote no event. These events in our study follow the parsimonious principle.
The probability of observing d species being absent from both sites can be intuitively understood as follows: because the colonization rate is a one-direction parameter, the probability of observing one species being absent from both sites in a pair is the complement of the summed probability that the species colonize one site from another site with rate r (two independent evens here, regardless of the extinction status), which is specifically given by 1-2r. Alternatively, one may think that the sum of all probabilities (as shown in Figure 1) should be 1. According to this, the probability that a species colonizes and survives in two sites is given 2r(1−e), and the summed probability that a species colonizes and survives in only one site is given by 2re. Therefore, the probability that the same species cannot colonize and survive in both sites is given by 1−2r(1−e)−2re = 1−2r. Because there are d species being absent from both sites, the joint probability becomes [1−2r]d.
In the above description, e is the mean extinction rate of a species in the other site which emigrates from the target site of a pair of sites. r is the mean colonization rate of a species to the other site from the target site (but this species is still present in the target site). Note that the following constraints are required: 0≤e≤1 and 0≤r≤0.5. Based on these constraints, one can see that the colonization rate, r, is actually asymmetric and only quantifies the emigration rate of species from one site to another. Accordingly, 2r measures the symmetric dispersal rate by integrating both immigration and emigration rates. For simplicity, in the present study, we only studied the emigration rate, r.
If a species’ extinction rate, e, in a newly colonized site from an original target site is high, then it can be expected that it would contribute more to between-site dissimilarity while contributing less to between-site similarity (as this species will ultimately be absent from the newly colonized site) and vice versa. In contrast, a species’ colonization rate, r, being high will contribute more to between-site similarity. However, this corresponding multi-site beta diversity is not related to the colonization parameter.
To demonstrate this, two widely used indices are employed as follows:
(a) the Jaccard dissimilarity index:
(b) the Sorensen dissimilarity index:
and
One can see that in all the conventional beta diversity indices demonstrated, the colonization parameter is canceled out, implying that ecologists are less likely to detect a signal of the colonization process in conventional beta diversity modeling. Only the present likelihood framework can allow ecologists to accurately quantify the influence of the colonization process on community structure and conduct hypothesis testing.
For a species-site matrix with T sites, there will be Npairs = T(T−1)/2 distinct pairs of sites. Therefore, the joint probabilities can be formulated as
By maximizing Eq. 1, we can accordingly obtain the estimated colonization and extinction parameters. R scripts for calculating estimates of e and r from Eq. 1 are provided in Supplementary Material.
Numerical Simulation
We conducted numerical simulations to test the estimation power of the likelihood function (Eq. 1). First, we simulated 1,000 species-site matrices (containing 50 species and 50 sites) for different combinations of colonization rate r (ranging from 0 to 0.5) and extinction rate e (ranging from 0 to 1). 10,000 simulation steps are used to generate each simulated matrix. At each simulation step, we randomly picked two sites for allowing each species to colonize and inhibit with the following probabilities: (1) both sites are colonized and occupied without extinction with a probability 2r(1−e); (2) only one site is successfully colonized without extinction with a probability 2re; (3) a species fails to occupy both sites with a probability 1-2r. For each simulated matrix derived from a preset combination of colonization and extinction rates, we then applied Eq. 1 to fit the two parameters. Since we have 1,000 simulated matrices for a preset combination of colonization and extinction rates, we then obtain 1,000 estimated values for each of the two parameters. Furthermore, for each parameter, we compute its mean of over 1,000 estimates and its estimation bias measured by the difference between the estimation mean and the preset true value. The estimation power of estimators from Eq. 1 can be assessed based on the estimation bias regarding its magnitude and direction. Specifically, the estimation was highly favorable when the corresponding estimation bias was low (i.e., close to 0). However, when the bias was negative, underestimation was implied. By contrast, overestimation was concluded while the estimation bias was positive.
We also conducted numerical simulations to verify the accuracy of the proposed likelihood model (Eq. 1) in measuring multi-site beta diversity patterns (i.e., pairwise beta diversity that is applied to multiple sites). In detail, we designed a simulated data matrix with 30 species × 30 sites (i.e., ST = 30 and T=30); we then applied the above likelihood model (Eq. 1) to the simulated data matrix and fit the colonization and extinction parameters. Accordingly, beta diversity was measured and computed using the Jaccard and Soresen formulae as
For comparison, as mentioned above, other multi-site beta diversity indices were also computed using the MBI package (Chen, 2015), details of which are introduced in Table 1. The simulation was repeated 1,000 times, in which the incidence of each species in each site for each simulated matrix was simulated using a Bernoulli distribution with success rate, p, that varies from 0.1 to 0.9. To evaluate whether the proposed likelihood-based beta parameters and indices are sensitive to changes in richness, we also varied species richness for each simulated matrix size from 11 to 1,000, while keeping the Bernoulli parameter and site number fixed as p = 0.5 and 30, respectively.
Empirical Application
On a global scale, we utilized Gentry forest transect data to study the relative contributions of colonization and extinction processes to beta diversity and evaluated how colonization and extinction rates would vary across geographic locations and at a global scale. In total, 197 forest plots, each 0.1 ha in size and with ten 0.01 ha subplots, were used, from a dataset that is available online1. Species with stems of ≥2.5 cm in diameter at breast height were recorded and identified (Phillips and Miller, 2002). Gentry’s dataset includes the number of individuals of each species in each of the 10 subplots in each forest plot. In our study, we fit the proposed likelihood framework to each plot and computed the corresponding colonization rate, extinction rate (or Jaccard index), and Sorensen index using Eqs 1 and 2.
Results
The estimation accuracy for the colonization rate was relatively high, as the estimation bias was no more than 0.12 and no less than -0.12 over all the combinations of true colonization and extinction rates in the parameter space (Supplementary Figure S1). As a comparison, the estimation of the extinction rate was a bit less accurate. When both the true values of the extinction rate and the colonization rate were set to be low (e.g., less than 0.1), the estimation bias for the extinction rate parameter could reach 0.8. However, the estimation of the extinction rate was still accurate in many combination cases of the parameter space (Supplementary Figure S2).
In the numerical simulation, the fitted colonization rate was positively and significantly related to the Bernoulli success rate. The latter is an indicator of data matrix saturation or the filling level (Table 2). In contrast, there should be a decreasing trend in the estimated multi-site beta diversity indices, and (the former is almost identical to the fitted extinction rate as expected), which are derived from the proposed framework and the data matrix saturation (Table 2 and Figure 2).
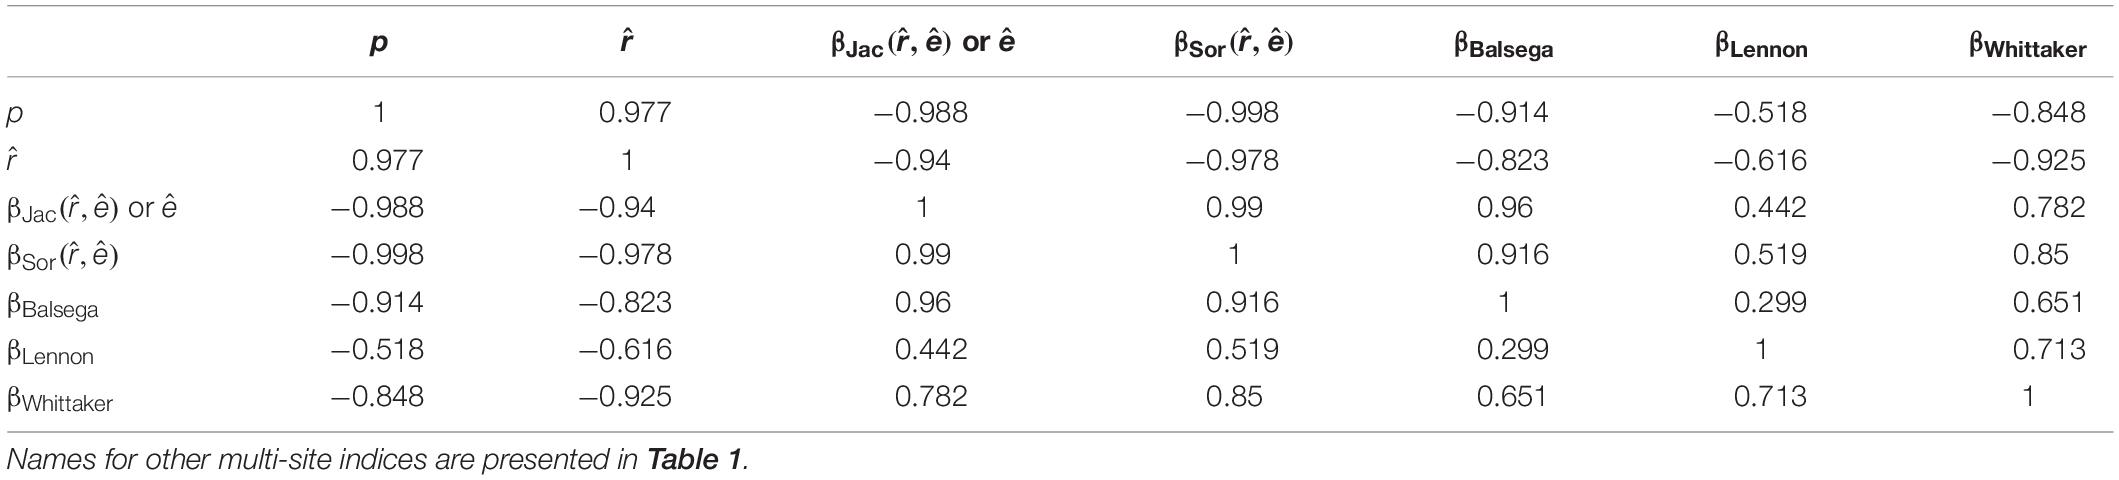
Table 2. Relationships (measured by the correlation coefficient) of the colonization rate, extinction rate, and the multi-site beta diversity estimated using the proposed likelihood model with other multi-site calculation methods in a numerical simulation when the matrix filling degree (p) varies.
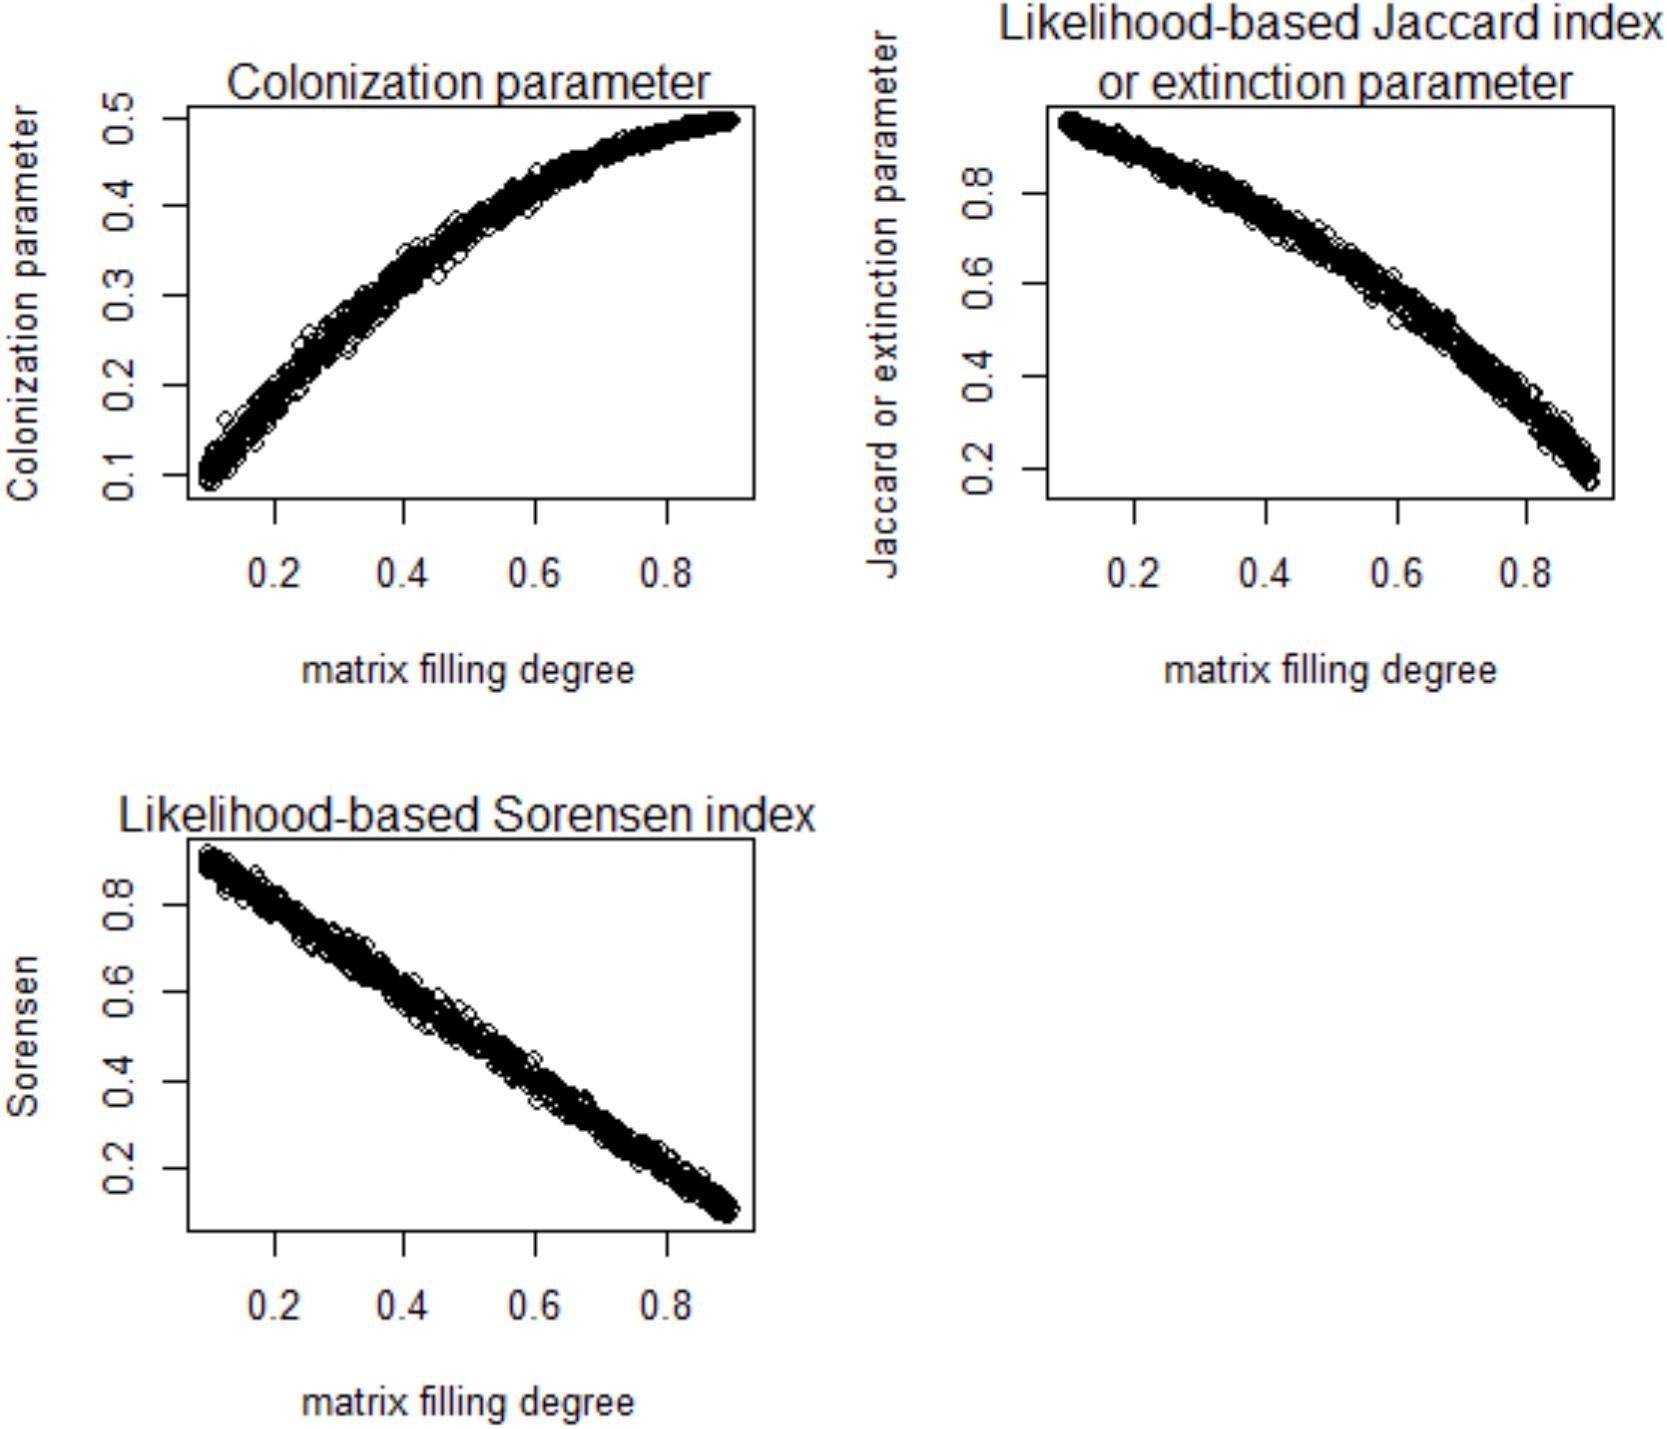
Figure 2. Relationships of the colonization rate and extinction rate with multi-site beta diversity indices inferred using the proposed likelihood model and matrix filling degree (p) in a numerical simulation.
Using the likelihood-based framework, the fitted multi-site beta diversity indices, and , were positively and significantly associated with all of the other conventionally used multi-site beta diversities, though the correlation strengths varied (Table 2). In particular, the extinction rate and were identical to the mean Jaccard dissimilarity index (Table 2). Both and had close correlations with the most conventional multi-site beta diversity index (Table 2). Finally, neither the proposed colonization rate, , nor the multi-site indices, and , were sensitive to species richness (Figure 3 and Table 3), which is a desirable property. Interestingly, among the multi-site metrics, βLennon was less correlated with the rest of the metrics, while the others (βBalsega and βWhittaker) were strongly correlated to the estimated colonization and extinction rates (Tables 2 and 3).
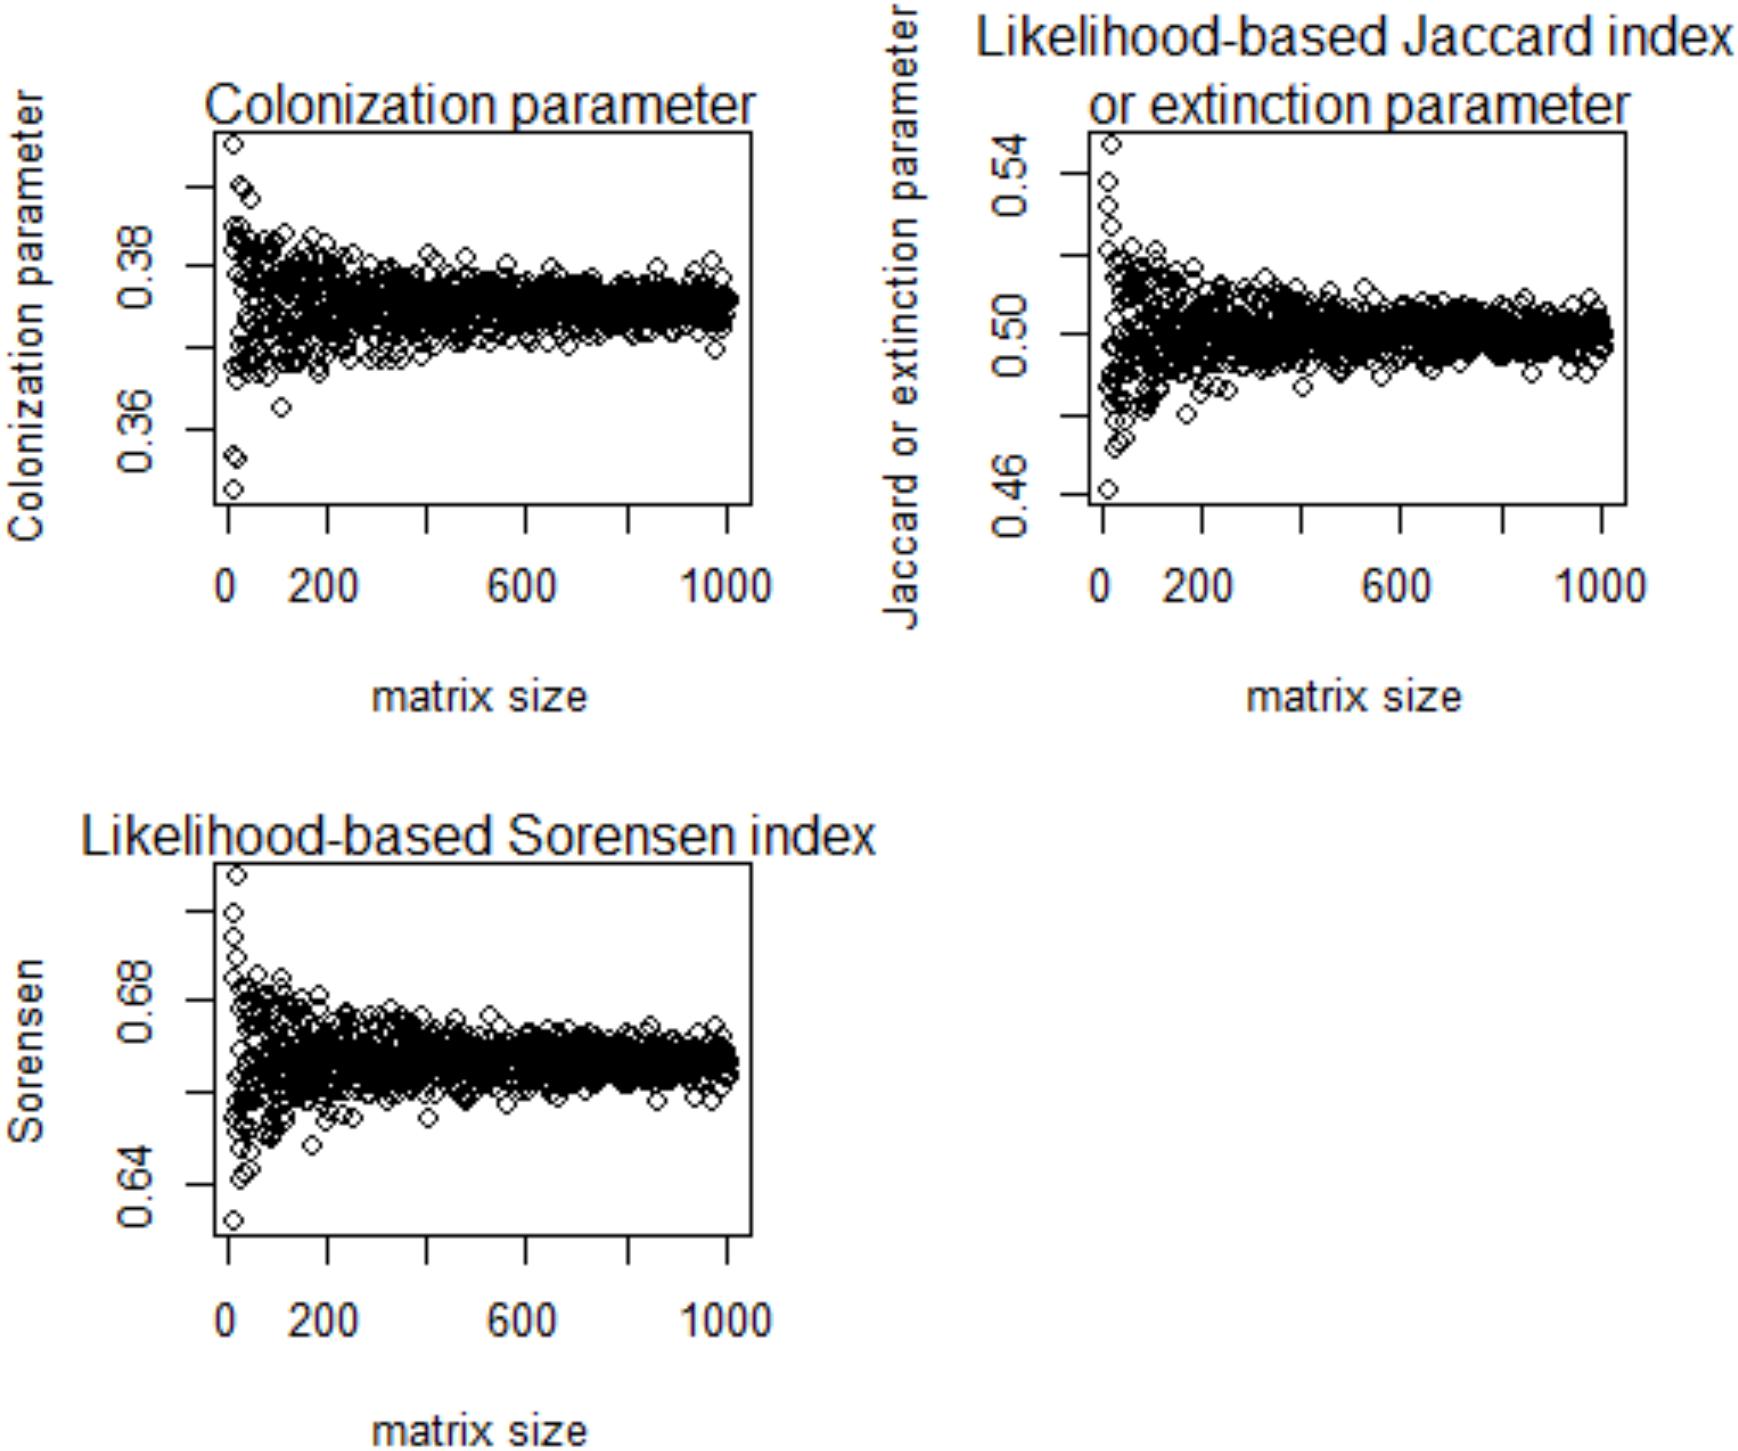
Figure 3. Relationships of the colonization rate and extinction rate with multi-site beta diversity indices inferred using the proposed likelihood model and species richness (labeled as “matrix size”) in a numerical simulation.
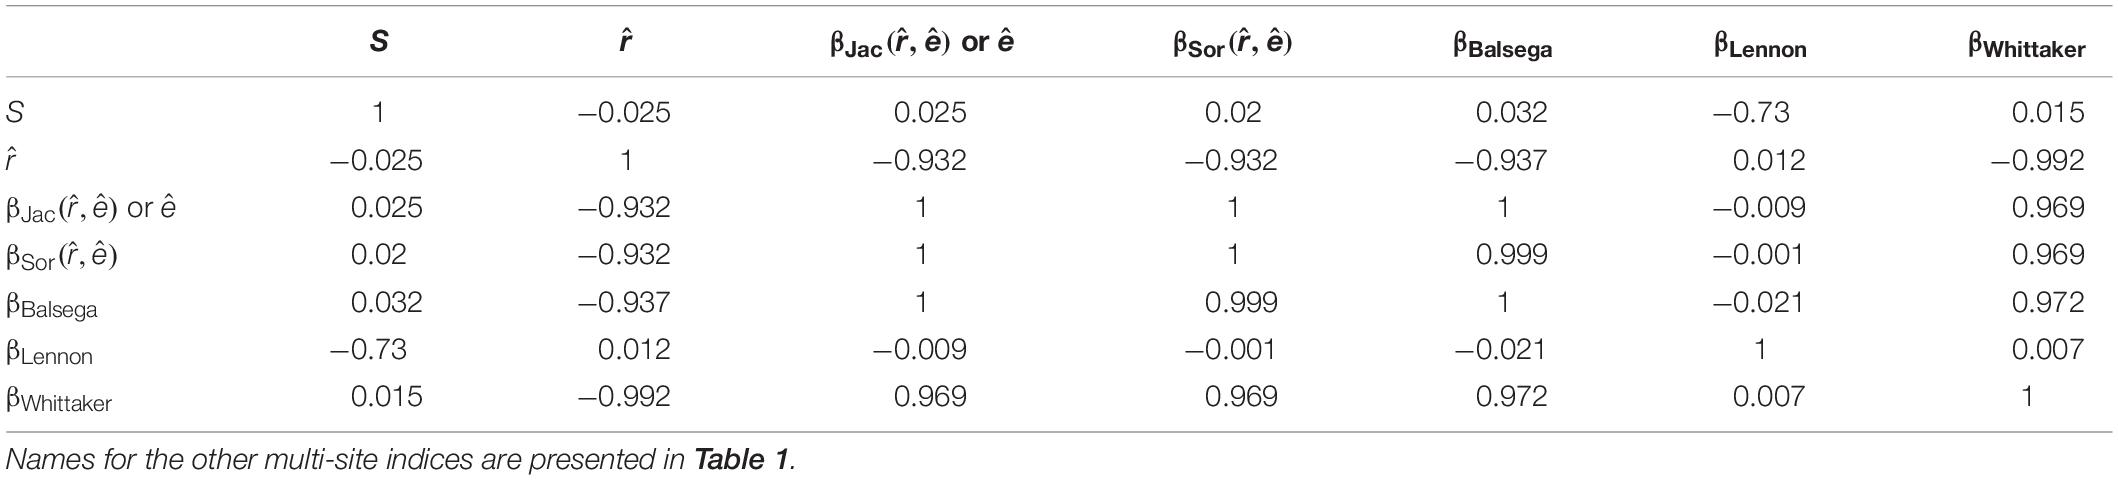
Table 3. Relationships (measured by the correlation coefficient) of the colonization rate, extinction rate, and multi-site beta diversity estimated using the proposed likelihood model and other multi-site calculation methods in a numerical simulation when species richness (S) varies.
In the empirical test, it was observed that the colonization rate, extinction rate, , and of the proposed indices had significant relationships with latitude (Figure 4). In particular, the fitted colonization rate was high in high-latitude areas, while the extinction rate and beta diversity indices were high in tropical areas (Figure 4).
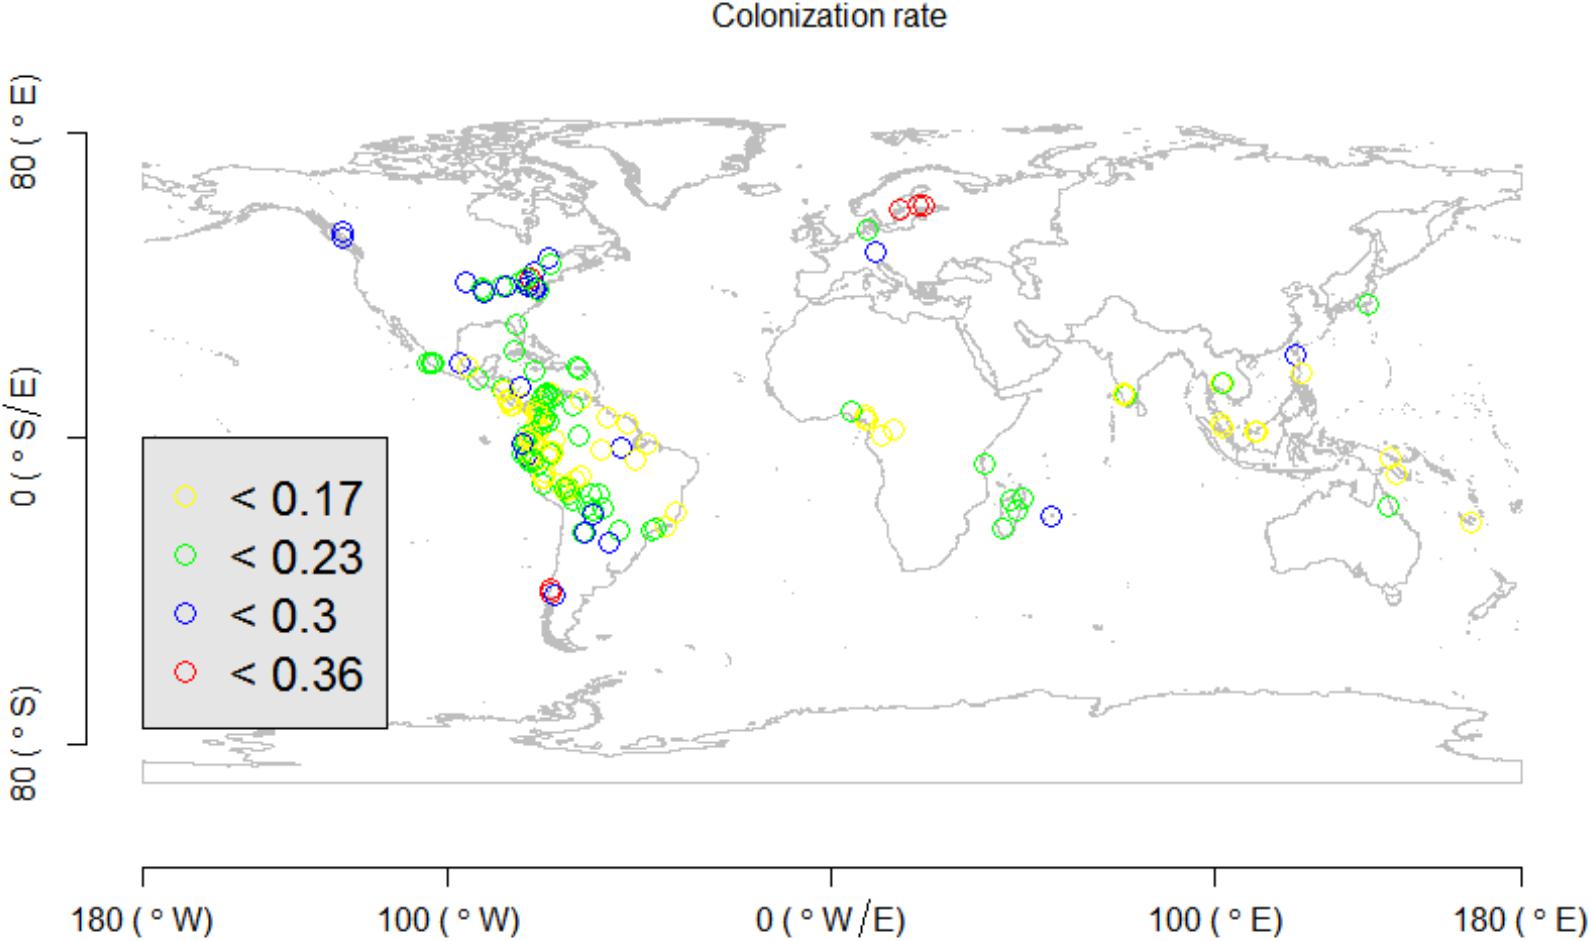
Figure 4. Estimated colonization rate for global Gentry forest plots.
Discussion
Previous studies showed that beta diversity is expected to be high in tropical ecosystems, because of the coexistence of many species with narrow range sizes and the high degree of habitat heterogeneity (Condit et al., 2002; Xing and He, 2018). Our present modeling framework, using global forest plots, confirmed such an observation using a likelihood framework (Figure 4). In addition to beta diversity, our study showed that extinction and colonization rates can vary spatially across geographic locations and environmental gradients, and that the colonization rate was high in temperate or cold regions (Figure 4). Our observation of high colonization rates of species in high latitudes (Figure 4) is useful in explaining Rapoport’s rule, which hypothesizes that species inhabiting high-latitude areas usually have large range sizes (Stevens, 1989, 1992, 1996; Chen and Srivastava, 2015; Xing and He, 2018), even though it is not confirmed or partially supported in many empirical studies (Kerr, 1999; Bhattarai and Vetaars, 2006; Feng et al., 2016; Zhou et al., 2019).
In our likelihood model, extinction rate contributed to species richness difference between a pair of sites (that is, species turnover) (Figure 1). Our results showed that higher species turnover existed in tropics than in other places (Figures 5, 6). This observation was consistent with preceding literatures, which worked on other taxonomic groups (e.g., amphibians and birds) (Buckley and Jetz, 2008; Baselga et al., 2012; Jankowski et al., 2012). One biotic reason of observing high turnover in tropics could be due to the intensified interspecific competition (Jankowski et al., 2012), which will lead to an asymmetric local extinction pattern (Figure 1) and result in the checkerboard pattern of species spatial distribution (i.e., high species turnover) (Stone and Roberts, 1990, 1992; Gotelli, 2000; Dallas et al., 2019). Another abiotic reason of high turnover in tropics is the high environmental turnover and climatic heterogeneity in the region, which has been identified previously (Buckley and Jetz, 2008; Svenning et al., 2011). In summary, based on the above discussions, the proposed likelihood framework can allow ecologists, for the first time, to explore and disentangle spatial variations of colonization and extinction processes when investigating spatial community patterns.
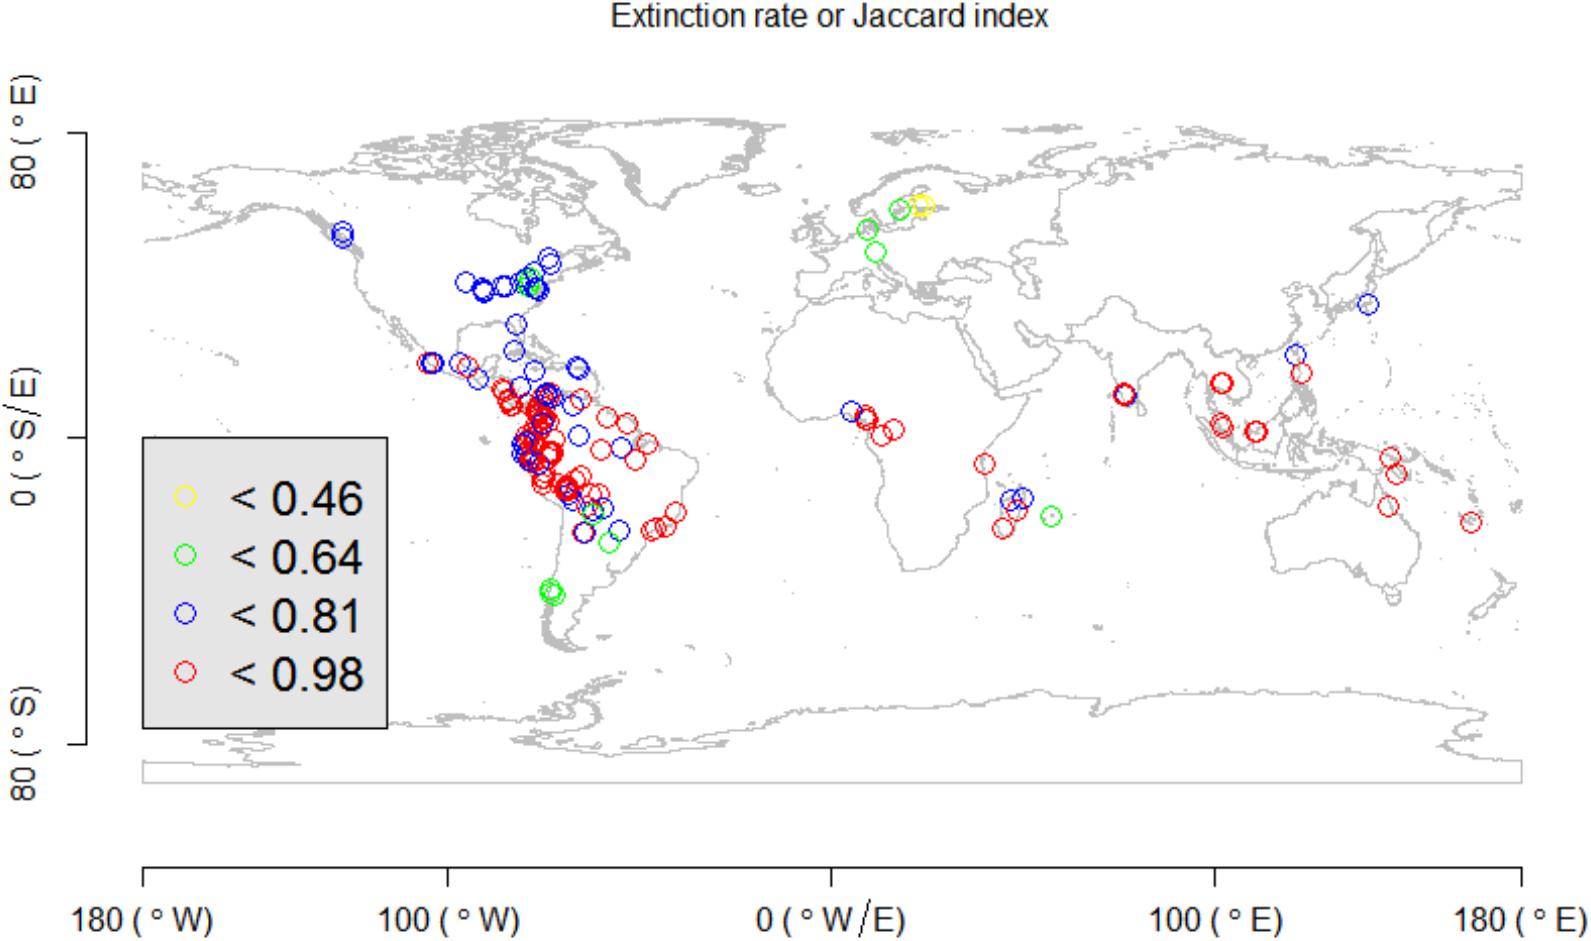
Figure 5. Extinction rate (or Jaccard index) for global Gentry forest plots.

Figure 6. Sorensen index for global Gentry forest plots.
Through the numerical simulations, it was found that the fitting of the colonization rate seemed reasonably accurate in all cases, as all bias values were in a range between -0.12 and 0.12 (Supplementary Figure S1). However, the estimation bias was a bit large for the extinction rate when the corresponding true values of both rates were not very high in the simulations (Supplementary Figure S2). To this end, our model and simulation results were in line with some previous studies, which had consistently found that extinction rate was difficult to estimate (Rabosky, 2010; He and Hubbell, 2011; Greenberg and Mooers, 2017). The mechanisms for explaining such an observation (i.e., estimation for colonization rate was not so accurate) can be multifaceted. Here, we focused on an explanation related to the difference between the random simulation scheme and the associated likelihood model structure. In our paper, we did not strictly follow the model structure used in the likelihood model. In the likelihood model (Eq. 1), it is expected to use species occurrence information from pairs of sites directly without referring to the original species-site matrix. However, in the present study, the random species-site matrix was generated firstly, and then species presence and absence information from the pairs of sites of the simulated matrix was derived. Such a simulation and estimation procedure might obscure the influence of extinction on pairwise beta diversities that are derived from multiple sites.
The empirical application of the proposed likelihood framework also demonstrated that colonization and extinction frequencies of species across different geographic gradients differed. Because of the decoupling of colonization and extinction processes in our model, it could be shown that colonization (the fitted r value) and extinction (the fitted e value) rates are not, as expected, directly and positively correlated. In both the numerical test and empirical application (Figures 2–4), there was a close negative relationship between the fitted colonization and extinction parameters for different ecological communities.
Colonization and extinction rates were both related to multi-site beta diversity patterns, but the correlation directions were totally opposite (Tables 2 and 3). This provides support for the hypothesis mentioned within the section “Introduction.” Indeed, as seen in Table 2, it is true that if more species are expected to successfully colonize different sites, the compositional similarity will become high, and accordingly, beta diversity will become low (Table 2), even though the influence of colonization on the estimated beta diversity was not implicit (Eq. 2).
Among the compared beta diversity metrics, it was found that βLennon was less correlated with the rest of the metrics (Tables 2 and 3). The discrepancy was largely due to the fact that the numerator of the index βLennon was species richness difference between a pair of sites, while the other indices gave more weights on the number of species that contribute to the difference of two sites (i.e., species that are present in only one site of the pair), which included βJac,βSor,andβBalsega. Additionally, the Whittaker’s metric βWhittaker was not necessarily related to species richness difference, but it was strongly related to the total species richness over all the sites. Due to this, there was a greater correlation with βLennon in comparison to the other metrics when matrix filling degree was varied in the numerical simulation (Table 2). However, both metrics still remained quite different, which resulted in their low correlation when species richness was varied in the simulation (Table 3).
The present likelihood-based framework demonstrated that multi-site beta diversity is essentially equivalent to the colonization failure of species (i.e., extinction in newly colonized sites) or conversely, the colonization success of species. If the colonization success of different species across different sites is high, then beta diversity or the turnover rate of species between sites is expected to be low as different sites should have similar sets of species occupying them. To this end, the present study presents the first theoretical model linking species colonization success and species turnover, even though previous empirical studies reported that successful colonization of non-native species can lead to biotic homogenization (Olden and Poff, 2003; Schwartz et al., 2006; Smart et al., 2006; McKinney and La Sorte, 2007; Winter et al., 2009).
For future research, it would be interesting and worthwhile comparing native and non-native species communities and differences in their colonization and extinction frequencies, to provide better understanding of how non-native species change biodiversity patterns of local native ecosystems. Moreover, it would also be interesting to compare the colonization and extinction rates of different functional groups with different traits (Zhou et al., 2019), and partition the proportional contributions of colonization and extinction in structuring community dissimilarity. Finally, inspired by spatial metapopulation theory (Hanski and Thomas, 1994; Hanski, 1998, 1999), it would be valuable to develop a spatially explicit colonization-extinction model to quantify spatial beta diversity patterns and provide insights for systematic conservation planning (Hanski and Thomas, 1994) when more-detailed information about locations of detected species is available and incorporated into the employed model.
In conclusion, the present study presents a statistical framework that can accurately and quantitatively evaluate the separate impacts of species colonization and extinction processes on the community structure in terms of multi-site beta diversity patterns. The proposed method is simple and can immediately be applied in field settings to identify mechanistic links among colonization-extinction dynamics, community patterns, and environmental filtering.
Data Availability Statement
The empirical dataset used in the present study is available from an online repository (https://www.davidzeleny.net/anadat-r/doku.php/en:data:gentry).
Author Contributions
YW conceived and designed the project. T-JS and YC developed and checked the model. YW and YC conducted the modeling and analyses. All the authors wrote, revised and approved the final manuscript for submission.
Funding
This work was supported by the Strategic Priority Research Program (XDB31000000) and the Hundred Talents Program (Y8C3041100), Chinese Academy of Sciences. YW was supported by the Forestry Reform and Development Fund of the Central Government of China (grant no. [2019] GDTK-06). T-JS was supported by the Taiwanese Ministry of Science and Technology under contract MOST 108-2118-M-005 -002 -MY2.
Conflict of Interest
The authors declare that the research was conducted in the absence of any commercial or financial relationships that could be construed as a potential conflict of interest.
Supplementary Material
The Supplementary Material for this article can be found online at: https://www.frontiersin.org/articles/10.3389/fevo.2020.00064/full#supplementary-material
Footnotes
References
Anderson, M., Crist, T., Chase, J., Vellend, M., Inouye, B., Freestone, A., et al. (2011). Navigating the multiple meanings of beta diversity: a roadmap for the practicing ecologist. Ecol. Lett. 14, 19–28. doi: 10.1111/j.1461-0248.2010.01552.x
Baselga, A. (2010). Partitioning the turnover and nestedness components of beta diversity. Glob. Ecol. Biogeogr. 19, 134–143. doi: 10.1111/j.1466-8238.2009.00490.x
Baselga, A., Gomez-Rodirugez, C., and Lobo, J. (2012). Historical legacies in world amphibian diversity revealed by the turnover and nestedness components of beta diversity. PLoS One 7:e32341. doi: 10.1371/journal.pone.0032341
Baselga, A., and Leprieur, F. (2015). Comparing methods to separate components of beta diversity. Methods Ecol. Evol. 6, 1069–1079. doi: 10.1111/2041-210X.12388
Bhattarai, K., and Vetaars, O. (2006). Can Rapoport’s rule explain tree species richness along the Himalayan elevation gradient, Nepal? Divers. Distrib. 12, 373–378. doi: 10.1111/j.1366-9516.2006.00244.x
Buckley, L. B., and Jetz, W. (2008). Linking global turnover of species and environments. Proc. Natl. Acad. Sci. U.S.A. 105, 17836–17841. doi: 10.1073/pnas.0803524105
Carvalho, J., Cardoso, P., Borges, P., Schmera, D., and Podani, J. (2013). Measuring fractions of beta diversity and their relationships to nestedness: a theoretical and empirical comparison of novel approaches. Oikos 122, 825–834. doi: 10.1111/j.1600-0706.2012.20980.x
Chen, Y. (2015). Biodiversity and Biogeographic Patterns in Asia-Pacific Region I: Statistical Methods and Case Studies. Sharjah: Bentham Science Publishers.
Chen, Y. (2016). Partitioning multiple-site tree-like beta diversity into turnover and nestedness components without pairwise comparisons. Ecol. Indic. 61, 413–417. doi: 10.1016/j.ecolind.2015.09.042
Chen, Y., and Srivastava, D. (2015). Latitudinal concordance between biogeographic regionalization, community structure and richness patterns: a study on the reptiles of China. Sci. Nat. 102:1253. doi: 10.1007/s00114-014-1253-4
Condit, R., Pitman, N., Leigh, E. G., Chave, J., Terborgh, J., Foster, R. B., et al. (2002). Beta-diversity in tropical forest trees. Science 295, 666–669. doi: 10.1126/science.1066854
Dallas, T., Melbourne, B., and Hastings, A. (2019). When can competition and dispersal lead to checkborad distributions? J. Anim. Ecol. 88, 269–276. doi: 10.1111/1365-2656.12913
Diserud, O., and Ødegaard, F. (2007). A multiple-site similarity measure. Biol. Lett. 3, 20–22. doi: 10.1098/rsbl.2006.0553
Dune, J., and Williams, R. (2009). Cascading extinctions and community collapse in model food webs. Philos. Trans. R. Soc. B 364, 1711–1723. doi: 10.1098/rstb.2008.0219
Ensing, D., and Pither, J. (2015). A novel multiple-site extension to pairwise partitioned taxonomic beta diversity. Ecol. Complex. 21, 62–69. doi: 10.1016/j.ecocom.2014.11.008
Feng, J., Hu, X., Wang, J., and Wang, Y. (2016). Support for the elevational Rapoport’s rule among seed plants in Nepal depends on biogeographical affinities and boundary effects. Ecol. Evol. 6, 7246–7252. doi: 10.1002/ece3.2473
Gotelli, N. (2000). Null model analysis of species co-occurrence patterns. Ecology 81, 2606–2621. doi: 10.1890/0012-9658(2000)081%5B2606:nmaosc%5D2.0.co;2
Greenberg, D. A., and Mooers, A. Ø (2017). Linking speciation to extinction: diversification raises contemporary extinction risk in amphibians. Evol. Lett. 1, 40–48. doi: 10.1002/evl3.4
Hanski, I., and Thomas, C. (1994). Metapopulation dynamics and conservation: a spatially explicit model applied to butterflies. Biol. Conserv. 68, 167–180. doi: 10.1016/0006-3207(94)90348-4
He, F., and Hubbell, S. P. (2011). Species–area relationships always overestimate extinction rates from habitat loss. Nature 473, 368–371. doi: 10.1038/nature09985
Jaccard, P. (1912). The distribution of the flora in the alpine zone. New Phytol. 11, 37–50. doi: 10.1111/j.1469-8137.1912.tb05611.x
Jankowski, J., Graham, C., Parra, J., Robinson, S., Seddon, N., Touchton, J., et al. (2012). The role of competition in structuring tropical bird communities. Ornitol. Neotropical 23, 97–106.
Kerr, J. T. (1999). Weak links: ‘Rapoport’s rule’ and large-scale species richness patterns. Glob. Ecol. Biogeogr. 8, 47–54. doi: 10.1046/j.1365-2699.1999.00315.x
Koleff, P., Gaston, K., and Lennon, J. (2003). Measuring beta diversity for presence-absence data. J. Anim. Ecol. 72, 367–382. doi: 10.1046/j.1365-2656.2003.00710.x
Kraft, N. J. B., Comita, L. S., Chase, J. M., Sanders, N. J., Swenson, N. G., Crist, T. O., et al. (2011). Disentangling the Drivers of β Diversity Along Latitudinal and Elevational Gradients. Science 333, 1755–1758. doi: 10.1126/science.1208584
Leibold, M., and Chase, J. (2018). Metacommunity Ecology. Princeton, NJ: Princeton University Press.
Lennon, J., Koleff, P., Greenwood, J., and Gaston, K. (2001). The geographical structure of British bird distributions: diversity, spatial turnover and scale. J. Anim. Ecol. 70, 966–979. doi: 10.1046/j.0021-8790.2001.00563.x
Levins, R. (1969). Some demographic and genetic consequences of environmental heterogeneity for biological control. Bull. Entomol. Soc. Am. 15, 237–240. doi: 10.1093/besa/15.3.237
Lu, M., Vasseur, D., and Jetz, W. (2019). Beta diversity patterns derived from island biogeography theory. Am. Nat. 194, E52–E65. doi: 10.1086/704181
MacArthur, R., and Wilson, E. (1967). The Theory of Island Biogoegraphy. Princeton: Princeton University Press.
McKinney, M. L., and La Sorte, F. A. (2007). Invasiveness and homogenization: synergism of wide dispersal and high local abundance. Glob. Ecol. Biogeogr. 16, 394–400. doi: 10.1111/j.1466-8238.2007.00296.x
Olden, J. D., and Poff, N. L. (2003). Toward a mechanistic understanding and prediction of biotic homogenization. Am. Nat. 162, 442–460. doi: 10.1086/378212
Ontiveros, V., Capitan, J., Arthur, R., Casamayor, E., and Alonso, D. (2019). Colonization and extinction rates estimated from temporal dynamics of ecological communities: the islandr package. Methods Ecol. Evol. 10, 1108–1117. doi: 10.1111/2041-210x.13176
Phillips, O., and Miller, J. (2002). Global Patterns of Plant Diversity: Alwyn H. Gentry’s Forest Transect Data Set. St Louis: Missouri Botanical Garden Press.
Podani, J., and Schmera, D. (2011). A new conceptual and methodological framework for exploring and explaining pattern in presence – absence data. Oikos 120, 1625–1638. doi: 10.1111/j.1600-0706.2011.19451.x
Qian, H., Chen, S., Mao, L., and Ouyang, Z. (2013). Drivers of β-diversity along latitudinal gradients revisited. Glob. Ecol. Biogeogr. 22, 659–670. doi: 10.1111/geb.12020
Rabosky, D. L. (2010). Extinction rates should not be estimated from molecular phylogenies. Evolution 64, 1816–1824. doi: 10.1111/j.1558-5646.2009.00926.x
Schwartz, M. W., Thorne, J. H., and Viers, J. H. (2006). Biotic homogenization of the California flora in urban and urbanizing regions. Biol. Conserv. 127, 282–291. doi: 10.1016/j.biocon.2005.05.017
Smart, S. M., Thompson, K., Marrs, R. H., Le Duc, M. G., Maskell, L. C., and Firbank, L. G. (2006). Biotic homogenization and changes in species diversity across human-modified ecosystems. Proc. R. Soc. B Biol. Sci. 273, 2659–2665. doi: 10.1098/rspb.2006.3630
Sorensen, T. (1948). A method of establishing groups of equal amplitude in plant sociology based on similarity of species contenxt, and its application to analyses of the vegetation on Danish commons. K. Dan. Vidensk. Selsk. Biol. Skr. 5, 1–34.
Stevens, G. (1989). The latitudinal gradients in geographical range: how so many species co-exist in the tropics. Am. Nat. 133, 240–256. doi: 10.1086/284913
Stevens, G. (1992). The elevational gradient in altitudinal range: an extension of Rapoport’s latitudinal rule to altitude. Am. Nat. 140, 893–911. doi: 10.1086/285447
Stevens, G. (1996). Extending Rapoport’s rule to Pacific marine fishes. J. Biogeogr. 23, 149–154. doi: 10.1046/j.1365-2699.1996.00977.x
Stone, L., and Roberts, A. (1990). The checkboard score and species distributions. Oecologia 85, 74–79. doi: 10.1007/bf00317345
Stone, L., and Roberts, A. (1992). Competitive exclusion, or species aggregation? an aid in deciding. Oecologia 91, 419–424. doi: 10.1007/BF00317632
Svenning, J., Flojgaard, C., and Baselga, A. (2011). Climate, history and neutrality as drivers of mammal beta diversity in Europe: insights from multiscale deconstruction. J. Anim. Ecol. 80, 393–402. doi: 10.1111/j.1365-2656.2010.01771.x
Ulrich, W., Baselga, A., Kusumoto, B., Shiono, T., Tuomisto, H., and Kubota, Y. (2017). The tangled link between β- and γ-diversity: a Narcissus effect weakens statistical inferences in null model analyses of diversity patterns. Glob. Ecol. Biogeogr. 26, 1–5. doi: 10.1111/geb.12527
Whittaker, R. (1960). Vegetation of the Siskiyou Mountains, Oregon and California. Ecol. Monogr. 30, 279–338. doi: 10.2307/1943563
Winter, M., Schweiger, O., Klotz, S., Nentwig, W., Andriopoulos, P., Arianoutsou, M., et al. (2009). Plant extinctions and introductions lead to phylogenetic and taxonomic homogenization of the European flora. Proc. Natl. Acad. Sci. U.S.A. 106, 21721–21725. doi: 10.1073/pnas.0907088106
Xing, D., and He, F. (2018). Environmental filtering explains a U-shape latitudinal pattern in regional β-deviation for eastern North American trees. Ecol. Lett. 22, 284–291. doi: 10.1111/ele.13188
Xu, W., Chen, G., Liu, C., and Ma, K. (2015). Latitudinal differences in species abundance distributions, rather than spatial aggregation, explain beta-diversity along latitudinal gradients. Glob. Ecol. Biogeogr. 24, 1170–1180. doi: 10.1111/geb.12331
Zhou, Y., Ochola, A. C., Njogu, A. W., Boru, B. H., Mwachala, G., Hu, G., et al. (2019). The species richness pattern of vascular plants along a tropical elevational gradient and the test of elevational Rapoport’s rule depend on different life-forms and phytogeographic affinities. Ecol. Evol. 9, 4495–4503. doi: 10.1002/ece3.5027
Keywords: beta diversity, island biogeography theory, ecological mechanisms, community assembly, biodiversity survey
Citation: Wu Y, Chen Y and Shen T-J (2020) A Likelihood Framework for Modeling Pairwise Beta Diversity Patterns Based on the Tradeoff Between Colonization and Extinction. Front. Ecol. Evol. 8:64. doi: 10.3389/fevo.2020.00064
Received: 23 August 2019; Accepted: 02 March 2020;
Published: 03 April 2020.
Edited by:
Oana Moldovan, Emil Racovita Institute of Speleology, RomaniaCopyright © 2020 Wu, Chen and Shen. This is an open-access article distributed under the terms of the Creative Commons Attribution License (CC BY). The use, distribution or reproduction in other forums is permitted, provided the original author(s) and the copyright owner(s) are credited and that the original publication in this journal is cited, in accordance with accepted academic practice. No use, distribution or reproduction is permitted which does not comply with these terms.
*Correspondence: Tsung-Jen Shen, dGpzaGVuQG5jaHUuZWR1LnR3
†These authors have contributed equally to this work