 M. Teague O'Mara1,2,3*
 Anne K. Scharf1,2,3
 Jakob Fahr1,4Michael Abedi-Lartey1,3
 Martin Wikelski1,2,3
 Dina K. N. Dechmann1,2,3
 Kamran Safi1,2,3
- 1Department of Migration, Max Planck Institute of Animal Behavior, Radolfzell, Germany
- 2Centre for the Advanced Study of Collective Behaviour, University of Konstanz, Konstanz, Germany
- 3Department of Biology, University of Konstanz, Konstanz, Germany
- 4Braunschweig University of Technology, Zoological Institute, Braunschweig, Germany
Atmospheric conditions impact how animals use the aerosphere, and birds and bats should modify their flight to minimize energetic expenditure relative to changing wind conditions. To investigate how free-ranging straw-colored fruit bats (Eidolon helvum) fly with changing wind support, we use data collected from bats fit with GPS loggers and an integrated triaxial accelerometer and measure flight speeds, wingbeat frequency, and overall dynamic body acceleration (ODBA) as an estimate for energetic expenditure. We predicted that if ODBA reflects energetic expenditure, then we should find a curvilinear relationship between ODBA and airspeed consistent with aerodynamic theory. We expected that bats would lower their airspeed with tailwind support and that ODBA will decrease with increasing tailwinds and increase with wingbeat frequency. We found that wingbeat frequency has the strongest positive relationship with ODBA. There was a small, but negative, relationship between airspeed and ODBA, and bats decreased ODBA with increasing tailwind. Bats flew at ground speeds of 9.6 ± 2.4 ms−1 (Mean ± SD, range: 4.3–23.9 ms−1) and airspeeds of 10.2 ± 2.5 ms−1, and did not modify their wingbeat frequency with speed. Free-ranging straw-colored fruit bats therefore exerted more total ODBA in headwinds but not when they changed their airspeed. It is possible that the flexibility in wingbeat kinematics may make flight of free-ranging bats less costly than currently predicted or alternatively that the combination of ODBA and airspeed at our scales of measurement does not reflect this relationship in straw-colored fruit bats. Further work is needed to understand the full potential of free-ranging bat flight and how well bio-logging techniques reflect the costs of bat flight.
Introduction
Vertebrate flapping flight is an energetically costly, but economical form of locomotion. Many birds and bats modulate their airspeed, the speed at which they fly relative to the moving air column, in relation to the amount of wind support they receive (Hedenström, 2003; Pennycuick, 2008; Safi et al., 2013; Sapir et al., 2014). They generally increase airspeed with headwind and crosswind (Hedenström et al., 2002; Pennycuick, 2008; Kogure et al., 2016), but decrease airspeed with tailwind to lower overall energetic expenditure. However, measuring instantaneous energetic expenditure is difficult in the wild (Butler et al., 2004; Green et al., 2009), and instead of direct measurement, theoretical relationships built from first principles and wind-tunnel experiments are largely applied to predict the energy requirements of free-flying animals (Pennycuick, 1978; Norberg, 1990; Rayner, 1999; Tobalske et al., 2003b). These relationships are based on the size and shape of a bird, its airspeed, and the resulting power requirements for that flight (Rayner, 1999; Pennycuick, 2008). However, predictions from these models do not always match field-based measures, such as the extreme flight speeds of Brazilian free-tailed bats that are far outside the maximum predicted power these small bats should be capable of (McCracken et al., 2016). Body-mounted accelerometers are a way to show how total power requirements change throughout flight in free-ranging animals, as well as shed light on limited aspects of their wingbeat mechanics (Gleiss et al., 2011; Elliott et al., 2013; Bishop et al., 2015; Elliott, 2016; Hicks et al., 2017). By applying accelerometer-derived motion estimates for both behavior and energy expenditure we should be able to better understand the ways that bats and birds respond to their environment.
The use of tri-axial accelerometry (ACC) combined with GPS data provides a window into the energetic strategies used by animals at fine spatial and temporal scales. ACC data can be interpreted as a measure of the amount of effort used to fly, assuming that the costs of movement constitute the bulk of an animal's energy expenditure (Karasov, 1992; Gleiss et al., 2011; Halsey et al., 2011; Hernandez-Pliego et al., 2017). The relative cost of movement has been estimated from ACC using dynamic body acceleration (DBA) and the full sum of all three axes, Overall Dynamic Body Acceleration (ODBA). For birds, ODBA and other DBA measures have been calibrated against energy consumption during running and walking (Wilson et al., 2006), and inferred in free-flying birds through correlations between heart rate and ACC (Duriez et al., 2014; Bishop et al., 2015; Hicks et al., 2017). Furthermore, models of flapping flight estimate biomechanical power from acceleration data (Spivey and Bishop, 2013). While mechanical power output does not have a direct linear relationship with metabolic power input (Biewener, 2006; Gleiss et al., 2011; Spivey and Bishop, 2013), DBA measures can explain a substantial proportion of total daily energetic expenditure (DEE) or energy expenditure during specific activities in vertebrates in general (Gleiss et al., 2011; Elliott et al., 2013; Duriez et al., 2014; Bishop et al., 2015; Elliott, 2016; Stothart et al., 2016; Hicks et al., 2017). This daily, integrative summary of DEE from DBA is even more effective when the portion of high-energy locomotion (e.g., flapping flight) is modeled separately from other behaviors (Green et al., 2009; Elliott et al., 2013; Duriez et al., 2014; Bishop et al., 2015; Stothart et al., 2016). Changes in acceleration can also be used to identify the behavioral context and activity of flight (e.g., flapping vs. gliding) (Elliott et al., 2013; Williams et al., 2015; Abedi-Lartey et al., 2016; Leos-Barajas et al., 2017) as well as stroke frequency and wingbeat strength (Sato et al., 2008; Kogure et al., 2016). These fundamental components have been used to infer foraging success and mass gain via increases in wingbeat frequency (Sato et al., 2008; O'Mara et al., 2019) as well as the costs of movement trajectories (Nathan et al., 2012; Amelineau et al., 2014; Duriez et al., 2014) with wind across various scales (Kogure et al., 2016; Scacco et al., 2019). There is therefore a strong time-integrated relationship between total ODBA and DEE, but it is unknown how ODBA reflects energy expenditure at finer time scales of individual behaviors, or if ODBA reflects the general non-linear relationship of power output across a range of known flight speeds (Spivey and Bishop, 2013).
Experimental work in wind tunnels has yielded the best insight into how birds and bats adjust their flight behavior and energy expenditure to increasing airspeeds. In general, birds fly faster by increasing wingbeat amplitude and/or wingbeat frequency. However, the interaction between these two adjustments can be species- and speed-dependent (Tobalske et al., 2003a; Tobalske, 2007; Altshuler et al., 2015), and be combined with an elongation of the downstroke ratio and rotation of the wings into a more vertical orientation. While birds and bats fly in similar ways at a broad level, flight behavior in these groups can differ dramatically. Bat wing motions tend to have similar, but greater overall amplitude than birds (Taylor et al., 2003), and bat wings are both relatively massive and have that mass distributed more distally than birds (Thollesson and Norberg, 1991). Like birds, bats modulate their wingbeat amplitude with speed, but to a lesser degree and tend to show either a negative or no relationship between airspeed and wingbeat frequency (Riskin et al., 2010; Hubel et al., 2016). To increase airspeed, bats reduce wingbeat frequency and wingbeat amplitude, but place their wings in a more vertical orientation (Bullen and McKenzie, 2002; Riskin et al., 2010; Iriarte-Diaz et al., 2012; Swartz et al., 2012; Hubel et al., 2016). Furthermore, large fruit bats decrease wingbeat frequency, extend their wings less fully across the entire wingbeat and increase the duration of their wingbeat downstroke to fly faster across a speed range of 3–6 ms−1 (Riskin et al., 2010). For many species, however, the airspeeds that typify free-ranging flight have yet to be achieved in wind tunnels making it difficult to extrapolate from captive conditions to those in the wild where animals may both choose faster speeds and must compensate for changing aerial environments.
The African straw-colored fruit bat (Eidolon helvum) is an ideal species to test how individual measures of flight behavior and energetics from accelerometry relate to environmental conditions. Fruit bats use constant flapping flight and rarely glide or soar (Harris et al., 1990; Lindhe Norberg and Norberg, 2012). During their commuting flights of up to 90 km from a central roost (Sapir et al., 2014; Fahr et al., 2015; Abedi-Lartey et al., 2016; van Toor et al., 2019), they decrease airspeed with wind support, and increase airspeed with crosswinds (Sapir et al., 2014). We hypothesize that if ODBA reflects relative energetic expenditure or power output in bats, then we will find a curvilinear relationship between ODBA and airspeed similar to the theoretical total power requirements of flight (Usherwood et al., 2011; Spivey and Bishop, 2013). Furthermore, if these bats follow aerodynamic theory, they should reduce airspeed with wind support. We then predict a negative relationship between ODBA and tailwind support, and that ODBA will be strongly and positively associated with wingbeat frequency. Lastly, we expect that as in wind tunnel studies, wingbeat frequency will decrease with airspeed and increase with wind support.
Methods
Capture and Handling
We collected data from 36 Eidolon helvum that wore collar-mounted (O'Mara et al., 2014) GPS and triaxial accelerometry (ACC) loggers (e-obs, GmbH, Munich, Germany). The loggers recorded position every 2.5 min and acceleration every minute for a duration of 13–14 s at a sampling frequency of 18.74–20 Hz (Table 1). These data were taken from a larger data set with a mix of logger positions and sampling rates. The full data set of all animals is available at the Movebank Data Repository doi: 10.5441/001/1.k8n02jn8 (Scharf et al., 2019). Data were collected in Ouagadougou (12.397° N, 1.488° W), Burkina Faso; in Kibi (6.165° N, 0.555° W), Ghana, and in Kasanka National Park (12.586° S, 30.243° E), Zambia where all animals were locally foraging from a central roost during tracking. Eidolon helvum were captured early in the morning with canopy mist nets as they returned from foraging which ensured that the animals had fed before handling (Fahr et al., 2015). We weighed all bats with Pesola spring balances (±0.5 g) and selected individuals with sufficient body mass (278.4 ± 20.5 g) to carry GPS + ACC loggers. Mean total logger mass was 20.95 ± 0.90 g which was 7.56 ± 0.59% of body mass.

Table 1. Deployment information for GPS+ACC loggers on E. helvum.
Accelerometry Analysis
We extracted wingbeat frequency and ODBA from the ACC data. As indicated by the manufacturer we first transformed the raw acceleration data into ms−2. ACC data were collected in bursts on three axes (X—sway, Y—surge, Z—heave, Figure 1) for a duration of 13–14 s every 1 min at 18.74–20 Hz (Table 1). As the tags were attached on a collar and could move freely around the neck of the animal, the Z and X axis orientation may not be consistent. However, measurement along Y remains in the same orientation regardless of the position on the collar. We applied an ordination to rotate the acceleration data in uncorrelated and orthogonal principal components per burst on all three axes. We extracted the first PC representing the axis containing most of the variance (PC1 mean per individual: 82 ± 6% of variance, range: 70–92%). We extracted the oscillation owed to the movement using a Fast Fourier Transformation (FFT) on the PC1 of each burst. The FFT provided the spectrogram and thus the dominant frequency of each burst corresponding to the wingbeat frequency, if present. We also calculated the average ODBA value for each burst (j) along the three axes (x, y, z) as:
xi represents the ith component and the mean of all n samples of the x-axis of burst j, and likewise for y and z. Based on the variance in the amplitude of the dominant frequency extracted from the FFT and the ODBA extracted from the acceleration data, each burst could be assigned to either flapping or non-flapping. High variance in the dominant frequency was a reliable indicator of the presence of a regular oscillation in the acceleration data. If no regular oscillation was recorded, the FFT resulted in a weak and shallow dominant frequency with little difference in amplitude. Clear outliers in respect to wingbeat frequency (<2 or >8 bps, representing about 1% of all bursts classified as flapping) were removed from further analysis. The moveACC R library used to do this can be found at: https://gitlab.com/anneks/moveACC.git.
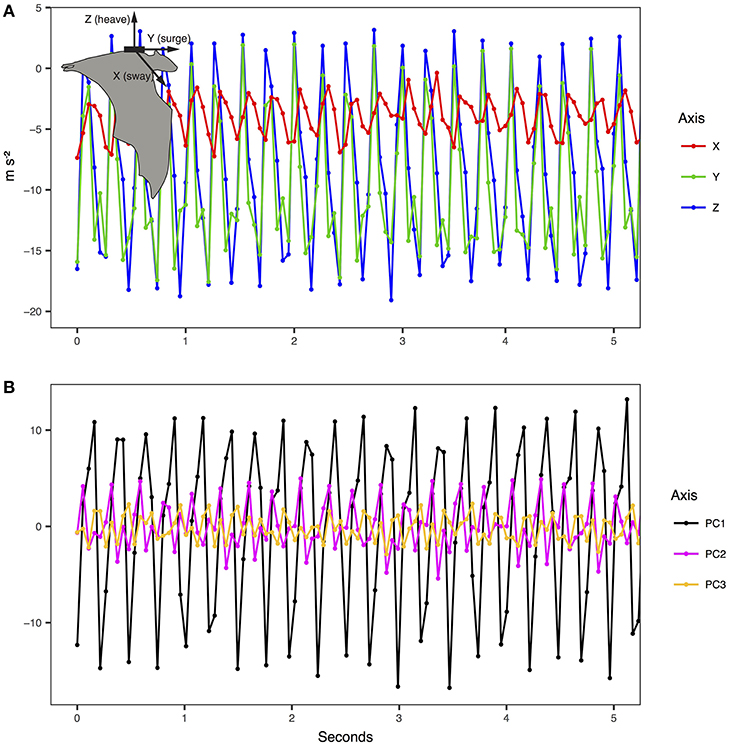
Figure 1. Example of tri-axial accelerometry measurements and principal component conversion for E. helvum (inset). (A) The raw data were transformed according to manufacturer instructions into ms−2. (B) The principal components reflect the standardized major wave forms for the three axes for each burst of acceleration.
Airspeed Calculation
To calculate airspeed, we first annotated the GPS tracks with the wind conditions at every location using the Env-DATA tool in Movebank (Dodge et al., 2013). We used the U and V component of wind from the “ECMWF Interim Full Daily SFC Wind” 10 m above ground data set (Dee et al., 2011). The U component refers to the velocity of the East-West (zonal) component of wind where positive values indicate west to east flow, and the V component refers to the velocity of the North-South (meridional) component of wind where positive values indicate south to north flow. The ECMWF reanalysis provides estimates of weather conditions at a resolution of 0.75 degrees (ca. 83.4 km), every 6 h at 10 m above ground. This wind information gives broad insight into how bats compensate for environmental conditions, and while this may not be wholly reflective of the instantaneous conditions experienced by the bat, these prevailing wind speed data combined with GPS at similar resolution to our data set have allowed detailed inference into the flight behavior of bats and birds (Safi et al., 2013; Sapir et al., 2014; Flack et al., 2016; Van Doren et al., 2016). We then calculated the ground speed for each segment between consecutive GPS points and calculated airspeed, crosswind and wind support (Safi et al., 2013) using the associated wind conditions. Wind support was calculated as the length of the wind vector in the direction of the bat's flight where positive values represent tailwind and negative values headwind and are given as total support in ms−1. Crosswind was calculated as the value of the speed of the wind vector perpendicular to the travel direction (Safi et al., 2013). The absolute value of crosswind, regardless of the side from which it came, was then used in analysis.
Segment Behavioral Classification
To identify periods of continuous flight we joined the GPS and ACC data sorted by timestamps per individual. Based on the time of the data recorded we assigned the ACC data to each corresponding segment between two consecutive GPS locations. We identified segments that contained missed fixes based on their corresponding GPS schedule and excluded them from further analysis. For each of the remaining segments we calculated the percentage of ACC bursts identified with flapping behavior. We only included segments where 100% of the bursts were classified as flapping in our analysis to further restrict the data to segments with continuous flight. We calculated the mean value of the wingbeat frequency and ODBA for each segment.
Analysis
We used a series of generalized linear mixed effects models in R 3.3.2 (R Core Team, 2016) in MASS::glmmPQL (Venables and Ripley, 2002; Pinheiro et al., 2018) to test how wind conditions affect different aspects of flight. The dataset used in these models (Table S1) contained only those segments assigned with flapping without missed GPS fixes. This resulted in a total of 3,391 locations from 36 bats over 138 nights (3.8 ± 2.4 nights per bats, range: 1–8 nights). As the wind conditions could only be calculated for GPS positions, we assigned the mean wingbeat frequency and ODBA values of the segment to the last point of each segment. We constructed models for each of the response variables: ground speed of the segment, airspeed, ODBA, and wingbeat frequency. Each model included fixed effects of wind support and the absolute value of crosswind as a cofactor. Additionally, we constructed a single model that included ODBA as the response variable, with wind support, absolute value of crosswind, wingbeat frequency, and airspeed as fixed effects. Finally, we also tested in two separate models how wingbeat frequency relates to airspeed and to ground speed of the segment. All models accounted for individual difference by including individual identity as random effect nested within tag manufacturing generation as each generation of tag had its own acceleration transformation procedure. We found no evidence of a temporal autocorrelation structure in our data. We used a Box-Cox transformation of the response variables to meet conditions for Gaussian linear models using the function MASS::boxcox (Venables and Ripley, 2002) and report the power transformation exponent (Table 2). The predictions were back-transformed accordingly. We calculated p-values for fixed effects through Wald approximation in nlme (Pinheiro et al., 2018), and because of our large sample size and nested random effects we consider p = 0.001 as our significance threshold.
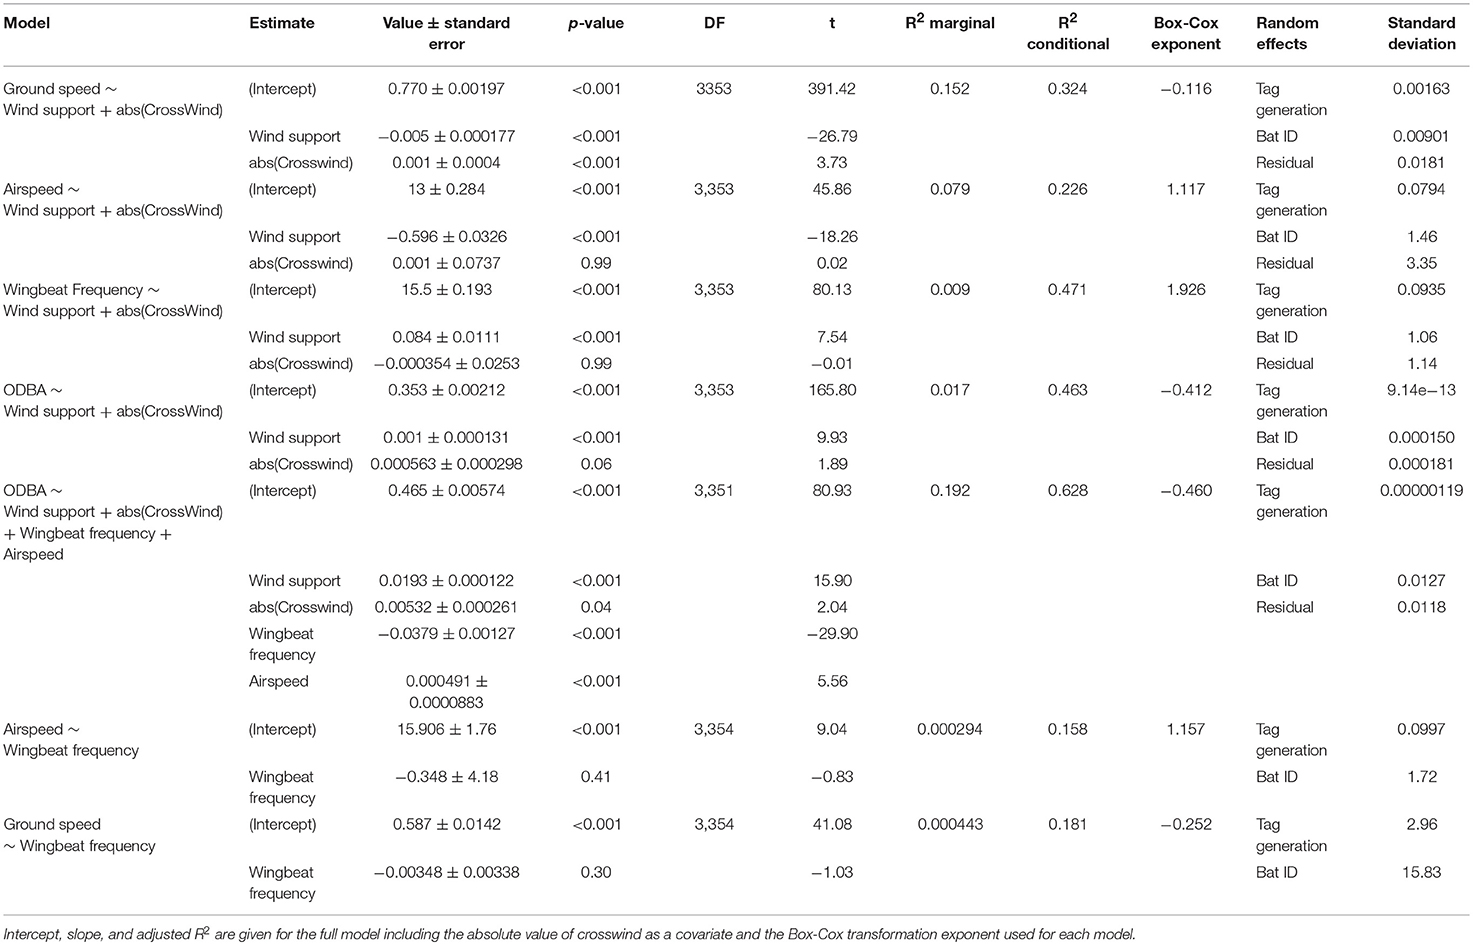
Table 2. GLMM results for the effect of wind support on bat ground speed, airspeed, wingbeat frequency, and ODBA.
Data Availability Statement
All raw GPS and ACC data are available from the Movebank Data Repository doi: 10.5441/001/1.k8n02jn8. The final annotated dataset used in our analyses can be found in Supplementary Dataset 1.
Results
Data from 36 straw-colored fruit bats allowed us to calculate ODBA and wingbeat frequency from the tri-axial accelerometer (Figure 1), and ground speed from GPS. Using regional wind models we then derived airspeed, wind support, and crosswinds for each segment between successive GPS points. In all of our models, there was substantial individual variation as well as effects of the GPS tag generation, with individual identity showing a larger standard deviation in all models. The combined random effects of tag generation and individual identity accounted for a moderate, but inconsistent, amount of variation within each model (Table 2). The addition of the random effects always substantially increased the fit of the model (R2 conditional, Table 2) when compared to the fixed effects alone (R2 marginal, Table 2).
Straw-colored fruit bats flew at ground speeds of 4.3–23.9 ms−1 (Mean ± SD: 9.6 ± 2.4, Figure 2A), which resulted in a mean airspeed of 10.2 ± 2.5 ms−1 (range: 0.4–22.7 ms−1, Figure 2B). To do so, they used a relatively narrow range of wingbeat frequencies (4.12 ± 0.21 bps, range: 3.19–5.04 bps, Figure 2C), and ODBA (12.76 ± 1.54 ms−2, range: 8.78–19.81 ms−2, Figure 2D). Bats modulated their flight behavior in response to the direction of wind support (Figure 2). Ground speed increased with tailwind (Figure 2B, Table 2), and bats decreased airspeed with increasing tailwind support (Figure 2B, Table 2). Wingbeat frequency increased slightly with wind support (Figure 2C) and ODBA decreased with wind support (Figure 2D). Crosswinds had a slightly negative effect on ground speed (Figure S1A), but no effect on total airspeed, wingbeat frequency, or ODBA (Table 2, Figures S1B–D).
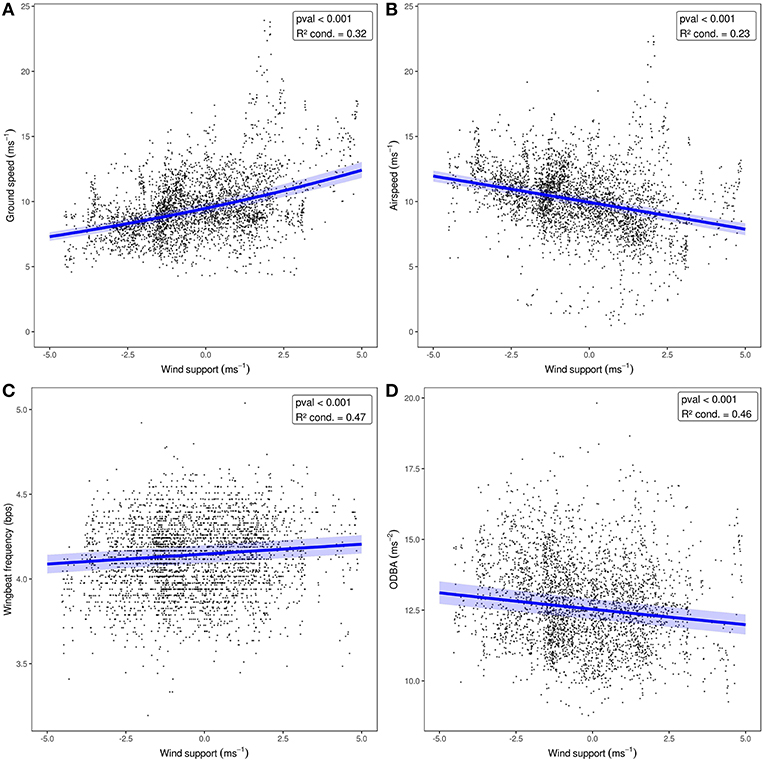
Figure 2. The effect of wind support (headwind to tailwind) on E. helvum flight behavior when crosswinds are held at zero. GLMM results are shown in blue for (A) ground speed, (B) airspeed, (C) wingbeat frequency, and (D) ODBA. The 95% confidence interval for each model, including random effects, is shown as the shaded area around the line.
When we tested the effects of wind support, crosswinds, wingbeat frequency, and airspeed on the ODBA generated by bats in a single model (Figure 3, Table 2), we again found that ODBA decreased with wind support (Figure 3A) and that there was no effect of crosswinds (Figure 3B). ODBA was strongly and positively associated with wingbeat frequency (Figure 3C) and decreased with airspeed. Wingbeat frequency was not associated with either airspeed (Figure 4A, Table 2) or ground speed (Figure 4B). Bats therefore generated less total ODBA as they received increasing tailwind support and did not increase wingbeat frequency to fly faster at lower ODBA values.
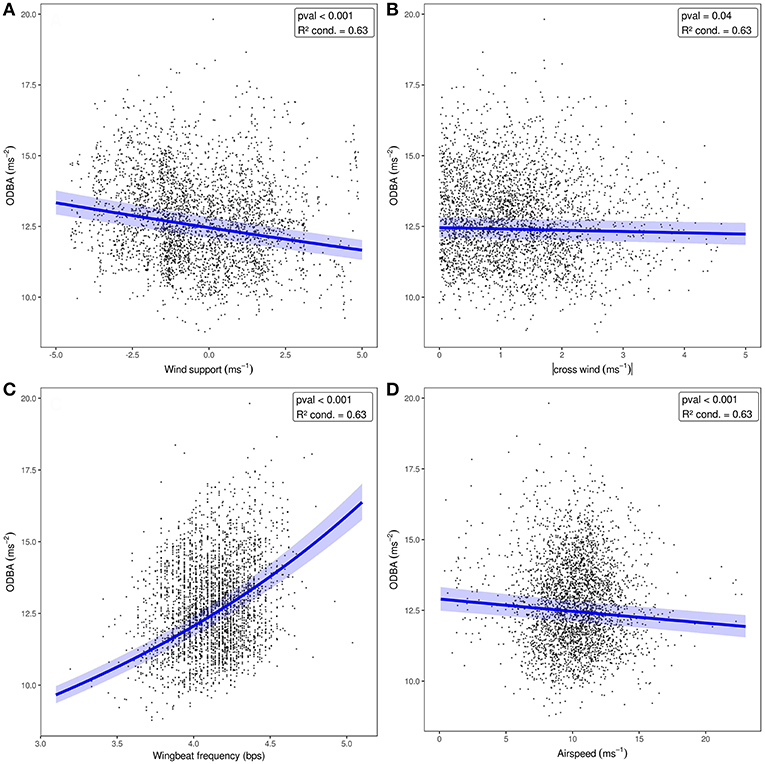
Figure 3. ODBA relative to wind support (A), crosswind (B), wingbeat frequency (C), and airspeed (D) included together in one model. The blue lines show predicted ODBA for each fixed effect where wingbeat frequency and airspeed were set to their means [4.2, 10.2, respectively for A,B], and the effect of wind support and crosswind were set to 0 (C,D). The 95% confidence interval for each model, including random effects, is shown as the shaded area around the line.
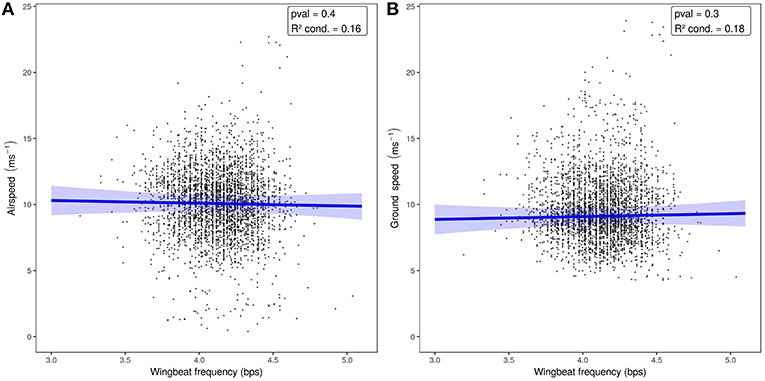
Figure 4. Airspeed (A) and ground speed (B) relative to wingbeat frequency. The predictive models and 95%CI (in blue) show no relationship between wingbeat frequency and either measure of speed.
Discussion
By integrating GPS and ACC data collected from free flying E. helvum with regional wind models, we show that straw-colored fruit bats increase wingbeat frequency with wind support (Figure 2C), and that flying into headwind increases fruit bat ODBA, while increasing airspeed slightly decreases ODBA (Figures 3A,D, Table 2). As in previous work (Sapir et al., 2014), bats reduced their airspeed with increasing wind support (Figure 2B) likely to reduce costs of flight, or to maintain ground speed to aid in visual navigation (Chapman et al., 2011; Hedenström and Åkesson, 2017). However, these airspeed changes were not achieved by changing wingbeat frequency or increasing ODBA accumulation.
ODBA had a strongly positive relationship with wingbeat frequency, which is expected from work on free-ranging birds (Elliott et al., 2014; Bishop et al., 2015). Beyond this first generalization, relationships between ODBA and wingbeat frequency with airspeed or wind support do not follow consistent patterns among species. While several studies show that free-ranging animals adjust their flight speeds in response to wind support and cross winds, there are few examples of how the mechanics of flight behavior respond to changing wind conditions. In general, free-flying birds flap their wings faster to increase airspeed (Usherwood et al., 2011; Elliott et al., 2014), and some increase wingbeat amplitude or DBA (Usherwood et al., 2011; Elliott et al., 2014), while others do not (Kogure et al., 2016). Free-flying European shags do not change their wingbeat frequency relative to head or tailwind, but show a general curvilinear relationship between wind support and wingbeat strength (Kogure et al., 2016). It could be expected that if the frequency and strength of a wingbeat comprise the bulk of ODBA, then either no relationship or a negative relationship (Kogure et al., 2016) with wind support would appear, such as the relationship we find in E. helvum. However, kittiwakes and murres decrease wingbeat frequency with wind support, and increase DBA with increasing wind support (Elliott et al., 2014). With these few studies, the instantaneous relationships between DBA measures and wind support seem to be complex and species-specific, but could also be related to the resolution of the data measured. Leveraging the existing wealth of GPS+ACC tracking, especially when combined with higher resolution wind data, would help to clarify these patterns across a broader range of conditions.
The relationship between airspeed and power (Rayner, 1999; Pennycuick, 2008) predicts that if DBA is a true measure of energy expenditure or effort (Usherwood et al., 2011; Spivey and Bishop, 2013), then we should observe some curvilinear relationship between ODBA and airspeed in the bats we sampled. ODBA had a more strongly negative relationship with wind support than airspeed, illustrating that bats required more effort to make forward progress when faced with headwind, regardless of their airspeed. This is reasonable as bats increased their airspeed when facing headwinds, and that low speeds should be the most energetically costly for birds and bats (Tobalske et al., 2003b; Hedenstrom and Johansson, 2015; Hubel et al., 2016). However, there are several non-mutually exclusive explanations for why ODBA did not have a strong relationship with airspeed, especially at the high end of speed. First, the wind data used in this study were collected at a relatively large spatial (83 km) and temporal (6 h) scale. While many of our measures directly related to wind perform as expected (e.g., reduction of airspeed and reduced ODBA with wind support), it is possible that wind sampled at this scale cannot give a high enough resolution insight into accelerometry-derived measures of energetic expenditure relative to speed. Additionally, the true speed-power curve predicted for E. helvum may be very flat at moderate to high speeds (Dial et al., 1997; Tobalske et al., 2003b; von Busse et al., 2013) further complicating this relationship. Second, in all of our models, the inclusion of random effects of tag generation and individual identity greatly improved the conditional R2 of the models over the marginal R2, sometimes by as much as 0.46. This suggests that the movement patterns among individuals can be highly variable, and that bats likely employ a diversity of solutions to compensate for wind support to generate air speeds and ground speeds (Sapir et al., 2014). Since bats make many adjustments in the shape of their wings and the angle of attack of their wingbeat to fly faster (Riskin et al., 2008; Iriarte-Diaz et al., 2011; Hubel et al., 2012, 2016), these adjustments are unlikely to be captured by ODBA (Spivey and Bishop, 2013).
It is possible that due to bat flight kinematics, accelerometers do not accurately capture bat flight effort, despite their effectiveness on birds. Acceleration measures have the greatest reproducibility and comparability across individuals and taxa when placed close to the center of mass (Halsey et al., 2011; Spivey and Bishop, 2013) to avoid the increased acceleration experienced as one moves away from this point. The center of mass of a bat, however, changes across a wingbeat cycle (Iriarte-Diaz et al., 2011). The tag placement on the collar, when on the back of the neck, would have been cranial (ahead) to the center of mass on the bats upstroke and directly dorsal (above) to the center of mass on the downstroke (Iriarte-Diaz et al., 2011). As bats fly faster, the largest differences in acceleration are found in surge (or Y in this study, Figure 1), while the vertical acceleration of the center of mass largely tracks speed (Iriarte-Diaz et al., 2011). Furthermore, as bat wings are both relatively more massive and have that mass distributed more distally than birds (Thollesson and Norberg, 1991), even accelerometers mounted directly above the center of mass may not fully capture aspects of wingbeat kinematics such as amplitude. Wingbeat frequencies and relative measures such as ODBA should still reflect the animal's movement, but changes in the distribution of lift and thrust may not be tractable with a single three-dimensional accelerometer. Calibration of accelerometers on bats flying at known speeds in a wind tunnel would delineate these relationships.
It is also possible that instead of an instantaneous measure of power output, ODBA may reflect the costs of movement across longer periods of time (Elliott et al., 2013; Halsey and Goldbogen, 2017). Calibrations of ODBA against metabolic rate are typically conducted with walking or running animals, and generally show positive relationships (Halsey et al., 2011). This includes birds, for which there is currently no direct calibration between in-flight DBA and metabolic rate, though heart rate and DBA generally show positive relationships (Duriez et al., 2014; Bishop et al., 2015; Hicks et al., 2017), and DBA measures are positively correlated with First-Principals estimates for climbing power in Harris's hawks (Van Walsum et al., 2019). Despite this, the sum of DBA does explain a substantial (>70%) amount of daily energetic expenditure in many flying birds (Gleiss et al., 2011; Elliott et al., 2013; Duriez et al., 2014; Bishop et al., 2015; Elliott, 2016; Stothart et al., 2016; Hicks et al., 2017). As an integrative measure, DBA can explain 81% of DEE (Elliott et al., 2013); however, models using only the time away from the nest, without acceleration, also explain 72% of DEE (Elliott et al., 2013; Stothart et al., 2016), which is within the 18% range of error for doubly-labeled water studies (Speakman, 1997; Butler et al., 2004). Direct calibration of accelerometry with both energetic measures and kinematics across a range of known speeds will clarify how current bio-logging techniques capture the energetics of bat flight.
We found no relationship between wingbeat frequency and airspeed, and ODBA decreased slightly with faster airspeeds. To fly faster in wind tunnels bats generally do not change wingbeat frequency, but rely on amplitude and kinematic adjustments (Hedenstrom et al., 2007; Hubel et al., 2010, 2012, 2016; Riskin et al., 2010, 2012; Iriarte-Diaz et al., 2011, 2012; Hedenstrom and Johansson, 2015; Hedenström and Lindström, 2017). Eidolon helvum in a wind tunnel fly with wingbeat frequencies of 4.5–5.7 bps (Carpenter, 1986), and video of free-flying E. helvum emerging from their roosts showed bats flew at 4.4 ± 0.43 bps (Lindhe Norberg and Norberg, 2012). Both of these short estimates are higher than our mean observations (4.07 ± 0.28 bps, maximum: 5.96), but still are within the range of frequencies measured. The free-flying bats we sampled traveled with airspeeds substantially higher than the speeds at which many bats will willingly fly in wind tunnel studies (von Busse et al., 2013), and flew with lower wingbeat frequencies that appear to be consistent. This may be facilitated by the large variation in E. helvum wing camber and Strouhal number (ratio of stroke frequency and amplitude by speed) when compared to other pteropodid bats (Riskin et al., 2010). The many joints and anisotropic, compliant wing membrane of bat wings (Swartz et al., 1996; Cheney et al., 2015; Czenze et al., 2017) allow fine kinematic control by E. helvum, which could mean that their true speed-power curve is very flat (Tobalske et al., 2003b), and there is a broad range of airspeeds over which they fly at the same efficiency. Eidolon helvum appear to choose a wingbeat frequency and then rely on the strength of their wingbeats and kinematic adjustments to the shape and attack angle of their wingbeats (Riskin et al., 2010; Iriarte-Diaz et al., 2011, 2012) to modify their flight in response to changing wind conditions.
In general, the combination of GPS and accelerometry gives unparalleled access to the flight behavior of free-ranging individuals over extended time and space, especially when combined when high-resolution wind models. However, the relationships derived from birds may not directly translate to bats without additional calibration. Future work that delineates the relationship between on-board accelerometry and DBA measures with metabolic and mechanical power and flight kinematics across a range of airspeeds will help clarify what we may infer from data derived from bio-logging techniques. This will yield greater insight into the energy landscapes that animals face and the decisions they take in relationship to their environments in the wild.
Ethics Statement
All work was in accordance to local customs and the guidelines of the American Society of Mammalogists for the use of wild animals in research (Sikes and Gannon, 2011) and was carried out under approval from local authorities. Work in Ghana was approved by the Wildlife Division of the Forestry Commission (FCWD/GH-01 24/08/09, 02/02/11), and by Colonel Samuel Bel-Nono, Director of the Veterinary Services, Ghana Armed Forces Medical Directorate. Work in Zambia was approved by the Zambia Wildlife Authority (ZAWA 421902, 29/11/13, ZAWA 547649, 26/11/14). Work in Burkina Faso was conducted under approval from Mr. Moustapha Sarr, Director of the Parc Urbain Bangr-Weoogo, Ouagadougou.
Author Contributions
MTO, AS, DD, MW, JF, and KS designed the study. DD, MW, JF, and MA-L collected the data. AS, KS, and MTO analyzed the data. MTO, AS, and KS wrote the manuscript. All authors commented on and approved the manuscript.
Funding
This study was supported by the Max Planck Institute for Ornithology, the Max Planck Society, and field work in Zambia 2014 was supported through funds obtained by the Institute of Novel and Emerging Infectious Diseases (Prof. Dr. Martin H. Groschup, Friedrich-Loeffler-Institute, Greifswald, Germany) from the Federal Foreign Office of Germany (ref # ZMVI6-FKZ2513AA0374).
Conflict of Interest Statement
The authors declare that the research was conducted in the absence of any commercial or financial relationships that could be construed as a potential conflict of interest.
Acknowledgments
We thank Richard Suu-Ire for help with logistics and permits in Ghana, Lackson Chama for help with permits in Zambia, and Sebastian Stockmaier, Roland Kays, Natalie Weber and Frank Willems for help in the field in Zambia. We would also like to thank Sarah Davidson and the Movebank team for their help with data curation. We also thank Sharon Swartz for comments on a previous draft of this manuscript that greatly improved this work, as well as comments from the reviewers (AB and JS-B) and the editor, Frants Jensen.
Supplementary Material
The Supplementary Material for this article can be found online at: https://www.frontiersin.org/articles/10.3389/fevo.2019.00200/full#supplementary-material
References
Abedi-Lartey, M., Dechmann, D. K. N., Wikelski, M., Scharf, A. K., and Fahr, J. (2016). Long-distance seed dispersal by straw-coloured fruit bats varies by season and landscape. Glob. Ecol. Conserv. 7, 12–24. doi: 10.1016/j.gecco.2016.03.005
Altshuler, D. L., Bahlman, J. W., Dakin, R., Gaede, A. H., Goller, B., Lentink, D., et al. (2015). The biophysics of bird flight: functional relationships integrate aerodynamics, morphology, kinematics, muscles, and sensors. Can. J. Zool. 93, 961–975. doi: 10.1139/cjz-2015-0103
Amelineau, F., Peron, C., Lescroel, A., Authier, M., Provost, P., and Gremillet, D. (2014). Windscape and tortuosity shape the flight costs of northern gannets. J. Exp. Biol. 217 (Pt 6), 876–885. doi: 10.1242/jeb.097915
Biewener, A. A. (2006). Patterns of mechanical energy change in tetrapod gait: pendula, springs and work. J. Exp. Zool. A Comp. Exp. Biol. 305, 899–911. doi: 10.1002/jez.a.334
Bishop, C. M., Spivey, R. J., Hawkes, L. A., Batbayar, N., Chua, B., Frappell, P. B., et al. (2015). The roller coaster flight strategy of bar-headed geese conserves energy during Himalayan migrations. Science 347, 250–254. doi: 10.1126/science.1258732
Bullen, R. D., and McKenzie, N. L. (2002). Scaling bat wingbeat frequency and amplitude. J. Exp. Biol. 205, 2615–2626.
Butler, P. J., Green, J. A., Boyd, I., and Speakman, J. (2004). Measuring metabolic rate in the field: the pros and cons of the doubly labelled water and heart rate methods. Funct. Ecol. 18, 168–183. doi: 10.1111/j.0269-8463.2004.00821.x
Carpenter, R. E. (1986). Flight physiology of intermediate-sized fruit bats (Pteropodidae). J. Exp. Biol. 120, 79–103.
Chapman, J. W., Klaassen, R. H., Drake, V. A., Fossette, S., Hays, G. C., Metcalfe, J. D., et al. (2011). Animal orientation strategies for movement in flows. Curr. Biol. 21, R861–870. doi: 10.1016/j.cub.2011.08.014
Cheney, J. A., Konow, N., Bearnot, A., and Swartz, S. M. (2015). A wrinkle in flight: the role of elastin fibres in the mechanical behaviour of bat wing membranes. J. R. Soc. Interface 12:20141286. doi: 10.1098/rsif.2014.1286
Czenze, Z. J., Brigham, R. M., Hickey, A. J. R., and Parsons, S. (2017). Stressful summers? Torpor expression differs between high- and low-latitude populations of bats. J. Mammal. 98, 1249–1255. doi: 10.1093/jmammal/gyx071
Dee, D. P., Uppala, S. M., Simmons, A. J., Berrisford, P., Poli, P., Kobayashi, S., et al. (2011). The ERA-Interim reanalysis: configuration and performance of the data assimilation system. Q. J. R. Meteorol. Soc. 137, 553–597. doi: 10.1002/qj.828
Dial, K. P., Biewener, A. A., Tobalske, B. W., and Warrick, D. R. (1997). Mechanical power output of bird flight. Nature 390, 67–70. doi: 10.1038/36330
Dodge, S., Bohrer, G., Weinzierl, R., Davidson, S. C., Kays, R., Douglas, D., et al. (2013). The environmental-data automated track annotation (Env-DATA) system: linking animal tracks with environmental data. Mov. Ecol. 1:3. doi: 10.1186/2051-3933-1-3
Duriez, O., Kato, A., Tromp, C., Dell'Omo, G., Vyssotski, A. L., Sarrazin, F., et al. (2014). How cheap is soaring flight in raptors? A preliminary investigation in freely-flying vultures. PLoS ONE 9:e84887. doi: 10.1371/journal.pone.0084887
Elliott, K. H. (2016). Measurement of flying and diving metabolic rate in wild animals: review and recommendations. Comp. Biochem. Physiol. A Mol. Integr. Physiol. 202, 63–77. doi: 10.1016/j.cbpa.2016.05.025
Elliott, K. H., Chivers, L. S., Bessey, L., Gaston, A. J., Hatch, S. A., Kato, A., et al. (2014). Windscapes shape seabird instantaneous energy costs but adult behavior buffers impact on offspring. Mov. Ecol. 2:17. doi: 10.1186/s40462-014-0017-2
Elliott, K. H., Le Vaillant, M., Kato, A., Speakman, J. R., and Ropert-Coudert, Y. (2013). Accelerometry predicts daily energy expenditure in a bird with high activity levels. Bio. Lett. 9:20120919. doi: 10.1098/rsbl.2012.0919
Fahr, J., Abedi-Lartey, M., Esch, T., Machwitz, M., Suu-Ire, R., Wikelski, M., et al. (2015). Pronounced seasonal changes in the movement ecology of a highly gregarious central-place forager, the African straw-coloured fruit bat (Eidolon helvum). PLoS ONE 10:e0138985. doi: 10.1371/journal.pone.0138985
Flack, A., Fiedler, W., Blas, J., Pokrovsky, I., Kaatz, M., Mitropolsky, M., et al. (2016). Costs of migratory decisions: a comparison across eight white stork populations. Sci. Adv. 2:e1500931. doi: 10.1126/sciadv.1500931
Gleiss, A. C., Wilson, R. P., and Shepard, E. L. C. (2011). Making overall dynamic body acceleration work: on the theory of acceleration as a proxy for energy expenditure. Methods Ecol. Evol. 2, 23–33. doi: 10.1111/j.2041-210X.2010.00057.x
Green, J. A., Halsey, L. G., Wilson, R. P., and Frappell, P. B. (2009). Estimating energy expenditure of animals using the accelerometry technique: activity, inactivity and comparison with the heart-rate technique. J. Exp. Biol. 212 (Pt 4), 471–482. doi: 10.1242/jeb.026377
Halsey, L. G., and Goldbogen, J. (2017). Relationships grow with time: a note of caution about energy expenditure-proxy correlations, focussing on accelerometry as an example. Funct. Ecol. 31, 1176–1183. doi: 10.1111/1365-2435.12822
Halsey, L. G., Shepard, E. L., and Wilson, R. P. (2011). Assessing the development and application of the accelerometry technique for estimating energy expenditure. Comp. Biochem. Physiol. A Mol. Integr. Physiol. 158, 305–314. doi: 10.1016/j.cbpa.2010.09.002
Harris, S., Cresswell, W. J., Forde, P. G., Trewhella, W. J., Woollard, T., and Wray, S. (1990). Home-range analysis using radio-tracking data—a review of problems and techniques particularly as applied to the study of mammals. Mamm. Rev. 20, 97–123.
Hedenström, A. (2003). “Twenty-Three Testable Predictions About Bird Flight,” in Avian Migration, eds P. Berthold, E. Gwinner, and E. Sonnenschein (Berlin: Springer), 563–582.
Hedenström, A., and Åkesson, S. (2017). Adaptive airspeed adjustment and compensation for wind drift in the common swift: differences between day and night. Anim. Behav. 127, 117–123. doi: 10.1016/j.anbehav.2017.03.010
Hedenström, A., Alerstam, T., Green, M., and Gudmundsson, G. (2002). Adaptive variation of airspeed in relation to wind, altitude and climb rate by migrating birds in the Arctic. Behav. Ecol. Sociobiol. 52, 308–317. doi: 10.1007/s00265-002-0504-0
Hedenstrom, A., and Johansson, L. C. (2015). Bat flight: aerodynamics, kinematics and flight morphology. J. Exp. Biol. 218 (Pt 5), 653–663. doi: 10.1242/jeb.031203
Hedenstrom, A., Johansson, L. C., Wolf, M., von Busse, R., Winter, Y., and Spedding, G. R. (2007). Bat flight generates complex aerodynamic tracks. Science 316, 894–897. doi: 10.1126/science.1142281
Hedenström, A., and Lindström, Å. (2017). Wind tunnel as a tool in bird migration research. J. Avian Biol. 48, 37–48. doi: 10.1111/jav.01363
Hernandez-Pliego, J., Rodriguez, C., Dell'Omo, G., and Bustamante, J. (2017). Combined use of tri-axial accelerometers and GPS reveals the flexible foraging strategy of a bird in relation to weather conditions. PLoS ONE 12:e0177892. doi: 10.1371/journal.pone.0177892
Hicks, O., Burthe, S., Daunt, F., Butler, A., Bishop, C., and Green, J. A. (2017). Validating accelerometry estimates of energy expenditure across behaviours using heart rate data in a free-living seabird. J. Exp. Biol. 220 (Pt 10), 1875–1881. doi: 10.1242/jeb.152710
Hubel, T. Y., Hristov, N. I., Swartz, S. M., and Breuer, K. S. (2012). Changes in kinematics and aerodynamics over a range of speeds in Tadarida brasiliensis, the Brazilian free-tailed bat. J. R. Soc. Interface 9, 1120–1130. doi: 10.1098/rsif.2011.0838
Hubel, T. Y., Hristov, N. I., Swartz, S. M., and Breuer, K. S. (2016). Wake structure and kinematics in two insectivorous bats. Philos. Trans. R. Soc. B 371:20150385. doi: 10.1098/rstb.2015.0385
Hubel, T. Y., Riskin, D. K., Swartz, S. M., and Breuer, K. S. (2010). Wake structure and wing kinematics: the flight of the lesser dog-faced fruit bat, Cynopterus brachyotis. J. Exp. Biol. 213 (Pt 20), 3427–3440. doi: 10.1242/jeb.043257
Iriarte-Diaz, J., Riskin, D. K., Breuer, K. S., and Swartz, S. M. (2012). Kinematic plasticity during flight in fruit bats: individual variability in response to loading. PLoS ONE 7:e36665. doi: 10.1371/journal.pone.0036665
Iriarte-Diaz, J., Riskin, D. K., Willis, D. J., Breuer, K. S., and Swartz, S. M. (2011). Whole-body kinematics of a fruit bat reveal the influence of wing inertia on body accelerations. J. Exp. Biol. 214 (Pt 9), 1546–1553. doi: 10.1242/jeb.037804
Karasov, W. H. (1992). Daily energy expenditure and the cost of activity in mammals. Am. Zool. 32, 238–248. doi: 10.1093/icb/32.2.238
Kogure, Y., Sato, K., Watanuki, Y., Wanless, S., and Daunt, F. (2016). European shags optimize their flight behavior according to wind conditions. J. Exp. Biol. 219 (Pt 3), 311–318. doi: 10.1242/jeb.131441
Leos-Barajas, V., Photopoulou, T., Langrock, R., Patterson, T. A., Watanabe, Y. Y., Murgatroyd, M., et al. (2017). Analysis of animal accelerometer data using hidden Markov models. Methods Ecol. Evol. 8, 161–173. doi: 10.1111/2041-210x.12657
Lindhe Norberg, U. M., and Norberg, R. A. (2012). Scaling of wingbeat frequency with body mass in bats and limits to maximum bat size. J. Exp. Biol. 215 (Pt 5), 711–722. doi: 10.1242/jeb.059865
McCracken, G. F., Safi, K., Kunz, T. H., Dechmann, D. K. N., Swartz, S. M., and Wikelski, M. (2016). Airplane tracking documents the fastest flight speeds recorded for bats. R. Soc. Open Sci. 3:160398. doi: 10.1098/rsos.160398
Nathan, R., Spiegel, O., Fortmann-Roe, S., Harel, R., Wikelski, M., and Getz, W. M. (2012). Using tri-axial acceleration data to identify behavioral modes of free-ranging animals: general concepts and tools illustrated for griffon vultures. J. Exp. Biol. 215, 986–996. doi: 10.1242/jeb.058602
Norberg, U. M. (1990). Vertebrate Flight: Mechanics, Physiology, Morphology, Ecology and Evolution. Berlin: Springer-Verlag.
O'Mara, M. T., Wikelski, M., and Dechmann, D. K. N. (2014). 50 years of bat tracking: device attachment and future directions. Methods Ecol. Evol. 5, 311–319. doi: 10.1111/2041-210x.12172
O'Mara, M. T., Wikelski, M., Kranstauber, B., and Dechmann, D. K. N. (2019). Common noctules exploit low levels of the aerosphere. R. Soc. Open Sci. 6:181942. doi: 10.1098/rsos.181942
Pennycuick, C. J. (1978). Fifteen testable predictions about bird flight. Oikos 30, 165–176. doi: 10.2307/3543476
Pinheiro, J., Bates, D., DebRoy, S., Sarkar, D., and Team, R. C. (2018). nlme: Linear and Nonlinear Mixed Effects Models. Available online at: https://CRAN.R-project.org/package=nlme
R Core Team (2016). R: A Language and Environment for Statistical Computing. Vienna: R Foundation for Statistical Computing.
Rayner, J. M. (1999). Estimating power curves of flying vertebrates. J. Exp. Biol. 202 (Pt 23), 3449–3461.
Riskin, D. K., Bergou, A., Breuer, K. S., and Swartz, S. M. (2012). Upstroke wing flexion and the inertial cost of bat flight. Proc. R. Soc. B 279, 2945–2950. doi: 10.1098/rspb.2012.0346
Riskin, D. K., Iriarte-Diaz, J., Middleton, K. M., Breuer, K. S., and Swartz, S. M. (2010). The effect of body size on the wing movements of pteropodid bats, with insights into thrust and lift production. J. Exp. Biol. 213 (Pt 23), 4110–4122. doi: 10.1242/jeb.043091
Riskin, D. K., Willis, D. J., Iriarte-Diaz, J., Hedrick, T. L., Kostandov, M., Chen, J., et al. (2008). Quantifying the complexity of bat wing kinematics. J. Theoret. Biol. 254, 604–615. doi: 10.1016/j.jtbi.2008.06.011
Safi, K., Kranstauber, B., Weinzierl, R., Griffin, L., Rees, E. C., Cabot, D., et al. (2013). Flying with the wind: scale dependency of speed and direction measurements in modelling wind support in avian flight. Mov. Ecol. 1:4. doi: 10.1186/2051-3933-1-4
Sapir, N., Horvitz, N., Dechmann, D., Fahr, J., and Wikelski, M. (2014). Commuting fruit bats beneficially modulate their flight in relation to wind. Proc. R. Soc. B 281:20140018. doi: 10.1098/rspb.2014.0018
Sato, K., Daunt, F., Watanuki, Y., Takahashi, A., and Wanless, S. (2008). A new method to quantify prey acquisition in diving seabirds using wing stroke frequency. J. Exp. Biol. 211 (Pt 1), 58–65. doi: 10.1242/jeb.009811
Scacco, M., Flack, A., Duriez, O., Wikelski, M., and Safi, K. (2019). Static landscape features predict uplift locations for soaring birds across Europe. R. Soc. Open Sci. 6:181440. doi: 10.1098/rsos.181440
Scharf, A. K., Fahr, J., Abedi-Lartey, M., Safi, K., Dechmann, D. K. N., Wikelski, M., et al. (2019). Data from: overall dynamic body acceleration in straw-colored fruit bats increases in headwinds but not with airspeed. Movebank Data Reposit. doi: 10.5441/001/1.k8n02jn8
Sikes, R. S., and Gannon, W. L. (2011). Guidelines of the American Society of Mammalogists for the use of wild mammals in research. J. Mammal. 92, 235–253. doi: 10.1644/10-mamm-f-355.1
Spivey, R. J., and Bishop, C. M. (2013). Interpretation of body-mounted accelerometry in flying animals and estimation of biomechanical power. J. R. Soc. Interface 10:20130404. doi: 10.1098/rsif.2013.0404
Stothart, M. R., Elliott, K. H., Wood, T., Hatch, S. A., and Speakman, J. R. (2016). Counting calories in cormorants: dynamic body acceleration predicts daily energy expenditure measured in pelagic cormorants. J. Exp. Biol. 219 (Pt 14), 2192–2200. doi: 10.1242/jeb.130526
Swartz, S. M., Groves, M. S., Kim, H. D., and Walsh, W. R. (1996). Mechanical properties of bat wing membrane skin. J. Zool. 239, 357–378.
Swartz, S. M., Iriarte-Diaz, J., Riskin, D. K., and Breuer, K. S. (2012). “A bird? A plane? No, it's a bat: an introduction to the biomechanics of bat flight,” in Evolutionary History of Bats: Fossils, Molecules and Morphology, eds G. F. Gunnell and N. B. Simmons (Cambridge: Cambridge University Press), 317–352.
Taylor, G. K., Nudds, R. L., and Thomas, A. L. (2003). Flying and swimming animals cruise at a Strouhal number tuned for high power efficiency. Nature 425, 707–711. doi: 10.1038/nature02000
Thollesson, M., and Norberg, U. M. (1991). Moments of intertia of bat wings and body. J. Exp. Biol. 158, 19–35.
Tobalske, B. W. (2007). Biomechanics of bird flight. J. Exp. Biol. 210, 3135–3146. doi: 10.1242/jeb.000273
Tobalske, B. W., Hedrick, T. L., and Biewener, A. A. (2003a). Wing kinematics of avian flight across speeds. J. Avian Biol. 34, 177–184. doi: 10.1034/j.1600-048X.2003.03006.x
Tobalske, B. W., Hedrick, T. L., Dial, K. P., and Biewener, A. A. (2003b). Comparative power curves in bird flight. Nature 421, 363–366. doi: 10.1038/nature01284
Usherwood, J. R., Stavrou, M., Lowe, J. C., Roskilly, K., and Wilson, A. M. (2011). Flying in a flock comes at a cost in pigeons. Nature 474, 494–497. doi: 10.1038/nature10164
Van Doren, B. M., Horton, K. G., Stepanian, P. M., Mizrahi, D. S., and Farnsworth, A. (2016). Wind drift explains the reoriented morning flights of songbirds. Behav. Ecol. 27, 1122–1131. doi: 10.1093/beheco/arw021
van Toor, M. L., O'Mara, M. T., Abedi-Lartey, M., Wikelski, M., Fahr, J., and Dechmann, D. K. N. (2019). Linking colony size with quantitative estimates of ecosystem services of African fruit bats. Curr. Biol. 29, R237–R238. doi: 10.1016/j.cub.2019.02.033
Van Walsum, T. A., Perna, A., Bishop, C. M., Murn, C. P., Collins, P. M., Wilson, R. P., et al. (2019). Exploring the relationship between flapping behaviour and accelerometer signal during ascending flight, and a new approach to calibration. Ibis. doi: 10.1111/ibi.12710
Venables, W. N., and Ripley, B. D. (2002). Modern Applied Statistics with S. (New York, NY:Springer-Verlag), 498. doi: 10.1007/978-0-387-21706-2
von Busse, R., Swartz, S. M., and Voigt, C. C. (2013). Flight metabolism in relation to speed in Chiroptera: testing the U-shape paradigm in the short-tailed fruit bat Carollia perspicillata. J. Exp. Biol. 216 (Pt 11), 2073–2080. doi: 10.1242/jeb.081760
Williams, H. J., Shepard, E. L. C., Duriez, O., and Lambertucci, S. A. (2015). Can accelerometry be used to distinguish between flight types in soaring birds? Anim. Biotelem. 3:45. doi: 10.1186/s40317-015-0077-0
Keywords: Eidolon helvum, flight, energy landscape, energy expenditure, bio-logging, ODBA
Citation: O'Mara MT, Scharf AK, Fahr J, Abedi-Lartey M, Wikelski M, Dechmann DKN and Safi K (2019) Overall Dynamic Body Acceleration in Straw-Colored Fruit Bats Increases in Headwinds but Not With Airspeed. Front. Ecol. Evol. 7:200. doi: 10.3389/fevo.2019.00200
Received: 10 October 2018; Accepted: 15 May 2019;
Published: 31 May 2019.
Edited by:
Frants Havmand Jensen, Woods Hole Oceanographic Institution, United StatesReviewed by:
Andy TD Bennett, Deakin University, AustraliaJudy Shamoun-Baranes, University of Amsterdam, Netherlands
Copyright © 2019 O'Mara, Scharf, Fahr, Abedi-Lartey, Wikelski, Dechmann and Safi. This is an open-access article distributed under the terms of the Creative Commons Attribution License (CC BY). The use, distribution or reproduction in other forums is permitted, provided the original author(s) and the copyright owner(s) are credited and that the original publication in this journal is cited, in accordance with accepted academic practice. No use, distribution or reproduction is permitted which does not comply with these terms.
*Correspondence: M. Teague O'Mara, dG9tYXJhQG9ybi5tcGcuZGU=