- 1Davee Center for Epidemiology and Endocrinology, Lincoln Park Zoo, Chicago, IL, United States
- 2Urban Wildlife Institute, Lincoln Park Zoo, Chicago, IL, United States
- 3Landmark Pest Management, Chicago, IL, United States
- 4Biodiversity Research Centre, University of British Columbia, Vancouver, BC, Canada
- 5Department of Interdisciplinary Studies, University of British Columbia, Vancouver, BC, Canada
- 6Canadian Wildlife Health Cooperative, Animal Health Centre, Abbotsford, BC, Canada
Preventing infestations of rats is crucial for minimizing property damage and the transmission of rat-associated pathogens to humans. Due to the logistical challenges in assessing rat abundance over large areas, public officials must often use the number of public rat complaints to estimate the relative abundance of rats and the subsequent need for rodent control. However, the likelihood of reporting complaints may be driven by socioeconomic factors and therefore may not accurately reflect rat abundance. In this study, we tested whether the number of rat complaints reflect rat relative abundance and if rat complaints and abundance are higher in alleys with greater levels of harborage, food attractants, and poor structural integrity. We conducted this study in Chicago, IL, USA where public rat complaints have risen by 39% from 2008 up to 45,887 in 2017, and where socioeconomic factors vary considerably across neighborhoods. We assessed municipal rat complaints, census data, and land cover data for 77 community areas across Chicago. In collaboration with pest management professionals, we trapped brown rats (Rattus norvegicus) in alleys in 13 community areas that varied from low to high measures of household income and urban development. At trapping sites, we recorded signs of rat activity, attractants, and infrastructure condition. Based on candidate model comparisons using linear models, we found that rat complaints were most associated with rat trap success. Rat trap success was most associated with increasing complaints, percent of rented housing units, and decreasing vacant land. At a local scale, alleys with more complaints and higher trap success also had more uncontained garbage. Our results demonstrate that, at least in Chicago, public reporting can serve as a useful tool to identify areas of greater rat activity for targeted control efforts. Our study also suggests the need for habitat modification to minimize access to attractants. Finally, our results highlight how partnerships between researchers and private practitioners can facilitate large-scale projects on rat infestation risks in urban areas.
Introduction
Brown rats (Rattus norvegicus) are one of the most abundant and broadly-distributed wildlife species in urban areas worldwide, and frequently come into conflict with residents due to property damage and the spread of zoonotic diseases. Rats have been estimated to cause over $27 billion USD in damage to consumer goods each year in the US (Pimentel, 2007) and some rat-associated zoonoses, such as leptospirosis, are increasing globally (Panti-May et al., 2016; Richardson et al., 2017). To mitigate these risks and costs, municipal governments invest heavily in public education and rodent control; nearly one billion dollars is spent annually on rodenticide products in the United States (Specialty Consultants, 2016).
To effectively mitigate rat-associated risks in urban environments, recent work has examined the environmental factors associated with urban rat abundance. Identifying features that promote infestations across spatial scales is important as higher rat densities are presumed to increase the risk of disease transmission and property damage (Rael et al., 2016). In cities, rat populations or signs of rat activity are often higher in areas with lower incomes and higher rates of building abandonment or vacancy (Himsworth et al., 2014; Johnson et al., 2016; Rael et al., 2016). Thus, the abundance of rats and subsequent risk of property damage and disease transmission is likely heterogeneous across urban neighborhoods. However, most previous studies have examined rats within areas presumed to be high risk (e.g., Himsworth et al., 2013; Panti-May et al., 2016; Rael et al., 2016, but see Ayral et al., 2015), therefore, little is known about changes in rat abundance and associated risks over large spatial scales across diverse urban neighborhoods.
Because it is challenging and expensive to systematically survey large urban areas for signs of rats (Desvars-Larrive et al., 2018), municipal governments must often estimate rat abundance and the need for rodent control based on public rat complaints. However, this assumed relationship between complaints and rat abundance may instead reflect many other factors and may not accurately reflect rat abundance. For example, there may be an intuitive relationship between the abundance of people and the number of complaints. People may also be more likely to report rats based on their own knowledge and attitudes, which has been shown to occur with reporting wildlife conflict from other species (e.g., black bears Ursus americanus; Howe et al., 2010). Specifically, residents may be more likely to complain if they are able to identify signs of rat infestation, are concerned about the risks posed by rat infestations, are aware of how to report complaints, and believe the report will result in action. Similarly, rental tenants might be less likely to report rats, or may instead make complaints to their building managers due to fears of landlord reprisal (Bachelder et al., 2016). The seasonal distribution of rat complaints may also follow seasonal patterns of rat abundance (i.e., peak in late summer in temperate regions (Feng and Himsworth, 2014) or when favorable weather increases human outdoor activity, leading to more rat observations (Hume et al., 2002). Previous analyses of rat sightings suggest that, similarly to observed trends in rat abundance, observations of rats tend to increase with vacant housing, building age, and in areas with lower education levels (Walsh, 2014) and near food attractants (Ayyad et al., 2018). However, it is important to validate any relationship between rat sightings and rat abundance to improve the efficacy and efficiency of rat mitigation efforts.
We studied rats and complaints made about them in the city of Chicago, Illinois, USA, where there appears to be increasing public concern about rat infestations. Chicago reportedly has the most rat complaints per capita of any US city, according to recent estimates of 311 calls (Renthop, 2018). In response to these concerns, the municipal government increased rat control efforts by over $1 million USD in 2018 (Cherone, 2017) and used public complaints to identify areas in need of rodent control (i.e., rodenticide baiting and trapping). This increase in rat control enabled us to compare rates of rat complaints and trap success across Chicago's neighborhoods. In addition to increasing public complaints and rat control efforts, Chicago is an ideal system to explore variation in complaints and rat abundance because Chicago's neighborhoods vary markedly by several socioeconomic and environmental metrics (Perkins and Sampson, 2015). For example, median annual household incomes range from < $15,000 to over $100,000 and resident population density ranges from 59 to 1,241 people/km2 (CMAP, 2017). Thus, the rates of both rat infestations and complaints about rats may vary significantly.
In this study, we tested the assumption that rat complaints reflect the relative abundance of rats across urban neighborhoods. We did so by comparing rates of rat complaints with measures of trap success acquired through a partnership with a private pest control company in 13 community areas across Chicago along gradients of income and urban development. Using the results of this analysis, we then predicted relative rat abundance across the city from complaints. We then investigated correlates of rat abundance and complaints at two spatial scales by collecting socioeconomic data from community areas and recording rat attractants and habitat characteristics in alleys. Lastly, we tested whether the annual distribution of rat complaints was consistent with seasonal changes in rat abundance based on natural history. Our results can be used to predict areas and times of high relative rat abundance to prioritize rat control and mitigate property damage and the spread of rat-associated diseases.
Materials and Methods
Study Area and Rat Complaint Dataset
Chicago is a large city of 2.7 million people (United States Census Bureau, 2016) that borders Lake Michigan and has a humid continental climate (average summer high = 24.3°C; average winter high = −0.3°C; National Oceanic and Atmospheric Administration, 2015). Chicago is composed of over 200 neighborhoods that have developed over time but has been officially divided into 77 community areas, which are static and often contain multiple neighborhoods. We studied rat complaints first at the scale of community areas, rather than neighborhoods, because community areas do not change over time and are recognized by the city of Chicago for census and urban planning purposes (City of Chicago, 2010). We also chose this spatial scale because rat complaints varied more between community areas than between neighborhoods within community areas [F-test of equality of variances: F(76, 76) = 15.7, p < 0.001].
The 77 community areas of Chicago are highly variable in terms of socioeconomics and demographics. We accessed socioeconomic and land cover data for all community areas through the Chicago Metropolitan Agency for Planning (CMAP) database of Community Data Snapshots. This dataset summarizes demographic and land use data from the U.S. Census Bureau's 2011–2015 American Community Survey and CMAP's 2013 Land Use Inventory. We then extracted data that have been previously associated with rat activity (e.g., Childs et al., 1998; Ayral et al., 2015) to test whether socioeconomic factors such as household income, rented vs. owned properties, proportion of vacant city-owned land (e.g., vacant lots), and population density, would influence rates of complaints (Table 1).
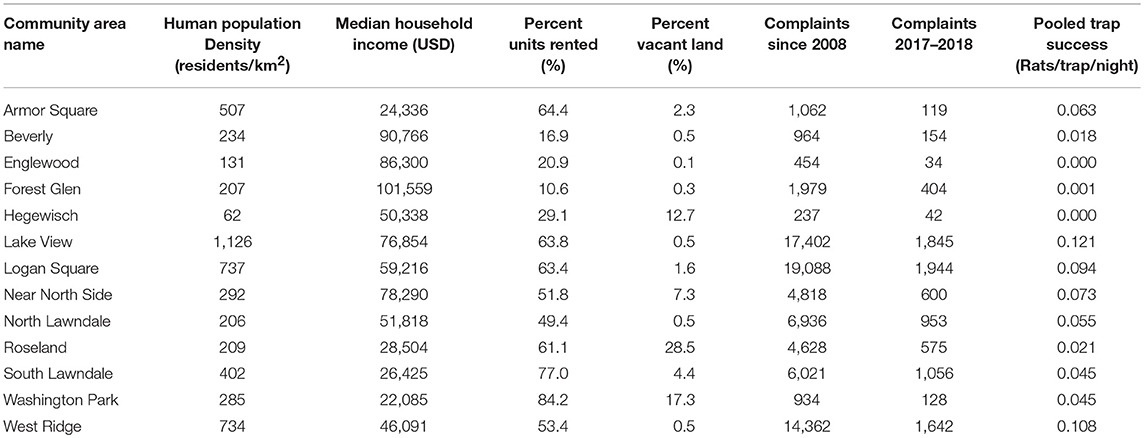
Table 1. Characteristics of 13 community areas in Chicago, IL, USA used to model public rat complaints as a function of rat trap success and several socioeconomic and landscape variables.
We accessed all rat complaints made to the City of Chicago Bureau of Rodent Control from January 1, 2008 to April 30, 2018. All complaint records contained the date and UTM coordinates to facilitate seasonal and spatial analyses. The complaints did not contain identifying information such as name or address. When comparing the distribution of complaints with trap success we only included the last 12 months of complaints as these distributions may change across years.
Rat Trapping
Rats were trapped as part of rat control operations by Landmark Pest Management (hereafter Landmark). Trapping effort for this study took place in pairs of alleys in 13 community areas throughout Chicago from April 20 to June 20, 2018 (Figure 1A). These community areas were chosen to represent gradients across socioeconomic variables and land use while attempting to minimize confounding relationships between these variables (Figure 1, Table 1).
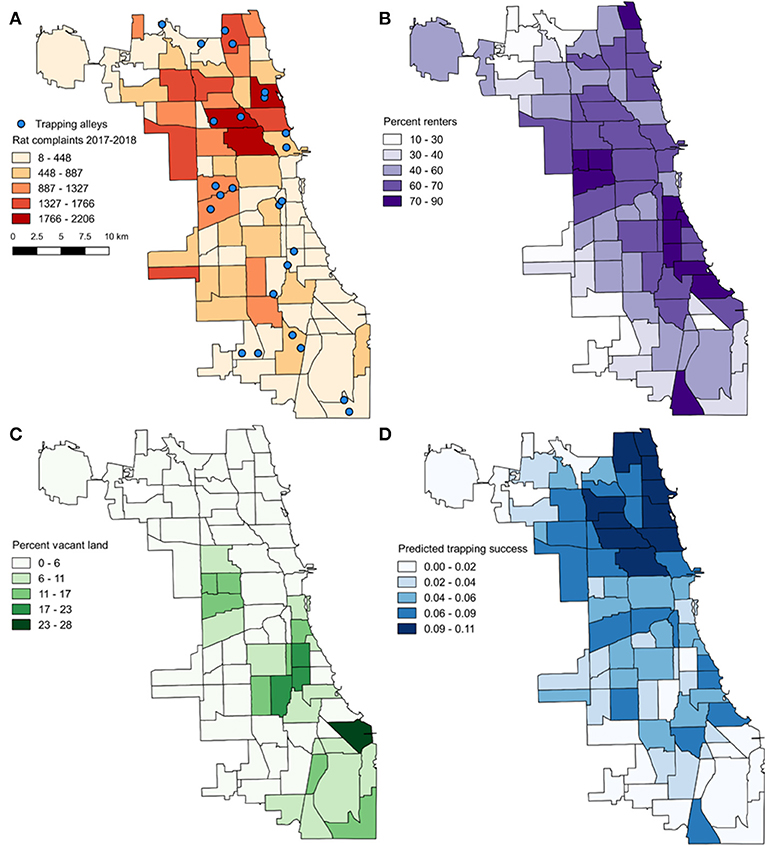
Figure 1. Map of the city of Chicago (IL, USA) outlining the 77 community areas. Rats were trapped in pairs of alleys in 13 communities selected along gradients in rat complaints and several socioeconomic and landscape variables (A). Rat trap success was most associated with complaints (A), percent of rented housing units (B), and percent vacant city-owned land (C). Based on our model of these factors, we predict rat trap success across all community areas (D).
In each community area, rats were trapped in the two alleys with the highest levels of complaints, indicated by the city of Chicago Department of Streets and Sanitation. We targeted these alleys to maximize trap success for a concurrent study on rat pathogens and stress across community areas. Although we targeted areas with high numbers of complaints within each community area, there was considerable variation in complaints within the past 12 months within 1 km of trapping alleys in different community areas (range = 7–128).
At each designated trapping alley, Landmark set 10 enclosed snap trap stations (pairs of Victor snap traps in JT Eaton aluminum stations) and baited them with canned cat food following standard procedures. Within an alley, trap stations were on average 15 m apart (ranged between 13 and 18) and checked at least every 48 h. Any trapped rats were double bagged, labeled with the date and alley location ID, and frozen at −20°C. We recorded the start and end dates of the trapping period and any trap losses due to theft to calculate trap success as rats trapped per trap night and per trap set (mean ± S.D. number of trap nights = 54 ± 3, range = 47–57). While accounting for sprung traps (those that are set off for any reason (e.g., rats, non-target species, false closure) is preferred to calculate trap success (Norton, 1987), it was unfortunately not feasible in our study but was uncommon. Therefore, we used the number of rats caught per trap night as an indicator of relative rat abundance (Panti-May et al., 2016).
Habitat Assessments
To test which local habitat features were most associated with higher rat complaints, we visited trapping alleys within 2 weeks of trapping to record rat attractants, harborage, and property structural integrity (Figure 2). We recorded the availability of garbage in three ways: the number of garbage receptacles, the proportion of receptacles with holes large enough to permit rats (i.e., 2 cm in diameter), and uncontained garbage on an ordinal scale (0 = none, 1 = scattered pieces, 2 = piles or bags of garbage). We also recorded the presence or absence of dog waste because it is an anecdotal rat attractant. We quantified the abundance of clutter that could serve as rodent harborage (e.g., pallets, old furniture, vegetation) on an ordinal scale (0 = none, 1 = scattered items, 2 = piles). Lastly, we recorded the condition of the buildings (i.e., structural integrity of foundation, walls, and doors) and the surrounding grounds (i.e., structural integrity of concrete and asphalt, management of vegetation, presence of garbage and harborage) on an ordinal scale from 1 (poor) to 5 (excellent). A score of 1 indicated cracks in foundations, buckled concrete forming holes, many gaps under doors, broken windows, holes in walls, and unmanaged vegetation while a 5 indicated no uncontained garbage or harborage, sealed doors, and garbage receptacles clean and secured. We also recorded visible signs of active rat infestations such a sebum rub marks, gnaw marks on garbage cans and doors, tracks, and feces.
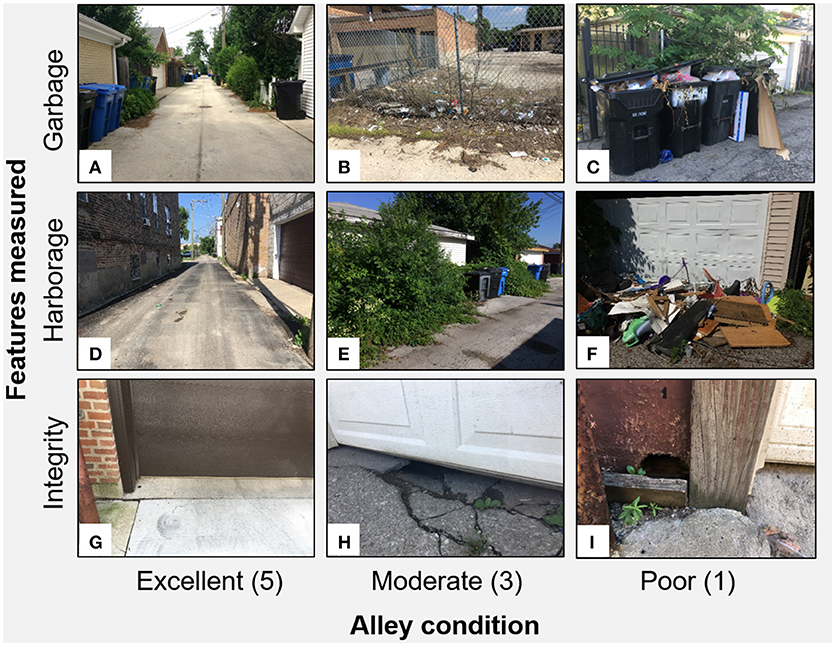
Figure 2. We visited alleys with varying numbers of complaints in 13 community areas of Chicago to estimate any relationships between microhabitat and rat abundance (trap success) or the number of complaints within 1km. We characterized the abundance of uncontained garbage on an ordinal scale as none (A), pieces (B), or piles (C). We also assessed the amount of harborage from vegetation (E) or clutter (F) and access to buildings through the structural integrity of concrete in and around foundations (H) and of walls (I). Assessments of these three factors cumulated into an overall condition score from 1 to 5 with sites in poor condition (C,F,I) having high levels of uncontained garbage, harborage, and poor structural integrity while those in excellent condition had no visible issues (A,D,G).
Because our trapping alleys were chosen based on high levels of complaints (mean number of complaints in 2017–2018 within 1 km = 42 ± 36 S.D.), we also visited two other randomly chosen alleys in each community area to increase our sample and facilitate comparisons to areas with fewer complaints (random alleys: 32 ± 32 complaints within 1 km). These alleys were chosen to be between 1 and 2 km from the trapping alley to reduce spatial autocorrelation but maintain similar socioeconomic and landscape context.
Statistical Analyses
We used linear models to test whether complaints were most correlated with rat relative abundance, or if complaints were more associated with socioeconomics and other factors. To do so we treated the number of rat complaints in each community area within the past 12 months (April 30, 2017–April 30, 2018) as the response variable and generated a suite of six candidate models that represent different hypotheses about how rat complaints may vary across Chicago (Table 2). These six candidate models were composed of the following explanatory variables: rat trap success (rats captured per trap per night traps were active), human population density (individuals per km2), and three indicators of socioeconomic status [median annual household income (USD), percent of rented residences (%), and percent city-owned vacant land (%)]. With these six candidate models, we tested whether the number of rat complaints varied as a function of: (1) rat abundance, (2) socioeconomics (income, percent renters, vacant land), (3) human population density, (4) rat abundance and human population density, (5) rat abundance, socioeconomics, and human population density (global model) and (6) the null model. We used Akaike's information criteria corrected for a small sample size (AICc) to compare the relative quality of each candidate model given the data. When estimating trap success rates, we pooled the number of rats captured across both alleys, which were highly correlated with the average trap success across the two alleys (R2 = 0.95).

Table 2. Comparison of candidate models used to predict rat complaints as a function of rat relative abundance (trap success), socioeconomics, and landscape variables across 13 community areas in Chicago, IL, USA.
Based on the most important variables in this model comparison, we then compared a similar set of candidate models with trap success as the response variable. We then used the top-ranked model for trap success to predict rat abundance across all 77 community areas (Table 2). In one of these candidate models, complaints were highly correlated with human population density. To reduce multi-collinearity we fit a simple linear regression between these variables, treating complaints as the response and human population density as the independent variable. Following this, we calculated the residuals of this regression and used them in place of human population density, with positive values indicating areas with higher human population density than expected given the number of complaints.
We also compared a suite of eight candidate models to evaluate alley characteristics most associated with rat complaints and trap success. These candidate models had either the number of rat complaints within 1 km of the trapping alley or the trap success at that particular alley as response variables and six independent variables we measured in the field (see Habitat assessments; Table 4). With these candidate models we tested whether rat complaints and/or relative abundance increased with (1) uncontained garbage, (2) the number of accessible garbage receptacles, (3) the presence of dog waste, (4) harborage, (5) building condition, (6) grounds condition, (7) the global model, and (8) the null model. We ranked these models using AICc to determine the most important predictors of rat activity.
Lastly, we tested whether the annual distribution of rat complaints over the past 10 years peaked in late summer, consistent with the period when rat population density is highest. To do so, we used Rayleigh's test of uniformity of circular data using the Circstats package in R (Lund and Agostinelli, 2018). Independent variables were not centered or scaled for any of the aforementioned analyses.
Results
Correlates of Rat Complaints Across Community Areas
We accessed 369,581 complaints made to the Bureau of Rodent Control in Chicago from January 1, 2008 to April 30, 2018. Of these, 12.4% (45,887) were made between April 30, 2017 and April 30, 2018. Yearly rat complaints increased by 39% between 2008 and 2017 (35,410 to 49,043 complaints).
We captured 61 brown rats in 13 community areas from April 20 to June 20, 2018. Rat trap success ranged from 0 to 0.19 rats per trap night across alleys (mean = 0.05 ± 0.06 S.D.). Based on our candidate model comparisons, the number of rat complaints in a community area was most associated with trap success (Table 2). A 0.1 increase in trap success (two rats in a 48 h period; our median value) resulted in a 1,210.8 ± 325.3 increase in complaints made (p = 0.003). The second and third-most top models had similar fit (ΔAICc ≤ 4.0) and contained trap success and residual population density.
Predictors of Rat Relative Abundance Across Community Areas
Because we found a high correlation between complaints and trap success, we then predicted trap success across all 77 community areas using the number of complaints from April 2017 to April 2018. To also evaluate the importance of environmental and socioeconomic factors, we compared a suite of 10 candidate models with trap success as the response variable and rat complaints and either human population density, income, vacant land, or percent of rented households as independent variables (Table 3). Trap success was most associated with the number of complaints, proportion of rented housing units, and proportion of vacant land (Figures 1A–C, 3). Trap success increased with complaints (βComplaints = 1.86 × 10⁻⁵ ± 8.95 × 10⁻⁶, t = 2.1, p = 0.05) and the proportion of renters (βproportionrenters = 0.13 ± 0.003, t = 4.8, p = 0.0015) but decreased with increasing vacant land (βvacantland = −0.41 ± 0.009, t = −4.5, p = 0.0013; Adjusted R2 = 0.84, F = 22.58 (3.9), p = 0.002; Table 3). Using this model, we predicted trap success for all community areas across Chicago based on the number of complaints in 2017–2018, the proportion of rented units, and proportion of vacant land (Figure 1D). Trap success was predicted to be higher on the Northeastern side of Chicago relative to other parts of the city.
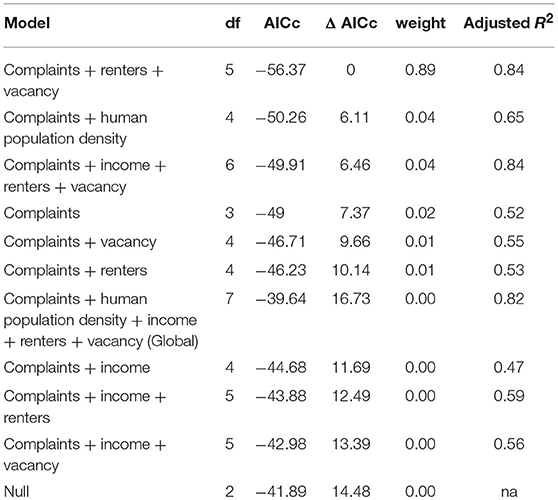
Table 3. Comparison of candidate models to predict rat trap success as a function of public rat complaints and several socioeconomic and landscape variables across 13 community areas in Chicago, IL, USA.
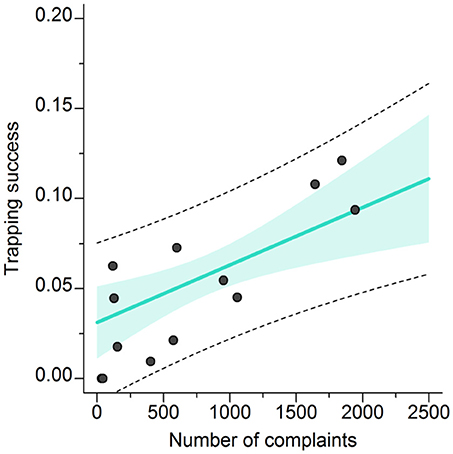
Figure 3. Relationship between the number of rat complaints (between April 1 2017–April 1 2018) and trap success (rats captured per trap per night). The turquoise line shows the fitted line from our top model with the associated 95% confidence interval (shaded region) and 95% predicted interval (dashed lines).
Correlates of Rat Complaints and Relative Abundance in Alleys
We visited 52 alleys within 2 weeks of the trapping period. Our top-ranked model was the global model (Table 4). Complaints near alleys increased with uncontained garbage (βGarbage = 23.1 ± 8.3, t = 2.8, p = 0.008), accessible garbage receptacles (βReceptacles = 1.0 ± 0.4, t = −2.3, p = 0.03), harborage (βHarborage = 1.1 ± 4.5, t = 0.2, p = 0.81), and building condition (βBuilding = 3.8 ± 5.9, t = 0.6, p = 0.53), but decreased with grounds condition (βGrounds = 4.5 ± 7.8, t = 0.6, p = 0.56) and dog waste (βDog = −22.6 ± 12.2, t = −1.9, p = 0.07). Of the individual variables, uncontained garbage was the most important predictor of complaints (t = 2.67, p = 0.01; Figure 4). For trap success, the top-ranked model was uncontained garbage (βGarbage = 0.2 ± 0.1, t = 1.7, p = 0.09) however it was < 4 AICc from all models apart from the global and null models (Table 4).
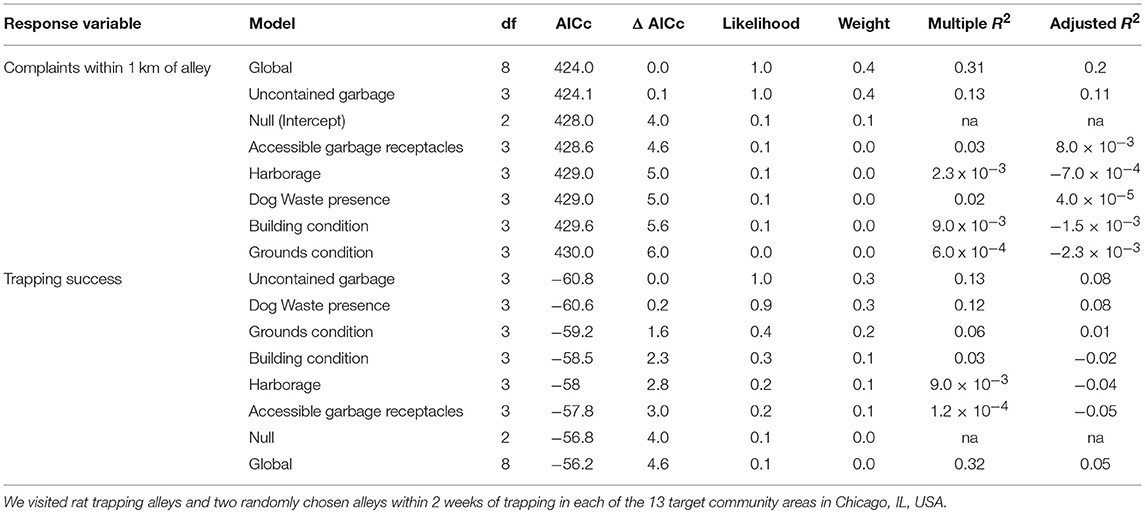
Table 4. Comparison of candidate models to predict rat complaints or trap success as a function of available attractants, harborage, structural integrity of buildings, and the condition of grounds in alleys.
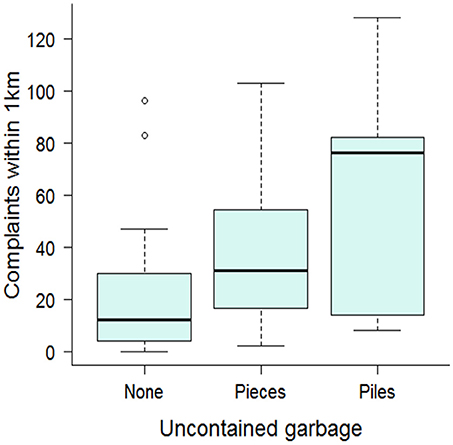
Figure 4. Boxplot showing the median and quartile values of rat complaints in relation to uncontained garbage in alleys in Chicago, IL, USA. Uncontained garbage was recorded on an ordinal scale (0 = none, 1 = pieces, 2 = piles) and rat complaints were summed within 1 km of the alley.
Seasonal Variation in Rat Complaints
The frequency of rat complaints peaked in August and the distribution of complaints was significantly non-uniform throughout the year (Rayleigh test for circular uniformity Z = 20842.0 p < 0.0001; concentration = 0.489, length of vector = 0.28 in August; Figure 5).
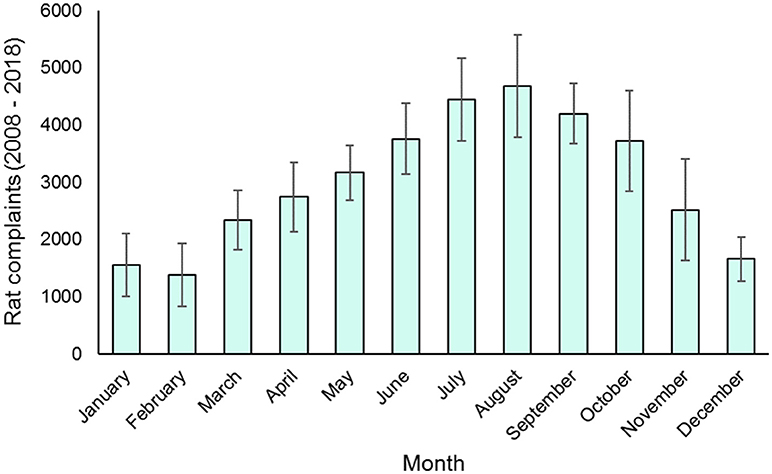
Figure 5. Monthly distribution of rat complaints made to the city of Chicago from April 1 2008 to April 1 2018. Columns show mean values and error bars show standard deviation.
Discussion
Controlling rat populations is a priority for public health and safety in cities around the world. In this study, we investigated whether public rat complaints can serve as a reliable indicator of rat abundance to predict where rodent control is most needed. By comparing municipal rat complaints with rat trap success over 13 diverse community areas in Chicago, we found that complaints were highly correlated with relative abundance of rats. Trap success was greater in community areas with more complaints, a higher proportion of rented units, a lower proportion of vacant property, and in alleys with more uncontained garbage. We also found that complaints varied seasonally, peaking in late summer.
Although there are a number of socioeconomic factors that may affect reporting, the spatial and temporal distribution of public rat complaints appeared to be a reliable indicator of rat abundance across community areas in Chicago. This suggests that public complaints may be an effective tool to identify areas with a high likelihood of rat infestations and where rodent control is most needed. This can increase the efficiency of targeted control programs. In contrast, other potential methods of assessing rat abundance (e.g., systematic surveys performed by rodent professionals) are more labor intensive and costly. While complaints-based systems can be biased in other instances of human-wildlife conflict (Howe et al., 2010; Poessel et al., 2013), there may be less bias in the distribution of rat complaints because public attitudes about rats are more uniformly negative and residents may be more aware of the potential risks associated with rats (Bremner and Park, 2007).
Although complaints appear to be a useful indicator of rat activity, relying on public complaints to direct municipal rodent control is intrinsically a reactive method, failing to address issues that promote infestations. However, because several socioeconomic and landscape factors were associated with rat abundance, these community-level characteristics can also be used to help anticipate rat problems before complaints accumulate. For example, trap success was greater in community areas with proportionately more rental housing, which aligns with higher rates of rat bites on blocks with more rental units in New York City (Childs et al., 1998). Rats may be more abundant in rental properties if tenants or off-site managers are less fastidious about reducing attractants or pest control than owners. As such, city planners seeking to target rat infestations before they arise may benefit from prioritizing areas with a greater abundance of rental units.
At a local scale, food attractants in the form of uncontained garbage was the best predictor of both complaints and rat abundance, supporting public education campaigns in Chicago and other cities to “not feed the rats” (Calder, 2018). Such ephemeral attractants are difficult to quantify but may be important for variation in rat problems within community areas. For example, big-data approaches to predicting local pulses in rat complaints found that garbage-related 311 complaints typically precede spikes in rat complaints within a 7-day window (Thornton, 2013). These findings support the growing body of research that suggests that ecological pest management (e.g., that which reduces access to food resources and harborage) is the most effective and sustainable approach to addressing rat infestations (Colvin and Jackson, 1999). As such, city-wide rat control initiatives must consider strategies not just for rats, but also for underlying issues of waste management.
This positive relationship with uncontained garbage may also explain why trap success was negatively associated with vacant land. While several other studies have observed increased rat activity near vacant buildings (Himsworth et al., 2014; Rael et al., 2016), vacant lots may offer little resources in the way of human food waste. There is increasing appreciation for the ecological value of urban vacant lots (Anderson and Minor, 2017) and their role as rat habitat is an interesting avenue for future research.
Our study demonstrates that public rat complaints are a valuable tool to mitigate property damage and public health concerns from rats. However, it is important to note that it is often difficult to determine whether reporting accurately reflects animal abundance. For example, we witnessed an increase in rat complaints in late summer which is consistent with the period when rat recruitment leads to peak rat population density (Feng and Himsworth, 2014). However, this trend may also be driven in part by favorable weather conditions increasing human outdoor activity.
Future studies that aim to understand the situations in which residents report rat complaints, and their motivations behind reporting, will improve our predictions of spatiotemporal patterns in rat complaints and interpreting the causes behind them (e.g., property damage, concerns about disease, pets). Further, in our study, trap success was an efficient method to measure relative abundance while making use of on-going rodent control across a large and diverse geographic area, which has been a challenge in studying urban rat ecology (Parsons et al., 2017). However, these methods are limited to understanding only the trappable rat population, as there may be many individuals that never enter traps. Other approaches, such as mark-recapture (Desvars-Larrive et al., 2018) or population genetics (Combs et al., 2018b) may help elucidate rat population size and genetic structure to evaluate or target rodent control. For example, a better understanding of the processes driving rat abundance across spatial scales will be useful in understanding the impacts of rodent control on the broader population (Gardner-Santana et al., 2009). At even larger scales, future studies examining variation in correlates of rat abundance across cities (Combs et al., 2018a) will improve our ability to generalize patterns of rat infestations.
Conclusions
In summary, our study reveals that public complaints about rats may be a useful tool to identify areas and time periods with relatively high rat abundance. Further, we demonstrate that prioritizing areas with greater numbers of rental units and uncontained garbage may increase the efficiency of rodent control programs. These approaches require a better understanding of the motivations behind residents' complaints and the relationships between rat abundance and risk of property damage and pathogen transmission. To move beyond reactive approaches to rats, this information can be used to facilitate proactive control techniques (e.g., reducing access to food sources) in many cities around the world.
Ethics Statement
The study used rat trapping data from ongoing rodent control by a private pest management company and so was exempt from animal care and use committee approval.
Data Availability Statement
The raw data supporting the conclusions of this manuscript will be made available by the authors, without undue reservation, to any qualified researcher. Requests to access the datasets should be directed to Maureen H. Murray,bWF1cmVlbm11cnJheUBscHpvby5vcmc=.
Author Contributions
MHM designed the study with assistance from KB, RF, MF, MR, and SM. RF oversaw rat trapping and MHM, MR, MPM performed field work. MHM and MF conducted statistical analysis. MHM wrote the paper with assistance from all authors.
Funding
MHM and MPM were supported by the Grant Healthcare Foundation. KB was supported by an NSERC Vanier Canada Graduate Scholarship.
Conflict of Interest Statement
RF was employed by the company Landmark Pest Management.
The remaining authors declare that the research was conducted in the absence of any commercial or financial relationships that could be construed as a potential conflict of interest.
Acknowledgments
We thank the City of Chicago Department of Streets and Sanitation for their assistance with study logistics and Martin Silva, Shannon Wuller, and Carter Cranberg, for their help with data collection.
References
Anderson, E. C., and Minor, E. S. (2017). Vacant lots: an underexplored resource for ecological and social benefits in cities. Urban. Urban Green 21, 146–152. doi: 10.1016/j.ufug.2016.11.015
Ayral, F., Artois, J., Zilber, A. L., Widén, F., Pounder, K. C., Aubert, D., et al. (2015). The relationship between socioeconomic indices and potentially zoonotic pathogens carried by wild Norway rats: a survey in Rhône, France (2010-2012). Epidemiol. Infect. 143, 586–599. doi: 10.1017/S0950268814001137
Ayyad, C., Mateu, J., and Tamayo-Uria, I. (2018). Non-linear spatial modeling of rat sightings in relation to urban multi-source foci. J. Infect. Public Health 11, 667–676. doi: 10.1016/j.jiph.2018.05.009
Bachelder, A. E., Stewart, M. K., Felix, H. C., and Sealy, N. (2016). Health complaints associated with poor rental housing conditions in Arkansas: the only state without a landlord's implied warranty of habitability. Front. Public Health 4:263. doi: 10.3389/fpubh.2016.00263
Bremner, A., and Park, K. (2007). Public attitudes to the management of invasive non-native species in Scotland. Biol. Conserv. 139, 306–314. doi: 10.1016/j.biocon.2007.07.005
Calder, R. (2018). Lousy Anti-Rat Campaign Reminds New Yorkers Not to Feed Rodents. New York, NY. Available online at: https://nypost.com/2018/05/13/lousy-anti-rat-campaign-reminds-new-yorkers-not-to-feed-rodents/.
Cherone, H. (2017). Chicago Is The Rat Capital Of The Country, At Least According To Orkin. dnainfo. Available online at: https://www.dnainfo.com/chicago/20171016/logan-square/worst-city-for-rats-orkin-rattiest-pest-control-poison.
Childs, J. E., McLafferty, S. L., Sadek, R., Miller, G. L., Khan, A. S., Randy DuPree, E., et al. (1998). Epidemiology of rodent bites and prediction of rat infestation in New York City. Am. J. Epidemiol. 148, 78–87. doi: 10.1093/oxfordjournals.aje.a009563
City of Chicago (2010). Chicago Ward, Community Area and Neighborhood Maps. Available online at: https://www.cityofchicago.org/city/en/depts/doit/supp_info/citywide_maps.html (Accessed August 10, 2018).
CMAP (2017). Community Data Snapshots. Available online at: http://www.cmap.illinois.gov/data/community-snapshots [Accessed February 15, 2018].
Colvin, B. A., and Jackson, W. B. (1999). “Urban rodent control programs for the 21st Century,” in Ecologically-Based Rodent Management, eds. G. R. Singleton, L. A. Hinds, H. Liers, and Z. Zhang (Canberra, Australia: Australian Centre for International Agricultural Research), 243–258.
Combs, M., Byers, K. A., Ghersi, B. M., Blum, M. J., Caccone, A., Costa, F., et al. (2018a). Urban rat races: spatial population genomics of brown rats (Rattus norvegicus) compared across multiple cities. Proc. R. Soc. B Biol. Sci. 285:20180245. doi: 10.1098/rspb.2018.0245
Combs, M., Puckett, E. E., Richardson, J., Mims, D., and Munshi-South, J. (2018b). Spatial population genomics of the brown rat (Rattus norvegicus) in New York City. Mol. Ecol. 27, 83–98. doi: 10.1111/mec.14437
Desvars-Larrive, A., Baldi, M., Walter, T., Zink, R., and Walzer, C. (2018). Brown rats (Rattus norvegicus) in urban ecosystems: are the constraints related to fieldwork a limit to their study? Urban Ecosyst. 21, 951–964. doi: 10.1007/s11252-018-0772-8
Feng, A. Y. T., and Himsworth, C. G. (2014). The secret life of the city rat: a review of the ecology of urban Norway and black rats (Rattus norvegicus and Rattus rattus). Urban Ecosyst. 17, 149–162. doi: 10.1007/s11252-013-0305-4
Gardner-Santana, L. C., Norris, D. E., Fornadel, C. M., Hinson, E. R., Klein, S. L., and Glass, G. E. (2009). Commensal ecology, urban landscapes, and their influence on the genetic characteristics of city-dwelling Norway rats (Rattus norvegicus). Mol. Ecol. 18, 2766–2778. doi: 10.1021/nn300902w.Release
Himsworth, C. G., Bidulka, J., Parsons, K. L., Feng, A. Y. T., Tang, P., Jardine, C. M., et al. (2013). Ecology of Leptospira interrogans in Norway rats (Rattus norvegicus) in an inner-city neighborhood of Vancouver, Canada. PLoS ONE 7:e2270. doi: 10.1371/journal.pntd.0002270
Himsworth, C. G., Parsons, K. L., Feng, A. Y. T., Kerr, T., Jardine, C. M., and Patrick, D. M. (2014). A mixed methods approach to exploring the relationship between Norway rat (Rattus norvegicus) abundance and features of the urban environment in an inner-city neighborhood of Vancouver, Canada. PLoS ONE 9:e97776. doi: 10.1371/journal.pone.0097776
Howe, E. J., Obbard, M. E., Black, R., and Wall, L. L. (2010). Do public complaints reflect trends in human-bear conflict? Ursus 21, 131–142. doi: 10.2192/09GR013.1
Hume, K., Terranova, D., and Thomas, C. (2002). Complaints and annoyance caused by aircraft operations: temporal patterns and individual bias. Noise Health 4, 45–55.
Johnson, S., Bragdon, C., Olson, C., Merlino, M., and Bonaparte, S. (2016). Characteristics of the built environment and the presence of the Norway rat in New York City: results from a neighborhood rat surveillance program, 2008 – 2010. J. Environ. Health 78, 22–29.
Lund, U., and Agostinelli, C. (2018). CircStats: Circular Statistics, from “Topics in Circular Statistics” (2001). Available online at: https://cran.r-project.org/package=CircStats
National Oceanic Atmospheric Administration (2015). National Weather Service Internet Services Team. Chicago, IL; Rockford, IL. Available online at: http://www.weather.gov/lot/ord_rfd_monthly_yearly_normals (Accessed August 10, 2018).
Norton, T. W. (1987). The effect of trap placement on trapping success of Rattus lutreolus velutinus (Thomas) (Muridae: Rodentia) in North-East Tasmania. Aust. Wildl. Res. 14, 305–310. doi: 10.1071/WR9870305
Panti-May, J. A., Carvalho-Pereira, T. S. A., Serrano, S., Pedra, G. G., Taylor, J., Pertile, A. C., et al. (2016). A two-year ecological study of Norway rats (Rattus norvegicus) in a Brazilian urban slum. PLoS ONE 11:e0152511. doi: 10.1371/journal.pone.0152511
Parsons, M. H., Banks, P. B., Deutsch, M. A., Corrigan, R. F., and Munshi-South, J. (2017). Trends in urban rat ecology: a framework to define the prevailing knowledge gaps and incentives for academia, pest management professionals (PMPs) and public health agencies to participate. J. Urban Ecol. 3, 1–8. doi: 10.1093/jue/jux005
Perkins, K., and Sampson, R. J. (2015). Compounded deprivation in the transition to adulthood: The intersection of racial and economic inequality among Chicagoans, 1995-2013. J. Soc. Sci. Russell Sage Found 37–54. doi: 10.7758/RSF.2015.1.1.03
Pimentel, D. (2007). “Environmental and economic costs of vertebrate species invasions into the United States,” in Managing Vertebrate Invasive Species: Proceedings of an International Symposium (Fort Collins, CO), 1–8.
Poessel, S. A., Breck, S. W., Teel, T. L., Shwiff, S., Crooks, K. R., and Angeloni, L. (2013). Patterns of human–coyote conflicts in the denver metropolitan area. J. Wildl. Manage. 77, 297–305. doi: 10.1002/jwmg.454
Rael, R. C., Peterson, A. C., Ghersi, B. M., Childs, J., and Blum, M. J. (2016). Disturbance, reassembly, and disease risk in socioecological systems. Ecohealth 13, 450–455. doi: 10.1007/s10393-016-1157-1
Renthop (2018). Chicago's Rat Complaints Continue to Grow. Chicago, IL, USA Available online at: https://www.renthop.com/studies/chicago/chicago-rat-complaints-continue-to-grow#chicagoratsassociation.
Richardson, J. L., Burak, M. K., Hernandez, C., Shirvell, J. M., Mariani, C., Carvalho-Pereira, T. S. A., et al. (2017). Using fine-scale spatial genetics of Norway rats to improve control efforts and reduce leptospirosis risk in urban slum environments. Evol. Appl. 10, 323–337. doi: 10.1111/eva.12449
Specialty Consultants (2016). A Strategic Analysis of the U.S. Jacksonville, FL: Structural Pest Control Industry.
Thornton, S. (2013). Using Predictive Analytics to Combat Rodents in Chicago. Gov. Technol. Available online at: http://www.govtech.com/data/Using-Predictive-Analytics-to-Combat-Rodents-in-Chicago.html.
United States Census Bureau (2016). QuickFacts. Chicago, IL. Available online at: https://www.census.gov/quickfacts/chicagocityillinois (Accessed August 10, 2018).
Keywords: brown rat, urban wildlife, rodent abundance, rodent control, public complaints, alley
Citation: Murray MH, Fyffe R, Fidino M, Byers KA, Ríos MJ, Mulligan MP and Magle SB (2018) Public Complaints Reflect Rat Relative Abundance Across Diverse Urban Neighborhoods. Front. Ecol. Evol. 6:189. doi: 10.3389/fevo.2018.00189
Received: 27 August 2018; Accepted: 29 October 2018;
Published: 28 November 2018.
Edited by:
Michael H. Parsons, Department of Biological Sciences, Fordham University, United StatesReviewed by:
Jonathan Richardson, Providence College, United StatesJames Emory Childs, Yale School of Public Health, Yale University, United States
Copyright © 2018 Murray, Fyffe, Fidino, Byers, Ríos, Mulligan and Magle. This is an open-access article distributed under the terms of the Creative Commons Attribution License (CC BY). The use, distribution or reproduction in other forums is permitted, provided the original author(s) and the copyright owner(s) are credited and that the original publication in this journal is cited, in accordance with accepted academic practice. No use, distribution or reproduction is permitted which does not comply with these terms.
*Correspondence: Maureen H. Murray, bWF1cmVlbm11cnJheUBscHpvby5vcmc=
 Maureen H. Murray
 Rebecca Fyffe
 Mason Fidino
 Kaylee A. Byers
 M. Jazmín Ríos2
 Matthew P. Mulligan
 Seth B. Magle