- Department of Agricultural Economics, Texas A&M University, College Station, TX, United States
Climate change induced alterations from historical patterns of precipitation, temperature, and atmospheric gases as well as increases in the frequency of extreme events is leading to alterations in global cereal production and its spatial distribution. Using a US agricultural sector model, we examine effects and acreage adaptation with an emphasis on wheat and the Pacific Northwest region. Use of a national sector model allows for analysis at the national as well as regional level. Generally, under climate change we find that the incidence of wheat production shifts northward in the Southern Great Plains, westward in Northern Great Plains and eastward in Oregon and Washington, all of which are moves to cooler conditions. Total wheat acreage in the Pacific Northwest is expected to decline from 6 million acres under no climate change to 5.4–5.7 million acres over the study period. Additionally, we consider impacts on price, production, and consumer, producer, and foreign welfare finding losses to consumer welfare and gains to producer welfare with overall losses in surplus. Recommendations are made for future research and alternative ways that adaptation strategies can be integrated into models to predict long-term impacts.
Introduction
Crop production is sensitive to climate and weather patterns. According to the 2016 NOAA State of the Climate report (NOAA, 2017), (1) globally 2016 was the warmest year on record, and (2) Every one of the 5 warmest years in the climate record have occurred since 2010. Further, the observed pace of temperature increase since 1970 is 2.5 times greater than the pace since 1880. Such increases in temperature have affected agriculture and society in general (IPCC, 2014a). Lobell and Field (2007) estimate the magnitude of the yield loss due to increased temperatures between 1981 and 2002 finding that for barley, wheat and maize production was decreased by 2–3% with market losses of about $5 billion per year. Additionally Cho and McCarl (2017) examine historical data showing that this is stimulating farmers to change crop mix with many crops moving northward and up in elevation while Mu et al. (2013) show land moving from cropland to pasture.
Climate change is expected to continue to evolve further affecting agriculture. The Inter-Governmental Panel on Climate Change (IPCC) projects even greater future effects including: increased surface temperatures, changes from historical precipitation patterns, loss of soil moisture in select regions and an increase in the frequency of extreme events among other items (IPCC, 2013). This will impact future global crop production. The production effects will also manifest in altered prices and demand levels (Adams et al., 1995). In turn, climate change will affect agricultural income and general economic conditions.
Here we simulate the impacts that projected climate change will have on United States agriculture including examining changes in the spatial incidence of crops along with the agricultural, income, production and market effects. In doing this we will place particular emphasis on wheat and the US Pacific Northwest.
The United States (US) is one of the top wheat producing countries. Its production is only surpassed by China, the European Union, India, and Russia (USDA ERS, 2016). States that produced the most wheat in 2015 were: North Dakota (370 million bushels), Kansas (321 million bushels), Montana (185 million bushels) and Washington (112 million bushels) (USDA NASS, 2016).
There is a long history of wheat production in the Pacific Northwest (PNW)—Washington, Oregon, and Idaho (Schillinger and Papendick, 2008). Sales from wheat production in Washington for 2012 were $1.1 billion (USDA NASS, 2015) and $786 million in Idaho in 2011 (IFBF, 2017). Further, three of the top 10 wheat selling counties in the US were in Washington and one in Oregon (USDA NASS, 2015).
Many studies indicate that warmer temperatures, shifts in water availability, and increased atmospheric carbon dioxide have impacted wheat yields with different effects spatially (Chen et al., 2004; Lobell and Field, 2007; McCarl et al., 2008; Attavanich and McCarl, 2014). In particular, warmer temperatures in hotter areas stress plants and lead to reduced yields (Asseng et al., 2011). But in higher latitudes or at higher elevations, warmer temperatures increase frost free days and growing degree days thereby lengthening the growing season (Kane et al., 1992). However, increased variability of temperatures has been shown to reduce wheat yields (Wheeler et al., 2000). Also, for non-irrigated crops, climate change alters precipitation patterns which will affect yields. Finally, Chen and McCarl (2001) show that climate change has increased pesticide usage and production costs. Additionally increased carbon dioxide concentrations stimulate wheat yields (Attavanich and McCarl, 2014). Overall there are both yield decreasing and increasing forces under climate change depending on location, crop and CO2 sensitivity.
Farmers' reactions to climate change is and will continue to shift land allocation between crops and other uses plus the incidence of crops spatially. The land may shift to other crops, pasture or forest. Mu et al. (2013) projected cropland in the US (especially in the central and southern region of US) would shift to pasture under the four General Circulation Models (GCMs) they tested while many studies have projected latitude and elevation shifts in crop incidence (Adams et al., 1990; Reilly et al., 2001, 2002; Cho and McCarl, 2017).
This paper will explore the impact of projected global climate change on the US with a focus on wheat production and the Pacific Northwest (PNW) taking into account the total US agricultural market. Additionally, since the magnitude of future climate change and related emissions control is uncertain, this study will use multiple climate projections across multiple mitigation scenarios to generate results on the range of possible impacts.
Materials and Methods
In order to carry out our study, we need estimates on the effect of varying degrees of climate change on crop yields. This information will then be used to see what these changes do to economically driven land allocation, production and markets.
Due to the expertise of this study team we did not generate our own simulation based crop yield estimates; rather choosing to use ones from the peer reviewed literature. Specifically, yield responses from Beach et al. (2015) were used because they were available for all FASOM regions across the entirety of the continental US and were reflective of the climate models used in the most recent IPCC Report (2013).
The study used crop yield sensitivity estimates obtained from Beach et al. (2015) who estimated crop yield changes using the Environmental Policy Integrated Climate (EPIC) crop simulation model nationwide for nine crops under alternative climate projections1. The climate projections arose from two GCMs (MIROC and IGSM-CAM hereafter called IGSM). Each run included two greenhouse gas mitigation scenarios (aggressive mitigation—hereafter called the policy scenario and no mitigation—hereafter called the reference scenario). The specific GCMs used were selected by Beach et al. (2015) because of their varying characteristics in terms of precipitation. In particular, the MIROC projections show a relatively drier future and the IGSM projections show a wetter one, particularly for the Eastern and Central US (Beach et al., 2015).
Yield estimates from Beach et al. (2015) are comparable to yield projections obtained from other cropping studies conducted specifically in the PNW. Stockle et al. (2017) showed wheat productivity increasing under climate change in the inland PNW until approximately 2050 and then declining to current levels by the end of the twenty-first century with increased carbon dioxide positively impacting yields. Karimi et al. (2017) simulated grain yields in the inland PNW suggests that grain yields will increase under climate change projections. Specifically, Karimi et al. (2017) included cropping practices and showed that yields in 2070 are projected to increase 18–48% under representative concentration pathway (RCP) 4.5 and 30–65% under RCP 8.5. Results from these regional studies support the results from the EPIC projections by Beach et al. (2015) suggesting that the EPIC projections are suitable for use in this assessment.
In terms of mitigation, the threat of climate change has caused the international community to dialog and in cases addresses emissions reductions. Since the future extent of mitigation is uncertain, Beach et al. (2015) utilized two scenarios reflecting different levels of GHG mitigation. In the no mitigation or business as usual, reference scenario, global GHG emissions are not greatly reduced and by year 2100 total radiative forcing is 10 Wm−2 (Beach et al., 2015). This corresponds most closely to the IPCC RCP 8.5 scenario which predicts temperature change of about 3.7°C by 2100 (IPCC, 2014b). Conversely, the aggressive mitigation, policy strategy, assumes GHG emissions are reduced to levels that lower total radiative forcing to 3.7 Wm−2. This case corresponds most closely to the IPCC RCP 4.5 which results in about a 1.8°C temperature change (IPCC, 2014b). These two mitigation strategies were applied to the GCMs resulting in four combinations of climate/mitigation scenarios (IGSM-Ref, IGSM-Pol, MIROC-Ref, MIROC-Pol) which Beach et al fed into EPIC to simulate crop yield effects.
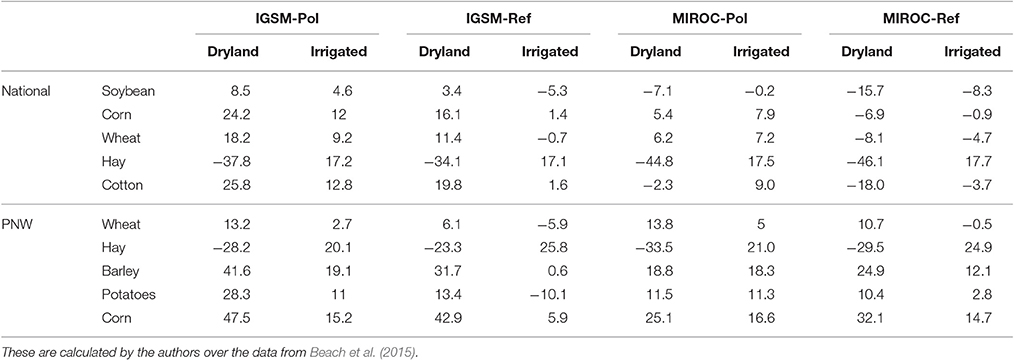
The Beach et al. (2015) yield results predict increased yields for many crops. In particular: (1) the yields under the MIROC simulations are lower than those arising from the IGSM projection; (2) Generally, the MIROC reference scenario projected a national decline in yields but positive yields in the PNW (Table 1). Nationally, corn and cotton showed the largest percentage increase under IGSM projects with wheat yields showing a slightly lower increase. Under the MIROC scenarios, corn and wheat were the best performing crops; (3) Hay showed different responses to climate change in comparison with the other crops. Increasing temperature under climate change caused dryland hay yields to decrease under all scenarios but irrigated hay yields increased; (4) The yield change for dryland and irrigated crops was negative under the drier MIROC scenarios but positive under the IGSM scenarios; and (5) In the PNW, corn and barley yields showed dramatic increases under all climate scenarios. However, the PNW average corn yield in 1980-2009 was much lower than the national average. Also barley, hay, and potatoes had a higher yield response to climate change than the national average.
Further, we investigated the variability present in the data set across the GCM and mitigation scenarios. To do this, we analyzed the relative variation in yields between scenarios by computing a relative percentage change. For each scenario we computed the standard deviation of yields for each crop and irrigation status across all the subregions. Then we computed a percentage change between each scenario and MIROC-Ref. The resultant data are given in Table 2.
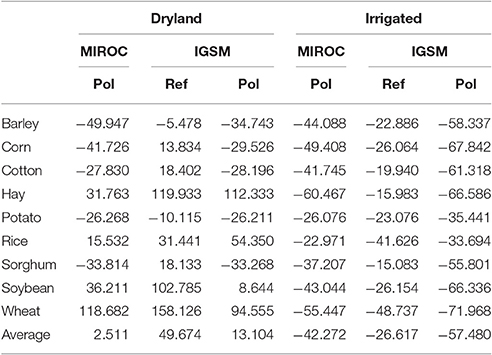
Table 2. Percentage change in crop yield standard deviations across climate projections relative to MIROC-Ref.
We found that for the dryland yields, the relative yield variation in the IGSM climate projections compared to MIROC are mixed in sign but are substantially larger for hay, wheat, soybeans and the overall average. We also found that the relative yield variation was smaller for most crop with strong mitigation (Pol) as opposed to little mitigation (Ref) but with a slightly larger overall average largely due to wheat. For irrigated yields, MIROC-Ref had the highest amount of variability with IGSM generally having less variation than MIROC and the policy scenarios having less than the reference (limited mitigation) ones. Further, percentage change in standard deviation are mostly stable and relatively constant across crops showing irrigation is reducing the variability and making the crops closer in behavior.
In turn, to address land allocation, production and market effects, the agricultural part (ASM) of the Forestry and Agricultural Sector Optimization Model (FASOM), a US agriculture sector model, was used. ASM is a non-linear programming model that simulates production, processing, transporting and marketing in the US agricultural sector in an equilibrium year (Baumes and McCarl, 1978; Adams et al., 1996, 2005). ASM simulates a perfectly competitive agricultural market in equilibrium by maximizing the total social welfare subject to resource constraints. The model simulated the maximum social welfare constrained by scarce resources, such as land, water, labor, capital and others. ASM simulates the optimal land allocation among crops, livestock and forests plus results on crop and livestock mix, total production, processing activity, bioenergy production, exports, domestic consumption and commodity prices. Figure 1 illustrates the geographic scope of the FASOM model where ASM has all components portrayed but the forestry related ones. Note ASM does not in this form treat uncertainty in the crop yield projections under a given GCM/mitigation scenario. Also, it does not simulate CO2 effects, rather that is manifest in the crop simulation results as discussed in Beach et al. (2015). Use of ASM allows us to examine impacts of the alternative climate projections on the US agricultural sector and related markets. ASM has been widely used in climate change related studies as discussed in Beach et al. (2010). For example previous studies have looked at the impact of climate change on crop yields, livestock productivity, transportation, land conversion and greenhouse gas net emission reductions (Adams et al., 1990, 1995; Reilly et al., 2001, 2002; Murray et al., 2005; Attavanich et al., 2013).
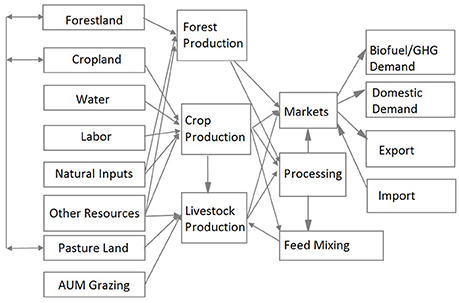
Figure 1. FASOM structure. Source: Adams et al. (2005) Unpublished paper Texas A&M University on web at http://agecon2.tamu.edu/people/faculty/mccarl-bruce/papers/1212FASOMGHG_doc.pdf.
ASM encompasses the entire US with production broken up into 63 smaller production regions (subregions) and 11 market regions. The trade of commodities can occur between US regions, or into the international market the representation of which contains supply and demand curves for 27 countries or foreign regions (Adams et al., 1996, 2005; Beach et al., 2010). Additionally, ASM simulates production of 30 crops. To capture the effect of climate change on the crops not simulated with EPIC, we used expert opinion to assign the yield sensitivities of the simulated crops to the other crops that were not simulated. For example, silage is proxied by corn. Also, we assumed all five types of wheat face the same regional yield changes although geographic incidence varied by type.
Predicting future population, technology, economic and market conditions for the next 100 years based on current economic and social structure information is difficult at best. Also, variations in projected future conditions may enlarge or offset the effects of climate change. Therefore, following many other similar studies, ASM was run as a static model for each climate scenario with the scenario climate change effects applied to current year (2015) economic and market conditions.
We also simulated the effects of adaptation strategies including: increasing irrigation or managing water allocation in response to drier environments (Howden et al., 2007), changing crop mixes (Adams et al., 1999; Barros et al., 2014), shifting crop production and varieties to higher latitudes or elevations (Reilly et al., 2002; Cho and McCarl, 2017), shifting land between cropping and grasslands to support livestock (Mu et al., 2013), changing livestock species (Seo et al., 2010) and reducing livestock stocking rates (Mu et al., 2013). In ASM, all available adaption strategies are allowed but are constrained by resources and cropping pattern. For example, irrigation and water management is limited by water availability. Crop mixes are constrained to be a convex combination of regional historical crop mix ratios blended with crop mixes for regions 200 miles south following Adams et al. (1999). For subregions on the southern border of the US (southern California, Arizona, New Mexico, the Gulf coast, southern Texas, and Florida), we allow the share of heat-tolerant crops currently produced in hot regions (such as oranges and grapefruit) to double. Adaptation behaviors are selected by maximizing total social welfare in ASM, and cannot be fully isolated. So in this study, the model chooses the optimal set of adaptation strategies and we only report overall effects of the scenarios plus narrow in on crop mix and land use adaptation.
ASM output yields national, subregional and foreign welfare estimates, prices, production and land use. For simplicity, Fisher price and production index numbers were used to capture the multi commodity price and production changes in the nation and the PNW states. We also downscaled the results to the county level for graphic displays utilizing the approach developed in Attwood et al. (2000) and Pattanayak et al. (2005).
Results
Land Reallocation
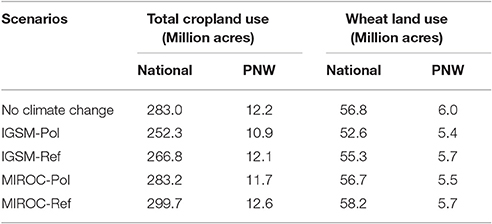
Compared to the no climate change scenario, total cropland acreage in the United States shrank under the IGSM climate projections and increased under the MIROC climate projections. Total cropland used in the US is lower under aggressive mitigation and higher without it. Results showed land moving into pasture or idled under IGSM scenarios principally because of the relatively high yield increase rate and consequent low commodity prices. The higher cropped acreage under the MIROC scenarios is explained by the lower crop yields under that scenario. In the PNW, total wheat acreage declined under all the climate change and mitigation scenarios. Similarly, national wheat acreage declined under all climate/mitigation scenarios except for MIROC-Ref (no mitigation) (Table 3). Declining wheat acreage occurred again because of the increasing yields and resultant lower prices.
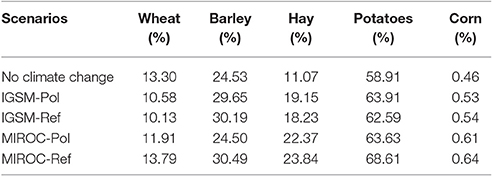
Total cropped land was smallest under the more optimistic IGSM climate projections with aggressive mitigation. This occurs because increased production causes decreased prices and net returns causing land to move out of cropping into pasture. Nationally, corn, soybeans, wheat, hay and cotton dominate land use (Table 4). The percentage of harvested acreage by crop was relatively stable across the climate and mitigation projections. Soybean acreage increased under all climate change scenarios. Since soybeans and corn partially compete for acreage, the land share of corn decreased. The price for soybeans was higher than its historical level, but the price of corn dropped, which in turn led to the shift between two crops. Wheat occupied slightly more land (as a percent of total acreage) under the IGSM scenarios, but its acreage share decreased under the MIROC scenarios. The land share of hay and cotton decreased under most scenarios, except for hay under MIROC-Ref.
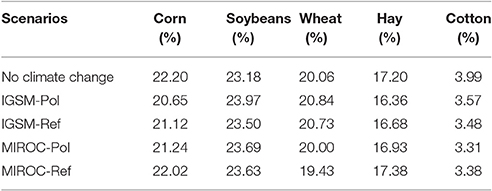
Table 4. National top 5 field crops average harvested acreage as percentage of total harvested cropland acreage (2010-2100).
Land use shares changed more in the PNW than occurred they did nationally. Wheat, hay, barley, potatoes and corn were the most important regional crops and occupied over 94% of the cropland (Table 5). Compared to a no climate change case, wheat and barley lost PNW land share under most scenarios, except for wheat under IGSM-Pol. Conversely, the land share occupied by hay and corn increased under all the scenarios. Regionally the crop shares were relatively stable under the IGSM scenarios, while the PNW land reallocations under the MIROC scenarios were slightly larger than the national ones, but still stable compared to the no climate change scenario.
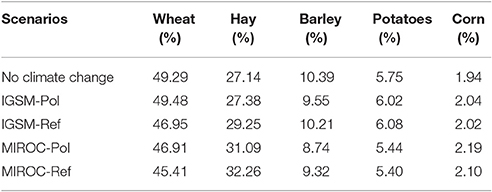
Table 5. PNW top 5 field crops average harvested acreage as percentage of total harvested cropland acreage (2010-2100).
Generally, the results showed adjustments in total area in crops with northward movements, especially at the national level. This is because while adaptation allows crop mix to change, the effects of market demand and natural resource endowments mediate the effects.
Wheat Acreage and Production
As shown in Figures 2, 3, wheat harvested acreage exhibited some shifts within regions.
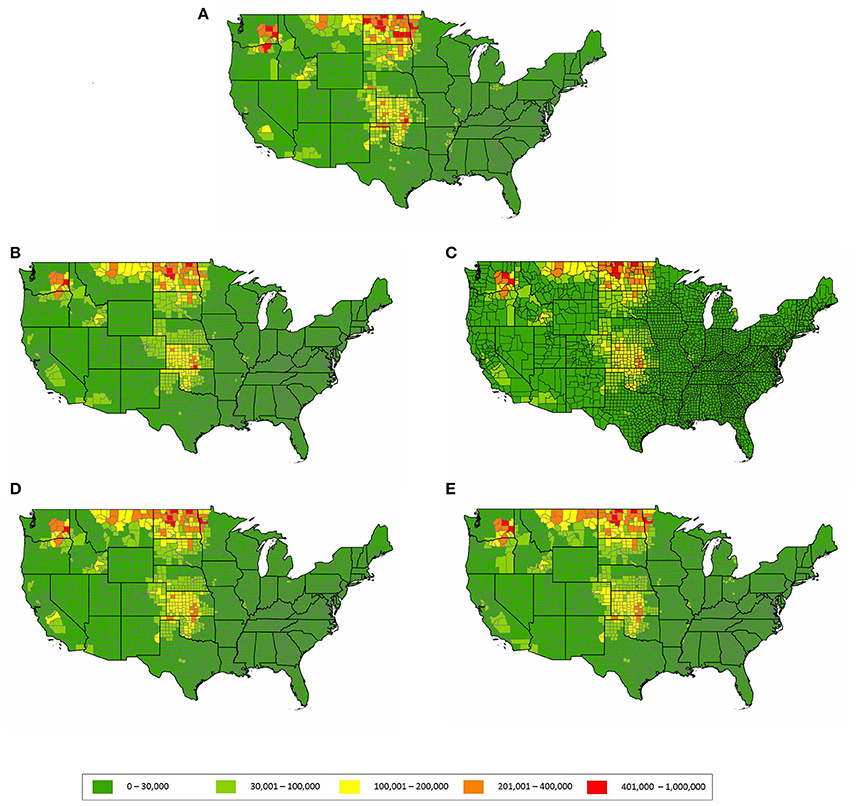
Figure 2. Wheat harvest acres per county under (A) No climate change scenario, (B) IGSM policy scenario, (C) IGSM reference scenario, (D) MIROC policy scenario, and (E) MIROC reference scenario. Wheat harvested acres are the sum of acreage for hard red winter wheat, hard red spring wheat, soft red winter wheat, white wheat and durum wheat.
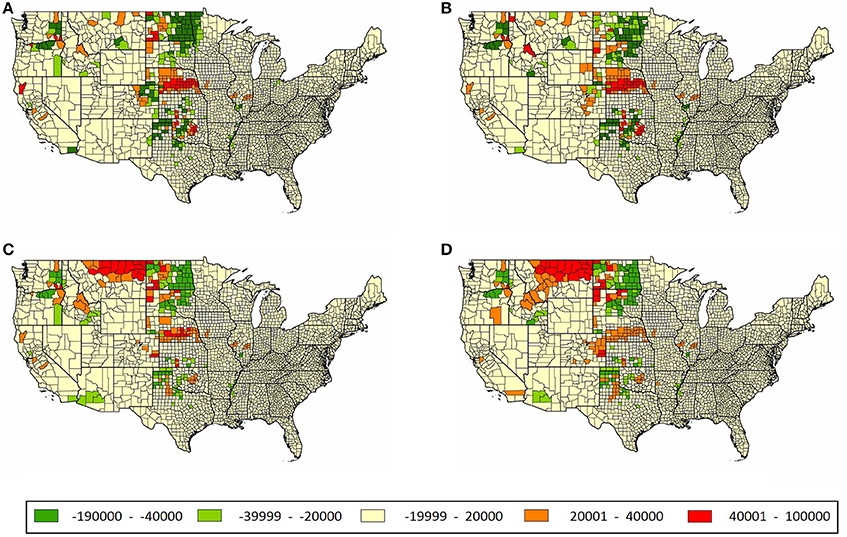
Figure 3. The difference in wheat harvested acres by US county relative to the no climate change scenario under the (A) IGSM policy scenario, (B) IGSM Reference Scenario, (C) MIROC policy scenario, and (D) MIROC reference scenario. Wheat acres are the sum of acres in hard red winter wheat, hard red spring wheat, soft red winter wheat, white wheat and durum wheat.
Under the IGSM-Pol scenario, there were a number of counties where wheat declined due to the substantial yield increases and resultant low market prices. In particular, the Beach et al. (2015) EPIC estimates show an increase in the national average wheat yield of 18% under dryland conditions. Yield changes for wheat and other crops coupled with relatively inelastic demand, led to a decline in prices and in turn in national and PNW wheat acreage as well as that of other crops. In the major production regions for hard red winter wheat (Southern Great Plain), a northward shift in harvested acreage from Texas and Colorado to Nebraska occurred. This is an adaptation response to move the wheat production to lower temperature regions. Also in the Northern Great Plains, hard red soft wheat shifted from east to west in South and North Dakota and marginally into Montana to take advantage of lower temperatures at higher elevations. Similarly, in the Mississippi River basin in Missouri and Arkansas wheat land shifted northward. In the PNW, the wheat production area moved eastward again to higher and cooler elevations.
Under the IGSM-Ref scenario, wheat acreage showed similar regional pattern shifts to those under the IGSM-Pol scenario but with smaller declines in harvested acreage. Hard red winter wheat in the Southern Great Plains moved northward to Nebraska and into higher elevation areas in Colorado and Wyoming. In North Dakota, wheat areas shifted from east to west and marginally into Montana with a decrease of total wheat harvested acres. Also, more than 1.5 million North Dakota acres switched from hard red spring wheat to hard red winter wheat and durum wheat as an adaptation to the higher temperatures. A northward shift in wheat acreage also occurred in the Mississippi River basin. In the PNW, we found more wheat was grown in the higher elevation regions in Idaho. Spring barley acreage in the PNW was generally stable across the climate projections. Coupled with the higher rate of yield increases than national average, the PNW gained in market share of barley under the climate change projections relative to the no climate change case.
The acreage and geographic distribution of wheat under the MIROC projections differed mainly due to smaller estimated yield changes. Under the MIROC-Pol scenario, national wheat acreage was the same as if no climate change occurred. The largest shift was observed from the east to the west in the Dakotas. Declines in hard red spring wheat production in North Dakota were offset by increases in hard red winter wheat in Montana. Also a shift in hard red winter wheat from the Texas High Plains to Nebraska was observed. Cooler temperatures in Nebraska and increased soil moisture made dryland production more viable. In the PNW, the wheat and barley acreage fell and shifted from irrigated to dryland production. Under this scenario, irrigated hay replaced irrigated wheat, because irrigated hay yields increased and the crops compete for land and water.
Nationally, the MIROC-Ref scenario showed harvested wheat acreage increased due to dramatic increases in cultivation in Montana which was driven by lower overall yields and a higher wheat price. In the dry MIROC-Ref scenario, we find: (a) Texas wheat moving northward, (b) more wheat grown in Nebraska, and (c) some of the PNW production shifting out of Washington and Oregon into Idaho. In general, the wheat cultivation areas shifted northward in the southern regions of the Great Plains and to higher elevation areas in the northern Great Plains. Moreover, the substitution out of spring wheat to winter wheat is another adaptation strategy to the higher temperatures under climate change.
Effects on Agricultural Production and Prices
Index numbers were used to summarize production and price changes (Figures 4, 5). They were computed for several classes of products. The cereal and soybean crop indices incorporate results for corn, soybeans, durum wheat, hard red spring wheat, hard red winter wheat, soft red winter wheat, soft white wheat, sorghum, rice, oats, spring barley, and winter barley define others briefly. The indices show smaller levels of PNW wheat production under all climate scenarios along with lower levels for PNW cereal and soybean production under all climate scenarios but MIROC-Ref scenario with the PNW exhibiting greater adjustments relative to the national results (Figures 4, 5). PNW livestock production increased under the IGSM climate projections and were smaller under the MIROC projections. The IGSM projections stimulated more national wheat production than occurred under the MIROC projections. Conversely, wheat production in the PNW was lower under IGSM than MIROC as their US market share (Table 6). Under all climate scenarios PNW wheat production is lower as it is in Washington and Oregon, but it is higher in cooler Idaho. This is consistent with the wheat in PNW shifting toward Idaho. Production in Idaho increases more under IGSM than under MIROC. It also increases under aggressive mitigation (policy scenario).
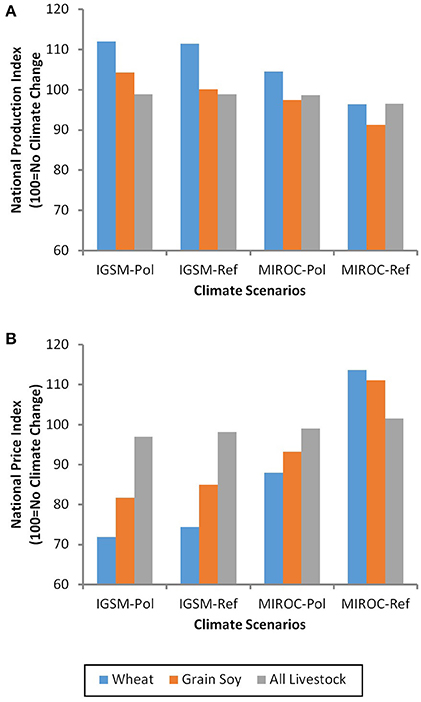
Figure 4. Index numbers for US national agricultural production and prices across four GCM and mitigation extent cases. (A) Production indices for volume of US wheat harvested, cereal and soybean crops harvested, and livestock, (B) Price indices for US wheat harvested, cereal and soybean crops harvested, and livestock. Each panel shows production and price indices for the climate projections and mitigation extent scenarios IGSM Policy (IGSM-Pol), IGSM Reference (IGSM-Ref), MIROC-Policy (MIROC-Pol), and MIROC-Reference (MIROC-Ref). Index values are relative to a baseline with no climate change impacts.
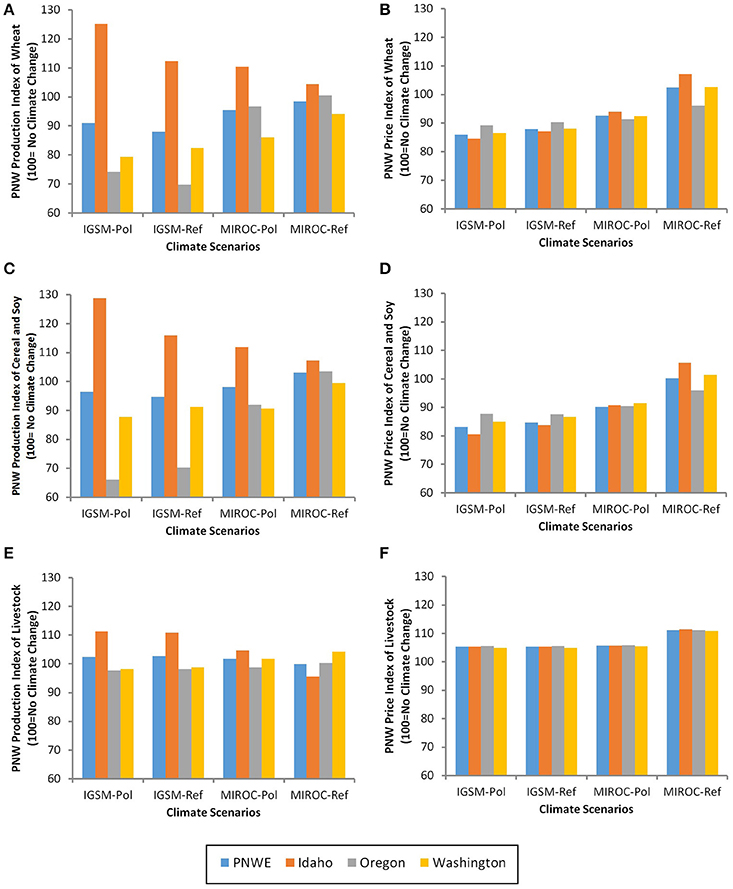
Figure 5. Indices numbers for PNW agricultural production and prices across four GCM and mitigation extent cases. (A) Production indices for wheat, (B) Price indices for wheat, (C) Production indices for cereal and soybean crops, (D) Price indices for cereal and soybean crops, (E) Production indices for livestock, and (F) Price indices for livestock. Each panel shows the change in (or a comparison of) index numbers relative to the no climate change base vs. results under the climate/mitigation scenarios (IGSM Policy (IGSM-Pol), IGSM Reference (IGSM-Ref), MIROC-Policy (MIROC-Pol), and MIROC-Reference (MIROC-Ref) under the three PNW states (Idaho, Oregon, Washington) and the index for the region.
Similar results were found for cereal and soybean production. The national combined cereal and soybean production indices were highest under the IGSM-Pol scenario with lower results when mitigation is not pursued (IGSM-Ref). National production indices were even lower under the MIROC climate projection. The smallest level of national production was projected in the MIROC-Ref scenario where production declined the most. This is in response to the EPIC projections of national yields increasing under IGSM and decreasing under MIROC-Ref. As a consequence of the increased barley production and small wheat reductions in the PNW, aggregate cereal production achieved its highest values under MIROC-Ref. In the other three scenarios, the PNW showed less production than under no climate change. Within the PNW, average cereal and soybean production indices under all climate scenarios were lower for Oregon and Washington than for Idaho which projects an increase in production compared to the no climate change case.
Generally, the change in wheat, cereal and soybean production levels in PNW is opposite of the changes found nationally. In the MIROC-Ref scenario, the PNW produced more than under the no climate change case, but the US total national production was lower. In the IGSM scenarios, national production increased, but PNW production decreased. This is consistent with the scenario dependent projected yields. Coupled with inelastic demand, drier and hotter conditions in eastern part of US projected by MIROC shifted production to the cooler west. Conversely, in the wetter IGSM scenarios, the east gains competitive advantage and, in turn, increases production.
The livestock production indices at the national and PNW level did not show large differences compared to the no climate change scenario, perhaps because we did not model climate change induced shifts in production. The livestock production index nationally and in the PNW showed a range of about 4%, caused by the feed cost and land use variation.
Price indices were also computed with the results shown for wheat, cereal and soybeans and all livestock in Figures 4, 5. Free trade across regions and the law of one price force PNW prices to follow nationwide trends. Wheat and cereal prices were higher under the drier MIROC climate projections compared to the IGSM projections and comparatively lower when aggressive mitigation policies were pursued.
Nationally, wheat prices fell more than did the cereal and soybean price index for all climate projections relative excepting under MIROC-Ref. But in the PNW, the relative wheat price change is less than that for the cereal and soybean price index.
Similar to the production results, livestock prices at the national and regional level showed little change. Prices were 5% higher than under the no climate change case for the PNW across all climate projections. Nationally, prices were lower under the IGSM climate projections compared to results under the MIROC climate projections although total range across all four climate scenarios was small being approximately 5%.
Producer and Consumers' Welfare
Welfare change estimates for consumers', producers', international trade, and global society are shown in Figure 6. Consumers' welfare generally decreased with the smallest change occurring under the IGSM-Pol and the largest under MIROC-Ref. This is consistent with the changes of price and production index of final product production (Figure 7). Higher levels of consumers' welfare occurs when aggressive mitigation is pursued and lower when mitigation is minimal. Such a result was not unexpected as those scenarios had relatively higher production and lower prices at the national level which benefited consumers.
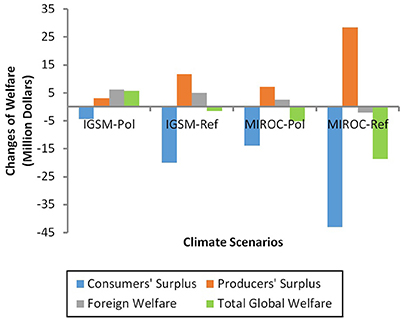
Figure 6. Changes in consumers', producers', foreign and total social welfare relative to no climate change under four climate projections from GCM/ mitigation extent cases (IGSM-Pol, IGSM Policy; IGSM-Ref, IGSM Reference; MIROC-Pol, MIROC-Policy; and MIROC-Ref, MIROC-Reference).
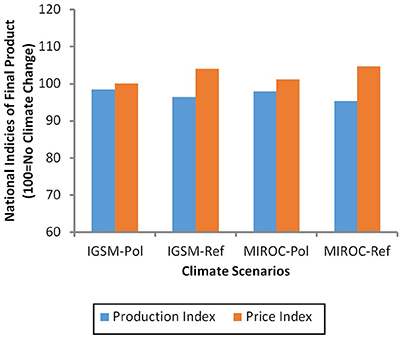
Figure 7. Index numbers for US national agricultural final products production and prices across four GCM and mitigation extent cases (IGSM-Pol, IGSM Policy; IGSM-Ref, IGSM Reference; MIROC-Pol, MIROC-Policy; and MIROC-Ref, MIROC-Reference).
The results for producers' welfare or net income (measured as producers' surplus) are the opposite of the consumers' results. Average producers' welfare is larger the less is produced so with the more severe MIROC cases and under less aggressive mitigation. We also found that foreign welfare changes due to international trade, are greatest under the less severe IGSM climate projections compared to the more severe MIROC climate projections.
Across these results we found consumers' surplus loss was larger than the producers' surplus gain leading to lower total societal welfare for all climate projections except for IGSM-Pol. Smaller losses were shown under aggressive mitigation (policy scenario) compared to the reference scenario. Further, there was also income redistribution as seen by the opposite signs of producers' and consumers' welfare in each climate scenario.
Discussion
In this study, we found that overall crop mix shares did not change much but total acres harvested did. Acres in wheat production shifted north and west to cooler conditions in the Great Plains and east out of Oregon and Washington to higher altitudes and cooler temperatures in Idaho as also projected in the econometric based analysis of Cho and McCarl (2017). More winter wheat is planted along the northern border of the US, instead of spring wheat as an adaptation to higher temperatures under climate change. Overall this study showed, the PNW showed declining production of wheat in the PNW, mainly in Washington and Oregon but with increasing production in Idaho. Under all but the MIROC-Ref climate projection, the PNW lost wheat market share. Our results show increases in market share for the PNW for barley, hay, and potatoes.
Wheat production and prices were found to be sensitive to the climate projection and the extent of mitigation which illustrated that climate change severity and adaptations greatly impact vulnerability. Predicted wheat yield changes generally lead to national wheat production increases in all scenarios but the MIROC-Ref case. Similarly, national cereal and soybean production was higher under the wetter IGSM projection compared to the drier MIROC projection. Consequently, national wheat, and combined cereal and soybean crop prices were lower in the IGSM climate projection than under the MIROC climate projections.
This study showed total social welfare is projected to be higher under the wetter IGSM climate projection relative to the drier MIROC climate projection. Total social welfare is relatively higher if aggressive mitigation is pursued compared to less aggressive action. Nationally, an inverse relationship was found both between price and production, and between consumers' and producers' welfare when comparing the results of the four climate/mitigation projections. This was present across the results with the relationship generally being production reductions relatively benefited producers and disadvantaged consumers with the converse happening when production increased. Similarly, the relatively lower production changes under no mitigation benefitted producers and disadvantaged consumers relative to aggressive mitigation. This reflects the importance of considering demand curves and price adjustments rather than solely looking at yield and total production impacts.
These findings are potentially contradictory to Lobell and Field (2007) which asserted declining global wheat production, although they had a caveat about the United States. Here, the findings suggest increasing US wheat production under all climate situations except for the MIROC climate projection coupled with limited mitigation effort.
Limitations and Future Study
As in all other studies, this research has limitations and areas where it could be extended. First, as discussed above, the future economic and market structure is hard to predict so we imposed the projected climate change on the current, 2015, economy. This allows for an analysis of just the climate change effects. However, this arguably could influence the results as the economic and market conditions will change in the next 100 years. An alternative base year could be used in future work.
Second, ASM fails to account for all the transactions cost that would occur with switching land use, such as building altered commodity movement and processing infrastructure, or carrying out education programs to teach farmers new production techniques. Estimates could be gathered for these transaction costs and built into the model.
Third, the analysis did not account for climate change induced alterations in the supply and demand conditions within the rest of world and only focused on changes in the United States. Incorporation of information on global market effects would be a significant addition.
Fourth, the underlying EPIC data on climate projection effect on yields were only available for 9 crops in the United States and only for the climate model and mitigation cases used herein. EPIC also assumed unconstrained water use for irrigated crops. Although ASM took water reductions into account, further work could be done to improve these projections. Adding simulations for more minor crops and climate/mitigation cases across an ensemble of climate models would be a useful extension.
Despite the above limitations, we believe this study clearly demonstrates that climate change will impact wheat production in the United States nationally plus have different impacts across regions. This study suggested that PNW wheat distribution and total acreage is likely to change with shifts in comparative advantage. Finally, climate change is projected to cause an income distribution alteration between producers and consumers with total societal welfare higher if aggressive mitigation is pursued.
Author Contributions
AT and CF led the analysis and constructed the initial paper draft. BM conceptualized the scenarios to be used and guided the others thorough ASM use plus did editing on the paper draft.
Funding
This research was supported by long term grants and financial support from the Environmental Protection Agency, Texas A&M AgriLife and USDA plus an ongoing NSF FEW Nexus grant entitled “A Modeling Framework to Couple Food, Energy, and Water in the Teleconnected Corn and Cotton Belts.”
Conflict of Interest Statement
The authors declare that the research was conducted in the absence of any commercial or financial relationships that could be construed as a potential conflict of interest.
Acknowledgments
The authors would like to acknowledge the conversations and opportunities to participate in this issue that were arose from the Transitioning Cereal Systems to Adapt to Climate Change Conference in 2015.
Footnotes
1. ^The crops included in Beach et al. (2015) are barley, corn, cotton, hay, potatoes, rice, sorghum, soybeans, and wheat.
References
Adams, D. M., Alig, R. J., Callaway, J. M., Winnett, S. M., and McCarl, B. A. (1996). The forest and agricultural sector optimization model (FASOM): model description. USDA Forest Service Report PNW-RP-495.
Adams, D., Alig, R., McCarl, B. A., Murray, B. C., Bair, L., Depro, B., et al. (2005). FASOMGHG Conceptual Structure, and Specification: Documentation. Available online at: http://agecon2.tamu.edu/people/faculty/mccarl-bruce/papers/1212FASOMGHG_doc.pdf
Adams, R. M., Fleming, R. A., Chang, C. C., McCarl, B. A., and Rosenzweig, C. (1995). A reassessment of the economic effects of global climate change on US agriculture. Clim. Change 30, 147–167. doi: 10.1007/BF01091839
Adams, R. M., McCarl, B. A., Segerson, K., Rosenzweig, C., Bryant, K., Dixon, B., et al. (1999). “Economic effects of climate change on US agriculture,” in The Impact of Climate Change on the US Economy, eds R. Mendelsohn and J. E. Neumann (Cambridge: Cambridge University Press), 18.
Adams, R. M., Rosenzweig, C., Peart, R. M., Ritchie, J. T., McCarl, B. A., Glyer, J. D., et al. (1990). Global climate change and US agriculture. Nature 345, 219–224.
Asseng, S., Foster, I., and Turner, N. C. (2011). The impact of temperature variability on wheat yields. Global Change Biol. 17, 997–1012. doi: 10.1111/j.1365-2486.2010.02262.x
Attavanich, W., and McCarl, B. A. (2014). How is CO2 affecting yields and technological progress? A statistical analysis. Clim. Change 124, 1–16. doi: 10.1007/s10584-014-1128-x
Attavanich, W., McCarl, B. A., Ahmedov, Z., Fuller, S. W., and Vedenov, D. V. (2013). Climate change and infrastructure: effects of climate change on U.S. grain transport. Nat. Clim. Change 3, 638–643. doi: 10.1038/nclimate1892
Attwood, J., McCarl, B., Chen, C., Eddleman, B., Nayda, B., and Srinivasan, R. (2000). Assessing regional impacts of change: linking economic and environmental models. Agricul. Syst. 63, 147–159. doi: 10.1016/S0308-521X(99)00077-3
Barros, V., Field, C., Dokke, D., Mastrandrea, M., Mach, K., Bilir, T., et al. (2014). Climate Change 2014: Impacts, Adaptation, and Vulnerability. Part B: Regional Aspects. Contribution of Working Group II to the Fifth Assessment Report of the Intergovernmental Panel on Climate Change. Cambridge: Cambridge University Press.
Baumes, H., and McCarl, B. A. (1978). Linear programming and social welfare: model formulation and objective function alternatives. Can. J. Agric. Econ. 26, 53–60. doi: 10.1111/j.1744-7976.1978.tb02919.x
Beach, R. H., Cai, Y., Thomson, A., Zhang, X., Jones, R., McCarl, B. A., et al. (2015). Climate change impacts on US agriculture and forestry: benefits of global climate stabilization. Environ. Res. Lett. 10:095004. doi: 10.1088/1748-9326/10/9/095004
Beach, R. H., Adams, D. M., Alig, R. J., Baker, J. S., Latta, G. S., McCarl, B. A., et al. (2010). Model documentation for the forest and agricultural sector optimization model with greenhouse gases (FASOMGHG). Report Prepared for Sara Bushey Ohrel, U.S. Environmental Protection Agency Climate Change Division 1200 Pennsylvania Avenue. Washington, DC.
Chen, C. C., and McCarl, B. A. (2001). Pesticide usage as influenced by climate: a statistical investigation. Clim. Change 50, 475–487. doi: 10.1023/A:1010655503471
Chen, C. C., McCarl, B. A., and Schimmelpfennig, D. E. (2004). Yield variability as influenced by climate: a statistical investigation. Clim. Change 66, 239–261. doi: 10.1023/B:CLIM.0000043159.33816.e5
Cho, S. J., and McCarl, B. A. (2017). Climate change influences on crop mix shifts in the United States. Scientific Reports 7.
Howden, S. M., Soussana, J. F., Tubiello, F. N., Chhetri, N., Dunlop, M., and Meinke, H. (2007). Adapting agriculture to climate change. Proc. Natl. Acad. Sci. U.S.A. 104, 19691–19696. doi: 10.1073/pnas.0701890104
IFBF (2017). Idaho Farm Bureau Federation (IFBF). Idaho Wheat. Availabe online at: http://www.idahofb.org/index.php?action=commodities.wheat.
IPCC (2013). Climate Change 2013: The Physical Science Basis. Contribution of Working Group I to the Fifth Assessment Report of the Intergovernmental Panel on Climate Change, eds T. F. Stocker, D. Qin, G. K. Plattner, M. Tignor, S. K.Allen, J. Boschung, et al. Cambridge; New York, NY: Cambridge University Press.
IPCC (2014a). Climate Change 2014: Impacts, Adaptation, and Vulnerability. Part A: Global and Sectoral Aspects. Contribution of Working Group II to the Fifth Assessment Report of the Intergovernmental Panel on Climate Change, eds C. B. Field, V.R. Barros, D. J. Dokken, K. J. Mach, M. D. Mastrandrea, T. E. Bilir, M. Chatterjee, K. L. Ebi, Y. O. Estrada, R. C. Genova, B. Girma, E. S. Kissel, A. N. Levy, S. MacCracken, P. R. Mastrandrea, and L. L. White. Cambridge; New York, NY: Cambridge University Press.
IPCC (2014b). Climate Change 2014: Synthesis Report. Contribution of Working Groups, I, II and III to the Fifth Assessment Report of the Intergovernmental Panel on Climate Change, eds Core Writing Team, R. K. Pachauri, and L. A. Meyer. Geneva: IPCC.
Kane, S., Reilly, J., and Tobey, J. (1992). An empirical study of the economic effects of climate change on world agriculture. Clim. Change 21, 17–35. doi: 10.1007/BF00143251
Karimi, T., Stockle, C. O., Higgins, S. S., Nelson, R. L., and Huggins, D. (2017). Projected dryland cropping system shifts in the pacific northwest in response to climate change. Front. Ecol. Evol. 5:20. doi: 10.3389/fevo.2017.00020
Lobell, D. B., and Field, C. B. (2007). Global scale climate–crop yield relationships and the impacts of recent warming. Environ. Res. Lett. 2:011002. doi: 10.1088/1748-9326/2/1/014002
McCarl, B. A., Villavicencio, X., and Wu, X. M. (2008). Climate change and future analysis: is stationarity dying. Am. J. Agric. Econ. 90, 1242–1247. doi: 10.1111/j.1467-8276.2008.01211.x
Mu, J. E., McCarl, B. A., and Wein, A. M. (2013). Adaptation to climate change: changes in farmland use and stocking rate in the US. Mitig. Adapt. Strat. Global Change 18, 713–730. doi: 10.1007/s11027-012-9384-4
Murray, B. C., Sommer, A. J., Depro, B., Sohngen, B. L., McCarl, B. A., Gillig, D., et al. (2005). Greenhouse Gas Mitigation Potential in US Forestry and Agriculture. EPA Report 430-R-05-006.
NOAA (2017). NOAA National Centers for Environmental Information, State of the Climate: Global Analysis for December 2016, published online January 2017. Accessed on January 29, 2017. Availabe online at: http://www.ncdc.noaa.gov/sotc/global/201612.
Pattanayak, S. K., McCarl, B. A., Sommer, A. J., Murray, B. C., Bondelid, T., Gillig, D., et al. (2005). Water quality co-effects of greenhouse gas mitigation in US agriculture. Clim. Change 71:341. doi: 10.1007/s10584-005-5925-0
Reilly, J. M., Hrubovcak, J., Graham, J., Abler, D. G., Darwin, R., Hollinger, S. E., et al. (2002). Changing Climate and Changing Agriculture: Report of the Agricultural Sector Assessment Team, US National Assessment. Prepared as part of USGCRP National Assessment of Climate Variability. (Cambridge: Cambridge University Press).
Reilly, J. M., Tubiello, F., McCarl, B. A., and Melillo, J. (2001). “Climate change and agriculture in the United States,” in Climate Change Impacts on the United States-Foundation Report: The Potential Consequences of Climate Variability and Change. (Cambridge: Cambridge University Press), 379–403.
Schillinger, W. F., and Papendick, R. I. (2008). Then and now: 125 years of dryland wheat farming in the Inland Pacific Northwest. Agron. J. 100(Suppl. 3), S166–S182. doi: 10.2134/agronj2007.0027c
Seo, S. N., McCarl, B. A., and Mendelsohn, R. (2010). From beef cattle to sheep under global warming? An analysis of adaptation by livestock species choice in South America. Ecol. Econ. 69, 2486–2494. doi: 10.1016/j.ecolecon.2010.07.025
Stockle, C. O., Higgins, S., Nelson, R., Abatzoglou, J., Huggins, D., Pan, W., et al. (2017). Evaluating opportunities for an increased role of winter crops as adaptation to climate change in dryland cropping systems of the U.S. Inland Pacific Northwest. Clim. Change. 33, 1–15. doi: 10.1007/s10584-017-1950-z
USDA ERS (2016). United States Department of Agriculture Economic Research Service (USDA ERS). Wheat: Background. Availabe online at: https://www.ers.usda.gov/topics/crops/wheat/background.aspx.
USDA NASS (2015). United States Department of Agriculture National Agricultural Statistics Service (USDA NASS). 2012 Census of Agriculture Highlights: Wheat Farming. Availabe online at: https://www.agcensus.usda.gov/Publications/2012/Online_Resources/Highlights/Wheat%20Farming/Wheat_Farming.pdf.
USDA NASS (2016). United States Department of Agriculture National Agricultural Statistics Service (USDA NASS). Crop Production 2015 Summary. Availabe online at: https://www.usda.gov/nass/PUBS/TODAYRPT/cropan16.pdf.
Keywords: climate change, adaptation, agriculture production, ASM, Pacific Northwest, cereal crops
Citation: Fei CJ, McCarl BA and Thayer AW (2017) Estimating the Impacts of Climate Change and Potential Adaptation Strategies on Cereal Grains in the United States. Front. Ecol. Evol. 5:62. doi: 10.3389/fevo.2017.00062
Received: 07 March 2017; Accepted: 31 May 2017;
Published: 15 June 2017.
Edited by:
Erin Brooks, University of Idaho, United StatesReviewed by:
Fernando José Cebola Lidon, Faculdade de Ciências e Tecnologia da Universidade Nova de Lisboa, PortugalMukhtar Ahmed, Pir Mehr Ali Shah Arid Agriculture University, Pakistan
Copyright © 2017 Fei, McCarl and Thayer. This is an open-access article distributed under the terms of the Creative Commons Attribution License (CC BY). The use, distribution or reproduction in other forums is permitted, provided the original author(s) or licensor are credited and that the original publication in this journal is cited, in accordance with accepted academic practice. No use, distribution or reproduction is permitted which does not comply with these terms.
*Correspondence: Bruce A. McCarl, bWNjYXJsQHRhbXUuZWR1
†Seniority of Authorship is Equally Shared.
 Chengcheng J. Fei†
 Anastasia W. Thayer