
94% of researchers rate our articles as excellent or good
Learn more about the work of our research integrity team to safeguard the quality of each article we publish.
Find out more
ORIGINAL RESEARCH article
Front. Epidemiol. , 01 May 2024
Sec. Aging and Life-course Epidemiology
Volume 4 - 2024 | https://doi.org/10.3389/fepid.2024.1353083
 Moon J. Lee1,†
 Louay Almidani1,†Laura Samuel2,3
 Bonnielin K. Swenor2,3
 Joshua R. Ehrlich4,5
 Varshini Varadaraj2,3*
Introduction: Vision impairment (VI) may further exacerbate older adults’ vulnerability to experiencing food insecurity and may be a unique and important target for policies addressing access to nutritional food. The purpose of this study is to determine the association of VI in older adults with food insecurity.
Methods: This is a cross-sectional analysis of round 11 (2021) of the National Health and Aging Trends Study (NHATS), a nationally representative survey of U.S. Medicare beneficiaries ages 65 and older. Participants include 2,815 older adults with complete data on at least one objective measure of vision (distance, near or contrast sensitivity) and food insecurity. Food insecurity was assessed using a previously developed indicator of food insecurity in NHATS. VI was defined as binocular visual acuity (VA) worse than 0.3 logMAR (Snellen equivalent 20/40) at distance or its near equivalent, or contrast sensitivity (CS) worse than 1.55 logUnits. Continuous VI measures included distance and near VA (per 0.1 logMAR), and CS (per 0.1 logCS).
Results: Participants were majority White (82%) and female (55%), and 3% had food insecurity. Older adults with any VI had a greater prevalence of food insecurity than adults without VI (5.0% vs. 2.0%, p < 0.05). In fully adjusted regression analyses, individuals with any VI experienced double the odds of food insecurity than individuals without VI (OR: 2.1, 95% CI: 1.2–3.6). Distance VI (measured continuously) was associated with 1.2 times the odds of food insecurity (OR = 1.2; 95% CI: 1.0–1.3, per 0.1 logMAR). All other vision measures trended towards higher odds of food insecurity, though not statistically significant.
Discussion: Older adults with VI experience higher rates of food insecurity than their peers. Interventions to improve food security should be targeted towards addressing the specific barriers faced by visually impaired older adults.
Adults ages 65 and older comprise a rapidly growing proportion of the United States (U.S.) population with a projected increase by almost 18 million between the years 2020 and 2030 (1). Due to a multitude of individual and system level factors, older adults are at high risk of food insecurity, defined by the United States Department of Agriculture (USDA) as “limited or uncertain availability of nutritionally adequate and safe foods” (2, 3). Not only do older adults face specific social and financial constraints not faced by young populations such as higher rates of social isolation and reliance on fixed income sources, but they are also disproportionately impacted by age-related physical limitations, disabilities, and health conditions that impact their access to nutritional food (4, 5).
Vision impairment (VI) is also highly prevalent in the older adult population, with global estimates of 77% of 43.3 million blind individuals being age 50 and older (6). The presence of VI in older adults poses significant implications in terms of mobility (7), frailty (8, 9), and access to medical care and transportation (10), which can further magnify food insecurity.
Data on the association of VI and food insecurity is limited but evolving. Recent studies have demonstrated that both self-reported (trouble seeing) and objective measures of VI [presenting distance visual acuity (VA)] are associated with a greater prevalence of food insecurity in a dose-response manner (11, 12). However, there has been little data to date focusing on older adults and on other types of VI as measured by near VA, or contrast sensitivity (CS), in association with food insecurity, which may further help characterize this relationship. This is critical to identifying older adults with varying levels and types of VI that may be at increased vulnerability to experiencing food insecurity and developing targeted interventions.
Current interventions such as federal food assistance programs are in place, however, there are data gaps on the use of such programs by older adults with VI. The Supplemental Nutrition Assistance Program (SNAP) is currently the largest federally funded food assistance program in the U.S that provides monthly benefits to low-income individuals and families. In the fiscal year 2022, more than 41 million Americans per month participated in SNAP (13), and studies have shown that SNAP participation reduces food insecurity (14, 15). Therefore, we investigated the cross-sectional association between multiple objective measures of VI and food insecurity, and VI and SNAP participation, in a nationally representative survey of older adults.
We analyzed data from round 11 (2021) of the National Health and Aging Trends Study (NHATS), a nationally representative survey of U.S Medicare beneficiaries ages 65 and older. A total of 3,817 older adults completed in-person surveys alone or with the assistance of a proxy respondent. The primary analysis assessing the association between VI and food insecurity included a total of 2,815 community-dwelling participants after excluding adults who were deceased or nursing home residents, adults who did not attempt vision activities, and adults missing vision or food insecurity data (Supplementary Figure S1). The secondary analysis assessing the association between VI and SNAP status included 1,245 adults after excluding adults missing SNAP participation data, adults missing eligibility data and adults ineligible for SNAP participation (>200% of the federal poverty level) (16).
Binocular presenting VA was measured with participants wearing their usual corrective lenses and analyzed on categorical and continuous scales. All objective vision measures in NHATS were assessed using Ridgevue's tablet-based tests designed to replicate standard vision tests used in in-office eye examinations. This protocol was piloted in NHATS in 2019 and was found to have high levels of correlation when compared to the gold-standard equivalents for measuring VA and CS (17, 18). Distance and near VI was defined categorically as VA >0.3 logMAR (i.e., Snellen equivalent of <20/40) or its equivalent at near, respectively (19). Contrast sensitivity impairment (CSI) was defined as <1.55 logUnits, a cut off based on a prior study of normal CS values representing 2 standard deviations below the sample mean (18, 20). Any VI included participants who met VI criteria using distance VA, near VA, or CS. Continuous measures of distance and near VA, and CS were measured using a logMAR or logUnits scale, respectively. Detailed NHATS vision activities protocols have been described elsewhere (20).
Food insecurity was defined using a summary indicator previously established using NHATS survey responses that was based on skipping meals, going without groceries, and going without hot meals due to lack of social support and/or financial barriers (21). In total, responses to 5 questions were assessed, and individuals with positive responses (“yes”) to any of the 5 items were classified as food insecure. The 5 questions included skipping meals due to lack of food or money to buy food, frequency of skipping meals (positive response defined as ≥ a few days), forgoing groceries due to lack of assistance, going without hot meals due to lack of assistance, and going without eating due to lack of assistance. SNAP participation status was assessed in all survey respondents based on the response “yes” to the question “There are several state and federal programs that help people in need. In the last year, did you receive help from SNAP?”, and was defined as SNAP eligible participants and SNAP eligible non-participants. Only SNAP eligible participants based on income were included in our secondary analysis.
Information on age (70–74, 75–79, 80–84, 85–89, ≥90 years), sex (male, female), race/ethnicity (Non-Hispanic White, Non-Hispanic African American, Hispanic, Non-Hispanic other), income (<22K, 22–40K, 40–75K, >75K), marital status Non-married/Non-partnered, and married/living with a partner), number of children in the household (0, ≥1) and comorbidities was also collected. Co-morbidities were categorized into total number of conditions (0–1, 2, 3, ≥4) which included: diabetes, hypertension, hyperlipidemia, arthritis, osteoarthritis, stroke, lung disease, cancer, and hip fractures.
All estimates incorporated survey weights to account for the complex survey design of NHATS and non-response. Sociodemographic characteristics were stratified by VI status and compared using Chi-squared tests for categorical variables and t-tests for continuous variables. Multivariable logistic regression models were used to assess the association between VI (any objective VI, distance VI, near VI, CSI) and food insecurity status. Models were adjusted for age, sex, race/ethnicity, income, marital status, number of children, and comorbidities. Covariates in the final model were included if demonstrated to be associated with VI and food insecurity and/or deemed clinically relevant. Any survey question responses of “Don't know” and “Refuse” were treated as missing values and excluded from analyses. For our secondary analysis, multivariable logistic regression models adjusting for the same confounders as the primary analysis, were used to investigate the association between VI and SNAP participation status.
In all analyses, income and education were found to be colinear, thus income alone was included in the primary model as it is a strong predictor of food insecurity and SNAP participation. However, for completeness, sensitivity analyses were conducted by adjusting for education in addition to the aforementioned covariates. In addition, sensitivity analyses were also conducted excluding marital status and number of children in the household as covariates due to the potential for conflation of these variables with food insecurity. Statistical significance was defined as p < 0.05. All analyses were conducted in Stata/SE 16.1 (StatCorp LLC, College Station, TX, USA).
Of 2,815 community-dwelling NHATS participants, 1,075 individuals (unweighted n, weighted 32%) had any VI. Among these participants, 10% had distance VI, 21% had near VI, and 21% had CSI (non-exclusive groups). There were no individuals classified as blind. Compared to individuals without any VI, individuals with any VI were older (16% vs. 8% age 85–89, 9% vs. 3% age ≥90), had a higher proportion of Non-Hispanic White participants (26% vs. 15%), had lower income levels (30% vs. 14% with <22K), were more likely to be Non-married/Non-partnered (59% vs. 45%), and had more children (23% vs. 15% with ≥1 child) (p < 0.05 for all) (Table 1).
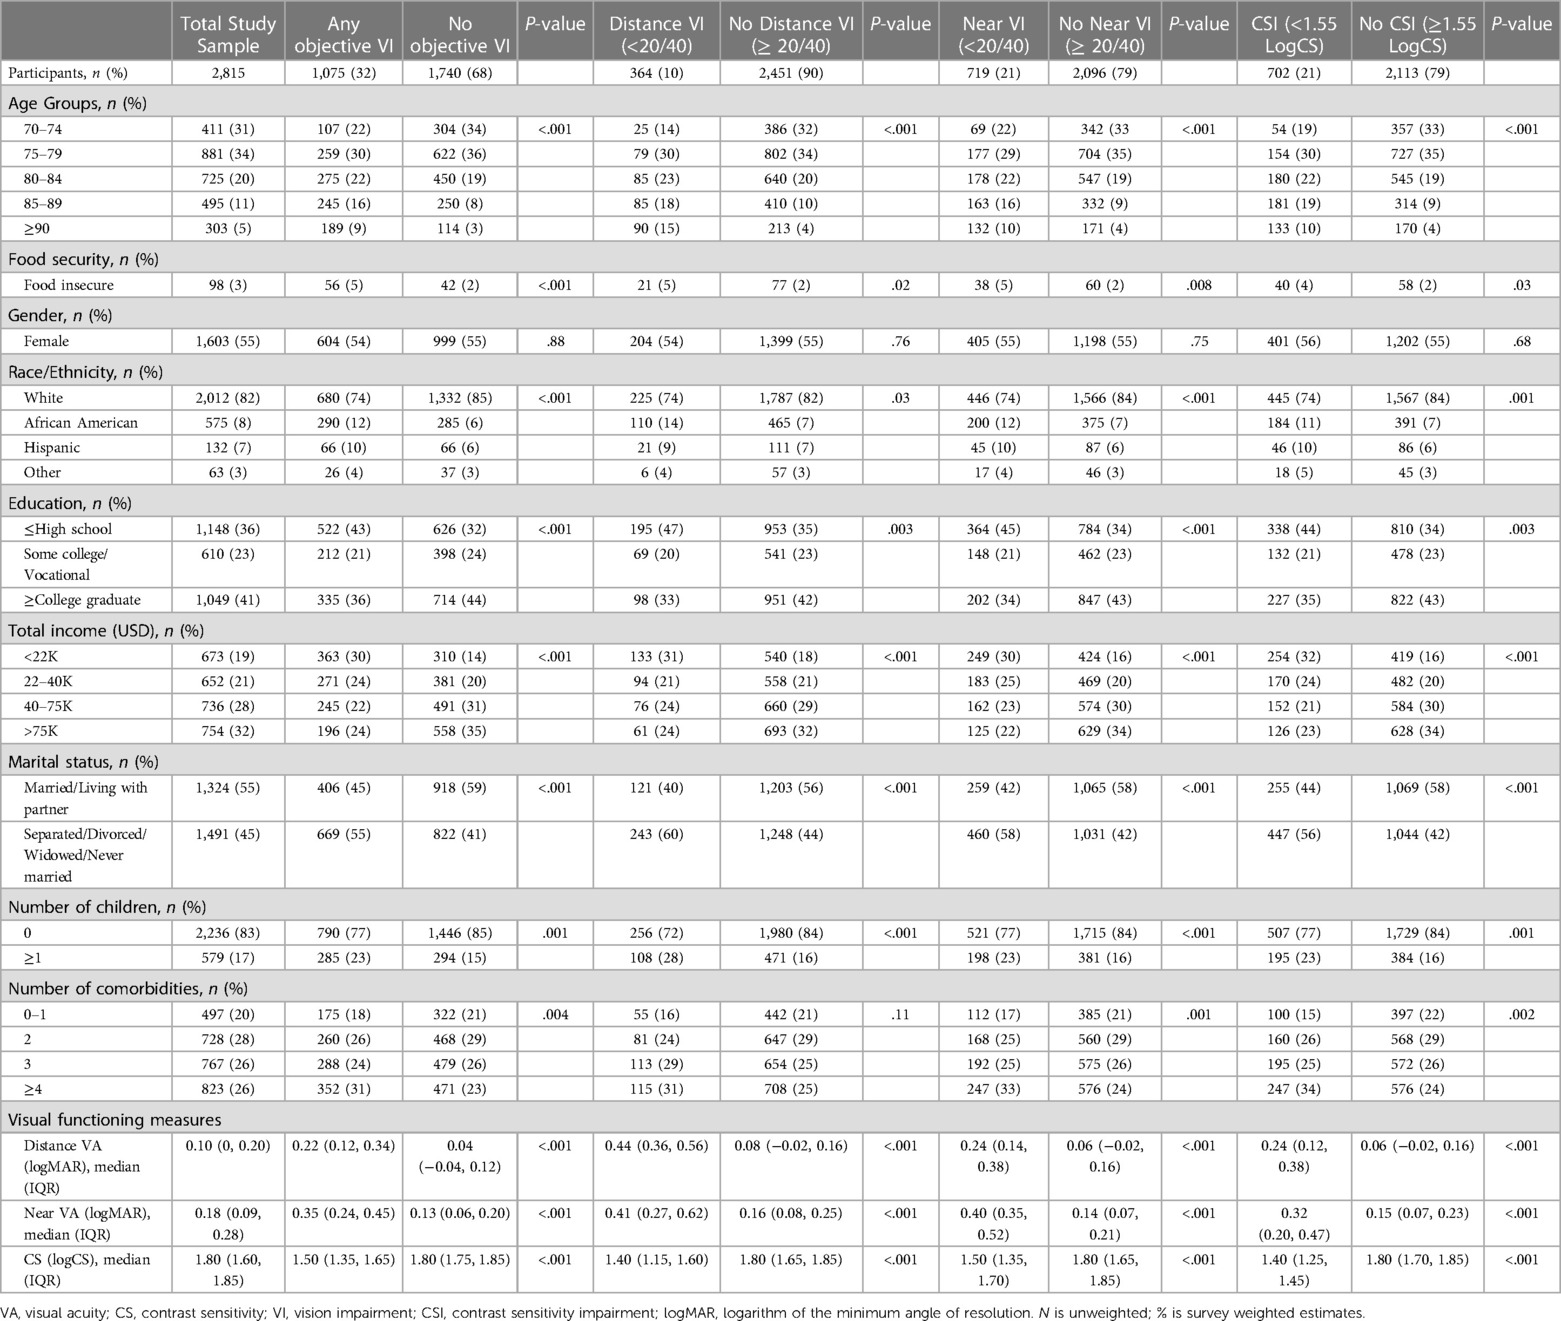
Table 1. Participants’ characteristics by visual impairment status, NHATS 2021.
The overall prevalence of community-dwelling older adults with food insecurity was low (3%, weighted). There was a higher proportion of older adults with food insecurity in every VI group as compared to the respective non-visually impaired groups (any VI vs. no VI: 5% vs. 2%; distance VI vs. no distance VI: 5% vs. 2%; near VI vs. no near VI: 5% vs. 2%, CSI vs. no CSI: 4% vs. 2%; all p < 0.05, Figure 1).
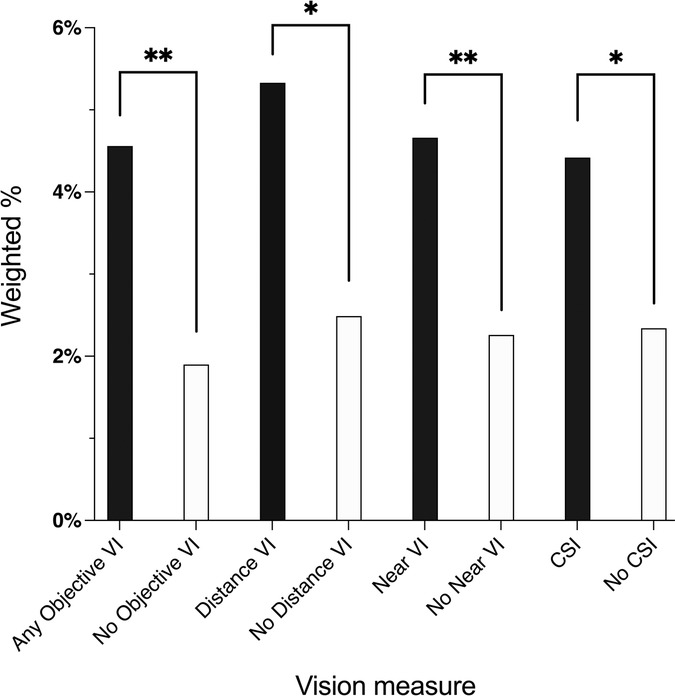
Figure 1. Weighted prevalence of food insecurity by vision impairment: national health and aging trends study, 2021. VI, vision impairment; CSI, contrast sensitivity impairment. *p < 0.05, **p < 0.01.
In multivariable regression analyses, as compared to older adults without any VI, adults with any VI were more likely to have food insecurity (OR = 2.1; 95% CI: 1.2–3.6), Table 2. Older adults with distance VI, near VI, and CSI as measured categorically, trended towards being more likely to have food insecurity than their respective non-visually impaired counterparts, though this was not statistically significant (distance VI vs. no distance VI: OR = 1.8; 95% CI: 0.9–3.8; near VI vs. no near VI: OR = 1.7; 95% CI: 0.9–2.9; CSI vs. no CSI: OR = 1.5; 95% CI: 0.8–2.9).
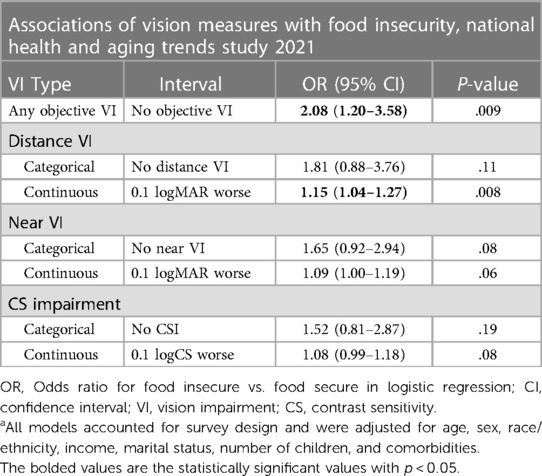
Table 2. Associations of vision impairment with food insecurity status in NHATS 2021a.
Using continuous measures of VA, those with worse distance VA were more likely to have food insecurity (OR = 1.2 for every 0.1 logMAR decrement in distance VA; 95% CI: 1.0–1.43). Similarly, continuous measures of near VA and CS also trended towards higher likelihood of food insecurity with decrements in near VA and CS, though this was not statistically significant (OR = 1.1 for every 0.1 logMAR decrement in near VA; 95% CI: 1.0–1.2), (OR = 1.1 for every 0.1 logCS decrement in CS; 95% CI: 1.0–1.2).
In sensitivity analysis with education included as an additional covariate, the results were similar. Final models shown included income alone for statistical parsimony. Additional sensitivity analysis excluding marital status and number of children as covariates also showed that older adults with any VI had a higher odds of food insecurity (OR = 2.0; 95% CI: 1.2–3.4) than adults without VI. Older adults with worse distance VA measured continuously also had a higher odds of food insecurity (OR = 1.2; 95% CI: 1.1–1.3, per 0.1 logMAR decrement in VA).
There was a higher proportion of older adults who were SNAP participants among those with any VI than adults without any VI (21.4% vs. 15% respectively, p < 0.05), Figure 2. There was no difference in SNAP participation status by distance or near VI status. There was also a higher proportion of SNAP participation in older adults with CSI compared to no CSI (22.9% vs. 16.6% respectively, p < 0.05).

Figure 2. Weighted prevalence of SNAP participation by vision impairment: national health and aging trends study, 2021. VI, vision impairment; CSI, contrast sensitivity impairment. * p < 0.05, ** p < 0.01.
In a secondary multivariable regression analysis, older adults with any VI as compared to adults without any VI trended towards a higher odds of SNAP participation, however this was not statistically significant (OR = 1.5; 95% CI: 1.0–2.2) (Table 3). Categorical and continuous measures of both distance and near VI were not associated with SNAP participation status. Older adults with CSI had a higher-odds of participating in SNAP (OR = 1.6, 95% CI: 1.0–2.4) when measured categorically. On a continuous scale, for every decrement of 0.1 logUnits in CS, there was a trend towards higher-odds of participating in SNAP though not statistically significant (OR = 1.1; 95% CI 1.0–1.2).
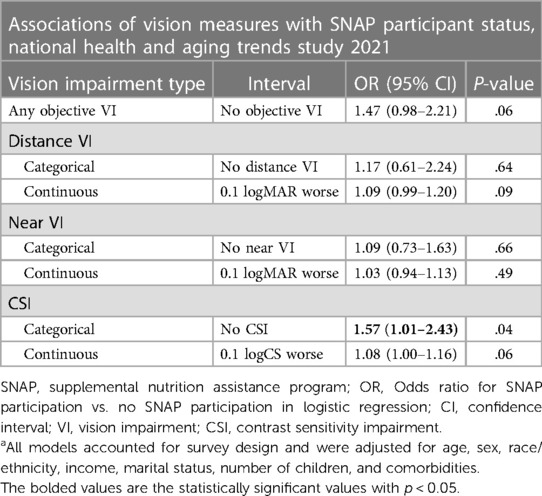
Table 3. Associations of vision impairment with SNAP participant status in NHATS 2021a.
In this cross-sectional, nationally representative survey of community-dwelling older adults with Medicare, participants with VI were more likely to experience food insecurity than their non-visually impaired counterparts. There was no difference in SNAP participation status in older adults with VI compared to adults without. Older adults with any VI (distance VI, near VI, or CSI) had twice the odds of food insecurity compared to adults without objective VI. While individual categorical measures of VI (distance VI, near VI, and CSI) were not significantly associated with food insecurity, distance VI measured continuously was associated with a 1.2-fold higher odds of food insecurity. Overall, these results suggest that older adults with objective VI may be at an increased risk of experiencing food insecurity, and that this relationship may differ based on the type of VI.
While prior studies have demonstrated associations between VI and food insecurity, there has been little data on the relationship between different types of objective VI and food insecurity among older adults. Elucidating these relationships is important as the type of VI may have differing implications for daily function and therefore food access. For example, numerous studies have shown the differential effects of DVI, NVI and CSI on functioning and frailty (a syndrome of aging-related physiological decline characterized by increased vulnerability to stressors and adverse health outcomes) (8, 9, 22, 23). Of these vision measures, some studies have suggested that DVI may potentially have a stronger association with frailty (24). Ultimately, specific types of targeted interventions may be required based on type of VI to improve food insecurity.
Our results are in agreement with a prior study of visually impaired U.S adults ages 50 and older which found that food insecurity was associated with both objective presenting VI and subjective VI in a dose-response manner (11). Kolli et al. also found that associations between food insecurity and VI were magnified in U.S adults 65 and older compared to those less than 65 years of age (11). Compared to our study, Kolli et al. had a much larger sample size and may have been powered to detect smaller differences, but only assessed distance VA and did not account for other measures of VI. Their study also assessed food insecurity differently from our study, as they used the full 10-item U.S. Household Food Security Survey Module. In another cross-sectional study of low-income U.S adults ≥18 years of age, also using the 10-item U.S. Household Food Security Survey Module, adults with subjective VI had a 216% higher odds of being food insecure as compared to adults without VI, but did not include objective vision measures (12).
This study found that the overall prevalence of food insecurity among U.S. older adults was low (3%, weighted). This is lower than estimates obtained in prior studies, with the U.S. Department of Agriculture Economic Research Service reporting 7.1% of older adults as food insecure in 2021 (25). However, our study used a different food insecurity measure, which asks about inability to obtain food rather than difficulty obtaining food (26). Therefore, the measure used in this study may capture the most severe form of food insufficiency and builds on prior findings by showing that those with VI are more likely than their peers to lack sufficient food.
The relationship between VI and food insecurity is complex and multifactorial. Individuals with VI have greater difficulty accessing food due to transportation barriers, lack of accessible grocery stores, difficulty preparing food, and affording nutritious food (27). Overarching disparities in employment, education and income also contribute to the financial strain of affording food as there are competing interests such as affording housing and medical care (28, 29, 30). In addition to VI contributing to food insecurity in older adults, a second bi-directional relationship likely also exists with food insecurity and poor nutrition contributing to the progression and development of various ophthalmic diseases (11, 12). For example, numerous studies have shown that household food insecurity was associated with lack of ophthalmic care, developing diabetic retinopathy (DR) and losing vision to DR (31, 32). More generally, unhealthy diets have been identified as a risk factor for the development of nuclear cataracts and early age-related macular degeneration (33, 34). In order to fully elucidate the complex bi-directional relationship between VI and food insecurity, longitudinal data are needed.
In assessing the association between VI and SNAP participation status, our study found no difference in odds of SNAP participation by VI status, despite older adults being more likely to be food insecure. Although this may be due to a relatively smaller sample size, it may also in part, be due to the challenges faced by individuals with disabilities in enrolling for SNAP. Prior work has shown that the online SNAP enrollment process differs by state and vary in their levels of flexibility, efficiency and accessibility, suggesting that people with disabilities may face barriers in enrollment based on geographic location (35). More specifically, a large proportion of state SNAP websites do not offer mail-in (25%) or telephone (75%) enrollment options, limiting the flexibility of enrollment methods for people with VI in particular (35). In addition, SNAP and various other food assistance programs have eligibility rules for individuals with disability based on receipt of disability benefits which may not incorporate the full spectrum of individuals with VI that are at increased risk of food insecurity (36). SNAP participation is important as it has been shown to effectively decrease food insecurity (37). It is also associated with decreased health care expenditures and improved health outcomes for diabetics (16, 38). Thus, improving SNAP participation rates in older adults with VI will be an important indicator of efforts to alleviate food insecurity in this particularly vulnerable population. In addition to improving accessibility of enrollment for programs such as SNAP, broader efforts focused on universal design are needed to allow individuals with VI equal access to food and food assistance programs. This will incorporate addressing the various barriers individuals with VI may face including transportation, accessibility of grocery stores, and preparing and affording nutritious food.
Strengths of this study include the use of a nationally representative sample, objective measures of VI, and multiple visual function measures including distance and near acuity, and CS. To the best of our knowledge, there are few studies that have examined the association between various measures of objective VI and SNAP participation status among Medicare beneficiaries.
This study has some limitations. First, our analyses were limited by sample size, making it difficult to distinguish whether true differences exist in the associations of different measures of objective VI and food insecurity or whether the analysis was not powered to detect these differences. In addition, a large number of survey respondents were excluded in the analysis due to missing data. Second, this was a cross-sectional analysis, and longitudinal data are needed to further elucidate the temporality and directionality of the association between VI and food insecurity. Third, the NHATS summary indicator used to assess food insecurity is based on survey responses to 5 questions which do not capture hunger or the degree of difficulty obtaining food. While this indicator of food insecurity has been validated in the NHATS population (21), it is shorter than the USDA food insecurity survey module which includes 10 questions and 8 additional questions for households with children and may capture a broader and different dimension of food insecurity. Fourth, while our analyses included number of comorbidities, we did not control for the presence of additional non-vision related disabilities, which may confound the relationship between VI and food insecurity, as well as participation in SNAP by visually impaired individuals.
In conclusion, our study found that VI, as measured by distance or near VA, or CS, was associated with food insecurity, but was not associated with participation in SNAP. Older adults and individuals with disabilities are more likely to experience food insecurity, and this may be further amplified in older adults with VI who experience difficulty with mobility and activities of daily living (39, 40, 41). Further longitudinal studies are needed to understand the likely bi-directional nature of this relationship and to help target solutions to improving food insecurity in older adults with VI.
The original contributions presented in the study are included in the article/Supplementary Materials, further inquiries can be directed to the corresponding author. The NHATS dataset used in our manuscript is a publicly available dataset that is available here: https://nhats.org/researcher/nhats.
ML: Conceptualization, Formal Analysis, Investigation, Methodology, Writing – original draft, Writing – review & editing. LA: Data curation, Formal Analysis, Investigation, Methodology, Writing – review & editing. LS: Conceptualization, Investigation, Methodology, Writing – review & editing. BS: Conceptualization, Investigation, Methodology, Writing – review & editing. JE: Conceptualization, Investigation, Methodology, Writing – review & editing. VV: Conceptualization, Formal Analysis, Funding acquisition, Investigation, Methodology, Resources, Supervision, Writing – review & editing.
The author(s) declare that no financial support was received for the research, authorship, and/or publication of this article.
The authors declare that the research was conducted in the absence of any commercial or financial relationships that could be construed as a potential conflict of interest.
All claims expressed in this article are solely those of the authors and do not necessarily represent those of their affiliated organizations, or those of the publisher, the editors and the reviewers. Any product that may be evaluated in this article, or claim that may be made by its manufacturer, is not guaranteed or endorsed by the publisher.
The Supplementary Material for this article can be found online at: https://www.frontiersin.org/articles/10.3389/fepid.2024.1353083/full#supplementary-material
1. Mather M, Jacobsen LA, Pollard KM. Aging in the United States. Popul Bull. (2015) 70(2):375–90. doi: 10.1016/B978-0-12-373932-2.00293-3
2. Bailey LB, Campbell CC, Cohen BE, Dewey KG, Dietz WH, Dwyer J, et al. Core indicators of nutritional state for difficult-to-sample populations. J Nutr. (1990) 120(11 SUPPL.):1555–98. doi: 10.1093/JN/120.SUPPL_11.1555
3. National Academies of Sciences, E. and M. Social Isolation and Loneliness in Older Adults: Opportunities for the Health Care System. Washington, DC: National Academies Press (US) (2020). doi: 10.17226/25663
4. Heflin CM, Altman CE, Rodriguez LL. Food insecurity and disability in the United States. Disabil Health J. (2019) 12(2):220–6. doi: 10.1016/J.DHJO.2018.09.006
5. Lee JS, Fischer JG, Johnson MA. Food insecurity, food and nutrition programs, and aging: experiences from Georgia. J Nutr Elder. (2010) 29(2):116–49. doi: 10.1080/01639366.2010.480895
6. Burton MJ, Ramke J, Marques AP, Bourne RRA, Congdon N, Jones I, et al. The lancet global health commission on global eye health: vision beyond 2020. Lancet Glob Health. (2021) 9(4):e489–551. doi: 10.1016/S2214-109X(20)30488-5/ATTACHMENT/81825AA4-162A-46FA-9EDD-70C02455686A/MMC3.PDF
7. Swenor BK, Simonsick EM, Ferrucci L, Newman AB, Rubin S, Wilson V. Visual impairment and incident mobility limitations: the health, aging and body composition study. J Am Geriatr Soc. (2015) 63(1):46–54. doi: 10.1111/JGS.13183
8. Swenor BK, Lee MJ, Tian J, Varadaraj V, Bandeen-Roche K. Visual impairment and frailty: examining an understudied relationship. J Gerontol A Biol Sci Med Sci. (2020) 75(3):596–602. doi: 10.1093/gerona/glz182
9. Varadaraj V, Lee MJ, Tian J, Ramulu PY, Bandeen-Roche K, Swenor BK. Near vision impairment and frailty: evidence of an association. Am J Ophthalmol. (2019) 208:234–41. doi: 10.1016/J.AJO.2019.08.009
10. Spencer C, Frick K, Gower EW, Kempen JH, Wolff JL. Disparities in access to medical care for individuals with vision impairment. Ophthalmic Epidemiol. (2009) 16(5):281–8. doi: 10.1080/09286580902999439
11. Kolli A, Mozaffarian R, Kenney EL. Food insecurity and vision impairment among adults age 50 and older in the United States. Am J Ophthalmol. (2022) 236:69–78. doi: 10.1016/j.ajo.2021.10.002
12. Kumar P, Brinson J, Wang J, Samuel L, Swenor BK, Scott AW, et al. Self-reported vision impairment and food insecurity in the US: national health interview survey, 2011–2018. Ophthalmic Epidemiol. (2022) 00(00):1–9. doi: 10.1080/09286586.2022.2129698
13. USDA Food and Nutrition Service. Supplemental Nutrition Assistance Program Participation and Costs. (2023). p. 1–2.
14. Mabli J, Ohls J, Dragoset L, Castner L, Santos B. Measuring the Effect of Supplemental Nutrition Assistance Program (SNAP) Participation on Food Security (2013). p. 1–356. Available online at: https://ageconsearch.umn.edu/record/339046/?v=pdf (Accessed February 15, 2024).
15. Ratcliffe C, McKernan SM, Zhang S. How much does the supplemental nutrition assistance program reduce food insecurity? Am J Agric Econ. (2011) 93(4):1082–98. doi: 10.1093/AJAE/AAR026
16. Berkowitz SA, Seligman HK, Rigdon J, Meigs JB, Basu S. Supplemental nutrition assistance program (SNAP) participation and health care expenditures among low-income adults. JAMA Intern Med. (2017) 177(11):1642–9. doi: 10.1001/jamainternmed.2017.4841
17. Hu M, Freedman VA, Ehrlich JR, Reed NS, Billington C, Kasper JD. Collecting objective measures of visual and auditory function in a national in-home survey of older adults. J Surv Stat Methodol. (2021) 9:309–34. doi: 10.1093/jssam/smaa044
18. Varadaraj V, Assi L, Gajwani P, Wahl M, David J, Swenor BK, Ehrlich JR. Evaluation of tablet-based tests of visual acuity and contrast sensitivity in older adults. Ophthalmic Epidemiol. (2021) 28(4):293–300. doi: 10.1080/09286586.2020.1846758
19. American Academy of Ophthalmology. US Eye Disease Statistics. (2017). Available online at: https://www.aao.org/eye-disease-statistics (Accessed March 1, 2024).
20. Hu M, Erlich JR, Reed NS, Freedman VA. National Health and Aging Trends Study (NHATS) Vision and Hearing Acitivites User Guide. 2. European University Institute (2022). p. 1–31. Available online at: https://eur-lex.europa.eu/legal-content/PT/TXT/PDF/?uri=CELEX:32016R0679&from=PT%0A, http://eur-lex.europa.eu/LexUriServ/LexUriServ.do?uri=CELEX:52012PC0011:pt:NOT
21. Tucher EL, Keeney T, Cohen AJ, Thomas KS. Conceptualizing food insecurity among older adults: development of a summary indicator in the national health and aging trends study. J Gerontol B Psychol Sci Soc Sci. (2021) 76(10):2063–72. doi: 10.1093/geronb/gbaa147
22. Haymes SA, Johnston AW, Heyes AD. Relationship between vision impairment and ability to perform activities of daily living. Ophthalmic Physiol Opt. (2022) 22(2):79–91. doi: 10.1046/j.1475-1313.2002.00016.x
23. Owsley C, Sloane ME. Contrast sensitivity, acuity, and the perception of “real-world” targets. Br J Ophthalmol. (1987) 71:791–6. doi: 10.1136/bjo.71.10.791
24. Sonnenfeld ML, Pappadis MR, Reistetter TA, Raji MA, Ottenbacher K, Al Snih S, et al. Vision impairment and frailty among Mexican American older adults: a longitudinal study. J Appl Gerontol. (2024):1–10. doi: 10.1177/07334648241231374
25. Coleman-Jensen A, Rabbitt MP, Gregory CA, Singh A. Household Food Security in the United States in 2021. (n.d.). Available online at: www.ers.usda.gov (retrieved May 14, 2023)
26. Bickel GW, United States, Food and Nutrition Service, Office of Analysis, Nutrition, and E. (2000). US Adult Food Security Survey Module. USDA Publications.
28. Besagar S, Yonekawa Y, Sridhar J, Finn A, Padovani-Claudio DA, Sternberg P, et al. Association of socioeconomic, demographic, and health care access disparities with severe visual impairment in the US. JAMA Ophthalmol. (2022) 140(12):1219–26. doi: 10.1001/JAMAOphthalmol.2022.4566
29. Lansingh V, Carter M, Ulldemolins A, Valencia L, Eckert K. Social inequalities in blindness and visual impairment: a review of social determinants. Indian J Ophthalmol. (2012) 60(5):368. doi: 10.4103/0301-4738.100529
30. Mcdonnall MC, Tatch A. Educational attainment and employment for individuals with visual impairments. J Visual Impair Blin. (2021) 115(2):152–9. doi: 10.1177/0145482X211000963
31. Gibson DM. Food insecurity, eye care receipt, and diabetic retinopathy among US adults with diabetes: implications for primary care. J Gen Intern Med. (2019) 34(9):1700–2. doi: 10.1007/s11606-019-04992-x
32. Mosley-Johnson E, Walker RJ, Nagavally S, Hawks L, Bhandari S, Trasser H, et al. Relationship between food insecurity and housing instability on quality of care and quality of life in adults with diabetes. PLoS One. (2022) 17(12):1–12. doi: 10.1371/journal.pone.0278650
33. Mares JA, Voland R, Adler R, Tinker L, Millen AE, Moeller SM, et al. Healthy diets and the subsequent prevalence of nuclear cataract in women. Arch Ophthalmol. (2010) 128(6):738–49. doi: 10.1001/ARCHOPHTHALMOL.2010.84
34. Mares JA, Voland RP, Sondel SA, Millen AE, LaRowe T, Moeller SM, et al. Healthy lifestyles related to subsequent prevalence of age-related macular degeneration. Arch Ophthalmol. (2011) 129(4):470–80. doi: 10.1001/ARCHOPHTHALMOL.2010.314
35. Samuel LJ, Xiao E, Cerilli C, Sweeney F, Campanile J, Milki N, et al. The development of the supplemental nutrition assistance program enrollment accessibility (SNAP-access) score. Disabil Health J. (2022) 15(4):101366. doi: 10.1016/J.DHJO.2022.101366
36. Samuel LJ, Zhu J, Dwivedi P, Stuart EA, Szanton SL, Li Q, et al. Food insecurity gaps in the supplemental nutrition assistance program based on disability status. Disabil Health J. (2023) 16(4):101486. doi: 10.1016/J.DHJO.2023.101486
37. Mabli J, Ohls J. Supplemental nutrition assistance program participation is associated with an increase in household food security in a national evaluation. J Nutr. (2015) 145(2):344–51. doi: 10.3945/JN.114.198697
38. Mayer VL, McDonough K, Seligman H, Mitra N, Long JA. Food insecurity, coping strategies and glucose control in low-income patients with diabetes. Public Health Nutr. (2016) 19(6):1103–11. doi: 10.1017/S1368980015002323
39. Lam BL, Christ SL, Zheng DD, West SK, Munoz BE, Swenor BK, et al. Longitudinal relationships among visual acuity and tasks of everyday life: the Salisbury eye evaluation study. Invest Ophthalmol Vis Sci. (2013) 54(1):193. doi: 10.1167/iovs.12-10542
40. Swenor BK, Muñoz B, West SK. Does visual impairment affect mobility over time? The Salisbury eye evaluation study. Invest Ophthalmol Visual Sci. (2013) 54(12):7683–90. doi: 10.1167/IOVS.13-12869
Keywords: vision impairment, food insecurity, aging, epidemiology, older adults
Citation: Lee MJ, Almidani L, Samuel L, Swenor BK, Ehrlich JR and Varadaraj V (2024) Vision impairment and food insecurity in the national health and aging trends study. Front. Epidemiol. 4:1353083. doi: 10.3389/fepid.2024.1353083
Received: 9 December 2023; Accepted: 15 April 2024;
Published: 1 May 2024.
Edited by:
Tobias Kurth, Charité University Medicine Berlin, GermanyReviewed by:
Renata Gomes, Northumbria University, United Kingdom© 2024 Lee, Almidani, Samuel, Swenor, Ehrlich and Varadaraj. This is an open-access article distributed under the terms of the Creative Commons Attribution License (CC BY). The use, distribution or reproduction in other forums is permitted, provided the original author(s) and the copyright owner(s) are credited and that the original publication in this journal is cited, in accordance with accepted academic practice. No use, distribution or reproduction is permitted which does not comply with these terms.
*Correspondence: Varshini Varadaraj dnZhcmFkYTJAamh1LmVkdQ==
†These authors have contributed equally to this work and share first authorship
Disclaimer: All claims expressed in this article are solely those of the authors and do not necessarily represent those of their affiliated organizations, or those of the publisher, the editors and the reviewers. Any product that may be evaluated in this article or claim that may be made by its manufacturer is not guaranteed or endorsed by the publisher.
Research integrity at Frontiers
Learn more about the work of our research integrity team to safeguard the quality of each article we publish.