 Christopher C. Stanley1,2*
 Mavuto Mukaka3,4
 Lawrence N. Kazembe5Andrea G. Buchwald6Don P. Mathanga2
 Miriam K. Laufer6
 Tobias F. Chirwa1
- 1Faculty of Health Sciences, School of Public Health, University of the Witwatersrand, Johannesburg, South Africa
- 2Malaria Alert Center, Kamuzu University of Health Sciences, Blantyre, Malawi
- 3Oxford Centre for Tropical Medicine and Global Health, Oxford, United Kingdom
- 4Mahidol-Oxford Tropical Medicine Research Unit, Bangkok, Thailand
- 5Department of Statistics, University of Namibia, Windhoek, Namibia
- 6Center for Vaccine Development and Global Health, University of Maryland School of Medicine, Baltimore, MD, United States
Background: Recurrent clinical malaria episodes due to Plasmodium falciparum parasite infection are common in endemic regions. With each infection, acquired immunity develops, making subsequent disease episodes less likely. To capture the effect of acquired immunity to malaria, it may be necessary to model recurrent clinical disease episodes jointly with P. falciparum parasitemia data. A joint model of longitudinal parasitemia and time-to-first clinical malaria episode (single-event joint model) may be inaccurate because acquired immunity is lost when subsequent episodes are excluded. This study's informativeness assessed whether joint modeling of recurrent clinical malaria episodes and parasitemia is more accurate than a single-event joint model where the subsequent episodes are ignored.
Methods: The single event joint model comprised Cox Proportional Hazards (PH) sub-model for time-to-first clinical malaria episode and Negative Binomial (NB) mixed-effects sub-model for the longitudinal parasitemia. The recurrent events joint model extends the survival sub-model to a Gamma shared frailty model to include all recurrent clinical episodes. The models were applied to cohort data from Malawi. Simulations were also conducted to assess the performance of the model under different conditions.
Results: The recurrent events joint model, which yielded higher hazard ratios of clinical malaria, was more precise and in most cases produced smaller standard errors than the single-event joint model; hazard ratio (HR) = 1.42, [95% confidence interval [CI]: 1.22, 2.03] vs. HR = 1.29, [95% CI:1.60, 2.45] among participants who reported not to use LLINs every night compared to those who used the nets every night; HR = 0.96, [ 95% CI: 0.94, 0.98] vs. HR = 0.81, [95% CI: 0.75, 0.88] for each 1-year increase in participants' age; and HR = 1.36, [95% CI: 1.05, 1.75] vs. HR = 1.10, [95% CI: 0.83, 4.11] for observations during the rainy season compared to the dry season.
Conclusion: The recurrent events joint model in this study provides a way of estimating the risk of recurrent clinical malaria in a cohort where the effect of immunity on malaria disease acquired due to P. falciparum parasitemia with aging is captured. The simulation study has shown that if correctly specified, the recurrent events joint model can give risk estimates with low bias.
Introduction
Joint modeling of longitudinal and time-to-event data has recently received increased attention in biomedical research (1–3). Typically, a joint model consists of two parts: a model for time-to-event process; and a model for the longitudinal process. The joint modeling approach is gaining popularity (1–4), partly because it offers the advantage of capturing important relationships between longitudinal outcomes and time-to-event processes that are otherwise lost by separate longitudinal and survival analyses (1, 5). However, joint models that can handle recurrent events are limited. Recent methodological and software developments in joint modeling have been extensively reviewed elsewhere (1–3, 6–8). Applications in the reviewed studies of joint modeling have typically focused on time-to-single event only. For example, studies have frequently modeled longitudinal CD4 count jointly with time-to-HIV–related outcomes in order to understand the relationships between the longitudinal history of CD4 and its effect on the risk of development of AIDS (1, 9–11). Among patients with cancer, repeated measurements of quality of life performance scores have been jointly modeled with time-to-death or disease progression (12–15). However, for diseases that may have multiple episodes such as clinical malaria, chronic heart failure, epileptic seizures, or asthma attacks, modeling that focuses on time-to-first event only while ignoring subsequent events may not be efficient since such approaches fail to utilize all information available in the data (6, 16, 17). In malaria, single-event models do not capture the role of acquired immunity, which develops with repeated Plasmodium falciparum infections over time, to future disease episodes (18). The WHO Malaria Vaccine Advisory Committee (MALVAC) has recently recommended analyzing recurrent event times to evaluate malaria vaccines (19).
In P. falciparum malaria studies, modeling of time-to-single malaria episode may not be accurate especially in malaria-endemic regions because recurrent clinical disease is frequently observed. Instead, modeling the risk of disease including all the recurrent events during follow up may provide improved accuracy. Repeated infection is common and with each infection, acquired immunity develops making subsequent disease and infection episodes less likely (20, 21). Therefore, modeling recurrent clinical disease episodes jointly with the longitudinal measurements of P. falciparum parasitemia data may be critical to capturing the effect of the developing immunity to malaria.
The joint model of recurrent events and a longitudinal outcome typically consists of a recurrent events model and a mixed-effects model linked through either latent variables (22, 23) or shared random effects (17, 24). The most common approach used to model the recurrent events process is the shared frailty model introduced by Clayton (25, 26), which usually takes the Gamma distribution. For the longitudinal process, studies have frequently focused on continuous (Gaussian) outcomes and often applied linear mixed-effects models (5, 17, 27). However, the use of linear mixed-effects models for longitudinal outcomes is not appropriate for outcomes with Poisson or NB distributions. Joint modeling of recurrent events and a non-Gaussian longitudinal outcome such as the P. falciparum parasitemia remains a challenge.
In this study, a joint model is proposed which comprised a shared frailty model for recurrent malaria episodes and an NB mixed-effects model for repeated measurements of P. falciparum parasitemia. The proposed approach was motivated by data from a prospective malaria cohort in Malawi, which has been described previously (28–31). Malaria is endemic in Malawi (32) and transmission of the P. falciparum parasite is high in the area of the study (33, 34). We used data from a clinical study to investigate whether jointly modeling time-to-recurrent clinical malaria episodes with longitudinal parasitemia may yield more accurate risk factor estimates compared to a single-event joint model (for time-to-first clinical malaria episode and NB mixed-effects sub-model for the longitudinal parasitemia) where the subsequent episodes are ignored. Here, aging of participants was considered as a proxy for increasing levels of acquired immunity. The recurrent events joint model is also tested for the prediction of a new clinical malaria episode given the history of recurrent events and P. falciparum parasitemia trajectory. Finally, simulations were conducted to study the performance of the joint model under different conditions.
Materials and Methods
Data Source
The joint models were applied to data from the prospective cohort study conducted in a rural area of southern Malawi. The cohort enrolled 120 participants who presented with uncomplicated malaria at a rural health center between June 2014 and March 2015. The study design was described previously (29). Study participants were actively followed monthly and on interim malaria sick visits for up to 2 years post enrolment.
Outcomes
The primary outcomes of the study were recurrent clinical disease defined as participants' self-reported fever and with a positive rapid diagnostic test (RDT) result; and density of P. falciparum infection: parasitemia was measured as the number of parasites per microliter (μl) of blood. Parasitemia measurements were obtained from thick blood smears.
Covariates
The models included participants' age as continuous, gender, the season of the previous visit categorized as dry (May–November) or rainy (December–April), and use of long-lasting insecticide-treated bed net (LLIN) in the previous month before the visit dichotomized as whether one reported using the LLINs every night or not.
Data Structure
A sample of the data structure showing three hypothetical participants for the analysis of time-to-recurrent clinical malaria episodes is provided in Supplementary Table 1. The time of origin for the analysis of the recurrent episodes was the day of study enrolment. A clinical disease episode was considered new if it occurred >14 days after the previous episode based on the pharmacokinetics of artemether–lumefantrine treatment in the study (35).
Notation and Specification of Models
The Longitudinal Sub-model
In the longitudinal setting, let Yij denote the longitudinal response of P. falciparum parasitemia for subject i = 1, …, n at time j where j = 1, …, Ji. The measurements can be summarized as:
where μi is the mean response of parasitemia, ψi are subject-specific random effects accounting for within-subject correlation in each model part, and ϵij represent error terms and are assumed to be normally distributed, that is, where σ2 is variance and Ini is the ni× ni identity matrix. Postulating a model formulation proposed by Henderson et al. (5), assuming that μi can be described by a linear mixed-effects (LMEM) sub-model with a Gaussian distribution:
where β is the p × 1 fixed-effect parameter vector for the fixed-effect covariate vector Xi, b is the q × 1 vector of random effects for random-effect covariate vector Z for participant i, assumed to be multivariate normal with mean zero, that is, , and the variance of the subject-specific effects.
Taking NB distribution for the parasitemia, then
where μi is the mean and ϑ is the shape parameter that accounts for over-dispersion. Parasitemia count data were tested for over-dispersion and considered the Negative Binomial (NB) model.
The NB mixed-effects model links the mean of response to the set of covariates through the logarithm function expressed as:
where log(Mi) is the offset correcting for variation in the number of parasitemia measurements for subject i.
The NB distribution can be viewed as a Gamma mixture of Poisson distribution where the parasitemia response yi with mean μi follows Poisson and subject-specific random effects error term ψi following the Gamma distribution. When the over-dispersion parameter is high, the NB model converges to a Poisson model and cannot deal with the over-dispersion (36), and is prone to non-convergence problems.
The Intensity Recurrent Event Sub-model
The recurrent event model extends the single event semi-parametric proportional hazards model by introducing an unobservable (frailty) random term on which the hazard function depends to account for within-participant dependence of events (37), that is, recurrent clinical malaria episodes. The single-event semi-parametric proportional hazards model can be expressed in terms of the hazard function λi(t) for participant i as
where λ0(t) is the unspecified baseline hazard function and Xi is the covariate vector for participant i. For ordinary Cox PH regression, the baseline hazard is usually left unspecified and can offer valid statistical inference using partial likelihood. However, in the context of joint modeling, a completely unspecified baseline hazard will generally lead to underestimation of the standard errors of the model parameters (8, 38). For recurrent clinical malaria episodes, an intensity event model function is adopted as opposed to a rate function because, while the rate function only defines the occurrence of recurrent events unconditional on the event history, the intensity function conditions the occurrence of events on the event history (39). In the case of recurrent malaria, the event history is particularly critical because each P. falciparum infection alters the host immune response against the threat of subsequent infections and disease episodes (20, 21). Thus, the intensity recurrent event model would account for the participants' strengthening immunity to clinical episodes due to accumulating event occurrences over time, which is critical in recurrent event analysis (23). The intensity recurrent event model at time t is given by the multiplicative intensity model following the structure proposed by Henderson et al. (5) as follows:
where Gi is assumed to follow Bernoulli distribution denoting whether the participant i is in the risk period of experiencing the malaria episode. As with the single event survival model in Equation (5), the baseline hazard (intensity) function λ0(t) is assumed to follow Weibull distribution. In the current cohort data, the vectors β and Xi contain different sets of elements from α and Zi, respectively, in Equation (2). The term γi represents the unobservable random effects (frailty) term to account for dependence between within-participant episodes and is assumed to follow a Gamma distribution with unit mean and variance θ, i.e., γi ~ Γ(1, θ). The frailty variance θ, reflects the amount of the within-participant dependence of clinical episode times, that is, the correlation of the recurrent events is quantified by θ, with higher values corresponding to greater within-participant correlation. When the variance is small, the values of the frailty are around one, implying no frailty effects and so recurrent events are independent.
For the counting process of the recurrent clinical episodes, let be the number of recurrent events for subject i occurring before or at time t over an interval [0, τ], where recurrent episodes could potentially be observed beyond the prespecified maximum time point τ. Then the counting process may be stopped by the time of loss to follow-up or end of the study denoted by Ci, with the failure indicator i taking value 1 if Ti < Ci and 0 otherwise. The observed counting process, has a known zero-one process {Gi(u): 0 ≤ u ≤ τ} indicating whether the participant i is at risk of experiencing an episode during period u. Thus, the counting process has a jump of size one (R, R + 1, …) when an event occurs, that is, the episode of clinical malaria is experienced.
Likelihood of the Joint Model
Using generic terms Y to denote combined observed measurements of parasitemia data, R for combined recurrent episodes data, X for covariate information, and Φ = {ψ, γ} for the random and frailty processes, the joint distribution for the longitudinal measurements Y and recurrent event processes R are conditionally independent given X, ψ, and γ. The dependence between Y and R may arise from the direct link between ψ and γ, called latent association, without which nothing can be gained through a joint analysis. Our interest is to model the subjects' recurrent processes of episodes together with their longitudinal measurements of parasitemia, through the association of ψ and γ. Following the framework proposed by Henderson et al. (5), one can proceed to compute the likelihood of the joint model as a product of the marginal distribution of observed parasitemia measurements Y and the conditional distribution of the events (malaria episodes) R. For each participant i, the observed data are {(ti, Xi, ui, Δi, τi), i = 1, 2, …, n}. Computing the full joint likelihood L = L(π, Y, R) where π = (β, σ, θ, λ0, α, Φ) is a vector denoting a collection of all unknown parameters with λ0 = {λ0 (ti), i = 1, 2, …, n}, one can proceed as follows:
here LY(π, Y) is the standard form of the marginal distribution of Y for the parasitemia measurements process. The conditional likelihood of the recurrent episodes data, LR|γ(π, R|γ) captures the likelihood contribution of the longitudinal measurements up to any time of the event. Suppose we denote as cumulative baseline intensity for the recurrent event process, then LR|γ(π, R|γ) can be expressed as
The Gamma distribution of the frailty γ with mean restricted to 1 and variance θ, that is, γ ~ Γ(1, θ), can be expressed as , γiϵ{0, ∞} which reduces to .
Parameter Estimation
Estimates of the parameters are obtained by maximizing the joint likelihood for the parasitemia process and the recurrent episode times process using the EM algorithm. Estimating the parameters by maximizing the likelihood of the observed data involves integrating over the random and frailty terms, γ. Since the joint likelihood contains an analytically intractable integral, numerical methods of integration such as Bayesian approaches or quadrature approximation techniques are required for evaluation; we used the Gauss–Hermite quadrature method. Furthermore, a unit mean for the frailty term was assumed to make the parameters in the distribution and the baseline distribution λ0 identifiable.
The proposed joint modeling approach was applied to malaria cohort data from Malawi, as described above. Simulations were conducted to study how the joint model can perform under different conditions. The models were fitted with a shared Gamma frailty model for the recurrent events and a mixed-effects model taking competing distributions for the longitudinal process: Gaussian and NB. Model fit was compared based on the Akaike information criterion (AIC). The model with the lowest value of AIC was selected as the best-fitting model. Data were simulated to resemble the Mfera cohort. Age in years was assumed to be normally distributed (mean: 2, Standard Deviation [SD]: 0.8) on the log-scale. To maintain the skewness of age that would reflect real data, the simulated log-normally distributed values were transformed back to original scales by taking an exponential function. The covariates' gender, season, and LLIN usage were assumed to be binomially distributed. Based on exploratory analyses of the Mfera cohort, the assumed log of hazard values were −0.04 for age, 0.02 for gender, 0.3 for season, and 0.3 for LLIN usage. The baseline hazard function was assumed to follow a Weibull distribution with shape parameter lambda = 1 and scale parameter = 2. Follow-up time to event or censoring followed a uniform distribution. After each clinical malaria episode, a subject was assumed to be malaria-risk-free for 14 days, based on the pharmacokinetics of artemether–lumefantrine therapy. Parasitemia data measurements were simulated from a mixed-effects model with the function of follow-up time. The model bias was assessed under different scenarios that include study sample sizes of 100, 200, and 400 (representing small, medium, and large sample sizes); level of censoring 10, 20, and 50%; length of follow-up period of 1, 2, and 4 years; Gamma distributed frailty term with variances 0.2 for low dependence of within-participant episodes, 1.5 for moderate and 2.5 for highly dependent episodes; and correlation level between longitudinal and recurrent processes 0.01 for a weak association, 0.5 moderate, and 0.8 strong association. We hypothesized that the performance of the model would improve with increased study sample size, longer follow-up time, and strong association between the two processes, but that the performance would worsen with an increasing level of censoring. Simulations were conducted in R version 3.4.3 using package simrec (40). Data analysis was done in Stata SE version 15.1 (Stata Corp., College Station, TX, United States) using gsem and user-written program merlin (41).
Results
Malaria Cohort Study
There were 120 participants in the cohort, of whom 69 (57.5%) were females. The overall median age was 7.5 years [inter-quartile range (IQR): 4.7–18.1]. The median number of malarial parasites per microliter was 11,060 (IQR: 840–54,000) overall, 24,840 (IQR: 1,600–68,600) in males, and 5,640 (IQR: 520–540,000) for females (Supplementary Table 2). The current analyses included data for 115 participants who had at least one follow-up visit post enrolment. Participants had a median of 37 visits (IQR: 29–45). There were 397 asymptomatic and 390 symptomatic cases in the cohort. Among these 115 participants, 372 recurrent clinical malaria episodes were experienced over the 2-year follow-up period, with a median of 3 episodes per person (IQR: 1–5). Overall, there was a decreasing rate of monthly recurrent clinical malaria episodes per participant over follow-up (Figure 1). Overall, the median level of parasitemia in the cohort was 24,400 parasites per microlitre (μl) (interquartile range [IQR]: 1,240–76,700/μl) during the follow-up period.
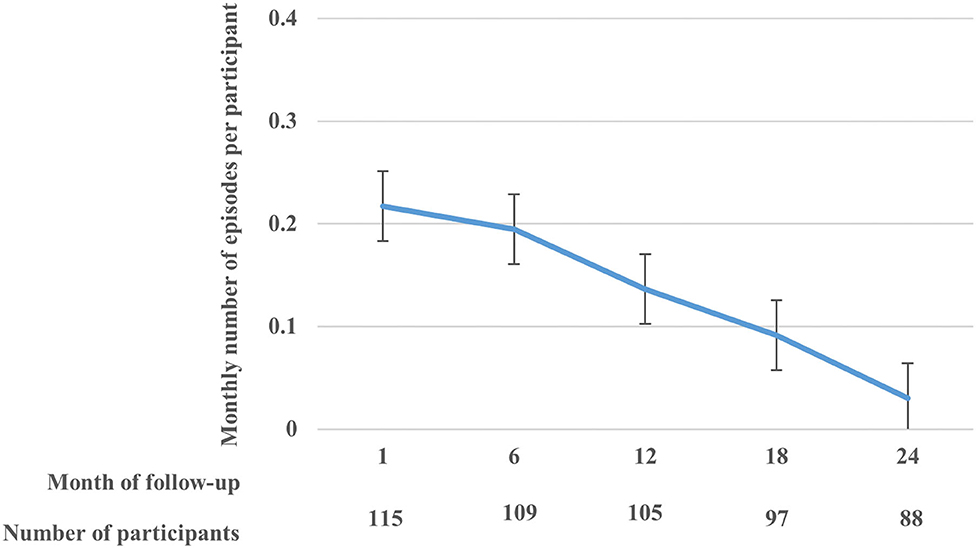
Figure 1. The rate (with standard error bars) of monthly clinical malaria episodes per participant over the follow-up period.
Hazard ratios for recurrent clinical malaria episodes obtained from the joint model of clinical malaria episodes and parasitemia are summarized in Table 1. The hazard of recurrent clinical malaria decreased with increasing participants' age HR = 0.96 [95% CI: 0.94, 0.98], for 1-year increase in age. The hazard of recurrent clinical malaria was higher among participants who reported not to use LLINs every night compared to those who reported using nets every night HR = 1.42, [95% CI: 1.22, 2.03]. Compared to observations in the dry season, the hazard of recurrent clinical malaria episodes was higher during the rainy season HR = 1.36, [95% CI: 1.05, 1.75]. The recurrent event joint model (left panel) yielded higher hazard ratio estimates of clinical malaria, which were more precise and in most cases with smaller standard errors, except for age compared to results from the single-event joint model (right panel).
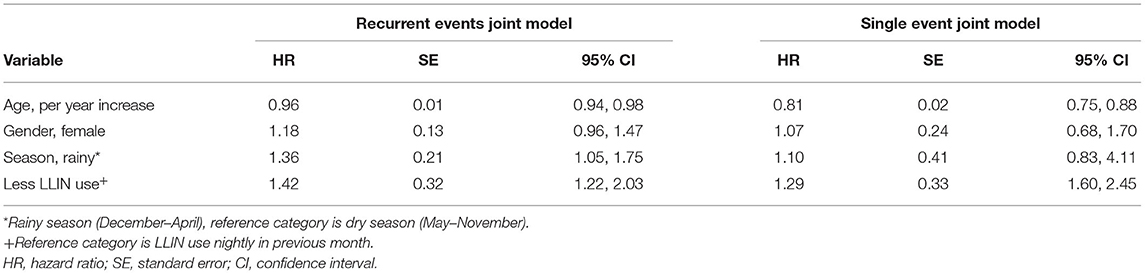
Table 1. Hazard ratio (HR) estimates of clinical malaria among participants of Mfera cohort comparing recurrent events joint model vs. single-event joint model.
The predicted conditional cumulative and marginal non-proportional hazards using the recurrent events joint model are shown in Figure 2. The expected number of clinical malaria episodes in the cohort increased sharply at the beginning of the follow-up period but later slowed down beyond 1 year. This shows that there were fewer clinical malaria episodes in subsequent periods over time.
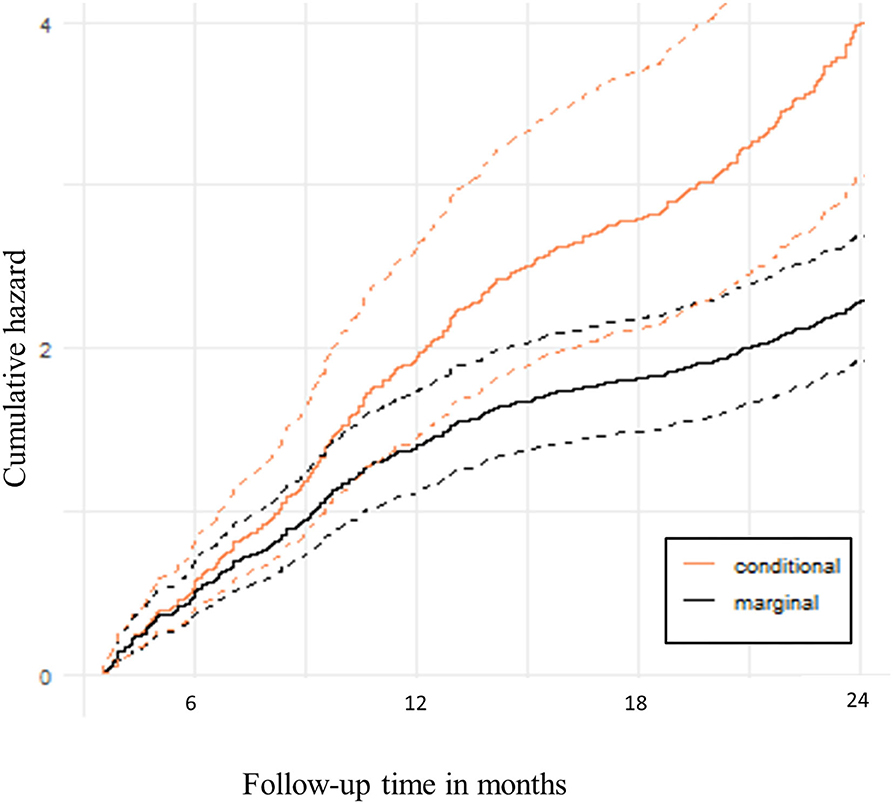
Figure 2. Predicted hazard of recurrent clinical malaria. The solid lines are cumulative hazards that represent the expected number of clinical malaria episodes over follow-up time. The dotted lines are the upper and lower bounds of the 95% Confidence bands.
Simulation Study
Because the results from the recurrent events joint model presented in this study are based on data from a cohort of 115 participants with 2 years of follow-up, we further explored the performance of the recurrent events joint model under varying sample sizes, length of follow-up time, and strength of association between recurrent events and longitudinal processes through simulations. Based on AIC, the joint models with mixed-effects sub-model of an NB distribution for the parasitemia fitted the data better than the linear mixed-effects model assuming a Gaussian response. For example, we considered a scenario assuming a cohort with a sample size of 200 participants, followed up for 2 years with 10% censoring level, 0.05 correlation level between longitudinal and recurrent processes of 0.05, and frailty term variance for the dependence of within-participant clinical episodes being 0.2. A shared Gamma frailty sub-model with Weibull baseline hazard function is assumed for the recurrent process of clinical malaria episodes. Under this scenario, the joint model with the NB distribution for the parasitemia process yielded a lower AIC value (48,066) compared to that from the Gaussian distribution (549,445). For this reason, subsequent analyses adopted a mixed-effects sub-model with a NB distribution for the parasitemia process.
Tables 2A,B shows log hazard ratio estimates of recurrent clinical malaria for simulated data from the recurrent events joint model obtained by comparing the results under different scenarios. The variables considered included study sample size, length of follow-up time in years, level of censoring, level of correlation between longitudinal and recurrent processes, and frailty term variance for the dependence of within-participant clinical malaria episodes. The joint model consists of a shared Gamma frailty sub-model with Weibull baseline hazard function for the recurrent clinical malaria episodes and a negative binomial mixed-effects sub-model for the parasitemia.
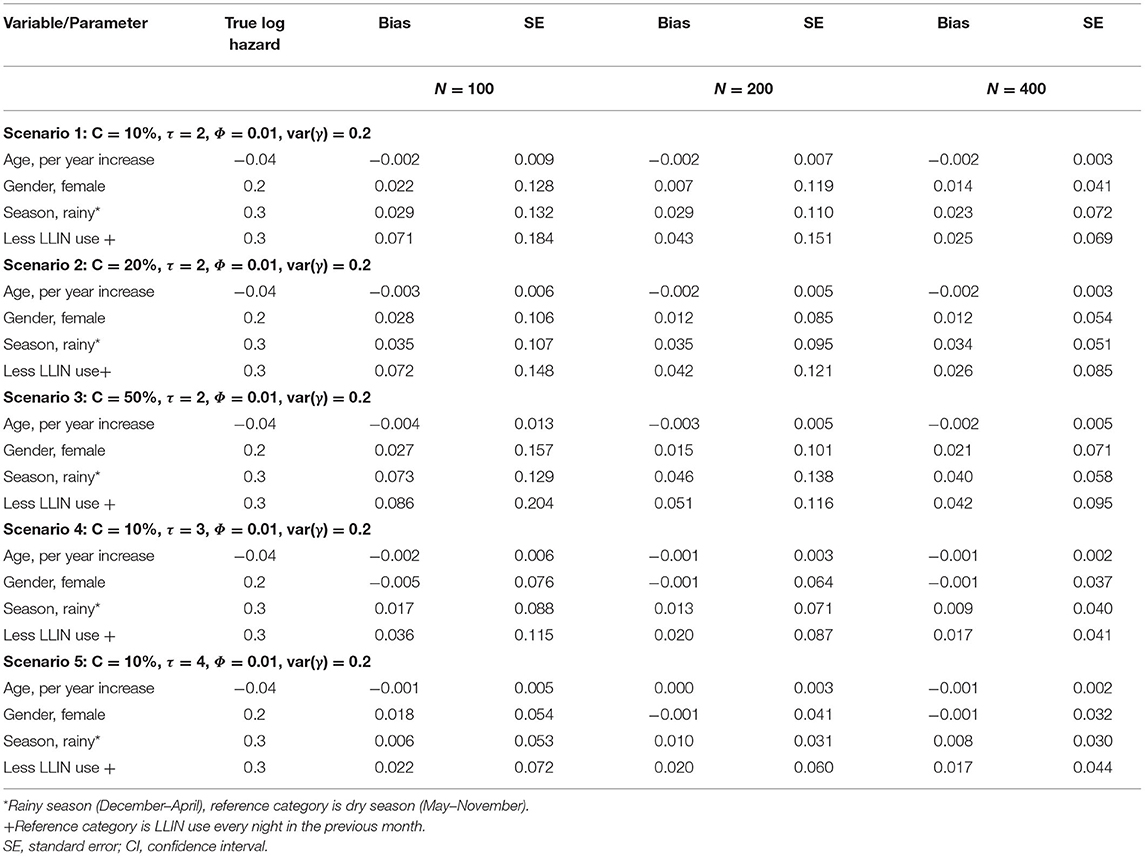
Table 2A. Log hazard ratio estimates of recurrent clinical malaria for simulated data under different scenarios for a sample size of study participants; follow-up time in years (τ); censoring level (C); recurrent processes (Φ); frailty term (γ).
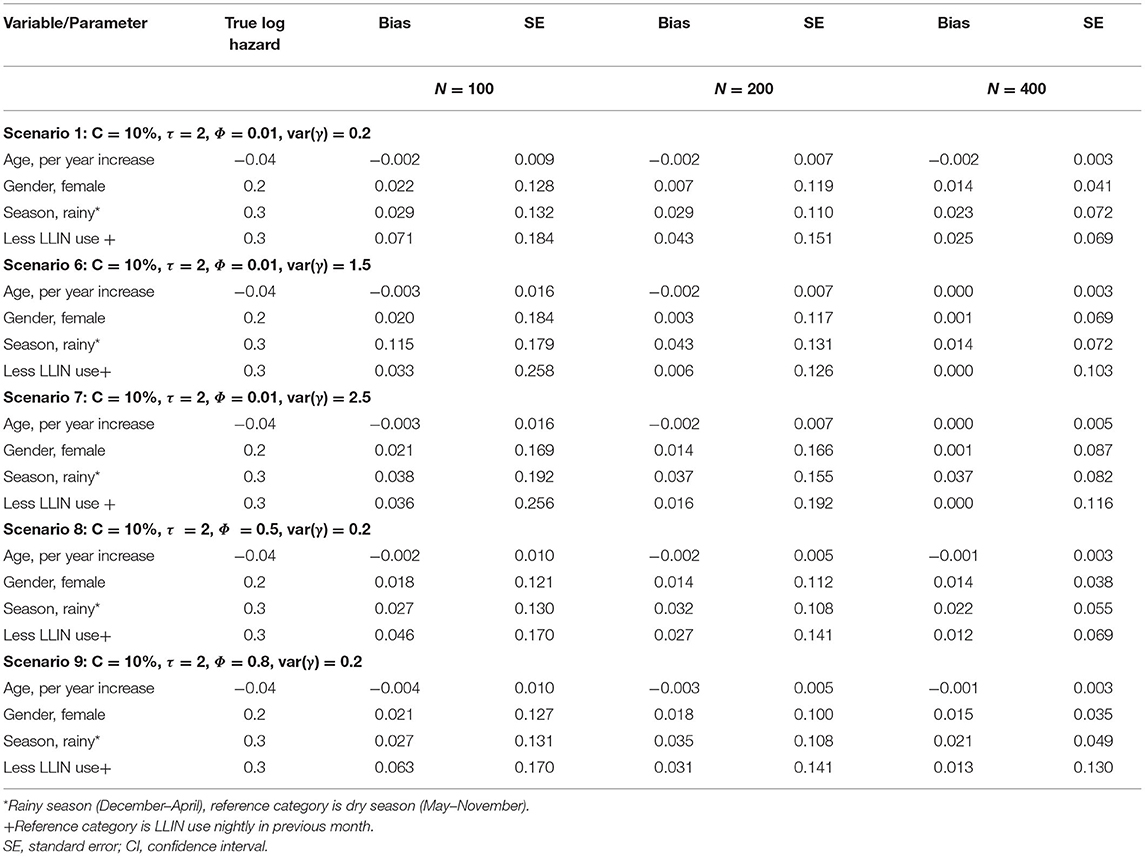
Table 2B. Log hazard ratio estimates of recurrent clinical malaria for simulated data under different scenarios for a sample size of study participants; correlation level between longitudinal and recurrent processes (Φ); frailty term (γ) for fixed censoring level (C).
The performance of the recurrent events joint model improved with increased study sample size overall as evident from the decreased bias when changing the number of participants from 100, 200 to 400 (Table 2A). The level of censoring denotes the number of known outcomes during the observation time. The increasing level of censoring from 10, 20, to 50% in that order worsened the performance of the joint model as seen from increased bias (Table 2A). The length of study follow-up may determine the number of measurements (information) that a model uses for estimation. The magnitude of bias decreased with increasing follow-up time, as more measurements were available over time. The level of association between recurrent events and longitudinal processes would also determine the performance of the joint model. As shown in Table 2B, the joint model performed best overall with moderate (Φ = 0.5) association between recurrent and longitudinal processes when compared to weak (Φ = 0.01) or strong (Φ = 0.8). Referencing a scenario with low dependence [var(γ) = 0.2] of within-participant episodes, there was a decrease in bias for moderately dependent episodes [var(γ) = 1.5] but the performance did not improve further when episodes were assumed to be highly dependent [var(γ) = 2.5].
Discussion
Our results demonstrate that jointly modeling recurrent clinical malaria episodes and parasitemia estimates the hazard of clinical malaria with more precision (narrower confidence intervals and smaller standard errors) than a single-event joint model where the subsequent episodes are ignored. The single event joint model gave smaller estimates of hazard ratios, except for age, in most cases with larger standard errors, when compared with the recurrent events joint model. The simulation study shows that if correctly specified, the recurrent events joint model can give parameter estimates with low bias. Exclusion of subsequent episodes by the single event joint model means loss of otherwise valuable information for estimation (42). The recurrent joint model is superior to the traditional approaches in that while the traditional approaches ignore subsequent clinical malaria episodes or repeated parasitemia and hence underestimate the risk of clinical malaria, the recurrent joint model corrects for this bias. Underestimation of parameters may lead to incorrect inferences and wrong conclusions. In this cohort, for example, the season in previous visit seemed not to be associated with the risk of clinical malaria when subsequent episodes were ignored by the single-event model. However, when the recurrent event joint model was used to include all episodes, the rainy season was associated with an increased risk of recurrent clinical malaria. These results support the need for expanded models to utilize all data collected during follow-up to accurately capture the effect of acquired immunity on subsequent clinical malaria episodes due to repeated P. falciparum infections.
We found that older age at enrolment was associated with a reduced risk of clinical malaria. Considering participant age as a proxy for the protective effect of clinical malaria, the trend may partially be attributed to acquired immunity over time (20, 21). Being a cohort from a high transmission area, participants are continuously exposed to repeated bites of infected Anopheles mosquitoes (43, 44). The partial immunity developed over time of exposure may not provide complete protection but it reduces the risk that malaria infection will cause the disease (45). Results from this study highlight the need for studies to assess the effect of age on the risk of clinical malaria while accounting for the acquired immunity, and the joint model of recurrent clinical malaria and P. falciparum parasitemia is critical. Based on the joint model, the predicted conditional cumulative and marginal non-proportional hazards of clinical malaria show that the expected number of clinical malaria episodes in the cohort increased sharply at the beginning of the follow-up period but later slowed beyond 1 year. Thus, the trend shows fewer clinical malaria episodes in subsequent periods over time in the cohort, consistent with previous studies (21, 46, 47).
In the simulation study, the recurrent events joint model performed differently under varied conditions of study sample size, length of follow-up time, and level of censoring. The performance of the joint model, as measured by decreasing bias, improved with increasing study sample size and length of study follow-up. These results are consistent with previous simulation-based studies in joint modeling (23, 48–50). Thus, model performance improved as more data points were available over time. However, increasing level of censoring worsened the performance, a result in line with other joint modeling reports (50). The joint model performance improved by changing the strength of association between recurrent and longitudinal processes from weak to moderate but there was no further clear improvement when the two processes were assumed to be strongly associated. There was a decrease in the bias of the model by increasing the level of dependence of within-participant episodes from low to moderate, but the performance did not improve further assuming high dependence. Lack of clear trends in model performance with change in the strength of the association or level of dependence of within-participant episodes may be partly attributed to interaction among factors. In this study, factors were varied on a one-by-one basis, and results were compared to the reference scenario. This approach does not allow one to study the effect of interaction between factors. Morris et al. (51) recommend varying factors factorially as this approach may likely be more informative since this allows for the exploration of interactions between factors. However, in this study, the extensive required computational time for the models renders the factorial approach infeasible.
Strengths of this study include a combined approach of using real data to fit the models and a simulation study to investigate how the model would perform under different conditions such as study sample size, follow-up period, and level of censoring. Second, the real data used in this study had limited missingness. Further studies should investigate the role of missing data on the performance of the model under different missing level and mechanisms. Finally, using the joint model, we were able to predict the risk of recurrent clinical episodes. The prediction ability can be crucial when designing malaria interventions. Further studies should focus on model diagnostics of the joint model and utilize tools such as residual plots.
The main limitation of this study was the computational complexity of the likelihood for the joint models, resulting in non-convergence problems of the EM algorithms. Non-convergence is a common problem in the field of joint modeling because of frequent high-dimensional random effects and parameter space. Some examples of joint model simulation studies with documented non-convergence problems include Henderson et al. (5), Ferrer et al. (52), and Xu (53). The computational time further increased with increases in sample size and censoring. The computational time for some simulation models was long, reaching up to 24 hours, using an Intel Core i7 2.5 GHz CPU computer. The non-convergence problem prevented exploration of other simulation scenarios including larger sample sizes and longer study follow-up periods, which might be the practical conditions in most settings.
In conclusion, this study has shown that the recurrent events joint model can provide a way of estimating the risk of recurrent clinical malaria in a cohort where the effect of acquired immunity to malaria disease with aging is captured. Furthermore, the study has demonstrated a decreasing trend in the risk of clinical malaria with aging highlighting the need for expanded analytical methodologies to accurately evaluate such changing effects. Through simulation, this study has shown that, if correctly specified, the recurrent events joint model can estimate the risk of clinical malaria with low bias.
Data Availability Statement
The original contributions presented in the study are included in the article/Supplementary Materials, further inquiries can be directed to the corresponding author/s.
Ethics Statement
The data used in this article came from Mfera malaria cohort study which was approved by Institutional Review Boards (IRB)s and Ethics Committees in Malawi and University of Maryland in USA. Ethical clearance for this study was also obtained from Human Research Ethics Committee (HREC)-Medical of University of the Witwatersrand (No M170952). The data was anonymized during analysis. Written informed consent to participate in this study was provided by the participants' legal guardian/next of kin.
Author Contributions
CS, MM, LK, ML, and TC: study conceptualization and design. ML, DM, and AB: data collection. CS: statistical data analysis and drafting of the manuscript. CS, MM, ML, and TC: led in the interpretation of results. CS, MM, LK, AB, DM, ML, and TC: critical review and approval of the final version of the manuscript. All authors contributed to the article and approved the submitted version.
Funding
This study was supported by the Fogarty International Center of the National Institutes of Health (Grant number D43TW010075), The Wellcome Trust (Grant number 107754/Z/15/Z), and the National Institute of Allergy and Infectious Diseases (Grant number K24AI114996). Funders have no role in the design of the study and collection, analysis, and interpretation of data and in writing the manuscript.
Conflict of Interest
The authors declare that the research was conducted in the absence of any commercial or financial relationships that could be construed as a potential conflict of interest.
Publisher's Note
All claims expressed in this article are solely those of the authors and do not necessarily represent those of their affiliated organizations, or those of the publisher, the editors and the reviewers. Any product that may be evaluated in this article, or claim that may be made by its manufacturer, is not guaranteed or endorsed by the publisher.
Supplementary Material
The Supplementary Material for this article can be found online at: https://www.frontiersin.org/articles/10.3389/fepid.2022.924783/full#supplementary-material
References
1. Tsiatis AA, Davidian M. Joint modeling of Longitudinal and time-to-event data: an overview. Stat Sin. (2004) 14:809–34. Available online at: https://www.jstor.org/stable/24307417
2. Lawrence Gould A, Boye ME, Crowther MJ, Ibrahim JG, Quartey G, Micallef S, et al. Joint modeling of survival and longitudinal non-survival data: current methods and issues. Report of the DIA Bayesian joint modeling working group. Stat Med. (2015) 34:2181–95. doi: 10.1002/sim.6141
3. Proust-Lima C, Séne M, Taylor JMG, Jacqmin-Gadda H. Joint latent class models for longitudinal and time-to-event data: a review. Stat Methods Med Res. (2014) 23:74–90. doi: 10.1177/0962280212445839
4. Sudell M, Kolamunnage-Dona R, Tudur-Smith C. Joint models for longitudinal and time-to-event data: a review of reporting quality with a view to meta-analysis. BMC Med Res Methodol. (2016) 16:168. doi: 10.1186/s12874-016-0272-6
5. Henderson R, Diggle P, Dobson A. Joint modelling of longitudinal measurements and event time data. Biostatistics. (2000) 1:465–80. doi: 10.1093/biostatistics/1.4.465
6. Hickey GL, Philipson P, Jorgensen A, Kolamunnage-Dona R. Joint models of longitudinal and time-to-event data with more than one event time outcome: a review. Int J Biostat. (2018) 14. doi: 10.1515/ijb-2017-0047
7. Hickey GL, Philipson P, Jorgensen A, Kolamunnage-Dona R. Joint modelling of time-to-event and multivariate longitudinal outcomes: recent developments and issues. BMC Med Res Methodol. (2016) 16:117. doi: 10.1186/s12874-016-0212-5
8. Rizopoulos D. Joint Models for Longitudinal and Time-to-Event Data: With Applications in R. 1st Edn Biostatistics Series. Boca Raton, FL: Chapman and Hall; CRC Press (2012). doi: 10.1201/b12208
9. Song X, Davidian M, Tsiatis AA. A semiparametric likelihood approach to joint modeling of longitudinal and time-to-event data. Biometrics. (2002) 58:742–53. doi: 10.1111/j.0006-341X.2002.00742.x
10. Taylor JM, Wang Y. Surrogate markers and joint models for longitudinal and survival data. Control Clin Trials. (2002) 23:626–34. doi: 10.1016/S0197-2456(02)00234-9
11. Chen Q, May RC, Ibrahim JG, Chu H, Cole SR. Joint modeling of longitudinal and survival data with missing and left-censored time-varying covariates. Stat Med. (2014) 33:4560–76. doi: 10.1002/sim.6242
12. Chi YY, Ibrahim JG. Joint models for multivariate longitudinal and multivariate survival data. Biometrics. (2006) 62:432–45. doi: 10.1111/j.1541-0420.2005.00448.x
13. Brown ER, Ibrahim JG. A Bayesian semiparametric joint hierarchical model for longitudinal and survival data. Biometrics. (2003) 59:221–8. doi: 10.1111/1541-0420.00028
14. Ibrahim JG, Chen M-H, Sinha D. Bayesian methods for joint modeling of longitudinal and survival data with applications to cancer vaccine trials. Stat Sin. (2004) 14:863–84.
15. Billingham L, Abrams K. Simultaneous analysis of quality of life and survival data. Stat Methods Med Res. (2002) 11:25–48. doi: 10.1191/0962280202sm269ra
16. Sagara I, Giorgi R, Doumbo OK, Piarroux R, Gaudart J. Modelling recurrent events: comparison of statistical models with continuous and discontinuous risk intervals on recurrent malaria episodes data. Malar J. (2014) 13:293. doi: 10.1186/1475-2875-13-293
17. Liu L, Huang X. Joint analysis of correlated repeated measures and recurrent events processes in the presence of death, with application to a study on acquired immune deficiency syndrome. J R Stat Soc Ser C Appl Stat. (2009) 58:65–81. doi: 10.1111/j.1467-9876.2008.00641.x
18. Marsh K, Kinyanjui S. Immune effector mechanisms in malaria. Parasite Immunol. (2006) 28:51–60. doi: 10.1111/j.1365-3024.2006.00808.x
19. Moorthy VS, Reed Z, Smith PG. Clinical trials to estimate the efficacy of preventive interventions against malaria in paediatric populations: a methodological review. Malaria J. (2009). 8:23. doi: 10.1186/1475-2875-8-23
20. Doolan DL, Dobaño C, Baird JK. Acquired immunity to malaria. Clin Microbiol Rev. (2009) 22:13–36. doi: 10.1128/CMR.00025-08
21. Biswas S, Seth RK, Tyagi PK, Sharma SK, Dash AP. Naturally acquired immunity and reduced susceptibility to falciparum malaria in two subpopulations of endemic Eastern India. Scand J Immunol. (2008) 67:177–84. doi: 10.1111/j.1365-3083.2007.02047.x
22. Lin H, Turnbull BW, McCulloch CE, Slate EH. Latent class models for joint analysis of longitudinal biomarker and event process data: application to longitudinal prostate-specific antigen readings and prostate cancer. J Am Stat Assoc. (2002) 97:53–65. doi: 10.1198/016214502753479220
23. Han J, Slate EH, Peña EA. Parametric latent class joint model for a longitudinal biomarker and recurrent events. Stat Med. (2007) 26:5285–302. doi: 10.1002/sim.2915
24. Rizopoulos D, Verbeke G, Molenberghs G. Shared parameter models under random effects misspecification. Biometrika. (2008) 95:63–74. doi: 10.1093/biomet/asm087
25. Clayton DG. A model for association in bivariate life tables and its application in epidemiological studies of familial tendency in chronic disease incidence. Biometrika. (1978) 65:141–51. doi: 10.1093/biomet/65.1.141
26. Clayton D. Some approaches to the analysis of recurrent event data. Stat Methods Med Res. (1994) 3:244–62. doi: 10.1177/096228029400300304
27. Shen Y, Huang H, Guan Y. A conditional estimating equation approach for recurrent event data with additional longitudinal information. Stat Med. (2016) 35:4306–19. doi: 10.1002/sim.7001
28. Buchwald AG, Sorkin JD, Sixpence A, Chimenya M, Damson M, Wilson ML, et al. Association between age and Plasmodium falciparum infection dynamics. Am J Epidemiol. (2019) 188:169–76. doi: 10.1093/aje/kwy213
29. Buchwald AG, Sixpence A, Chimenya M, Damson M, Sorkin JD, Wilson ML, et al. Clinical implications of asymptomatic Plasmodium falciparum infections in Malawi. Clin Infect Dis. (2019) 68:106–12. doi: 10.1093/cid/ciy427
30. Earland D, Buchwald AG, Sixpence A, Chimenya M, Damson M, Seydel K, et al. Impact of multiplicity of Plasmodium falciparum infection on clinical disease in Malawi. Am J Trop Med Hyg. (2019) 101:412–5. doi: 10.4269/ajtmh.19-0093
31. Stanley CC, Kazembe LN, Buchwald AG, Mukaka M, Mathanga DP, Hudgens MG, et al. Joint modelling of time-to-clinical malaria and parasite count in a cohort in an endemic area. J Med Stat Informatics. (2019) 7:1. doi: 10.7243/2053-7662-7-1
32. World Health Organization (WHO). Epidemiological profile of malaria in Malawi in 2015 [Internet]. (2017) Available online at: http://www.who.int/malaria/publications/country-profiles/profile_mwi_en.pdf?ua=1 (Accessed July 11, 2017).
33. Bennett A, Kazembe L, Mathanga DP, Kinyoki D, Ali D, Snow RW, et al. Mapping malaria transmission intensity in Malawi, 2000-2010. Am J Trop Med Hyg. (2013) 89:840–9. doi: 10.4269/ajtmh.13-0028
34. Walldorf JA, Cohee LM, Coalson JE, Bauleni A, Nkanaunena K, Kapito-Tembo A, et al. School-age children are a reservoir of malaria infection in Malawi. PLoS ONE. (2015) 10:e134061. doi: 10.1371/journal.pone.0134061
35. Bartoloni A, Zammarchi L. Clinical aspects of uncomplicated and severe malaria. Mediterr J Hematol Infect Dis. (2012) 4:e2012026. doi: 10.4084/mjhid.2012.026
36. Zhang X, Mallick H, Tang Z, Zhang L, Cui X, Benson AK, et al. Negative binomial mixed models for analyzing microbiome count data. BMC Bioinformatics. (2017) 18:4. doi: 10.1186/s12859-016-1441-7
37. Pickles A, Crouchley R. A comparison of frailty models for multivariate survival data. Stat Med. (1995) 14:1447–61. doi: 10.1002/sim.4780141305
38. Hsieh F, Tseng YK, Wang JL. Joint modeling of survival and longitudinal data: likelihood approach revisited. Biometrics. (2006) 62:1037–43. doi: 10.1111/j.1541-0420.2006.00570.x
39. Wang MC, Qin J, Chiang CT. Analyzing recurrent event data with informative censoring. J Am Stat Assoc. (2001) 96:455. doi: 10.1198/016214501753209031
40. R Core Team. R Core Team. R: A Language and Environment for Statistical Computing. Vienna: R Foundation for Statistical Computing (2017).
42. Huang X, Liu L. A joint frailty model for survival and gap times between recurrent events. Biometrics. (2007) 63:389–97. doi: 10.1111/j.1541-0420.2006.00719.x
43. Guelbéogo WM, Gonçalves BP, Grignard L, Bradley J, Serme SS, Hellewell J, et al. Variation in natural exposure to anopheles mosquitoes and its effects on malaria transmission. Elife. (2018) 7:e32625. doi: 10.7554/eLife.32625
44. Bousema T, Sutherland CJ, Churcher TS, Mulder B, Gouagna LC, Riley EM, et al. Human immune responses that reduce the transmission of Plasmodium falciparum in African populations. Int J Parasitol. (2011) 41:293–300. doi: 10.1016/j.ijpara.2010.09.008
45. Cohen S, McGregor IA, Carrington S. Gamma-globulin and acquired immunity to human malaria. Nature. (1961) 192:733–7. doi: 10.1038/192733a0
46. Gatton ML, Cheng Q. Modeling the development of acquired clinical immunity to Plasmodium falciparum malaria. Infect Immun. (2004) 72:6538–45. doi: 10.1128/IAI.72.11.6538-6545.2004
47. Aponte JJ, Menendez C, Schellenberg D, Kahigwa E, Mshinda H, Vountasou P, et al. Age interactions in the development of naturally acquired immunity to Plasmodium falciparum and its clinical presentation. PLoS Med. (2007) 4:e242. doi: 10.1371/journal.pmed.0040242
48. Arisido MW, Antolini L, Bernasconi DP, Valsecchi MG, Rebora P. Joint model robustness compared with the time-varying covariate Cox model to evaluate the association between a longitudinal marker and a time-to-event endpoint. BMC Med Res Methodol. (2019) 19:222. doi: 10.1186/s12874-019-0873-y
49. Roustaei N, Ayatollahi SMT, Zare N. A proposed approach for joint modeling of the longitudinal and time-to-event data in heterogeneous populations: an application to HIV/AIDS's disease. Biomed Res Int. (2018) 2018:7409284. doi: 10.1155/2018/7409284
50. Efendi A, Molenberghs G, Njagi EN, Dendale P. A joint model for longitudinal continuous and time-to-event outcomes with direct marginal interpretation. Biometr J. (2013) 55:572–88. doi: 10.1002/bimj.201200159
51. Morris TP, White IR, Crowther MJ. Using simulation studies to evaluate statistical methods. Stat Med. (2019) 38:2074–102. doi: 10.1002/sim.8086
52. Ferrer L, Rondeau V, Dignam J, Pickles T, Jacqmin-Gadda H, Proust-Lima C. Joint modelling of longitudinal and multi-state processes: application to clinical progressions in prostate cancer. Stat Med. (2016) 35:3933–48. doi: 10.1002/sim.6972
Keywords: Plasmodium falciparum, longitudinal data, malaria parasitemia, recurrent clinical malaria, cox proportional hazards model, mixed-effects model, shared frailty model, joint modeling
Citation: Stanley CC, Mukaka M, Kazembe LN, Buchwald AG, Mathanga DP, Laufer MK and Chirwa TF (2022) Analysis of Recurrent Times-to-Clinical Malaria Episodes and Plasmodium falciparum Parasitemia: A Joint Modeling Approach Applied to a Cohort Data. Front. Epidemiol. 2:924783. doi: 10.3389/fepid.2022.924783
Received: 20 April 2022; Accepted: 08 June 2022;
Published: 08 July 2022.
Edited by:
Amand Floriaan Schmidt, University College London, United KingdomReviewed by:
Benno Kreuels, Bernhard Nocht Institute for Tropical Medicine (BNITM), GermanyMarie Stoner, RTI International, United States
Copyright © 2022 Stanley, Mukaka, Kazembe, Buchwald, Mathanga, Laufer and Chirwa. This is an open-access article distributed under the terms of the Creative Commons Attribution License (CC BY). The use, distribution or reproduction in other forums is permitted, provided the original author(s) and the copyright owner(s) are credited and that the original publication in this journal is cited, in accordance with accepted academic practice. No use, distribution or reproduction is permitted which does not comply with these terms.
*Correspondence: Christopher C. Stanley, c3RhbmxleWNocmlzdG9waGVyMUB5YWhvby5jb20=