 Qianrong Zhang
 Hazirah Bee2*
94% of researchers rate our articles as excellent or good
Learn more about the work of our research integrity team to safeguard the quality of each article we publish.
Find out more
ORIGINAL RESEARCH article
Front. Environ. Sci. , 19 March 2025
Sec. Environmental Economics and Management
Volume 13 - 2025 | https://doi.org/10.3389/fenvs.2025.1563946
Introduction: The coupling coordination development among Water Resources Carrying Capacity (WRCC), Urbanization Level (UL), and Economic Development Level (EDL) is a critical indicator for regional socio-economic and ecological sustainability. Although existing studies on WRCC and coupling coordination are abundant, in-depth study on the evolution law of coupling coordination and its influence mechanism are still lacking.
Methods: This study proposes an innovative integrated model combining the Technique for Order Preference by Similarity to Ideal Solution (TOPSIS), coupling coordination degree (CCD) analysis, and nonlinear polynomial regression, to dynamically assess the interplay among WRCC, UL, and EDL in Sichuan Province, China from 2010 to 2019. Key innovations include: First, a hybrid weighting method to balance objectivity and expert knowledge in evaluating WRCC, UL, and EDL, integrating entropy and Analytic Hierarchy Process (AHP). Second, a dynamic CCD model capturing multi-system synergies and a nonlinear regression framework quantifying interaction effects.
Results and Discussion: WRCC exhibited a wavy upward trend, peaking at 0.60 in 2018 and 2019, with spatial characteristics of “strong in the west, weak in the east, and stable in the center.” CCD shows a trend of lagging coordination, from basic coordination (0.4–0.5 in 2010–2014) to full coordination (0.6–0.8 in 2018–2019), with 18 cities surpassing 0.6. Regression analysis revealed that CCD is predominantly driven by interactions between systems, R2 is 0.973, where WRCC-EDL synergy exerted the strongest influence, coefficient is 0.780. This model provides a scientific foundation for optimizing water resource management and fostering sustainable urbanization-economy-resource synergies in ecologically fragile yet rapidly developing regions.
Water resources are an irreplaceable resource in all social activities (Hu et al., 2020), playing a significant role in urban development, economic progress, and environmental preservation (Yang et al., 2022). However, with the rapid pace of urbanization and economic growth, the issue of inadequate water resources supply relative to growing demand has become increasingly prominent (Song et al., 2011). As a developing nation, China has experienced significant urbanization since the implementation of its reforms and opening policies in 1978. The urbanization rate increased remarkably from 17.9% in 1978 to 59.58% in 2018 (Ahmad et al., 2020). It is projected that by 2050, the global urbanization rate will reach approximately 70% (Frantzeskaki et al., 2021). Scholars argue that the environment and resources will face threats due to the rapid progress of urbanization and regional economic development, resulting in an imbalance and depletion of water resources (Bai et al., 2014; Liu et al., 2008). In addition to their major negative impact on the local natural environment, these problems could eventually impede sustainable economic growth and pose significant obstacles to the urbanization process (Pittock, 2011). Therefore, a scientific and dynamic assessment of the capacity and spatiotemporal evolution of local water resources is crucial and of great significance. To ensure the long-term progress of urbanization and economic development, studying the coordination capacity between water resources, urbanization, and economic development is essential (Li et al., 2022). Sichuan Province, serving as a vital hinterland and a southwestern economic hub in China, recorded a Gross Domestic Product (GDP) exceeding 4.6 trillion yuan in 2019 (Zhang et al., 2021), ranking sixth nationwide. However, as a major industrial and agricultural base requiring substantial water resources to sustain its growth, the province faces intensified conflicts between economic growth and water consumption. Concurrently, rapid urbanization has led to significant population clustering in metropolises like Chengdu, with the urbanization rate reaching 59.8% in 2023. This urban expansion has triggered a surge in domestic water usage and infrastructure-related water demand, significantly increasing the burden on water resources. Despite possessing abundant annual water resources, ranking second nationally in total volume, the province’s per capita water resources are merely 2,800 cubic meters, significantly below the national average. Furthermore, hydropower development accounts for over 30% of China’s total capacity, which has critically exacerbated water resource pressures. These systemic challenges highlight the urgent need to investigate the carrying capacity of water resources and evaluate their coupled coordination mechanisms within Sichuan’s urban agglomerations as the research focus.
The term ‘carrying capacity’ originates from ecology, where it is defined as the maximum limit of a population in a specific resource environment. Depending on the context, the concepts of water resources carrying capacity, natural resources and environmental carrying capacity, ecological carrying capacity, and other related terms have been developed. Currently, there are many definitions of water resources carrying capacity, which vary depending on the perspective. However, in general, they all emphasize ‘the maximum scale of water resources development’ or ‘the capacity of water resources to support economic and societal progress’. China, one of the first countries to propose the notion of water resources carrying capacity, has achieved significant research results, primarily focusing on two aspects: urban water resources capacity and regional water resources capacity. In 2017, Gao (2017) analyzed the concepts and characteristics of water resources capacity in urban and regional areas. He constructed a model of water resources carrying capacity for urbanized regions, including a water resources cyclic transformation module, a socio-economic development prediction module, and an ecological environment-water resources-society-economic interaction module. Zhang et al. (2019) conducted a comprehensive evaluation of water resource utilization efficiency and protection along China’s ‘Belt and Road’ initiative. He proposed an innovative framework to comprehensively evaluate WRCC based on the Driving force-Pressure-State-Impact-Response (DPSIR) model. Erostate et al. (2020) demonstrated in detail the importance of groundwater supply for achieving sustainable socio-economic and environmental development in the Mediterranean region, analyzing the carrying capacity and sustainable capacity of groundwater. Chapagain et al. (2022) studied the current and future water resource availability under climate change scenarios in Nepal, and discussed strategies for sustainable water resource management over different periods. Chen et al. (2023) used mathematical models to simulate the ecological footprint of water resources and the ecological environment carrying capacity in the Beijing-Tianjin-Hebei urban agglomeration. According to the findings, there were significant shortcomings in achieving sustainable water resource management in the Beijing-Tianjin-Hebei region. However, the efficiency of resource utilization improved over time.
The research methods of WRCC primarily use a combination of qualitative and quantitative methods, such as the Fuzzy Comprehensive Evaluation Method (FCE), Principal Component Analysis (PCA), System Dynamics (SD), Multi-Objective Linear Programming (MOLP), and the Close Value Method. FCE and PCA, as traditional comprehensive evaluation methods, can handle uncertainty and high-dimensional data information, and the evaluation results are easy to interpret and visualize. However, in the FCE model, the weight determination and membership function setting depend on expert experience, which introduces subjectivity into the evaluation results. Although the PCA model relies on data fusion, making the evaluation results more objective, the interpretation of each component is difficult, making it challenging to identify the key factors affecting the carrying capacity level. The SD model is effective at analyzing the feedback mechanism and long-term dynamic behavior of complex systems, and can capture the nonlinear interaction and time-delay effects between variables, which are crucial for the study of the dynamic evolution of carrying capacity. The MOLP model is well-suited for optimizing multiple objectives, searching for the optimal solution, supporting trade-off analysis, and identifying the balance point between water resources carrying capacity and multi-system interactions, such as urbanization and economic development. Therefore, depending on the research problem, scholars have adopted specific methods to conduct extensive research. Among them, Yang et al. (2019) developed a comprehensive assessment framework for WRCC and a dynamic SD model of the socio-economic water resources system in Xi’an City. They quantitatively calculated the comprehensive WRCC using the Analytic Hierarchy Process (AHP) and qualitatively described the ecological change law of WRCC by combining it with SD. The results show that WRCC and the social and economic development of Xi’an City are not sustainable, highlighting the need to promote industrial reform, improve water use efficiency, and formulate water resources recovery policies to improve regional water resources coordination. Wang et al. (2020) utilized the ecological footprint method for water resources management in Hubei Province. They used the ecological footprint method to manage and optimize the allocation of water resources in Hubei Province, providing a more accurate reflection of water resources consumption and supply. Wang et al. (2021), on the other hand, used an improved fuzzy integrated evaluation method to regulate the feedback mechanism and interrelationships between society, economy, water resources, and the water environment. This model can dynamically compute the carrying capacity of water resources across various scenarios of societal progress. The results show that the carrying capacity of water resources in Changchun City is at a lower “normal carrying capacity” level, necessitating changes in the production mode of the national economy and adjustments to the economic structure to improve the carrying capacity of water resources. These evaluation methods rely on static data, but in reality, water resources, the environment, and the economy are often accompanied by randomness. Therefore, scholars have proposed some new research methods and achieved significant results in the fields of urbanization, carbon neutrality, and environmental protection. Kuspilic et al. (2018) argues that the data required for WRCC assessments are often imprecise or random. Therefore, sensitivity and uncertainty analysis are used to quantify the reliability of the evaluation, and a WRCC evaluation method based on the Island of Cres is proposed. Khorsandi et al. (2023) presents a mathematical metamodel, which consists of a set of simplified equations that are easy to apply, for assessing the impact of WRCC on high-quality agricultural land. The method quantifies the impact of individual and collective behavior on each region’s self-sufficiency WRCC and dependence on external food resources. These results indicate that statistics and classical mathematics are increasingly being applied to the study of water resources. Meanwhile, Jin et al. (2018) used Stochastic Frontier Analysis (SFA) to evaluate the urbanization efficiency of the input-output data of 110 cities in the Yangtze River Economic Belt from 2005 to 2014 and analyzed the spatial correlation characteristics between them. The results show that the urbanization efficiency of the Yangtze River Economic Belt gradually increases, and the rate of increase is significant. The urbanization efficiency generally presents a “bar-like” distribution and gradually decreases from east to west. He et al. (2025) used a panel regression model, a threshold effect model, and an intermediary effect model to empirically analyze the impact of digitalization on Carbon Emission Intensity (CEI). The results showed that the inhibitory effect of digitization on CEI exhibits obvious heterogeneity. Guo et al. (2024) proposed the Generalized Luenberger Productivity Index (GLPI) and combined it with SFA to analyze the Green Total Factor Productivity (GTFP) of Chinese cities. The scientific validity and rationality of GLPI are demonstrated from the perspective of statistics and economics. This also shows that with the deepening of comprehensive evaluation research, the traditional comprehensive evaluation model combining qualitative and quantitative methods has begun to transform into an integrated model incorporating economic and statistical models.
Many scholars have concentrated on the analysis of the driving forces and spatiotemporal evolution patterns related to WRCC to more scientifically analyze results, identify internal patterns, and investigate evolution mechanisms and influencing factors. He and Wang (2022) conducted a dynamic analysis of China’s carrying capacity of land and water resources and explored the driving forces and influencing factors in terms of land and water resources support and pressure. Additionally, Liu et al. (2020) proposed a three-stage hybrid model based on evaluation, prediction, and regulation to analyze the dynamic spatio-temporal evolution pattern and comprehensive prediction of the current status of China’s water resources carrying capacity from 2018 to 2030. To date, research on the assessment of the capacity to sustain water resources and the analysis of the evolution pattern has become increasingly mature.
However, the level of coordinated development among the subsystems must be considered in the study of WRCC because the water resources carrying system is a multi-objective decision-making system, comprising coupled water resources, social, economic, and ecological environment subsystems (Wang et al., 2024; Luo et al., 2022). Coordination degree is an indicator that quantitatively describes the degree of coordination among elements or systems in a regional context and is usually calculated by a coupling coordination development model (Sui et al., 2023). Sheng et al. (2022) used a four-system coupled coordination model to measure the harmonized capacity of water resources, social, economic, and ecological subsystems in the Yangtze River Economic Zone. The results show that the coordination ability of the urban agglomeration is weak, and the degree of coordination is affected by factors such as per capita GDP, the proportion of the tertiary industry, and the ecological water quantity. Wang et al. (2019) used the multi-system coupled coordination model to measure the coupling coordination level among water resources, social, economic, and ecological systems in Hunan Province. The results show that Hunan Province is gradually realizing coordinated development, but due to the constraints of different systems, the coordinated development degree among different systems varies spatially and temporally. However, existing research primarily focuses on the measurement of static coordination degree and lacks dynamic analysis of the evolution path and driving mechanism of coordination.
With the deepening of research, scholars have found that WRCC has a significant impact on the high-quality development of cities, sustainable economic growth, and ecological protection. As a result, they have begun to pay attention to the coupling coordination level between WRCC and other evaluation systems. At the same time, in the construction of the model, more attention has been focused on the study of the dynamic coordination evolution path and driving mechanism. Li et al. (2022) employed the model of coupling coordination degree and kernel density estimation to investigate the level of coupling and coordination among resource and environmental carrying capacity and their spatial and temporal characteristics. Then, they dynamically fit multiple nonlinear relationships between WRCC and high-quality development, with water resources per capita and GDP per capita being the main driving factors. Deng et al. (2023) and other researchers examined the interdependent correlation between the intensity of urban development and WRCC using the Chengdu-Chongqing urban agglomeration as the research object. The results show that the coupling coordination degree between urban development intensity and WRCC is low, with only 11.4% of cities in a coordinated state, and most cities in a slightly uncoordinated state. Zhu et al. (2020) adopted the immune gray wolf optimization algorithm to fit the high-quality development of water resources and the economy and carried out static and dynamic measurements on the coordination of urban agglomerations in the middle and lower reaches of the Yangtze River from 2008 to 2017. Five coordination types were measured using the static measure, and the dynamic measurement showed that the coordination ability of urban agglomerations gradually decreased. Through these review studies, it is evident that research on water resources carrying capacity has undergone a significant transformation, shifting from a single city to an urban agglomeration, from static comprehensive evaluation to dynamic spatio-temporal evolution analysis, and from the internal subsystem of water resources to other evaluation systems.
In conclusion, despite significant progress in WRCC research and the degree of coupling coordination, the current research still has certain deficiencies and challenges. First, there is a lack of region-specific studies. Sichuan Province, as the center and strategic hinterland of China’s Southwest region, has been understudied in terms of water resources carrying capacity and coupling degree, and more research should be conducted in this region. Second, there is limited spatio-temporal evolution analysis. Most studies focus on static evaluations, neglecting the dynamic evolution of WRCC and its coupling coordination over time and space. Third, there are insufficient multi-system interaction mechanisms. The coupling coordination degree has primarily been studied between WRCC and a single system, such as WRCC and urbanization or WRCC and economic development, failing to capture the synergistic effects of multiple systems.
In summary, to address the above problems. This study takes Sichuan Province as the research object and develops an integrated model, which integrates the evaluation model, the coordination model and the regression model. Different from the traditional model, which can only calculate the carrying capacity level, the integrated model realizes the dynamic comprehensive evaluation, dynamic coordination analysis and impact factor analysis in one, which can truly quantify the interaction between “water-economy-city” and find the internal influence mechanism of complex system. It provides important theoretical support for the construction of Chengdu-Chongqing economic circle and the harmonious and sustainable development of Man-water city. The key innovations include: First, dynamic spatio-temporal analysis. Second, multi-system synergy quantification. Third, hybrid weighting method. Specifically, the following contents are included.
(1) Dynamic spatio-temporal analysis: By leveraging ArcGIS and R, this study quantifies the spatio-temporal evolution of WRCC and CCD in Sichuan Province from 2010 to 2019, providing a comprehensive understanding of regional disparities and trends.
(2) Multi-system synergy quantification: The nonlinear polynomial regression model captures the interaction mechanisms among WRCC, urbanization, and economic development, revealing that CCD is predominantly driven by system synergies rather than independent factors.
(3) Hybrid weighting method: A novel combination of entropy and AHP weights balances data-driven objectivity and expert-driven relevance, enhancing the robustness of the evaluation framework
Located within the coordinates of 97°21′-108°33′E for longitude and 26°03′-34°19′N for latitude, Sichuan is located in the hinterland of Southwest China, at the upper reaches of the Yangtze River. The province had 21 cities (states) and 183 counties (cities and districts) under its jurisdiction. During the period of 2010–2019, the urbanization and economic level of Sichuan Province have increased tremendously. In 2019, the province’s GDP exceeded 4.6 trillion yuan, an increase of 7.5%, positioned itself as the sixth-ranked GDP within China. Sichuan province has a total resident population of 83.680 million and household population of 90.714 million, accounting for about 7% of the national number. Chengdu has also joined the list of ‘New First-Tier Cities’ in China. In the face of such a rapid increase in economic levels and urbanization, the pressure on water resources is increasing. Within 2010–2019, the average total water resources of Sichuan Province are 252.632 billion cubic meters, per capita water resources of 3,116 cubic meters. However, the gap of water resources in the regional distribution is still large in which the western region of the Sichuan Province is richer in water resources, but the population is smaller. As such, the average per capita water resources are significantly higher than the other regions. There are also some differences in the time dimension. In general, along with the rapid development of Sichuan Province’s economy and urbanization in recent years, domestic and production water use has increased, the pressure on water resources has increased, the amount of sewage has increased, and water pollution has become increasingly serious, which makes the sustainable use of water resources in Sichuan Province face serious challenges. Therefore, Sichuan Province is chosen at this study because it holds immense importance to examine the spatial and temporal progression of carrying capacity and discussing the coupling relationship among WRCC and economic level and urbanization. Figure 1 displays the position of Sichuan Province in terms of its geographical location.
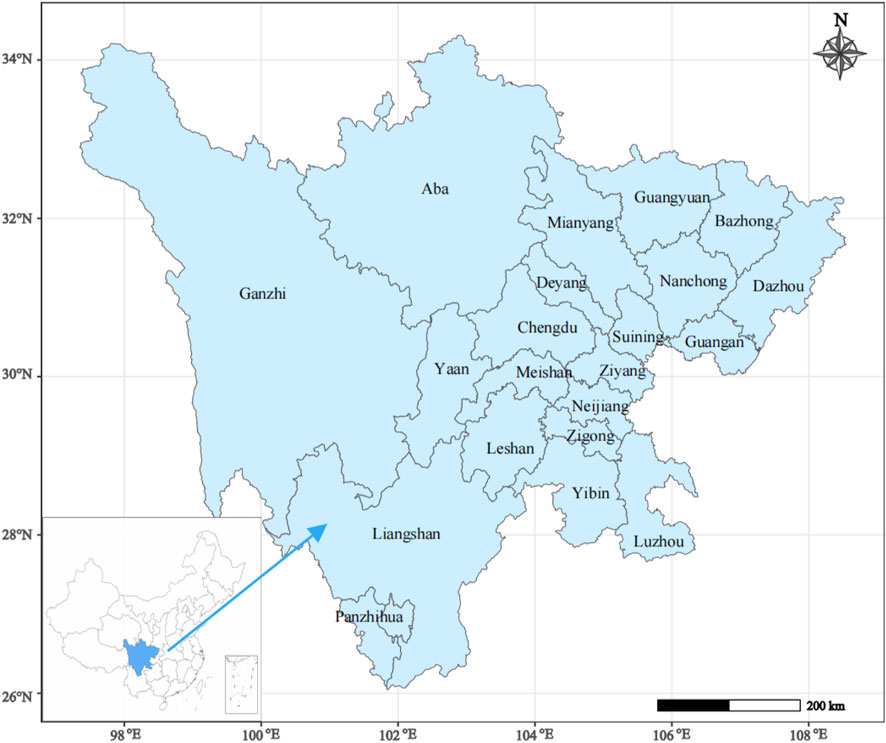
Figure 1. Geographical location of Sichuan province.
This study collected statistical data from 21 cities in Sichuan Province spanning the period 2010–2019. Economic indicators and basic information, including GDP, gross output value of the tertiary industry, total population, and administrative area, were sourced from the Sichuan Statistical Yearbook (Source: http://tjj.sc.gov.cn/). Water resource data, such as total precipitation, runoff volume, and total water resources, were obtained from the Sichuan Water Resources Bulletin (Source: http://slt.sc.gov.cn/). Urban development data, including urban green space area and total built-up area, were extracted from the China Urban Construction Statistical Yearbook (Source: http://jst.sc.gov.cn/).
Among them, the data of urban green area and sewage volume in Ganzi, Aba and Liangshan Prefecture from 2010 to 2015 were missing. According to observe the data trend of these two indicators, and it was found that the data tended to be stable. So the linear interpolation method is used for completion, which has the advantages of simple and fast, avoiding excessive vibration. The interpolation calculation process is shown in Equation 1. At the same time, the data is normalized. Formulas 2, 3 represent positive and negative indicators respectively.
where,
where,
Water resources carrying capacity is affected by many factors, including economy, population and ecological environment. To obtain scientific and reasonable evaluation results, it is necessary to establish a suitable evaluation index system for the study area. Among the previous studies, Li et al. (2023) proposed an evaluation system based on the framework of water resources - economy - society - ecological environment in 2023. Liu et al. (2022) proposed an evaluation system based on the framework of people – water - city. Both of which can well explain the association between water resources and the city, economy and ecological environment. However, the comprehensive evaluation should feedback the corresponding relationship among protection and use of water resource. Hence, the present study presents the Pressure – Status - Response (PSR) model (Deng et al., 2023; Li et al., 2021), which divides all the evaluation indicators into three criterion levels, namely, pressure indicator, status indicator and response indicator. Among them, the pressure index is used to explain the current water resource utilization in urban and economic development, where per capita water resource use is the ratio of total water resource use to the resident population, reflecting the pressure of population growth on water resources. Water consumption per 10,000 yuan of GDP is the ratio of total water resources use to total GDP, reflecting the pressure of economic growth on water resources. Total annual production water consumption, Proportion of agricultural water use and Annual total domestic water consumption represents the pressure of water resources in industrial production, agricultural production and residents’ daily life. The current situation indicator describes the current situation of water resources in the study area, in which per capita water resources is the ratio of total water resources to total population, reflecting the sustainable capacity between water resources and population in the region. Water production modulus is the ratio of the total water resources to the area under the jurisdiction, which reflects the overall health of water resources in the region. The higher the value, the more abundant water resources in the region. Total precipitation is the most important source of water resources in a region, and the amount of precipitation directly determines the state of the local water resources. Groundwater modulus is the ratio of the total groundwater to the total area of the jurisdiction. It reflects the future potential of water resources and is an important factor in measuring the sustainability of water resources in a region. The response index describes the protection measures taken by human beings and society to improve the carrying capacity of water resources. Among them, Urban green coverage area is the ratio of the total urban green area to the area under the jurisdiction, indicating the investment capacity of a city in ecological protection and providing an important guarantee for the circulation and regeneration capacity of water resources. Wastewater treatment rate is the ratio of the total amount of purified water to the total amount of sewage, which represents the recycling capacity of water resources. The higher the value, the healthier the water environment. Table 1 shows the 13 evaluation indicators finally selected.
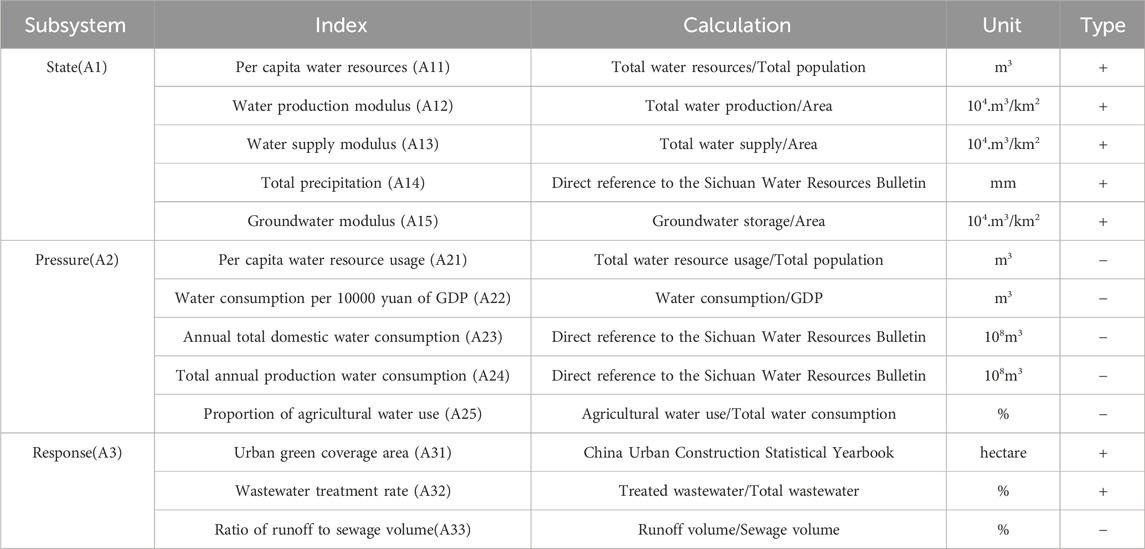
Table 1. WRCC evaluation index system.
Urbanization exerts a substantial influence on the advancement of human social, political and economic life. Urbanization encompasses various dimensions, such as the urbanization of population, economic activities, spatial distribution, and social development. Referring to the literature research (Chen et al., 2010), this paper establishes the evaluation index system of urbanization level based on Population urbanization, Economic urbanization, and Spatial urbanization (PES) framework. Urban population density is the ratio of the total population to the total area, which represents the concentration of population distribution in the region, and reveals the efficiency, sustainability and potential problems of urbanization through multi-dimensional data association. Urban population growth rate is the ratio between the total population of the current year and the total population of the previous year, which represents the changing trend of urban population and reveals the trend of urban development. GDP per capita and economic density are the ratio of GDP to total population and total area of jurisdiction respectively. These two indicators truly reflect the influence of economic development in the process of urbanization. Proportion of tertiary industries to GDP is the ratio of tertiary industries to GDP, which represents the sustainable ability and health of economic development in the process of urbanization. The Urbanization rate is the ratio of the total urban population to the total population, which reflects the degree of agglomeration of the urban population in space. The higher the urbanization rate, the more obvious the urbanization. Proportion of built-up areas in total areas is the ratio of built-up areas in total areas. It reflects the degree of urbanization in space and is a key factor to measure the level of urban development. Table 2 shows the three dimensions and their respective evaluation indicators.
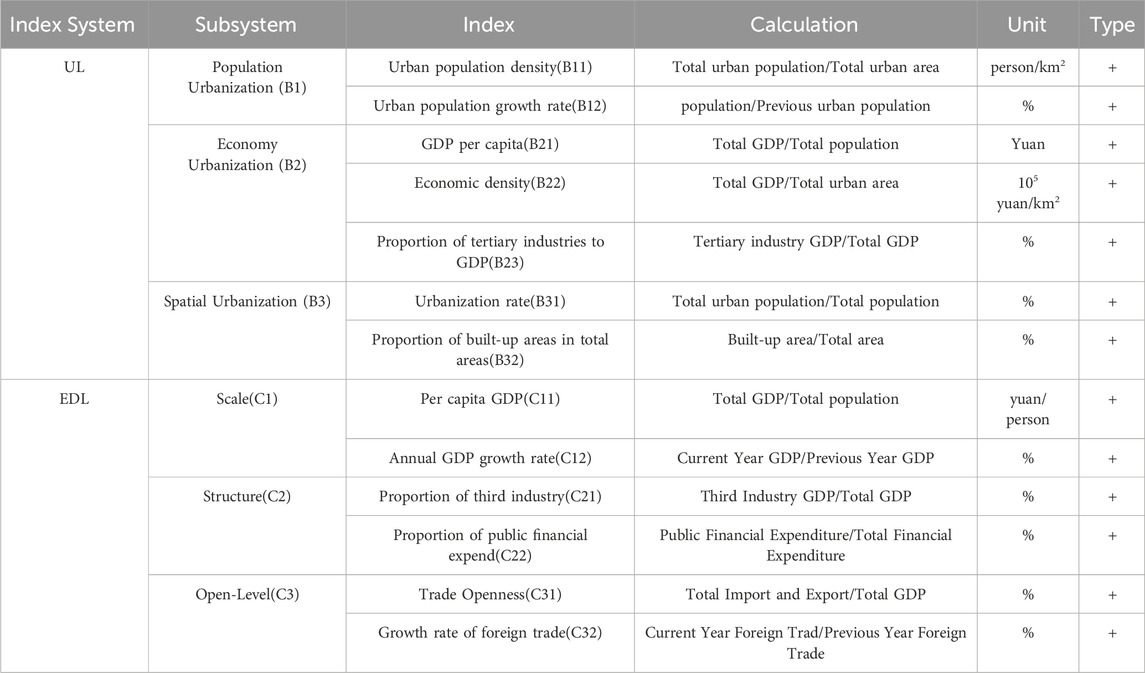
Table 2. UL and EDL evaluation index system.
The evaluation of regional economic development level is not only considering GDP and GDP per capita, but also influenced by many factors such as economic scale, development speed and economic structure. Therefore, this paper refers to the existing economic evaluation index system (Wang, 2022) and establishes the evaluation index system of economic development level based on the framework of Scale-Structure-Open Level (SSO). Among them, the scale includes per capita regional GDP and GDP annual growth rate, which reflect the overall economic situation and economic development speed respectively, and is an important indicator to measure the development status and activeness of a regional economy. The structure includes the proportion of the tertiary industry and the proportion of public financial expenditure, among which the proportion of the tertiary industry is an important indicator to measure the degree of modernization of the economic structure, reflecting the trend of the economy from industry-led to innovation-driven and knowledge-intensive. The proportion of public financial expenditure reflects the government’s role in economic regulation, public service supply and social equity guarantee, and a higher proportion may reflect the intensity of investment in social security and other areas of people’s livelihood. These indicators can assess the quality of economic development and long-term growth potential. The level of openness includes the degree of trade openness and the growth rate of foreign trade. Among them, the degree of trade openness reflects a city’s level of openness to the global economy, reflecting policy inclusiveness, market freedom and international competitiveness, and high openness is often accompanied by technology spillover and optimal allocation of resources. The growth rate of foreign trade measures the momentum of trade expansion and reflects the vitality of market demand, and the fluctuation of foreign trade growth can reveal external risks. The two can jointly assess the depth of global economic participation and resilience against risks. Table 2 shows the EDL evaluation index system and its respective index scales.
The entropy weight method is used by many scholars in their research because it relies on the information entropy of the original data to determine the weight of each indicator, which makes the weight more objective. However, if the raw data of important evaluation indicators have less differences, it will lead to their high information entropy and very low weights, this is not in line with the reality of WRCC evaluation. While AHP weights mainly rely on the judgment matrix to determine the weight of the indicators, which relies on the experts or researchers to determine the importance of the evaluation indicators in two-by-two comparisons. But the AHP weights rely entirely on the subjective comparison of indicators, lack of interpretation of objective data information, and similarly do not satisfy the scientific nature of comprehensive evaluation. Therefore, this paper adopts comprehensive weights, combining entropy weights and AHP weights, making the final weights more scientific and reasonable (Wang et al., 2021; Deng et al., 2021; Ouma and Tateishi, 2014; Zhou, 2022). The calculation steps are as follows.
To evaluate WRCC, UL, and EDL across 21 cities in Sichuan Province, a normalized data matrix is constructed. Each city is treated as a sample, and the indicators are standardized to ensure comparability. The matrix is defined as Formula 4.
where,
The entropy weight method is applied to quantify the information entropy of each indicator, reflecting its variability and importance. For example, indicators with significant variability across cities, such as annual precipitation or per capita water resources, are assigned higher weights. The entropy weight
where,
To incorporate expert knowledge, the AHP method is used to construct a judgment matrix H, where pairwise comparisons of indicators are made based on their relative importance to WRCC, UL, and EDL. For instance, total water resources per capita might be prioritized over production water consumption in the context of WRCC evaluation. The AHP weight
First, Constructing the judgment matrix H. As shown in Formula 8.
where,
The final weights
where, the weighting coefficient a is determined by the regulation parameter
The Technique for Order Preference by Similarity to Ideal Solution (TOPSIS) is a widely recognized multi-criteria decision-making (MCDM) method that evaluates alternatives based on their relative closeness to an ideal solution. In the context of WRCC, UL, and EDL evaluation, TOPSIS provides a robust framework for assessing the sustainability and coordination of these systems across different regions. Its theoretical foundation lies in the concept of Pareto optimality, which seeks to identify solutions that cannot be improved in one dimension without worsening another (Hwang and Yoon, 1981). This makes TOPSIS particularly suitable for evaluating complex, multi-dimensional systems like WRCC, UL, and EDL, where trade-offs between economic growth, urban expansion, and resource conservation are inevitable.
TOPSIS operates on the principle that the optimal solution should simultaneously minimize the distance to the positive ideal solution (PIS) and maximize the distance to the negative ideal solution (NIS). The PIS represents the best possible performance across all indicators, while the NIS represents the worst. By quantifying the relative closeness of each alternative to these ideal solutions, TOPSIS provides a comprehensive ranking that reflects the overall performance of the evaluated systems.
In this study, TOPSIS is applied to evaluate the coordination and sustainability of WRCC, UL, and EDL across 21 cities in Sichuan Province. It can integrates diverse indicators, such as water availability, urban green space, and GDP per capita, into a unified evaluation framework. By calculating the relative closeness to ideal solutions, TOPSIS highlights spatial variations in WRCC and coordination levels, providing insights into regional imbalances (Lv et al., 2023). The calculation process is as Formulas 13-15.
where,
The Coupling Coordination Degree Model is a tool for quantifying the interaction relationship between multiple systems and the level of collaborative development, which originated from system science and collaborative theory. The core idea is derived from the concept of “coupling” in physics, where two or more systems interact to form a relational relationship (Nasrollahi et al., 2020). At the end of the 20th century, with the rise of the concept of sustainable development, the traditional single index evaluation system could not meet the needs of composite system analysis. The academic community began to pay attention to the coordinated development of multi-dimensional systems such as economy, society and ecology, and the coupling coordination degree model came into being. The model includes two dimensions: coupling degree and coordination degree. The Coupling Degree reflects the strength of interdependence and interaction between systems. The higher the value, the closer the correlation between systems. Coordination Degree measures the quality of collaborative development among systems and emphasizes whether each system achieves positive interaction and overall optimization in the dynamic evolution (Wan et al., 2021). Because the model integrates multiple system indexes and can fully reflect complex relationships, the model has a strong comprehensive advantage. At the same time, the model visually presents the coordination level through numerical results, which is convenient for horizontal and vertical comparison, making the model quantifiable and concise.
Since water resources, city and economy are inseparable, the development of economy and city cannot be separated from the support of water resources, and the shortage of water resources will greatly hinder the development of city and economy. They are intricately coupled. The coupling coordination degree model can simulate the coupling relationship between them and calculate the coordination degree between them at the same time. Therefore, in order to reveal the law, the sustainable development level of water resources and urbanization and economic development is studied. The coupling coordination degree model is used to further evaluate the coupling coordination level between WRCC, UL and EDL. Firstly, the coupling degree between the three systems is simulated through the comprehensive evaluation value, and then the weight and the comprehensive evaluation value are linearly combined, and the coupling degree is integrated to obtain the coordination degree. The calculation process is as Formulas 16-18 (Tan et al., 2022).
where,
Then, Calculating the degree of coordination D.
T is the composite index of the three systems, α, β and γ is the contribution of the three systems, which is taken as most researchers consider the importance of all systems to be the same, So take
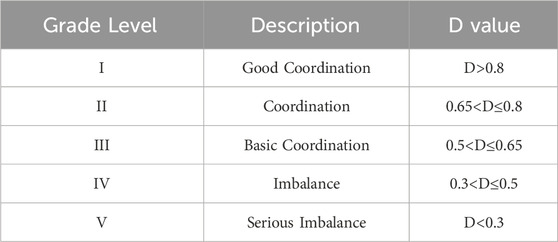
Table 3. Standard for classifying of CCD.
Different CCD are also determined by the differences between WRCC, UL, and EDL. These systems should have precise mathematical correlations with one another, and their impacts on the CCD should either be distinct or mutual rather than independent. To further analyze the effect of the combined level of the three systems on CCD, two regression models were constructed. One assumes that the effects of variables and CCD are independent and constructs a multiple linear regression model, as shown in Equation 19. Another model assumes that the CCD of each system is not independently affected and the interaction between the systems together affects the CCD state, so a nonlinear polynomial regression model is constructed, as shown in Equation 20.
where,
where,
The objective of this research is to study the spatio-temporal evolution law of water resources carrying capacity in Sichuan Province and the coupling coordination level with urban development level and economic development level. Firstly, a comprehensive evaluation index system of WRCC based on PSR framework, the EDL evaluation system based on SSO framework and UL evaluation system based on PES framework are established. Then, entropy and AHP weights are combined to obtain the comprehensive weights of the evaluation indicators, and the TOPSIS method is used to calculate the comprehensive evaluation values of WRCC, UL and EDL, and Arc Geographic Information System and R languages are used to visualize the evaluation results and analyze the temporal evolution law and spatial evolution law. Again, the coupled coordination model is used to calculate the CCD among the three systems and analyze their temporal and spatial evolution laws. Finally, a polynomial regression model is built between the CCD and the three systems to analyze the influence mechanism. Figure 2 shows the proposed research framework.
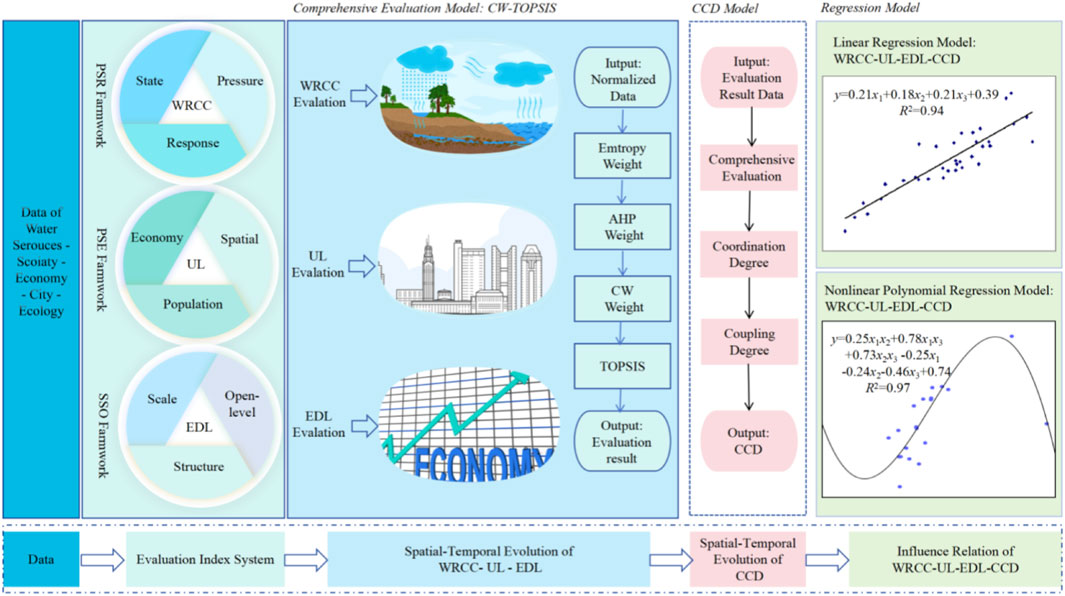
Figure 2. Research framework.
Indicator weights are important influencing factors in evaluation research, so how to obtain indicator weights scientifically and reasonably is crucial. This paper adopts the comprehensive weight, which utilizes the adjustment coefficient to combine the entropy weight and AHP weight. It overcomes the problem of entropy weight being too large or too small for some indicators due to data factors, and it also overcomes the problem of ignoring the characteristics of the data itself because of subjective factors of the experts in the AHP weight.
Figure 3 shows the weights of each criterion and indicator layer of the WRCC evaluation information system, from which when the entropy weighting method is used to evaluate the carrying capacity of water resources in Sichuan Province, the water resources status (A1) has the highest weight of 0.66, and the water resources pressure (A2) and water resources response (A3) are relatively balanced. At the indicator level, per capita water resources (A11) has the highest weight. When applying AHP weights, the weights of each criterion and indicator layer are relatively balanced with small differences. After using the combined weights, the water resource status (A1) has the highest weight of 0.524. In the indicator layer, the per capita water resources (A11) is 0.216, the annual domestic water consumption (A23) is 0.08, and the urban green coverage area (A31) is 0.128, which are the evaluation indicators with the highest weights in the three criteria layers, respectively. This also indicates that water resource status (S) is the most important influencing factor in the PRS framework of WRCC evaluation in Sichuan Province, while water resource pressure (P) and water resource response (R) act as synergistic influencing factors that together affect the evaluation results. At the indicator level, the most important evaluation indicators are, in order, A11, A13, A23 and A31.
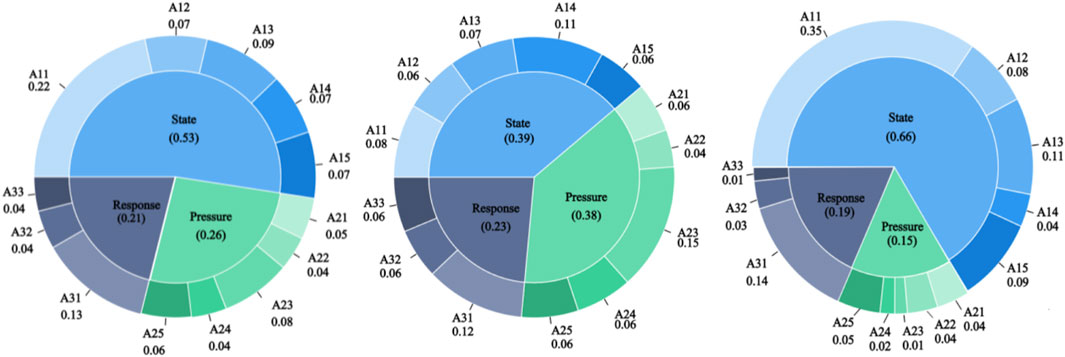
Figure 3. Three types indicator weights for WRCC. (A) Combined weights. (B) AHP weights. (C) Entropy wights.
The comprehensive appraisal value of each evaluation system can be calculated using the TOPSIS method. Figure 4 shows the box distribution of the comprehensive evaluation value of each city of UL, EDL and WRCC. It can be concluded that from 2010 to 2019, the variation range of the box plot of the urbanization level is between 0.15. There are only a small number of anomalies, and the mean curve shows an upward trend with a slope of 45°. It shows that the urbanization level gap between most cities in Sichuan Province is not large and is increasing year by year, but there are still individual cities with uneven development. In EDL, from 2010 to 2016, both the box plot and the mean curve are relatively stable, remaining at about 0.3. Later years, from 2016 to 2019, the mean curve shows an upward trend with a slope of 45°, which also indicates that from 2010 to 2019, the EDL has little gap among cities, but there are individual cities with uneven development. Overall, EPL first maintains a steady development and then enters a stage of rapid development. The box plots for WRCC 2011, 2016, and 2018 show a wide range of changes, and there is a significant variation in WRCC between cities. This could be because of the wide variations in the cities’ water resource status, which is the most significant influencing factor in WRCC, with a weight of 0.524. The mean curve exhibits a swinging upward “wavy”, possessing higher values in 2018 and 2019, both of which are close to 0.5. It also shows that the WRCC follows the water resource status in a swinging rising trend, reaching its peak in 2018–2019. The overall water resource carrying capacity remains above and below 0.4, indicating that the WRCC of Sichuan Province is still supportable.
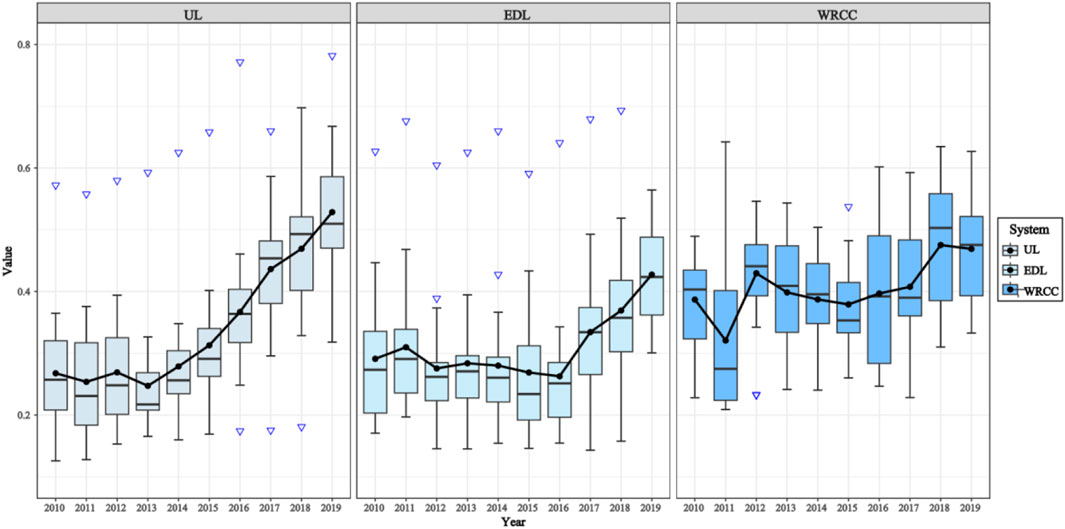
Figure 4. Box plot of the trend in the combined assessed value of the three systems.
Figure 5 represents the radar distribution of the evaluation values of Sichuan cities in the 5 years of 2010, 2012, 2014, 2016, 2019. It is evident that UL and EDL’s performance is improving year, with Chengdu City exhibiting the best performance. This further highlight Chengdu’s significance as the strategic hinterland and economic hub of Southwest China. The cities of Yibin and Mianyang, as the vice-centers of Sichuan’s economy, also show higher UL and EDL. Meanwhile, there is an obvious positive synergy between urbanization and economic development, and cities and years with higher EDL values also have higher urbanization levels. However, the performance level of Chengdu city is relatively weak in WRCC. On the contrary, the cities of Liangshan, Ganzi and Aba, which have low values of UL and EDL, have relatively high WRCC, which is also due to the fact that water resources pressure (Pressure) is a major influencing factor of WRCC. Higher urban development and economic development will inevitably be accompanied by higher water resource pressure, and it is particularly important to improve water resource responsiveness (Response).
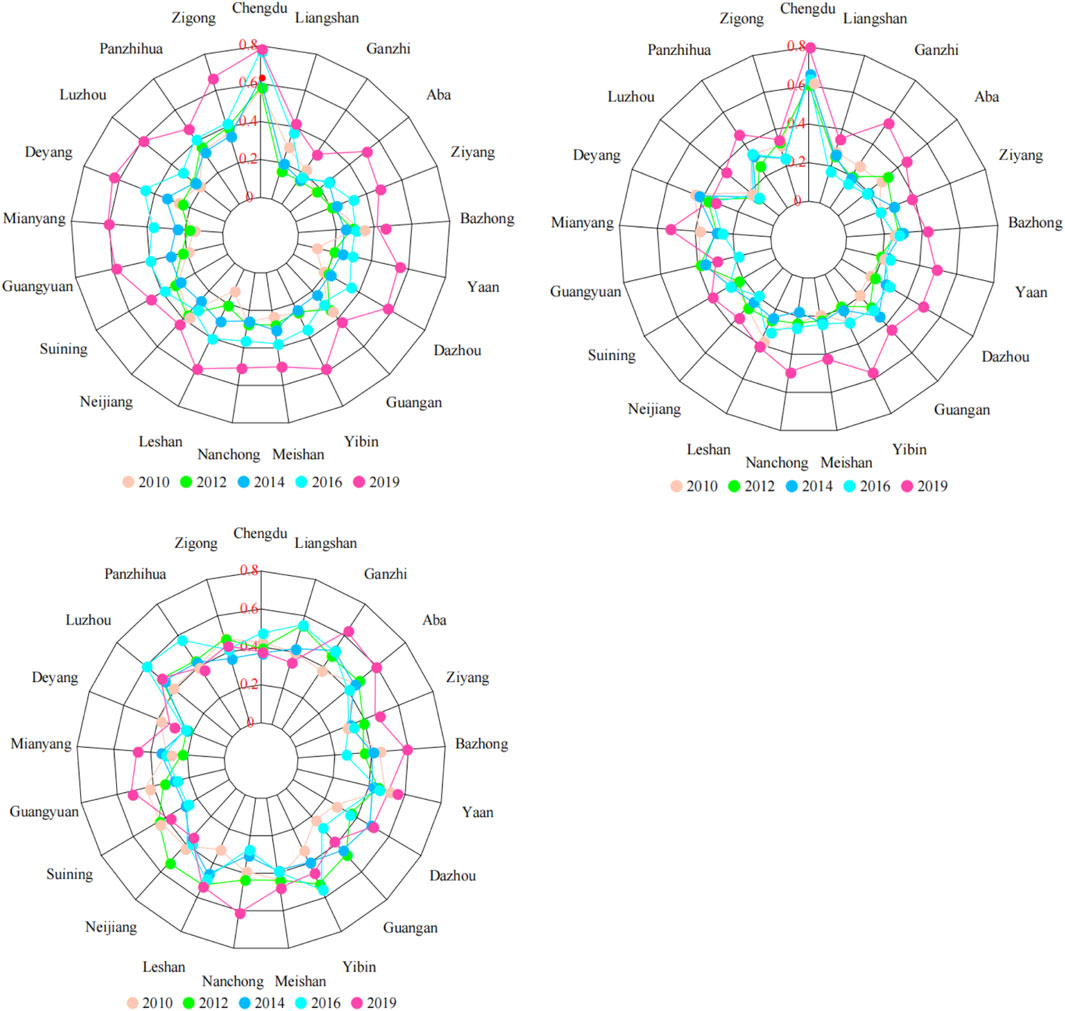
Figure 5. Radar distribution map for comprehensive evaluation of each system. (A) UL. (B) EDL. (C) WRCC.
In order to quantify the evaluation grade of water resources carrying capacity more scientifically, with reference to previous studies and the characteristics of WRCC in Sichuan Province, the comprehensive evaluation value of WRCC is divided into five intervals of 0–0.3, 0.3–0.4, 0.4–0.5, 0.5–0.6, and 0.6–1.0, which correspond to the five grades of V (very poor), IV (poor), III (Moderate), II (Good), I (Very Good).
In order to analyze the spatial changes of WRCC in cities of Sichuan Province from 2010 to 2019, the spatial distribution map of WRCC was drawn using R. To observe the evolution law of WRCC more intuitively, the color of the map was filled in using the isometric grading method. The 6 years of 2010, 2012, 2014, 2016, 2018 and 2019 were selected as samples. Figure 6 shown spatial-temporal evolution of WRCC.
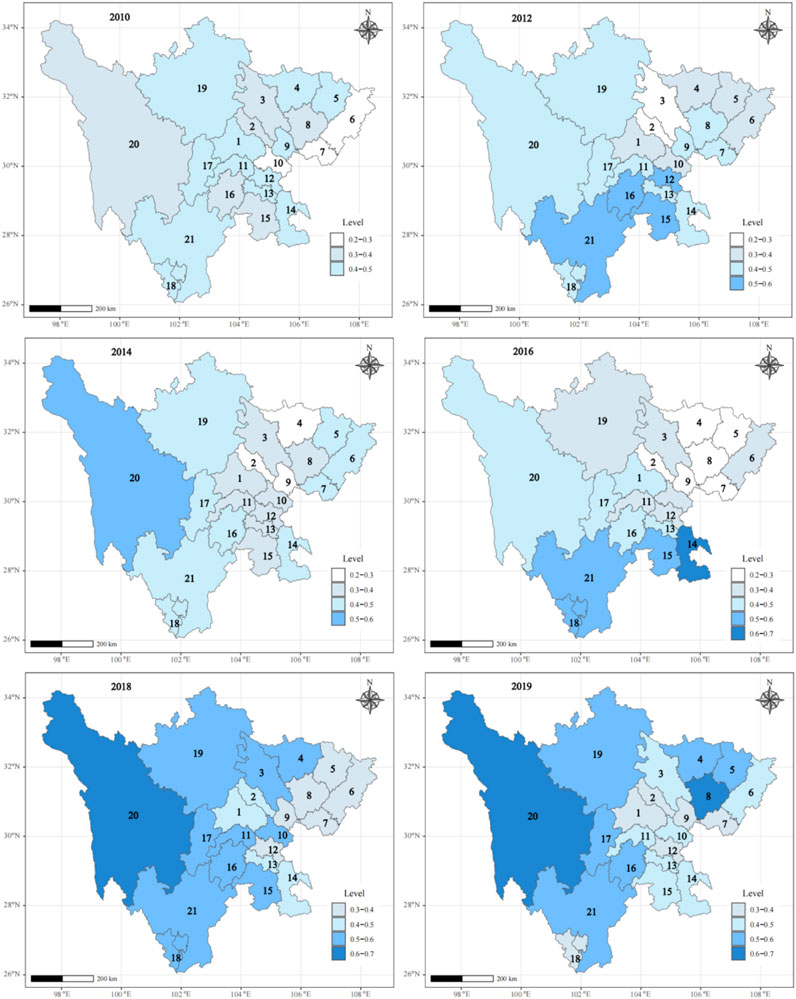
Figure 6. Spatial-temporal evolution of WRCC in 21 cities of Sichuan province. Note: 1-Chengdu, 2-Deyang, 3-Mianyang, 4-Guangyuan, 5-Bazhong, 6-Dazhou, 7-Guangan, 8-Nanchong, 9-Suining, 10-Ziyang, 11-Meishan, 12-Neijiang, 13-Zigong, 14-Luzhou, 15-Yibin, 16-Leshan, 17-Yaan, 18-Panzhihua, 19-Aba, 20-Ganzhi, 20-Liangshan.
It is evident that WRCC exhibits the following characteristics in the spatio-temporal evolution. First of all, the carrying capacity level of cities has a certain regional difference degree. From 2010 to 2019, WRCC in Sichuan Province as a whole remained between 0.3–0.6, belonging to the IV-II level, indicating that water resources can still meet the needs of regional development. However, cities such as Deyang, Suining and Guang’an have relatively poor WRCC, belonging to Class V (very poor). Except for the three western autonomous prefectures, the remaining cities have small differences in WRCC levels, which are mainly concentrated between the two levels. This regional difference reflects the spatial imbalance of water resources distribution and utilization efficiency. This difference is because the distribution of water resources in Sichuan Province is significantly affected by natural conditions. The western region has abundant precipitation and good ecological environment, while the eastern region has relatively low precipitation and strong economic development intensity, resulting in greater pressure on water resources. Secondly, the spatial evolution trend of WRCC shows a spatial pattern of “strong in the west, weak in the east and stable in the middle”. The western region (such as Aba, Ganzi, Liangshan) has a low level of urbanization, better ecological environment protection, and relatively low pressure on water resources. The eastern region, with its developed economy and concentrated industry, faces greater pressure on water resources, resulting in weaker WRCC performance. In the central region (such as Chengdu and Mianyang), WRCC performance is relatively stable due to the relative balance between economic development and water resources management. This spatial pattern is mainly affected by the economic structure and urban structure of Sichuan Province. The eastern region is economically developed and the industrial water demand is large, which leads to high water resource pressure. Especially in the industrial concentration area, the problem of over-exploitation and pollution of water resources is more prominent. The low urbanization level and good ecological environment in western China provide favorable conditions for water resource protection. Then, in the time evolution trend, WRCC showed an overall upward trend and reached its peak in 2018–2019. This improvement is mainly due to natural factors and environmental protection. On the one hand, from 2018 to 2019, precipitation in most cities in Sichuan Province increased significantly, and per capita water resources increased significantly, which directly improved the State level of WRCC. On the other hand, the Response of water resources has been improved year by year, especially in eastern cities (such as Mianyang, Suining, Guang ‘an, Nanchong, Bazhong, Guangyuan), the sewage treatment rate has been improved, and the water pollution discharge has been reduced, so that these cities have got rid of the extreme water shortage state in 2018–2019, and the WRCC level has been upgraded to level IV-III. It can support urbanization and sustainable economic development. Finally, Chengdu, as a typical case, although the population is large, the pressure of water resources is huge. However, WRCC has been at a medium level for a long time and can basically meet development needs. This is mainly due to its high level of water Response. For example, in 2019, Chengdu’s green area reached 41,266 ha, the sewage treatment rate reached 96 percent, and the runoff pollution ratio dropped below 1.1 percent. These measures have effectively eased the pressure on water resources and provided experience for other cities to learn from.
According to the above characteristics of water resources carrying capacity, several policy suggestions are put forward to realize the sustainable development of all urban water resources. First, optimize the spatial allocation of water resources. In view of the spatial pattern of “strong in the west and weak in the east”, it is suggested to strengthen water resource allocation projects in the eastern region, such as cross-regional water transfer, to alleviate the problem of water shortage. At the same time, in the western region, ecological and environmental protection should continue to be strengthened to avoid over-exploitation of water resources caused pressure. Second, improve water resources management capacity, promote Chengdu’s successful experience, strengthen sewage treatment and recycling, and improve water resources utilization efficiency. At the same time, in industrial concentration areas, a stricter water management system will be implemented to limit the development of water-intensive industries. Third, strengthen water resources monitoring and early warning, and develop adaptive management strategies, such as rainwater harvesting systems and drought-resistant facilities. Promote green infrastructure and make cities more resilient to extreme weather events.
To simplify the analysis of the temporal characteristics of CCD levels in urban areas within Sichuan Province over a decade period, the CCD among WRCC and UL and EDL are calculated in the 21 cities of Sichuan Province using coupling coordination degree model. The value is represented by D. Considering the change of CCD in each city over time, combined with the trend of the performance of the WRCC system, we divide the 10-year period of 2010–2019 into three periods of 2010–2014, 2015–2017, and 2018–2019. Figure 7 shown temporal evolution trend of CCD.
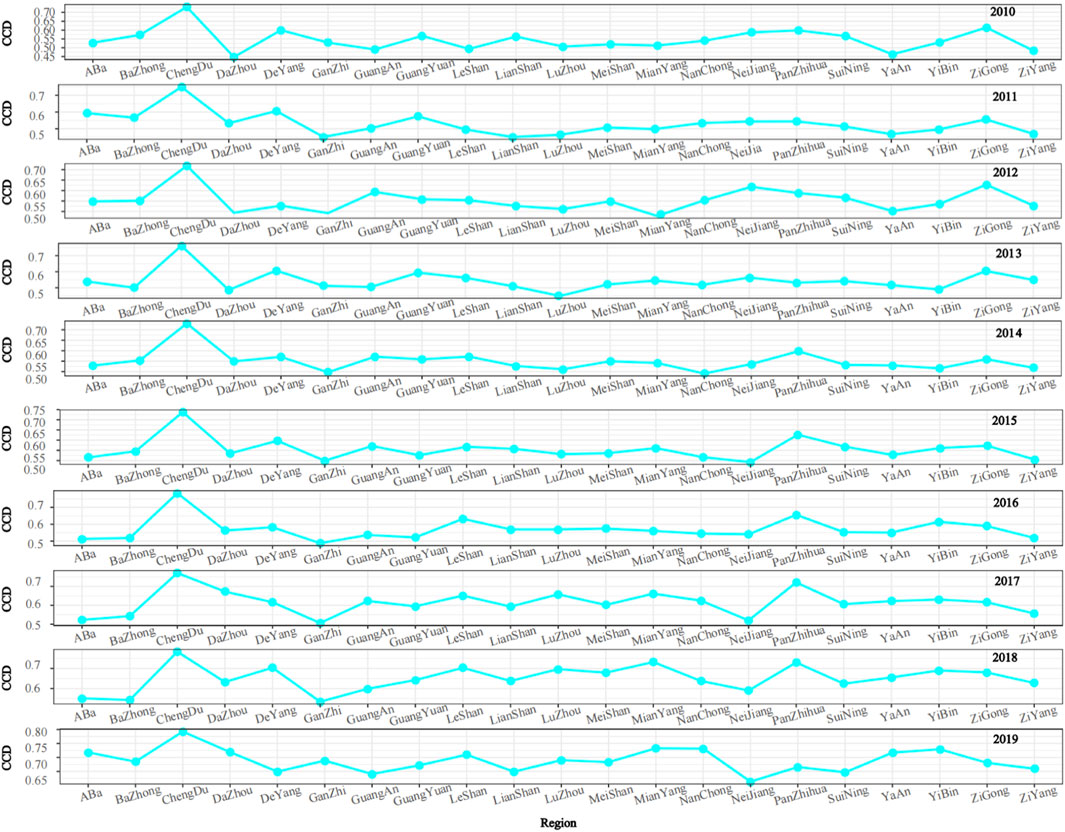
Figure 7. Coupling coordination trend graph.
From 2010 to 2014, the coordination capacity between WRCC and economic development and urbanization remained stable, belonging to level IV and III, and switching back and forth between the two states of basic coordination and imbalance. However, in 2014 most cities were in basic coordination among themselves, and only a very few cities, such as Nanchong City and Ganzi prefecture, were still in a state of imbalance, but soon changed this state in the following years. This also shows that since 2014 the coordination capacity between the three systems has entered a healthy and sustainable state.
From 2015 to 2019, the degree of coupling coordination between the three systems entered a healthy development trend and was overall in the two states of basic coordination. CCD of each year has some enhancement compared to the previous year and ushered in a larger enhancement in 2018–2019. In 2015–2017 most cities CCD status belonged to level III, the coupling coordination status is basic coordination, and there is a small amount of increase. However, in 2018–2019 the coupling coordination between the cities ushered in a large amount of increase, and the CCD status of most of the cities increased from level III to level II, and the coupling coordination status belongs to coordination. This also indicates that the coupling coordination capacity has officially entered healthy and sustainable development mode since 2015 and reached a coordinated status between the systems in 2018–2019.
According to the coupling level and the principle of equidistant division, the D value of the coupling coordination degree was divided into different states and marked with different colors. And the R language software was used to visualize and analyze the spatial evolution trend of the coupled coordination state of water resources in Sichuan Province from 2010 to 2019. Figure 8 Spatial shown evolution of coupling coordination level in 21 cities of Sichuan Province, the following evolution patterns can be derived.
(1) CCD of Chengdu City is the strongest in the whole Sichuan Province, and it is always at level II from 2010 to 2019, and the systems are in a coordinated state. This is attributed to Chengdu’s status as the economic hub of Sichuan Province, characterized by its advanced economic scale and comprehensive water resource management policies. For instance, Chengdu has effectively mitigated the pressure of urbanization on water resources through measures such as improving wastewater treatment rates, promoting water-saving technologies, and optimizing water resource allocation.
(2) In terms of city distribution, in 2010, five cities of Ya’an, Leshan, Ziyang, Guangan, and Dazhou were in an imbalance state, and the rest of the provinces were in basic coordination. In 2012 and 2014, the coordinating ability of these five cities was restored to basic coordination, but the coordinating ability of Ganzi, Mianyang, and Nanchong declined, and they were in an imbalance state. In the following years, the coupling coordination of the cities was improved, and in 2016, only Ganzi was in a state of imbalance. In 2018 and 2019, all the cities got rid of the state of imbalance, and the eight cities of Chengdu, Mianyang, Aba, Nanchong, Dazhou, Yaan, Leshan, and Yibin reached the CCD level of level II, and the systems reached the state of coordination between them. This is attributed to the implementation of the “Action Plan for Water Pollution Prevention and Control” in Sichuan Province in 2015, which has significantly improved CCD in various cities. In particular, in 2018–2019, all cities achieved coordination, indicating that policy intervention has an important role in improving CCD. The slow improvement of CCD in Garze and other areas is mainly due to the remote geographical location, weak economic foundation and difficult policy implementation.
(3) Based on the spatial distribution, it is clear that eastern Sichuan has a higher coupling coordination level than western Sichuan. Which is attributed to the strong economic base and water resources management ability of the eastern region. By implementing strict water conservation policies and promoting the development of green industries, these regions have effectively improved the coordination level of WRCC with urbanization and economic development. On the contrary, CCD in western Sichuan is relatively low, which is mainly limited by its relatively backward economy and insufficient water resources management ability. Although the region is rich in water resources, the coordination level with urbanization and economic development is weak due to the lack of effective management and technical support. Meanwhile, Chengdu-Mianyang-Yibin economic circle is larger than that of other regions. This reflects the synergistic effect of economic agglomeration and water resources management. These regions have achieved a balance between economic development and water resources protection through industrial upgrading and technological innovation.
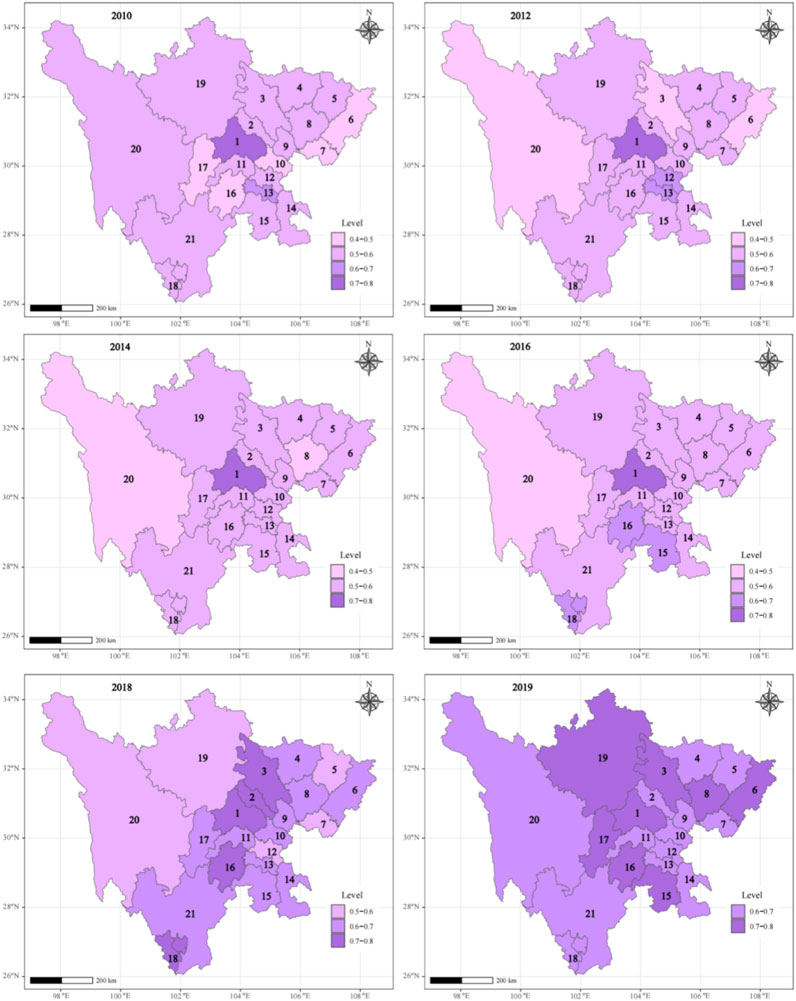
Figure 8. Spatial evolution of coupling coordination level in 21 cities of Sichuan Province. Note: 1-Chengdu, 2-Deyang, 3-Mianyang, 4-Guangyuan, 5-Bazhong, 6-Dazhou, 7-Guangan, 8-Nanchong, 9-Suining, 10-Ziyang, 11-Meishan, 12-Neijiang, 13-Zigong, 14-Luzhou, 15-Yibin, 16-Leshan, 17-Yaan, 18-Panzhihua, 19-Aba, 20-Ganzhi, 20-Liangshan.
Figures 9, 10 show the regression diagnostic results of the linear regression model and the polynomial regression model, respectively. As can be seen from the Q-Q residual plots, the residual distributions of both regressions are on a straight line at 45°, indicating that the residuals obey a normal distribution. The Scale-Location plot, the points around the horizontal line are randomly distributed, which suggests that the distributions of the residuals are roughly equal at all fitted values. This all indicates that both regression models are feasible. However, in the Residuals and Fitted distribution plot, the residual distribution of the linear regression model shows a clear quadratic relationship, which also indicates that the interrelationships between the variables should be incorporated into the linear model. For this reason, a polynomial regression model is used to incorporate the interrelationships between the three systems. Figure 10 shows the residual distribution of the polynomial regression model is on the y = 0 curve, which also indicates that incorporating the interrelationships between the variables results in a more accurate and stable model overall. Therefore, the polynomial regression model can be used to fit the mathematical relationship between CCD and WRCD, UL and EDL, and to analyze the effect of each system on CCD.
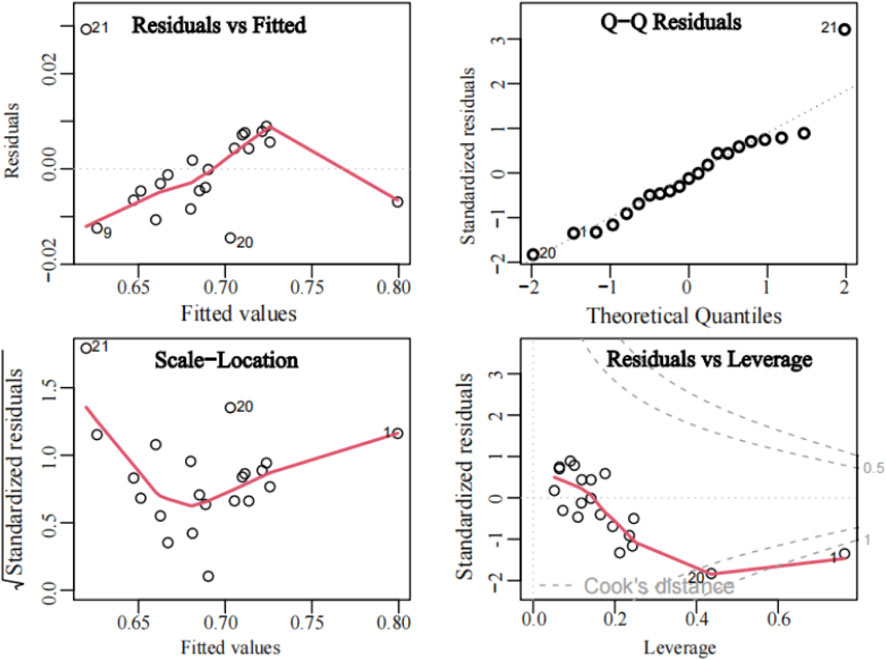
Figure 9. Diagnostic results of linear regression model.
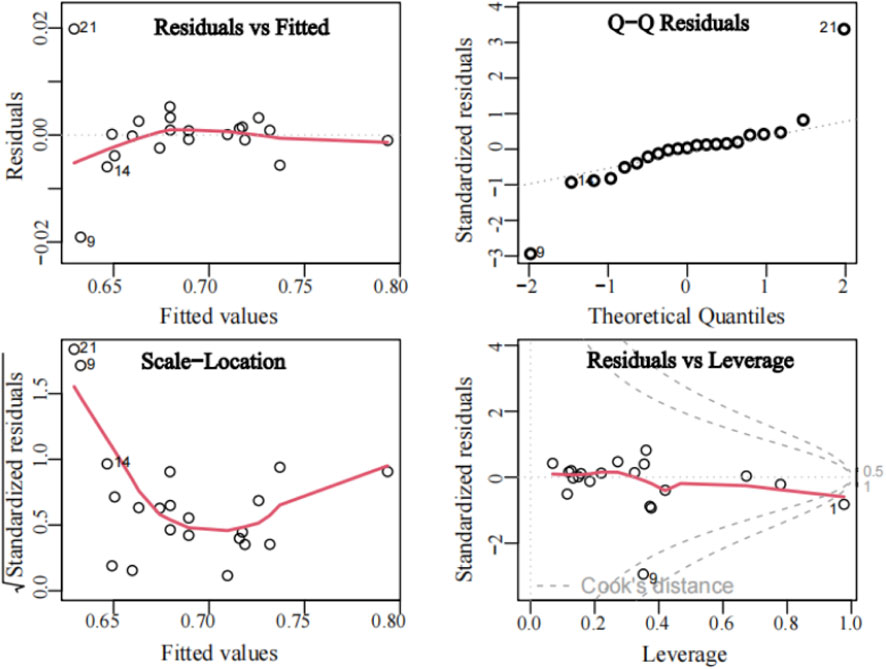
Figure 10. Polynomial regression model diagnostic results.
Although the polynomial regression model’s R-squared is 0.9731 and Adjusted R-squared is 0.9616, which are higher than the linear regression model, its RSE of 0.008 is also significantly lower than the linear regression model. Table 4 shows the estimation results of the two regression models. The F-Statistics and P-value show that both models passed the hypothesis test and confirmed the models’ significance. This also confirms that the polynomial regression model has better fitting effect.

Table 4. The Estimation Results of the two regression models.
Regression coefficients of the polynomial regression model indicate the coefficients of the individual systems x1, x2, and x3 are negative, and none of them pass the F-test. However, under the correlation between the systems, x1*x2, x1*x3, and x2*x3 all exhibit positive values, and all of them pass the F-test at the 0.01 level. This indicates that the interrelationships between the systems are statistically significant. This also confirms the conjecture in Section 3 that CCD is not singularly influenced by one system, but by three systems interacting with each other. However, these three systems influence CCD to different degrees. The value of x1*x3 is the largest at 0.7801, indicating that the combined level of WRCC and EDL is the main influence on CCD, and a 1% increase in the combined level of WRCC and EDL increases the level of CCD by 0.7359%. x2*x3 is the next largest at 0.7359, and x1*x2 is the smallest at 0.2565. WRCC, both in its interrelationship with EDL, and with UL, is the most important influence on CCD. Interrelationship with UL have a great influence on the CCD level, but the interrelationship between EDL and UL has a much smaller influence on the CCD level. This also indicates that WRCC is the most important influence on the level of coupled carrying capacity between these three systems. Therefore, with the swift progress of urbanization and economic advancement, the preservation of resources and environment became more and more important. To achieve a sustainable and harmonious development of water resources, economy, and urban areas, it is crucial to prioritize the conservation of water resources and mitigate the strain on them.
In order to further evaluate the sensitivity of the model to data disturbance and its stability on different data subsets, the sensitivity analysis and stability analysis of the regression model were carried out. The sensitivity analysis was carried out by variable perturbation method. Slight changes were made to the data of WRCC,EDL and UL respectively, and the performance indexes of the model were studied and compared with the original model. The data perturbation method was adopted at the variance 0.1 level and the variance 0.05 level. The stability analysis was performed using K-Fold Cross-Validation algorithm, and to compare the mean and variance of R-squared, RMSE and MAE for each fold. The K-Fold Cross-Validation adopts the method of 2-Fold, 3-Fold and 5-Fold. Table 5 shows detailed data of sensitivity analysis and stability analysis in each performance index.
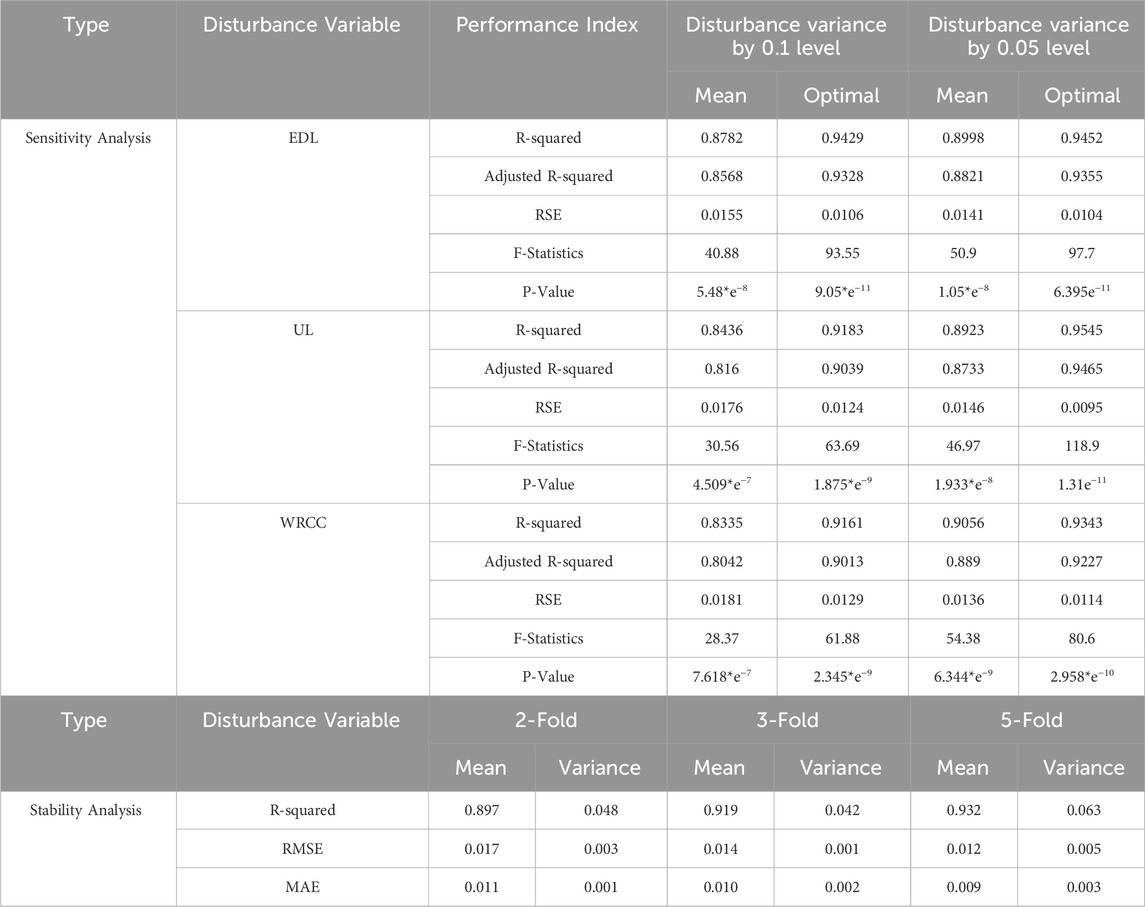
Table 5. Sensitivity analysis and stability analysis
On the one hand, in sensitivity analysis. The performance of the model under different disturbance levels has a certain robustness, but there is also a certain sensitivity. First of all, under the 0.1 level of variance disturbance, the model can still maintain a high R2, with the mean values of 0.878,0.843 and 0.833, respectively, but showing certain fluctuations. The RSE of model with WRCC disturbed is slightly higher than that of others. However, both F statistics and P values of the model show that the model still has statistical significance after perturbation, indicating that the model can still maintain good explanatory ability under large perturbations. Then, under the 0.05 level of variance disturbance, the performance of the model is improved, and the average value of R2 is increased, which is 0.899,0.892 and 0.905 respectively. The RSE was also reduced, the mean RSE falling to 0.014 with disturbance EDL, the mean RSE falling to 0.014 with disturbance UL, and the mean RSE falling to 0.013 with disturbance WRCC. This indicates that the performance of the model is more stable and has higher statistical significance under smaller perturbations. On the other hand, in stability analysis. With the increase of K value, the model’s R2 gradually increases, and the RMSE and MAE gradually decreases, indicating that the model’s performance is more stable on more data subsets. Especially in the 3-Fold and 5-Fold Cross-Validation, the performance of the model is ideal, and the fit degree and prediction error are stable. Although the variance of the 5-Fold Cross-Validation is slightly increased, the performance of the model on different data subsets is relatively consistent and has strong stability. In general, the regression models based on CCD, WRCC, EDL and UL have good performance and strong robustness and stability. Therefore, this model can be used to explain the influence mechanism between them scientifically.
By analyzing the spatio-temporal evolution of water resources carrying capacity (WRCC), urbanization level (UL), economic development level (EDL), and their coupling coordination degree (CCD), this study provides an important theoretical basis for formulating scientifically sound resource protection policies and high-quality development standards in Sichuan Province. This paper not only presents empirical research findings but also discusses the interaction mechanisms between WRCC, urbanization, and economic development from a theoretical perspective.
First, for the evaluation of WRCC, traditional studies focus on static evaluation using scientific index system. For example, Yuan et al. (2025) put forward a fuzzy logic evaluation model based on DPSIR framework, to achieve static evaluation and diagnosis of water security in the Mekong River basin. This study focuses on Dynamic Spatio-Temporal Analysis, which is more in line with the characteristics of urban water resources. Meantime, it is found that the levels of WRCC, UL, and EDL all exhibit a steady increasing trend year by year, which aligns with the findings of many scholars (Liu et al., 2022; He et al., 2024). Additionally, the status of water resources is the most critical component of the WRCC evaluation framework, with per capita water resources being the most significant evaluation index. This is consistent with the conclusions of Dong and Shen’s study (Dong et al., 2018). However, the increase in WRCC is relatively small and subject to significant fluctuations, primarily due to variations in annual precipitation. This volatility underscores the importance of adaptive management strategies to address climate change and ensure water sustainability.
Second, the interaction mechanism between Multi-System is revealed from the theoretical level. Most scholars focus on the coupled coordination and sustainability of the water resources system. For example, Peng et al. (2024) adopted the coupled coordination degree model (CCDM) to analyze the impact of the coupled coordination relationship among water quantity, water quality and water benefit on the evaluation of water sustainability, and water sustainability is emphasized through the lens of water footprint theory and water resources balance sheet. But this study focuses on Multi-System Synergy, capturing the dynamic interactions between water resources, urbanization, and economic development. This kind of multi-system synergy is crucial for regions like Sichuan, where rapid urbanization and economic growth are putting enormous pressure on water resources. Result showed that WRCC serves as a fundamental constraint on urbanization and economic development. Insufficient WRCC can lead to water shortages, restricting urban expansion and economic activities. Conversely, effective management and enhancement of WRCC can provide stable water security, supporting sustainable urbanization and economic development. On the other hand, urbanization and economic development exert significant pressure on WRCC. As cities expand and economic activities intensify, water demand rises, often resulting in overexploitation and pollution. This dynamic creates a feedback loop: urbanization and economic growth can weaken WRCC, while a declining WRCC limits further urbanization and economic development. The study also identifies trade openness and the proportion of the tertiary industry as the two most critical indicators of EDL. These findings support Gan et al. (2022) view that Sichuan Province’s economic structure is gradually shifting toward a more efficient, high-quality, and sustainable model. While increased trade openness may boost industrial activity and potentially strain water resources if not managed properly, the growing proportion of the tertiary industry, which consumes significantly less water than primary and secondary industries, can alleviate this pressure. Therefore, a theoretical analysis of how urbanization and economic development impact WRCC is crucial for formulating sustainable policies.
Finally, regarding the coupling coordination degree (CCD), the results indicate that all cities in Sichuan Province achieved coordinated development of WRCC, UL, and EDL during 2018–2019. This achievement is closely linked to the implementation of the Water Pollution Prevention Action Plan (2015) by the Sichuan Provincial Government. The polynomial regression model reveals that WRCC is the most significant factor influencing CCD, further emphasizing the critical role of water resources management in achieving coordinated development. Spatially, both WRCC and CCD exhibit distinct geographical characteristics, with the eastern region outperforming the western region. This disparity aligns with the economic and urban planning features of Sichuan Province. To address this spatial imbalance and promote coordinated development, the following recommendations are proposed.
(1) Optimize the spatial layout of urban planning and economic development: While maintaining Chengdu as the economic and urban center, increase support for urbanization and economic development in the western region. Actively promote industrial upgrading and transformation, encouraging high-water-consumption and high-pollution industries to transition to low-water-consumption sectors, thereby resolving the conflict between WRCC and urbanization/economic development.
(2) Strengthen water resources protection: Develop more scientific water use plans for production and domestic purposes in the developed urban agglomerations of the eastern region, coordinating the relationship between people, water, and urban development to ensure sustainable growth.
(3) Enhance technical measures: Given the significant impact of precipitation fluctuations on WRCC, improve urban rainwater collection and utilization systems, and strengthen sewage treatment and recycling to enhance water resource utilization efficiency.
Despite these important conclusions, this study has some limitations. First, although the WRCC evaluation index system includes three criterion layers—“state-pressure-response”—water resources constitute a complex coupled system, and additional factors such as government management and technological development also play a role. Therefore, the current framework may not be optimal. Second, the lack of projections for WRCC and CCD beyond 2020 limits the ability to provide more targeted policy recommendations. Future research should focus on developing more comprehensive evaluation frameworks and modeling the future evolution of WRCC, UL, EDL, and CCD to provide a scientific basis for long-term policy planning.
Sichuan province, as the southwest center and strategic hinterland of China. It is crucial to analyze the coordinated relationship among WRCC, urbanization and economic development. In this study, the PSR, SSO, and PES frameworks are used to establish comprehensive assessment models for WRCC, urbanization, and economic development respectively. Then, the coordination level of the three was evaluated using the coupled coordination degree model, and the evolution law of WRCC and coupled coordination degree was analyzed from time and space dimensions. Finally, the relationship between the three factors on CCD is verified by polynomial regression model. The research results enrich the theoretical basis of WRCC and coupling coordination in Southwest China, and provide scientific suggestions for high-quality and sustainable development of the region. The main research contributions are summarized as follows:
First, main influencing factors of WRCC: State layer is the most important influencing factor. At the index level, the most important evaluation indicators are A11, A13, A23 and A31.
Second, spatio-temporal evolution law of WRCC: From 2010 to 2019, WRCC showed a fluctuating upward trend, and reached its peak in 2018–2019, and the level of WRCC in various cities tended to be stable. The spatial evolution presents a pattern of “strong in the west, weak in the east, and stable in the middle”.
Third, the evolution law of coupling coordination degree: From 2010 to 2014, the coordination ability was poor, it will gradually enter the stage of coordinated development after 2015, and achieve full coordination in 2018–2019. In the Spatial evolution, the coordination ability of northeast region is significantly higher than that of western region.
Finally, The influence relationship of WRCC-UL-EDL on CCD: The influence of WRCC-UL-EDL on CCD meets the nonlinear polynomial regression model, and the goodness of fit is 0.97, indicating that the three have a synergistic influence on CCD rather than a separate effect. Among them, WRCC is the dominant factor, and its level significantly affects the regional coordination ability.
Research results reveals the coupling coordination relationship between WRCC, urbanization and economic development and its spatio-temporal evolution law, which provides a scientific basis for water resources management, urban planning and economic development in Sichuan Province and even Southwest China. The results show that the carrying capacity of water resources is the key constraint of regional coordinated development, and scientific management and protection of water resources is the basis of realizing high-quality urbanization and economic development. Future research directions will focus on improving the evaluation system and situational simulation: on the one hand, further optimize the comprehensive evaluation index system of WRCC, urbanization and economic development, especially including more dynamic indicators to enhance the prediction ability of the model. On the other hand, a long-term forecasting model and scenario simulation were constructed to analyze the evolution trends of WRCC, UL, EDL and CCD under different policy scenarios, and to study how to formulate differentiated water resources management and economic development strategies in view of the unbalanced development of the eastern and western parts of Sichuan Province.
The original contributions presented in the study are included in the article/Supplementary Material, further inquiries can be directed to the corresponding author.
QZ: Data curation, Formal Analysis, Methodology, Visualization, Writing–original draft, Writing–review and editing. HB: Conceptualization, Funding acquisition, Project administration, Supervision, Writing–original draft, Writing–review and editing. YW: Data curation, Methodology, Writing–original draft, Writing–review and editing. JH: Data curation, Formal Analysis, Writing–original draft, Writing–review and editing.
The author(s) declare that financial support was received for the research, authorship, and/or publication of this article. This research was supported by the key research and development project of Science and Technology Department of Sichuan Province: Research on improving the quality of Sichuan birth Canal medicinal materials based on digital twins (2024YFFK0191) and the Chunhui Project of the Chinese Ministry of Education (202201245).
The authors declare that the research was conducted in the absence of any commercial or financial relationships that could be construed as a potential conflict of interest.
The author(s) declare that no Generative AI was used in the creation of this manuscript.
All claims expressed in this article are solely those of the authors and do not necessarily represent those of their affiliated organizations, or those of the publisher, the editors and the reviewers. Any product that may be evaluated in this article, or claim that may be made by its manufacturer, is not guaranteed or endorsed by the publisher.
The Supplementary Material for this article can be found online at: https://www.frontiersin.org/articles/10.3389/fenvs.2025.1563946/full#supplementary-material
Ahmad, M., Ahmed, N., Jabeen, M., Jabeen, G., Qamar, S., Chandio, A. A., et al. (2020). Empirics on heterogeneous links among urbanization, the intensity of electric power consumption, water-based emissions, and economic progress in regional China. Environ. Sci. Pollut. Res. 27 (31), 38937–38950. doi:10.1007/s11356-020-09939-y
Bai, X., Shi, P., and Liu, Y. (2014). Society: realizing China's urban dream. Nature 509 (7499), 158–160. doi:10.1038/509158a
Chapagain, S. K., Aryal, A., Mohan, G., Malla, S. S., Mishra, B. K., and Fukushi, K. (2022). Analysis of the climate change impact on water availability and the links between water pollution and economy for sustainable water resource management in Kaski District, Nepal. J. Water Clim. Change 13 (8), 3030–3045. doi:10.2166/wcc.2022.105
Chen, M., Lu, D., and Zha, L. (2010). The comprehensive evaluation of China’s urbanization and effects on resources and environment. J. Of Geogr. Sci. 20 (1), 17–30. doi:10.1007/s11442-010-0017-0
Chen, M., Zhou, Q., Duan, W., Xue, Q., and Chen, C. (2023). Using an improved ecological footprint model to analyze the sustainable utilization of water resources in Beijing–Tianjin–Hebei region. Environ. Dev. Sustain. 25 (8), 8517–8538. doi:10.1007/s10668-022-02410-7
Deng, H., Yang, J., and Wang, P. (2023). Study on coupling coordination relationship between urban development intensity and water environment carrying capacity of chengdu–chongqing economic circle. Sustainability 15 (9), 7111. doi:10.3390/su15097111
Deng, Z., Dai, L., Deng, B., and Tian, X. (2021). Evaluation and spatial-temporal evolution of water resources carrying capacity in Dongting Lake Basin. J. Water Clim. Change 12 (5), 2125–2135. doi:10.2166/wcc.2021.210
Dong, G., Shen, J., Jia, Y., and Sun, F. (2018). Comprehensive evaluation of water resource security: case study from luoyang city, China. Water 10 (8), 1106. doi:10.3390/w10081106
Erostate, M., Huneau, F., Garel, E., Ghiotti, S., Vystavna, Y., Garrido, M., et al. (2020). Groundwater dependent ecosystems in coastal Mediterranean regions: characterization, challenges and management for their protection. Water Res. 172, 115461. doi:10.1016/j.watres.2019.115461
Frantzeskaki, N., McPhearson, T., and Kabisch, N. (2021). Urban sustainability science: prospects for innovations through a system's perspective, relational and transformations' approaches This article belongs to Ambio's 50th Anniversary Collection. Theme: urbanization. Ambio 50 (9), 1650–1658. doi:10.1007/s13280-021-01521-1
Gan, L., Yang, X., Chen, L., Lev, B., and Lv, Y. (2022). Optimization path of economy-society-ecology system orienting industrial structure adjustment: evidence from Sichuan province in China. Ecol. Indic. 144, 109479. doi:10.1016/j.ecolind.2022.109479
Gao, S. (2017). Study on the bearing capacity of water resources in urbanized area. Agro Food Ind. Hi-Tech. 28, 3026–3029.
Guo, B. S., Yu, H., and Jin, G. (2024). Urban green total factor productivity in China: a generalized Luenberger productivity indicator and its parametric decomposition. Sustain. Cities And Soc. 106, 105365. doi:10.1016/j.scs.2024.105365
He, D., Deng, X., Gao, Y., and Wang, X. (2025). How does digitalization affect carbon emissions in animal husbandry? A new evidence from China. Resour. Conservation Recycl. 214, 108040. doi:10.1016/j.resconrec.2024.108040
He, Y., and Wang, Z. (2022). Water-land resource carrying capacity in China: changing trends, main driving forces, and implications. J. Clean. Prod. 331, 130003. doi:10.1016/j.jclepro.2021.130003
He, Z., Liu, B., Liu, J., Xia, X., Han, S., Pan, K., et al. (2024). Research on the coupling effect of water security and socio-economy in five economic zones of Sichuan Province, China. Hydrology Res. 55 (8), 834–858. doi:10.2166/nh.2024.044
Hu, G., Wang, P., Rahman, S. M., Li, D., Alam, M. M., Zhang, J., et al. (2020). Vicissitudes experienced.by the oldest urban center in Bangladesh in relation to the migration of the Brahmaputra River. J. Quat. Sci. 35, 1089–1099. doi:10.1002/jqs.3240
Hwang, C. L., and Yoon, K. (1981). Multiple attribute decision making: methods and applications. New York: Springer-Verlag.
Jin, G., Deng, X. Z., Zhao, X. D., Guo, B. S., and Yang, J. (2018). Spatiotemporal patterns in urbanization efficiency within the Yangtze River Economic belt between 2005 and 2014. J. Of Geogr. Sci. 28 (8), 1113–1126. doi:10.1007/s11442-018-1545-2
Khorsandi, M., Bateni, M. M., and Van Oel, P. (2023). A mathematical meta-model for assessing the self-sufficient water resources carrying capacity across different spatial scales in Iran. Heliyon 9 (4), e15079. doi:10.1016/j.heliyon.2023.e15079
Kuspilic, M., Vukovic, Z., and Halkijevic, I. (2018). Assessment of water resources carrying capacity for the Island of Cres. Gradevinar 70 (4), 305–313. doi:10.14256/JCE.2167.2017
Li, J., Zhao, M., Han, Y., and Wei, J. (2023). Analysis of water resource ecological optimization and obstacles based on the water resources – socio – economic – ecological environment model framework – a case study of the core area of the Central Plains urban agglomeration. Front. Ecol. Evol. 11. doi:10.3389/fevo.2023.1263601
Li, W., Qi, J., Huang, S., Fu, W., Zhong, L., and He, B.-j. (2021). A pressure-state-response framework for the sustainability analysis of water national parks in China. Ecol. Indic. 131, 108127. doi:10.1016/j.ecolind.2021.108127
Li, Z., Chen, Y., Zhang, L. Y., Wang, W. J., and Wu, J. (2022). Coupling coordination and spatial-temporal characteristics of resource and environmental carrying capacity and high-quality development. Front. Environ. Sci. 10, 971508. doi:10.3389/fenvs.2022.971508
Liu, H., Xia, J., Zou, L., and Huo, R. (2022). Comprehensive quantitative evaluation of the water resource carrying capacity in Wuhan City based on the “human–water–city” framework: past, present and future. J. Clean. Prod. 366, 132847. doi:10.1016/j.jclepro.2022.132847
Liu, T., Yang, X., Geng, L., and Sun, B. (2020). A three-stage hybrid model for space-time analysis of water resources carrying capacity: a case study of Jilin province, China. Water 12 (2), 426. doi:10.3390/w12020426
Liu, Y., Gupta, H., Springer, E., and Wagener, T. (2008). Linking science with environmental decision making: experiences from an integrated modeling approach to supporting sustainable water resources management. Environ. Model. and Softw. 23 (7), 846–858. doi:10.1016/j.envsoft.2007.10.007
Liu, Y., Yang, R., Sun, M., Zhang, L., Li, X., Meng, L., et al. (2022). Regional sustainable development strategy based on the coordination between ecology and economy: a case study of Sichuan Province, China. Ecol. Indic. 134, 108445. doi:10.1016/j.ecolind.2021.108445
Luo, X., Cheng, C., Pan, Y., and Yang, T. (2022). Coupling coordination and influencing factors of land development intensity and urban resilience of the Yangtze River Delta urban agglomeration. Water 14 (7), 1083. doi:10.3390/w14071083
Lv, B., Liu, C., Li, T., Meng, F., Fu, Q., Ji, Y., et al. (2023). Evaluation of the water resource carrying capacity in Heilongjiang, eastern China, based on the improved TOPSIS model. Ecol. Indic. 150, 110208. doi:10.1016/j.ecolind.2023.110208
Nasrollahi, Z., Hashemi, M. S., Bameri, S., and Taghvaee, V. M. (2020). Environmental pollution, economic growth, population, industrialization, and technology in weak and strong sustainability: using STIRPAT model. Environ.Dev. Sustain. 22 (2), 1105–1122. doi:10.1007/s10668-018-0237-5
Ouma, Y. O., and Tateishi, R. (2014). Urban flood vulnerability and risk mapping using integrated multi-parametric AHP and GIS: methodological overview and case study assessment. Water 6 (6), 1515–1545. doi:10.3390/w6061515
Peng, Q. L., He, W. J., Kong, Y., Shen, J. Q., Yuan, L., and Ramsey, T. S. (2024). Spatio-temporal analysis of water sustainability of cities in the Yangtze River Economic Belt based on the perspectives of quantity-quality-benefit. Ecol. Indic. 160, 111909. doi:10.1016/j.ecolind.2024.111909
Pittock, J. (2011). National climate change policies and sustainable water management: conflicts and synergies. Ecol. Soc. 16 (2), 25. doi:10.5751/es-04037-160225
Sheng, K. H., Tang, Z. K., Sun, C., and Wang, S. Y. (2022). Comprehensive evaluation of water resources carrying capacity of Yangtze river economic belt based on Topis-Aism model. Environ. and Ecosyst. Sci. 6 (2), 57–64. doi:10.26480/ees.02.2022.57.64
Song, X. M., Kong, F. Z., and Zhan, C. S. (2011). Assessment of water resources carrying capacity in Tianjin city of China. Water Resour. manage. 25, 857–873. doi:10.1007/s11269-010-9730-9
Sui, G., Wang, H., Cai, S., and Cui, W. (2023). Coupling coordination analysis of resources, economy, and ecology in the Yellow River Basin. Ecol. Indic. 156, 111133. doi:10.1016/j.ecolind.2023.111133
Tan, S., Liu, Q., and Han, S. (2022). Spatial-temporal evolution of coupling relationship between land development intensity and resources environment carrying capacity in China. J. Environ. Manag. 301, 113778. doi:10.1016/j.jenvman.2021.113778
Wan, J. J., Li, Y. X., Ma, C. C., Jiang, T., Su, Y., Zhang, L. Q., et al. (2021). Measurement of coupling coordination degree and spatio-temporal characteristics of the social economy and ecological environment in the Chengdu-chongqing urbanagglomeration under high-quality development. Int. J. Environ. Res. Public Health. 18 (21), 11629. doi:10.3390/ijerph182111629
Wang, G. (2022). Evaluation and analysis of high quality economic development indicators by the analytic hierarchy process model. Sci. Program. 1, 1–8. doi:10.1155/2022/1042587
Wang, G., Xiao, C., Qi, Z., Meng, F., and Liang, X. (2021). Development tendency analysis for the water resource carrying capacity based on system dynamics model and the improved fuzzy comprehensive evaluation method in the Changchun city, China. Ecol. Indic. 122, 107232. doi:10.1016/j.ecolind.2020.107232
Wang, H., Huang, J., Zhou, H., Deng, C., and Fang, C. (2020). Analysis of sustainable utilization of water resources based on the improved water resources ecological footprint model: a case study of Hubei Province, China. J. Environ. Manag. 262, 110331. doi:10.1016/j.jenvman.2020.110331
Wang, X., Dong, Z., Xu, W., Luo, Y., Zhou, T., and Wang, W. (2019). Study on spatial and temporal distribution characteristics of coordinated development degree among regional water resources, social economy, and ecological environment systems. Int. J. Environ. Res. Public Health 16 (21), 4213. doi:10.3390/ijerph16214213
Wang, X., Liu, L., and Zhang, S. (2021). Integrated model framework for the evaluation and prediction of the water environmental carrying capacity in the Guangdong-Hong Kong-Macao Greater Bay Area. Ecol. Indic. 130, 108083. doi:10.1016/j.ecolind.2021.108083
Wang, X., Zhang, S., Gao, C., and Tang, X. (2024). Coupling coordination and driving mechanisms of water resources carrying capacity under the dynamic interaction of the water-social-economic-ecological environment system. Sci. Total Environ. 920, 171011. doi:10.1016/j.scitotenv.2024.171011
Water Pollution Prevention Action Plan (2015). Water Pollution Prevention Action Plan - China.org.cn. Beijing, China: The State Council of the People’s Republic of China; General Office of the State Council of China.
Yang, X. J., Sun, B. Y., Lei, S., Li, F. P., and Qu, Y. P. (2022). A bibliometric analysis and review of water resources carrying capacity using rene descartes's discourse theory. Front. Earth Sci. 10, 970582. doi:10.3389/feart.2022.970582
Yang, Z., Song, J., Cheng, D., Xia, J., Li, Q., and Ahamad, M. I. (2019). Comprehensive evaluation and scenario simulation for the water resources carrying capacity in Xi'an city, China. J. Environ. Manag. 230, 221–233. doi:10.1016/j.jenvman.2018.09.085
Yuan, L., Zhou, Z. J., He, W. J., Wu, X., Degefu, D. M., Cheng, J., et al. (2025). A fuzzy logic approach within the DPSIR framework to address the inherent uncertainty and complexity of water security assessments. Ecol. Indic. 170, 112984. doi:10.1016/j.ecolind.2024.112984
Zhang, K. L., Liu, T., Feng, R. R., Zhang, Z. C., and Liu, K. (2021). Coupling coordination relationship and driving mechanism between urbanization and ecosystem service value in large regions: a case study of urban agglomeration in Yellow River Basin, China. Int. J. Of Environ. Res. And Public Health 18 (15), 7836. doi:10.3390/ijerph18157836
Zhang, Z., He, W., An, M., Degefu, D. M., Yuan, L., Shen, J., et al. (2019). Water security assessment of China’s one belt and one road region. Water 11 (3), 607. doi:10.3390/w11030607
Zhang, Z., Yin, Z., Chen, Y., and Chen, J. (2022). Evaluation and prediction of water resources carrying capacity using a multiple linear regression model in Taizhou City, China. Hum. Ecol. Risk Assess. Int. J. 29 (2), 553–570. doi:10.1080/10807039.2022.2144998
Zhou, K. (2022). Comprehensive evaluation on water resources carrying capacity based on improved AGA-AHP method. Appl. Water Sci. 12 (5), 103. doi:10.1007/s13201-022-01626-2
Keywords: water resources carrying capacity, integrated model, spatial-temporal evolution, coupling coordination, sustainability, Sichuan province
Citation: Zhang Q, Bee H, Wang Y and He J (2025) Coupling coordination and sustainability among water resource carrying capacity, urbanization, and economic development based on the integrated model. Front. Environ. Sci. 13:1563946. doi: 10.3389/fenvs.2025.1563946
Received: 20 January 2025; Accepted: 03 March 2025;
Published: 19 March 2025.
Edited by:
Xueting Zeng, Capital University of Economics and Business, ChinaReviewed by:
Liang Yuan, China Three Gorges University, ChinaCopyright © 2025 Zhang, Bee, Wang and He. This is an open-access article distributed under the terms of the Creative Commons Attribution License (CC BY). The use, distribution or reproduction in other forums is permitted, provided the original author(s) and the copyright owner(s) are credited and that the original publication in this journal is cited, in accordance with accepted academic practice. No use, distribution or reproduction is permitted which does not comply with these terms.
*Correspondence: Hazirah Bee, aGF6aXJhaC5iZWVAY2l0eS5lZHUubXk=
Disclaimer: All claims expressed in this article are solely those of the authors and do not necessarily represent those of their affiliated organizations, or those of the publisher, the editors and the reviewers. Any product that may be evaluated in this article or claim that may be made by its manufacturer is not guaranteed or endorsed by the publisher.
Research integrity at Frontiers
Learn more about the work of our research integrity team to safeguard the quality of each article we publish.