
95% of researchers rate our articles as excellent or good
Learn more about the work of our research integrity team to safeguard the quality of each article we publish.
Find out more
ORIGINAL RESEARCH article
Front. Environ. Sci. , 21 March 2025
Sec. Environmental Economics and Management
Volume 13 - 2025 | https://doi.org/10.3389/fenvs.2025.1540671
This article is part of the Research Topic A Strategic Nexus for Enhancing System Resilience: Advancing Energy Efficiency, Reducing Carbon Emissions, Managing Water Resources, and Controlling Air Pollution in the Industrial Sector View all 4 articles
Introduction: The rapid urbanization and industrialization, accompanied by high-intensive population, energy consumption and transportation activities, have made air pollution an intractable environmental issue in China, especially in most megacities. This study identified the primary air pollutant (PAP) of a Chinese megacity—Chengdu, and analyzed the spatiotemporal changes of PAP concentrations.
Methods: The LMDI and GWR models were employed to probe the spatiotemporal drivers of air pollution in Chengdu.
Results and discussion: The pollutants of PM10, PM2.5, O3, and NO2 were identified as the PAPs of Chengdu. During the period of 2015∼2021, the concentrations of the four PAPs showed decreasing trends from 90.5 μg/m3, 56.7 μg/m3, 90.0 μg/m3, and 34.0 μg/m3 to 54.2 μg/m3, 33.7 μg/m3, 87.0 μg/m3, and 29.1 μg/m3, respectively. In 2021, the spatial distributions of the PAP concentrations were characterized by being higher in the central areas. The temporal changes in the PAP concentrations were conjointly influenced by population, per capita GDP, urban built-up area per unit GDP, greenery coverage rate, and pollution load intensity of greenery, with positive effects of population, per capita GDP, and greenery coverage rate and negative effects of urban built-up area per unit GDP and pollution load intensity of greenery. In spatial, the geographical factors (including temperature, precipitation, wind speed, cultivated area and vegetation coverage rate) and socio-economic factors both affected the PAP concentrations. However, there were spatial heterogeneities in the driving forces between different districts of Chengdu, due to the disparities in both the socio-economic and geographical context in different areas. This study also highlights possible policy implications for alleviating urban air pollution, and provides scientific insights for building the clean and livable urban environments for cities.
China has been achieving rapid population growth, increasing urbanization and industrialization, and sustained high-speed economic development since the reforms and opening-up. However, this “high growth with high pollution” pathway of socio-economic development has led to severe air pollution, which is becoming an intractable environmental challenge for China. In light of high-intensive population, energy consumption and transportation activities, such problem is particularly severe in cities (Ding and Fang, 2022; Shi et al., 2022; Zhang et al., 2024). According to the “China Ecological Environment Status Bulletin 2022”, the average concentration of fine particulate matter in 339 cities of China was 30 μg/m3 in 2021, greatly exceeding the health standard of 15 μg/m3 set by World Health Organization (WHO). The air pollution not only directly harms the environmental quality and human health, but also has a long-term impact on the sustainable development for cities.
Air pollution has always been put in the spotlight and attracted much attentions from research communities. A number of existing studies focus on the temporal changes of air pollution (An et al., 2023; Tan et al., 2023). For example, Zhou et al. (2023) investigated changes in concentrations of air pollutants (PM2.5, PM10, SO2, NO2, O3 and CO) across 368 cities in mainland China during 2015∼2018, results showed that the concentrations of these pollutants in cities exceeded the health limits, although they show decreasing trends during the study periods. Suthar et al. (2024) assessed the seasonal variations in the air pollutant concentrations in Bengaluru, and found most air pollutants show higher concentrations in winter. Besides, some studies highlight the spatial heterogeneities in air pollution between different regions, attributed to the spatial disparities in geographical conditions, meteorological characteristics, and sources of pollutants. For instance, Xu et al. (2020) indicated that the primary air pollutant (PAP) in northern China is PM2.5, largely caused by coal combustion and industrial production, by contrast, in southern China the PAP is O3, which is more closely linked to traffic emissions and photochemical reactions. At the city-level, Zhang K. et al. (2020) investigated the spatial differences in PM2.5 pollution between Beijing, Chengdu, Guangzhou, Shenzhen and Shenyang, the results indicated that the basin cities have higher PM2.5 than coastal cities. However, due to the lack of high-resolution data at district-level of a city, how the air pollution vary across different districts within the city is not clear.
With regard to the drivers of air pollution, current research examines how socio-economic factors, such as population size and gross domestic product (GDP), influence the air pollution (Wang Y. et al., 2022; Qiu et al., 2021). For example, Chang et al. (2018) adopted the Logarithmic Mean Divisia Index (LMDI) model to explore the influencing factors of industrial NOx and SO2 emissions in China, and results showed that energy intensity and economic growth are the main drivers of the increase in NOx and SO2 concentrations. Zhang et al. (2019) identified the key influencing factors of PM2.5 concentrations in 152 cities across East, Central, and West China using the LMDI method, and indicated that energy structure is the main inhibitory factor for PM2.5 concentrations, while economic growth and population density are the main promoting factors. In addition to socio-economic factors, air pollution may also be affected by regional natural geographical conditions. Some studies found that natural factors, such as terrain and meteorological conditions (e.g., wind speed, temperature, and precipitation), affect the dispersion and deposition of atmospheric pollutants (Liu H. et al., 2018; Zhao et al., 2021). Nevertheless, the existing studies has largely overlooked the role of natural geographical conditions in air pollution. There is also a lack of studies on how the factors driving air pollution vary in spatial, given diverse natural environments and socio-economic conditions across different districts within a city.
Chengdu is one of the 10 megacities of China. As a pivotal economic hub in western China, it has also experienced substantial growth in energy consumption and pollutant emissions as a result of its rapid urbanization and industrialization. During the periods from 2015 to 2021, the energy consumption of Chengdu increased from 1.27 × 10⁷ tons of standard coal to 2.07 × 10⁷ tons, by 69.5%, with the industrial sector contributing 32.2%. In 2021, the Air Quality Index (AQI) of Chengdu was 74, with a PM2.5 concentration of 39 μg/m3 that is two times higher than the WHO standard. What’s worse, the unique basin climate of Chengdu leads to poor conditions for dispersing air pollutants and limits the atmosphere’s ability to naturally cleanse itself. As a result, Chengdu is face with serious challenges in preventing and controlling air pollution. However, the spatiotemporal variations and drivers of air pollution in Chengdu megacity have not been investigated.
This study aims to: 1) analyze the air quality changes in Chengdu from 2015 to 2021, and identify the PAPs through comparing the Individual Air Quality Index (IAQI) values of various air pollutants; 2) evaluate the spatiotemporal variations of the PAP concentrations; 3) explore the spatiotemporal driving forces, consisted of socio-economic and geographical elements, of air pollution in Chengdu by the LMDI and Geographically Weighted Regression (GWR) models. This study provides a scientific basis for developing targeted air pollution control strategies. It not only facilitates to achieve the goal of Park City construction for Chengdu, but also offer insights for the development of clean and livable urban environments for other cities.
The Air Quality Index (AQI) serves as a comprehensive metric for assessing air quality. In according to the Ambient Air Quality Standard (GB3095-2012) (Ministry of Environmental Protection of China, 2012), AQI values are categorized into six levels, as illustrated in Table 1. A higher AQI value indicates a more severe level of air pollution.
The IAQI index is adopted to identify the PAPs in different seasons in Chengdu. The pollutant with the highest IAQI is the PAP. If two or more pollutants have the same highest IAQI, they are collectively recognized as the PAPs. For pollutant type n, the IAQIn was calculated by Equation 1:
where Cn represents the concentration of pollutant n; BPHi and BPLo are the high and low concentration breakpoints, respectively, from Table 1 that are closest to Cn; IAQIHi and IAQILo are the corresponding IAQIs for these breakpoints, as listed in Table 2. (For example, when the concentration of SO2 is 30 μg/m3, from Table 2, the BPHi and BPLo are 50 and 0 μg/m3, and the IAQIHi and IAQILo are 50 and 0, respectively).
The LMDI method is a favorable tool to quantify the contributions of different factors and identify the key driving forces. In this study, the LMDI model was used to analyze how the socio-economic development over time affect the PAP concentrations. The five typical socio-economic factors were included in this model, as population (P), per capita GDP (PCG), urban built-up area per unit of GDP (BAG), greenery coverage rate (GCR), and pollution load intensity of greenery (PLI). The core equation was calculated by Equation 2:
where P is the population; GDP indicates the gross domestic product; BA denotes the built-up area; and GA represents the green space area.
The change in Cn during periods of 0 to t (∆Cn) was calculated by Equation 3:
The contributions of each factor can be calculated by Equations 4-8:
The GWR model extends the traditional linear regression model by incorporating geographical information into the analysis. It enables capture local differences in spatial data (Nakamura, 2019). In this study, the GWR model was utilized to analyze the spatial variations in the factors driving air pollution between different districts of Chengdu. The geographical factors and socio-economic factors were both involved in this GWR model as shown in Table 3.
The expression for the GWR model is shown in Equation 9:
where yi represents the concentration of PAP i in the i-th district of Chengdu; (μi, υi) denotes the geographical coordinates of the i-th district; xik is the k-th factor in the i-th district; βk (μi, υi) is the impact degree of the k-th factor on the concentration variation of the PAP in the i-th district; εi is the error term; and n represents the total number of districts of Chengdu.
The regression parameter
where k represents the total number of factors included in the analysis; and wij is the spatial weight that can be calculated by Equation 15:
where b is the bandwidth; and dij denotes the distance between districts i and j.
The daily AQI and concentrations of the air pollutants (PM10, PM2.5, NO2, O3, SO2, and CO) of Chengdu were obtained from China Air Quality Online Monitoring Platform (https://air.cnemc.cn:18007/), and the daily AQI and pollutant concentrations of different districts within Chengdu were provided by Chengdu Academy of Environmental Sciences, with data spanning from 1 January 2015, to 31 December 2021. The socio-economic data involved in this study, including population, gross domestic product, the built-up area, the green space area, and the proportion of secondary industry, can be collected from the Chengdu Statistical Yearbook (Chengdu Municipal Bureau of Statistics, 2024). The geographical data, including temperature, precipitation, cultivated land area and vegetation coverage, were derived from the Chengdu Statistical Yearbook as well.
As shown in Figure 1, from 2015 to 2021, Chengdu’s AQI was on a downward slide, varying from 100 to 74. The share of days with good air quality improved from 59.73% to 82.19%. The share of days with light pollution was cut from 29.32% to 13.42%, while the moderate pollution days shrank to 4.11%. Heavy pollution days saw a significant drop to 0.27%. These trends indicate an improvement in air quality within the study period in Chengdu. The air quality also showed distinct seasonal patterns. For example, in 2021, the average AQI values were 71 in spring (March to May) and 58 in autumn (September to November), both indicating better air quality, largely due to favorable meteorological conditions. The moderate temperatures, precipitation and windy weather were conducive to the diffusion and removal of pollutants (Zhang J. et al., 2022). During the summer (June to August), there were occasional mild pollution episodes. There were the intensive industrial activities in Chengdu, supporting by the adequate hydropower. The high temperatures and strong solar radiation promoted the generation of ozone and other pollutants (Tan et al., 2018), but the high precipitation facilitated to decline the pollution concentrations. The winter months (December and January to February), however, had a period of poor air quality, characterized by a number of moderately and heavily polluted days. In the winter, energy consumption for heating led to higher emissions of air pollutants. What’s worse, the low wind speeds, temperature inversions and lack of precipitation further contributed to the buildup of particulate matter and poor air quality (Liao et al., 2017).
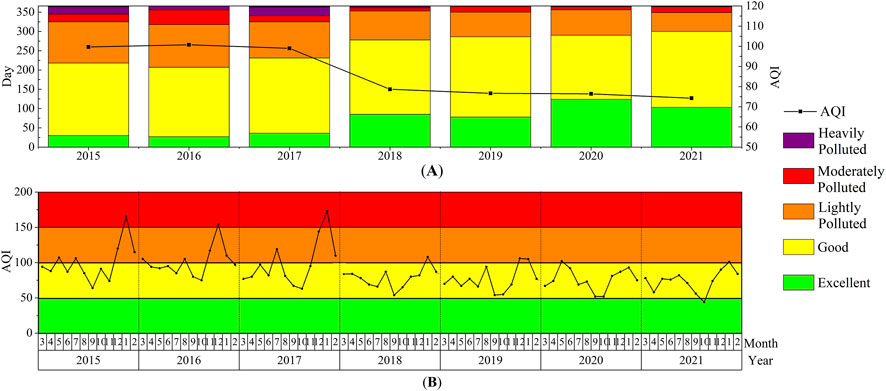
Figure 1. Changes of air quality from 2015 to 2021 in Chengdu. (A) Air quality. (B) Seasonal variation of AQI.
The pollutants of PM10, PM2.5, O3, and NO2, with higher IAQI values, were discerned as the PAPs of Chengdu (Figure 2). In winter, PM2.5 and PM10 were the main contributors to haze pollution. For example, in 2021, PM2.5 and PM10 had high IAQI values of 87 and 70, respectively. In addition, NO2 emerged as the PAP in September, with IAQI values of 62.5. During the spring and summer seasons, O3 became the PAP, with the highest IAQI of 133.
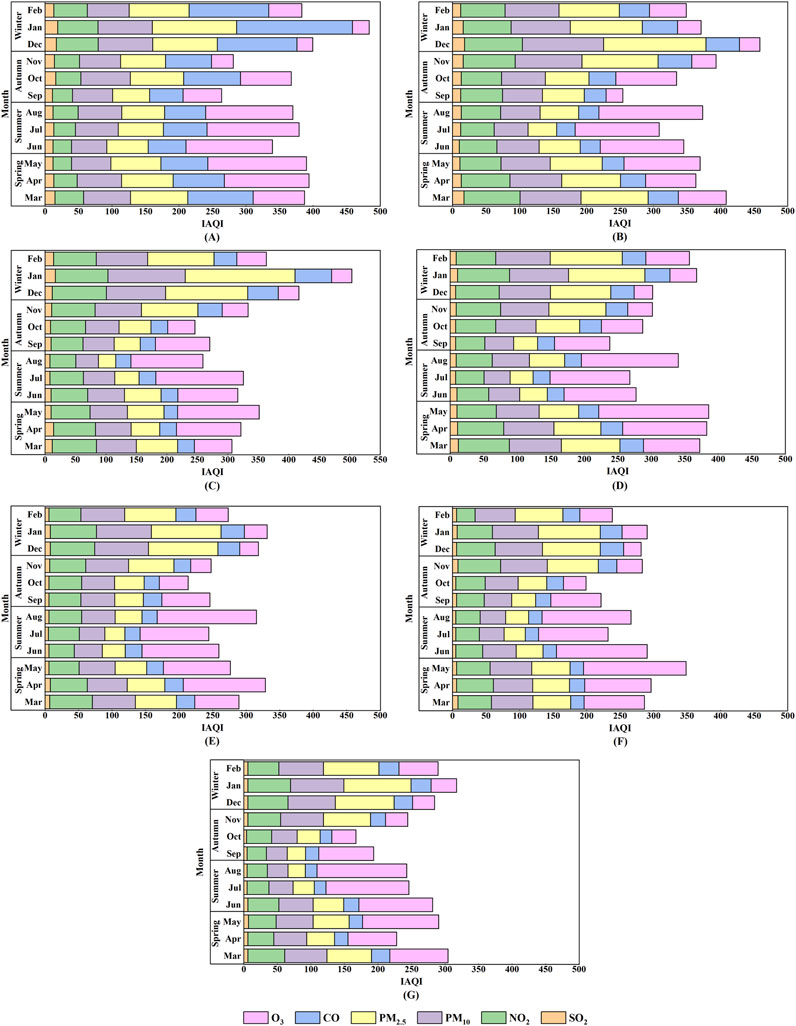
Figure 2. IAQI of different pollutants during 2015∼2021 in Chengdu. (A) 2015 (B) 2016 (C) 2017 (D) 2018 (E) 2019 (F) 2020 (G) 2021.
From 2015 to 2021, the annually average concentrations of PM2.5, PM10, NO2, and O3 all showed fluctuating downward trends (Figure 3). Such changes can be divided into three stages:
In the stage of 2015∼2016, the concentrations of all PAPs were at relatively high levels. The concentration of PM10 remained above 104.0 μg/m3. The concentrations of PM2.5, NO2, and O3 slightly increased and reached the peaks in 2016 at 63.0 μg/m3, 54.0 μg/m3, and 96.0 μg/m3, respectively. In 2016, the motor vehicles in Chengdu had reached 4.12 million, and the industrial output value increased to 52.02 billion yuan (Wu et al., 2017). The growing industrial production and transportation thereby generated a large amount of pollutants (Xiao et al., 2018). In the stage of 2016∼2018, the concentrations of all PAPs showed rapid downward trends, with PM2.5, PM10, NO2, and O3 decreasing from 63.0 μg/m3 to 45.0 μg/m3, from 105.0 μg/m3 to 71.0 μg/m3, from 54 μg/m3 to 44 μg/m3, and from 96 μg/m3 to 88 μg/m3, respectively. During this phase, Chengdu implemented a series of measures to alleviate air pollution, such as strictly controlling industrial emissions and optimizing the industrial structure, which substantially reduced the emissions of pollutants. In the stage of 2018∼2021, the decline in the PAP concentrations slowed down. Notably, the O3 concentration slightly rebounded after 2019, possibly due to the continuous increased transportation emissions, Chengdu had over 4.7 million cars in 2018, with an annual growth rate of more than 12% (Zhou et al., 2021). The vehicle exhaust is one of the main sources of volatile organic compounds (VOCs), which promotes the O3 generation without effective treatment measures (Wang et al., 2019; Yang et al., 2021).
As shown in Figure 4, the concentrations of PAPs in Chengdu exhibited significant spatial heterogeneities. In 2015, the central urban areas experienced higher concentrations of PM10 and PM2.5, compared with the surrounding areas. Specifically, Shuangliu District had the highest PM10 concentration at 110.3 μg/m3, while Dujiangyan District had the lowest at 69.0 μg/m3. For PM2.5, Wenjiang District and Pidu District had higher concentrations of 69.2 μg/m3 and 69.9 μg/m3, respectively. By contrast, Jianyang District and Dujiangyan District showed lower PM2.5 levels at 49.4 μg/m3 and 37.1 μg/m3, respectively. The distribution patterns of NO2 closely resembled those of particulate matter, with higher concentrations in the central urban areas and comparatively lower concentrations in the surrounding areas. The intensive population and socio-economic activities in the city center resulted in substantial energy consumption and pollutant emissions (Ning et al., 2018; Zhang X. et al., 2020). Furthermore, the construction activities in the central urban area became the primary emitter of NO2 and particulate matter (Cai et al., 2018). By contrast, the surrounding areas had higher O3 concentrations. In Chengdu, the chemical, pharmaceutical, and electronics manufacturing industries were mainly located in these areas. These industries emit NOx and VOCs, and then aggrandized the generation of O3 (Simayi et al., 2020).
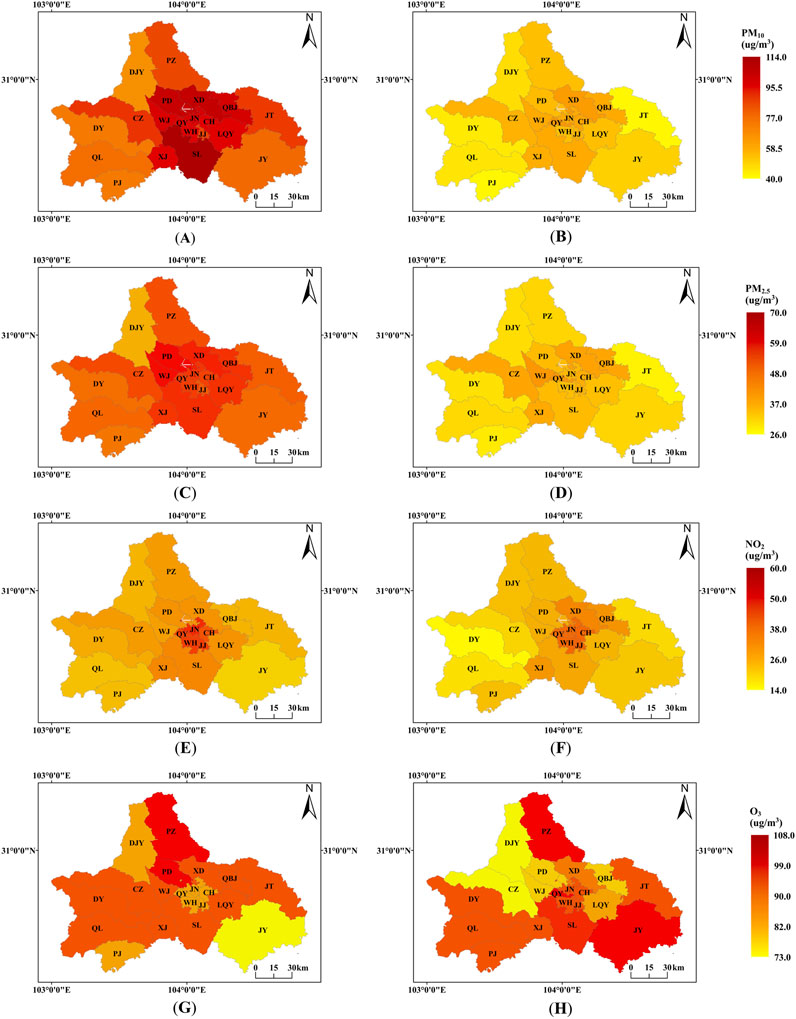
Figure 4. Spatial distributions of PAP concentrations in 2015 and 2021 in Chengdu. (A) 2015-PM10 (B) 2021-PM10 (C) 2015-PM2.5 (D) 2021-PM2.5 (E) 2015-NO2 (F) 2021-NO2 (G) 2015-O3 (H) 2021-O3. Note: The abbreviations in the figure correspond to the names of the districts of Chengdu, Chenghua (CH), Chongzhou (CZ), Dujiangyan (DJY), Dayi (DY), Jinjiang (JJ), Jinniu (JN), Jintang (JT), Jianyang (JY), Longquanyi (LQY), Pidu (PD), Pujiang (PJ), Pengzhou (PZ), Qingbaijiang (QBJ), Qionglai (QL), Qingyang (QY), Shuangliu (SL), Wuhou (WH), Wenjiang (WJ), Xindu (XD), and Xinjin (XJ).
In the year of 2021, the spatial distributions of PM10, PM2.5, and NO2 did not changed significantly, but the areas with higher O3 concentration shifted. Shuangliu District and Pengzhou District had the most severe O3 pollution, with the O3 concentrations in the two areas exceeding 91.0 μg/m3. With the expansion of Chengdu Shuangliu International Airport and the rapid growth of the aviation logistics industry, modern logistics and high-end manufacturing emerge in Shuangliu District, increasing NOx and VOC emissions and further contributing to ozone pollution. In order to reduce environmental pressures on the central city, Pengzhou District have begun accommodating the highly polluting industries of Chengdu, including chemical and building materials manufacturing units. The high VOC emissions from these industries brought about the high O3 concentration in Pengzhou (Zhang et al., 2022b).
During the entire period (2015∼2021), conjointly influenced by population, per capita GDP, urban built-up area per unit GDP, greenery coverage rate, and pollution load intensity of greenery, the concentrations of PM10, PM2.5, O3 and NO2 changed significantly. As illustrated in Figure 5, the urban built-up area per unit GDP and pollution load intensity of greenery showed negative effects on the PAP concentrations. The pollution load intensity of green space had the greatest inhibiting impacts. It cut down the concentrations of PM10, PM2.5, O3, and NO2 by 99.7 μg/m3, 56.0 μg/m3, 48.8 μg/m3, and 43.7 μg/m3, respectively. By contrast, the population, per capita GDP, and greenery coverage rate conduced to increase the PAP concentrations. The per capita GDP promoted the increases most. The contributions of this factor to the increases in PM10, PM2.5, O3, and NO2 concentrations were 31.3 μg/m3, 19.6 μg/m3, 45.8 μg/m3, and 18.2 μg/m3, respectively. During the periods of 2015∼2021, Chengdu actively developed high-tech and advanced manufacturing industries, as well as expanding the transportation and construction industries, which have contributed significantly to economic growth. However, these industries were also major sources of air pollutants (Yang et al., 2023). For instance, the rapid growth of the transportation has led to increased vehicular emissions, particularly for NO2 and PM2.5.
Figure 6 illustrates the varying effects of each factor at different time subsections. The contributions of population to PM2.5, PM10, O3, and NO2 were positive all the time, indicating that population growth consistently played a promotional role in the PAP emissions in Chengdu. From 2015 to 2016, The population of Chengdu grew by 10.26%, which intensified the impact on air pollution emissions. However, as the population growth rate slowed down since 2016, the influence of population on PAP emissions gradually decreased.
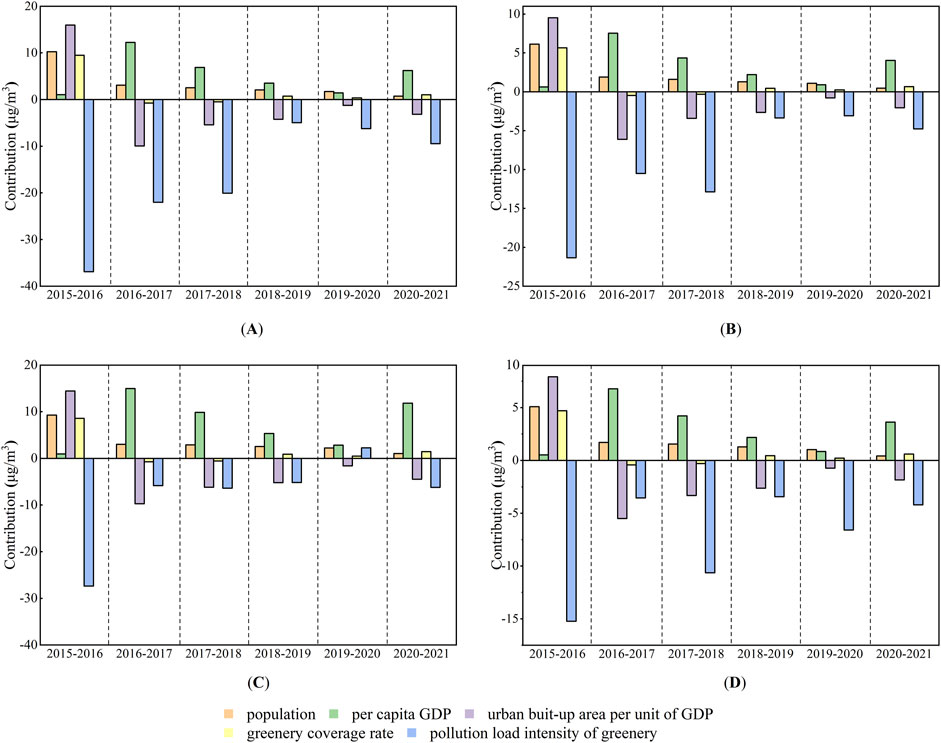
Figure 6. The contributions of various factors at different time subsections. (A) PM10 (B) PM2.5 (C) O3 (D) NO2.
Similar to population, the per capita GDP exhibited positive effects on the PAP concentrations across all time periods, suggesting the promotional role of economic growth in air pollution. This is attributed to the fact that economic growth is often accompanied by the development of industries and transportation, which leads to an increase in pollutant emissions (Liu L. et al., 2018). Particularly, manufacturing, construction, and the transportation sectors have seen significant growth in Chengdu, contributing heavily to pollution levels (Yang et al., 2023). However, the contribution degree varied over time. During 2015∼2016, the growth of per capita GDP in Chengdu was relatively slow, and thus it slightly promoted the increments in PAP concentrations. From 2016 to 2017, the contribution of per capita GDP was greater, with the growth rate of per capita GDP in Chengdu reaching 11.8%. From 2017 to 2020, the contribution of per capita GDP decreased year by year. In response to the “Three-Year Action Plan to Win the Blue Sky Defense War”, Chengdu implemented a set of measures such as industrial restructuring, strict control over high-emission industries, and the promotion of clean energy. These efforts aim to reduce pollutant emissions while balancing economic development with environmental protection. From 2020 to 2021, the contribution of per capita GDP increased again, for the reason that the production and consumption activities gradually resume in Chengdu after the COVID-19, which in turn cause a resurgence in pollutant emissions (Jin et al., 2023).
The impacts of urban built-up area per unit GDP on the PAP concentrations shifted from promotional to inhibiting effects. From 2015 to 2016, the expansion of construction land and the concentration of industries conduced to rising emissions of pollutants (Zhang et al., 2022c). However, after 2016, the urban built-up area per unit GDP had negative impacts on the PAP concentrations. Chengdu implemented industrial adjustment measures, including promoting the relocation of highly polluting and energy-intensive industries, and encouraging the development of high-value-added and low-pollution high-tech industries. These measures effectively reduce the emissions of various pollutants. Similar findings have been reported in the current studies, indicating that optimizing land use structures and improving land use efficiency can regulate the air pollution (Kuang et al., 2020; Lu et al., 2020).
The greenery coverage rate had dual effects on the PAP concentrations. During 2015∼2016, Chengdu actively implemented urban greening projects to increase urban green spaces. The construction of green infrastructures generated substantial amounts of dust and pollutants. However, the newly constructed green spaces offer limited adsorption and filtration effects on air pollutants at the beginning of construction, which is not able to offset the pollution generated by the construction activities (Li et al., 2018). Thus, during the early stage of green space construction, the greenery coverage rate showed positive effects on the PAP concentrations. During the period of 2016∼2018, the previously built green space grew up and began to cut down the air pollution, leading to the negative effects on the PAP concentrations. After 2018, the greenery coverage rate played the positive role again, due to the large-scale construction of green spaces and infrastructures in Chengdu.
The PLI presented continuously negative effects on the concentrations of PM10, PM2.5 and NO2 at different periods. This is because the green vegetations can capture the particulate matter and NOx (Wang C. et al., 2022; Bhandari and Zhang, 2022). Notably, the PLI slightly promoted the increases in O3 concentration during 2019∼2020, which is closely associated with the vegetation type and climate condition (Fowler et al., 2009; Nowak et al., 2006). Some plants, such as willow and eucalyptus, release the VOCs. During this periods, Chengdu has experienced frequent hot weather, facilitating the O3 genegration from the chemical reaction of VOCs.
Before the GWR analysis, the spatial autocorrelations and multicollinearity were tested. The results indicate the GWR model is suitable for this study (see the Supplementary Tables S1, S2 in the Supplementary Material for details).
Characterized by the positive regression coefficients, the socio-economic factors, including the proportion of secondary industry, GDP and population density, were identified as the promotional drivers of PM10 concentration in all districts of Chengdu (Supplementary Table S3). By contrast, the geographical factors, including precipitation, vegetation coverage rate, wind speed, temperature and cultivated area, had negative regression coefficients, indicating the inhibiting effects on PM10 concentration. In spatial (Figure 7), the impacts of socio-economic factors as population density, GDP, and the proportion of secondary industry all showed increasing trends from eastern to western districts, with corresponding regression coefficients of each factor ranging from 0.322 to 0.358, 0.072 to 0.120, and 0.146 to 0.153, respectively. This suggests the socio-economic factors had stronger impacts in the western districts. In the western areas, there are abundant industrial activities. For example, the mechanical manufacturing and building materials industry are concentrated in Chongzhou District, and the industries of Dayi District are characterized by textile manufacturing, food processing, and mechanical manufacturing (Wang X. et al., 2022). With regard to the geographical factors, the absolute values of regression coefficients of temperature, cultivated area and vegetation coverage rate increased from southern to northern districts, respectively, which demonstrates stronger effects of these factors in the norther districts. The negative effects of precipitation on the PM10 concentration were greater in western districts, according to the increasing absolute values of regression coefficients from eastern to western districts. The absolute values of regression coefficients of wind speed increased from western to eastern districts, showing greater inhabiting effects in the eastern districts.
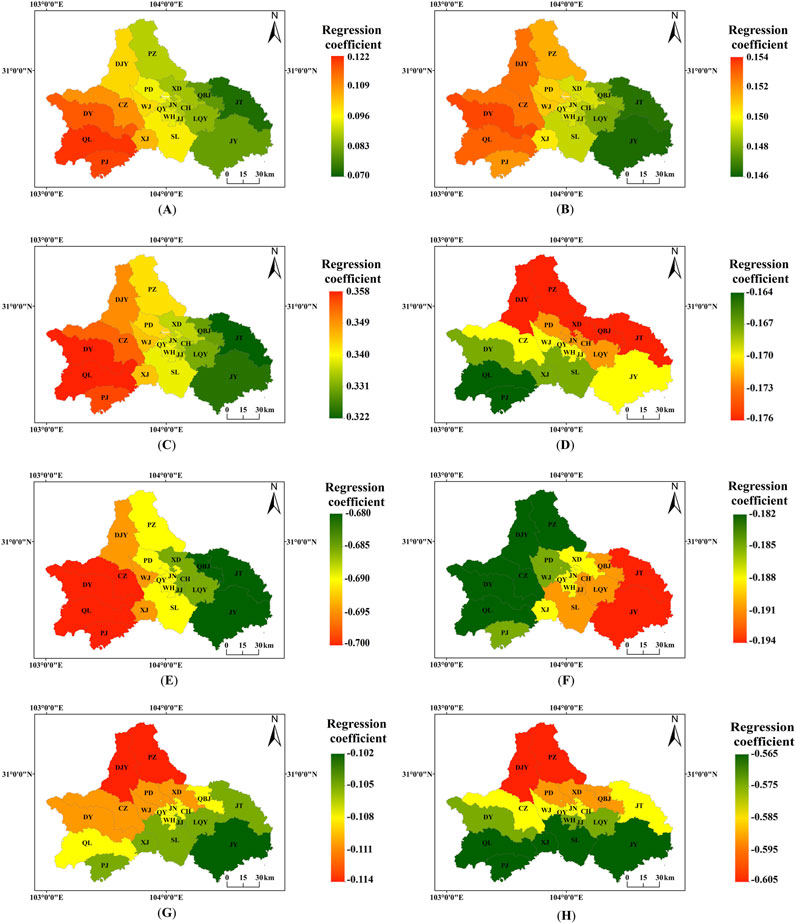
Figure 7. Spatial distribution of regression coefficients of various factors for PM10. (A) Population density (B) GDP (C) Proporation of secondary industry (D) Temperature (E) Precipitation (F) Wind speed (G) Cultivated area (H) Vegetation coverage rate.
Similar with PM10, the three socio-economic factors (population density, GDP, and the proportion of secondary industry) were the promotional drivers for PM2.5 concentration in all districts of Chengdu, while the five geographical factors (precipitation, temperature, wind speed, cultivated area, and vegetation coverage rate) including, had negative effects (Supplementary Table S4). This similarity between the driving factors for PM2.5 and PM10 concentrations is related to emission sources and physicochemical properties, with both consisting of a mixture of organic compounds, metals, and other particulate matter from common sources such as vehicle exhaust, industrial processes, and the combustion of fossil fuel (Xu et al., 2022). In spatial (Figure 8), the regression coefficients of population density, GDP, and proportion of secondary industry gradually increased from eastern to western districts, respectively, which indicated the stronger influences of these socio-economic factors in the western districts. Among these negative factors, except for the vegetation coverage rate, the regression coefficients of temperature, precipitation, wind speed and cultivated areas for PM2.5 showed the similar spatial distributions with that for PM10. Different with PM10, the vegetation coverage rate had greater inhabiting effects on PM2.5 concentration in the eastern districts. This difference may be attributed to the various vegetation types in each district, leading to the inconsistent adsorption capacities for particles of different sizes.
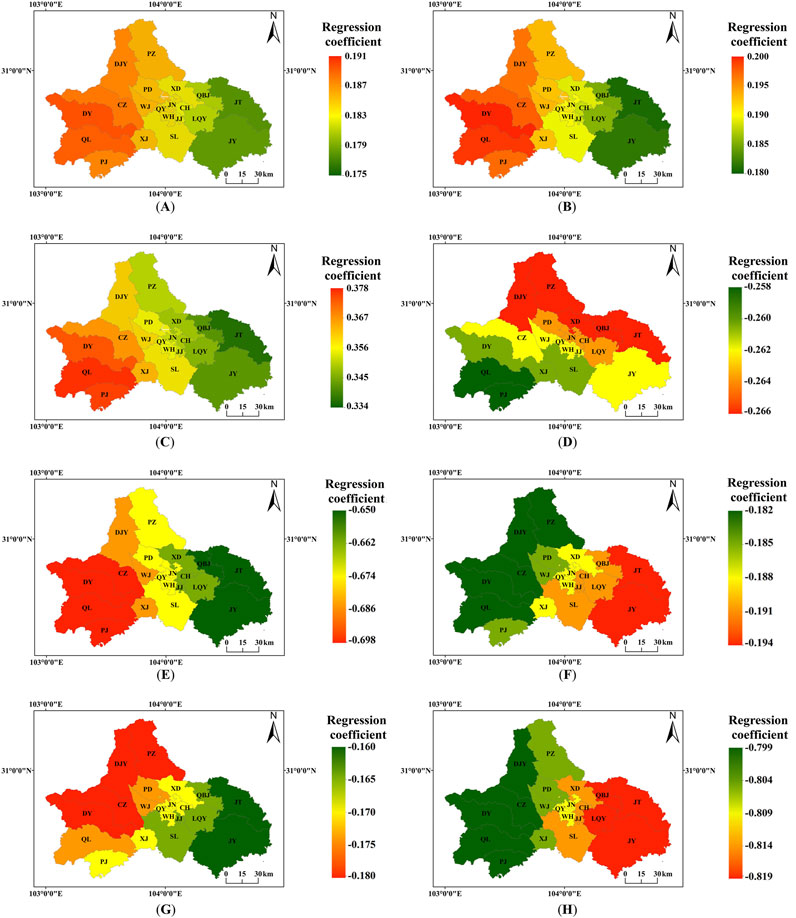
Figure 8. Spatial distribution of regression coefficients of various factors for PM2.5. (A) Population density (B) GDP (C) Proporation of secondary industry (D) Temperature (E) Precipitation (F) Wind speed (G) Cultivated area (H) Vegetation coverage rate.
In terms of O3, besides the three socio-economic factors, a geographical factor of temperature accelerated the pollutant concentration in all districts of Chengdu, with the positive regression coefficients of the above factors (Supplementary Table S5). Meanwhile, the other geographical factors (precipitation, wind speed, cultivated area and vegetation coverage rate) were favor of cutting down O3 concentration, with the negative regression coefficients. The Figure 9 illustrates the spatial distributions of the regression coefficients of all factors. Among the promotional drivers, the population density had greater impacts in the northwestern districts, the GDP and proportion of secondary industry had stronger impacts in the western districts. Among the negative factors, the precipitation and vegetation coverage rate presented greater influences in the western districts, while the wind speed and cultivated area had greater influences in the eastern districts.
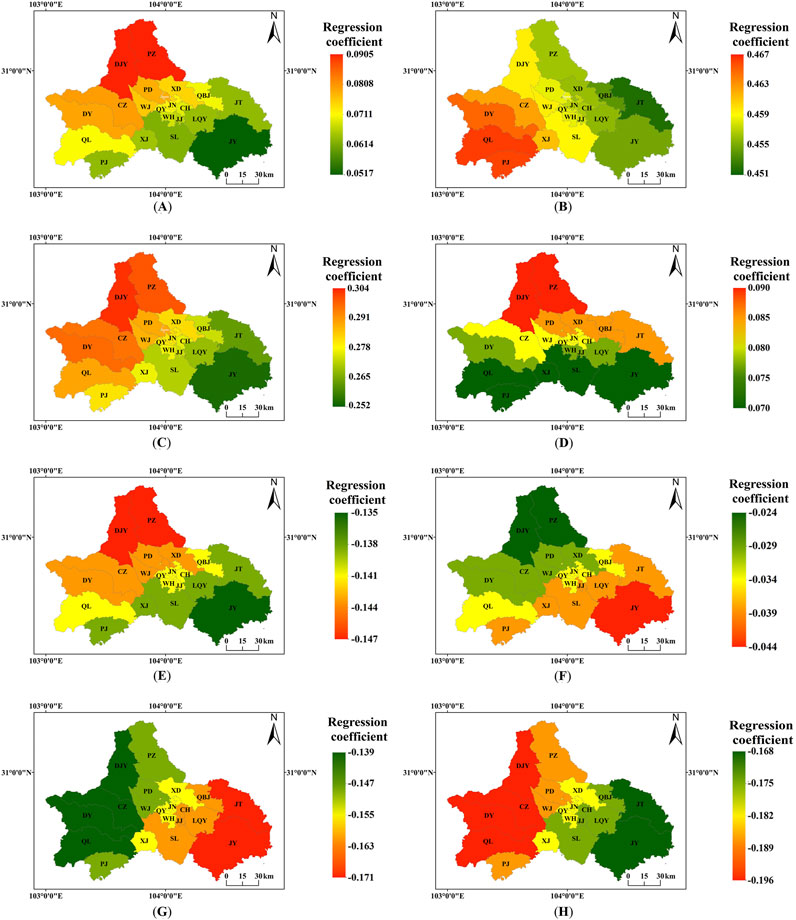
Figure 9. Spatial distribution of regression coefficients of various factors for O3. (A) Population density (B) GDP (C) Proporation of secondary industry (D) Temperature (E) Precipitation (F) Wind speed (G) Cultivated area (H) Vegetation coverage rate.
As shown in Supplementary Table S6, the three socio-economic factors (population density, GDP, and proportion of secondary industry) positively affected the NO2 concentration in all districts of Chengdu, while the five geographical factors of temperature, precipitation, wind speed, cultivated area, and vegetation coverage rate facilitated to decline NO2 concentration. The spatial distributions of the regression coefficients of these factors were shown in Figure 10. Among the three socio-economic factors, the impacts of population density and proportion of secondary industry all increased from southern to northern districts. However, the GDP had greater effects in the central districts. Among the five geographical factors, the absolute values of regression coefficients of the temperature showed the increasing trend from eastern to western districts, indicating that the warmer climate had greater influences on NO2 concentration in the western districts. The regression coefficients of precipitation aligned with that of particulate matter pollution, and this factor presented greater negative effects in the western districts, which may be related to the higher precipitation in the western districts. The absolute values of regression coefficients of wind speed exhibited the increasing trend from southwestern to northeastern districts, suggesting that the higher wind speed in the northeastern districts had the greater influence on NO2 concentration. The negative effects of vegetation coverage rate were stronger in the western districts.
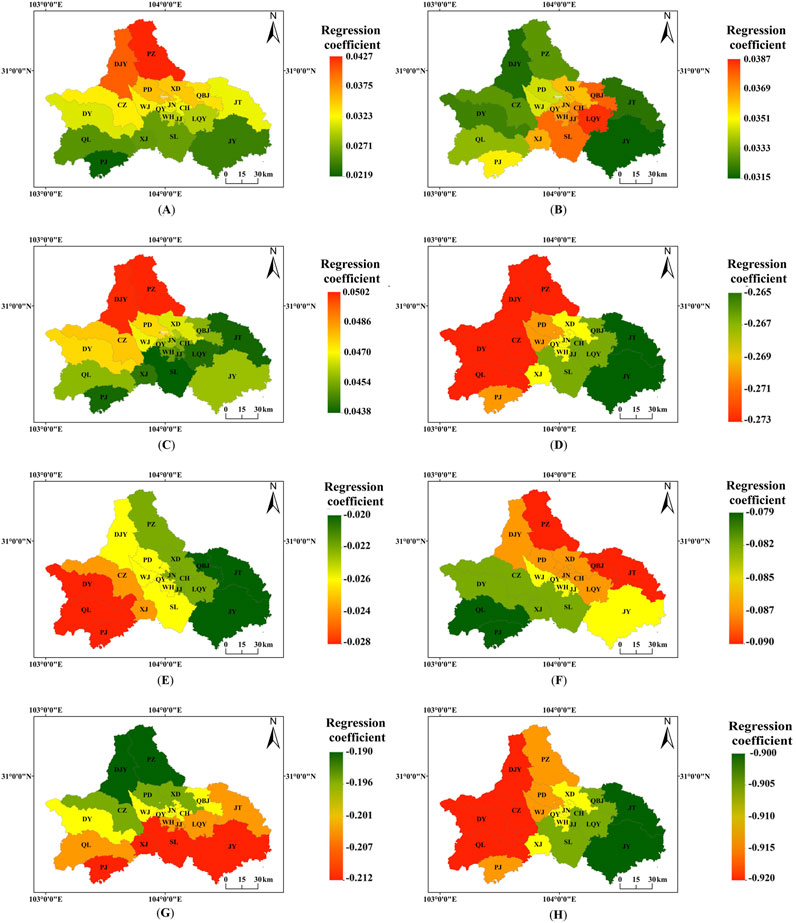
Figure 10. Spatial distribution of regression coefficients of various factors for NO2. (A) Population density (B) GDP (C) Proporation of secondary industry (D) Temperature (E) Precipitation (F) Wind speed (G) Cultivated area (H) Vegetation coverage rate.
The LMDI analysis illustrates that the population size and economic development have been the positive driver of the air pollution in Chengdu, because the population growth usually induces more intensive consumption and transportation activities, and the economic development is inevitably accompanied with substantial industrial production and energy consumption. By contrast, the pollution load intensity of greenery and urban built-up area per unit GDP facilitated to reduce the PAP concentrations in Chengdu. Interestingly, the greenery coverage rate showed both positive and negative effects on the PAP concentrations at some periods. Since the policy of Park City Construction, Chengdu have been implementing many urban greening projects (such as the Tianfu Greenway with a length of more than 8,000 km). The intensive constructions of urban green areas have led to eruptible pollutant emissions during a centralized phase, which cannot be offset by the limited clean-up effects of newly constructed green space. Thus, at the city-level, there are some effective measures can be taken to cut down the PAP concentrations: optimizing the industrial structure, and promoting the transformation of highly polluting industries to low-carbon patterns; developing the clean energy and green transportation system, and promoting the new energy vehicles and public transportation; implementing stricter industrial emission control policies and traffic emission standards. Equally important, the pollutant emissions induced by the urban greening projects should be paid more attention. For example, the wet work can be adopted in earthmoving process to avoid the raise dust during the construction of urban green infrastructures. Moreover, the strict green construction management and pollution control measures should be taken to deal with such pollution sources.
The results of GWR further described the spatial characteristics of driving force in each district within Chengdu, and complementally explained the effects of geographical factors. There were significant differences in the contributions of the socio-economic and geographical factors to the PAP concentrations between different districts. Due to the disparities of leading industrial types and local ecological context, the pollution load and the ability of the environment to purify pollutants varied in different districts. That highlights the importance of zoning control strategies for urban air pollution. The central districts of Chengdu have intensive socio-economic activities, mature service and high-tech industries. The implementation of green consumption and the development of green and low-carbon transportation system (e.g., new energy vehicles) will enable to effectively relieve the air pollution issue. For instance, the development of electric vehicle system and the promotion of clean energy-powered public transport could mitigate vehicular emissions (Liu et al., 2023). The western Chengdu is characterized by traditional manufacturing industries and abundant ecological resources. Those areas should promote the transformation of traditional industrial parks to ecological industries by developing clean technologies and eco-friendly manufacturing processes, and promote the integrated development of cultural tourism industry and green construction. The eastern Chengdu is in the developing stage, which concentrates the advanced manufacturing and logistic industries. Those areas should restrict the over-introduction of high-pollution, high-energy consumption and backward technology industries through implementing rigorous emissions standards and providing incentives for adopting clean technologies.
Additionally, the exploration of the effects of meteorological factors also provides some indicative implications for urban air pollution control. For example, the precipitation and temperature have significant effects on the PAP concentrations. Higher precipitation levels contribute to the reduction of PM10 and PM2.5 concentrations, while higher temperature may facilitate the formation of O3. Therefore, some targeted measures should be taken to address urban air pollution, according to the seasonal and meteorological conditions. During the high-temperature summer, the vehicle emissions and industrial emissions should be strictly controlled to reduce the O3 precursors, such as NOx and VOCs. During the dry seasons with less precipitation, efforts should be taken to lower the concentrations of particulate matter. Additionally, the early warning system based on real-time meteorological data will conduce to put forward advanced pollution control strategies.
During the period of 2015∼2021, the air quality of Chengdu improved, with the AQI decreased from 100 to 74. However, by 2021, the proportion of polluted days still reached 17.8% (about 65 days). The pollutants of PM10, PM2.5, O3, and NO2 were the PAPs in Chengdu, and the concentrations of them decreased over time. Meanwhile, the concentrations of these PAPs exhibited significant spatial heterogeneities. The PM10, PM2.5, and NO2 demonstrated higher concentrations in the central areas. The higher O3 concentration showed a spatial shift from the surrounding areas to center areas.
The decreased PAP concentrations in Chengdu were conjointly influenced by several factors, with positive effects of population, per capita GDP, and greenery coverage rate and negative effects of urban built-up area per unit GDP and pollution load intensity of greenery. Meanwhile, the GWR analysis found the geographical factors (e.g., precipitation and temperature), affected the PAP concentrations in Chengdu, as well as the socio-economic factors. In detail, the socio-economic factors (the proportion of secondary industry, GDP and population density) accelerated the increase of the PAP concentrations in all districts of Chengdu. The geographical factors of precipitation, wind speed, cultivated areas, and vegetation coverage rate had negative effects on the PAP concentrations, suggesting the self-purifying effects of the natural environment. Notably, the high temperature was conductive to the increase in O3 concentration. Furthermore, the contributions of each factor varied spatially between different districts of Chengdu, due to the disparities in both the socio-economic and geographical context in different areas.
Our findings provide indicative policy implications. At the city-level, the measures, including optimizing the industrial structure and promoting the transformation of highly polluting industries to low-carbon patterns, developing the clean energy and green transportation system, and avoiding the pollutant emissions from urban greening construction, can be taken to address the air pollution issue in Chengdu. Furthermore, more targeted measures toward zone control and seasonal control are urgently needed. These tailored management recommendations will facilitate to achieve the goal of Park City construction for Chengdu, and offer the scientific insights for the development of clean and livable urban environments for other cities.
Certainly, more research works are needed to gear into the effective strategies for air pollution control in cities. For instance, the high-resolution air pollutant emission inventory should be developed through refined source apportionment techniques, such as high-resolution remote sensing monitoring. It will facilitate to more accurately identify and classify different types of pollution sources, thereby supporting more precise air pollution control policies.
Publicly available datasets were analyzed in this study. This data can be found here: https://air.cnemc.cn:18007/. Data from the Chengdu Statistical Yearbook can be obtained from the website: https://cdstats.chengdu.gov.cn/cdstjj/c178732/list.shtml.
XX: Validation, Writing–review and editing, Formal Analysis, Writing–original draft. JQ: Data curation, Writing–original draft, Formal Analysis. RZ: Supervision, Writing–review and editing. PD: Software, Writing–original draft, Investigation. LZ: Visualization, Writing–original draft, Investigation.
The author(s) declare that financial support was received for the research, authorship, and/or publication of this article. Natural Science Foundation of Sichuan Province (2024NSFSC0880), the Open Fund of Sichuan Province Cyclic Economy Research Center (XHJJ-2304), the National Natural Science Foundation of China (41571520), the Sichuan Youth Science and Technology Innovation Team Funding (2022JDTD0005), Science and Technology Research and Development Program Project of China railway group limited (CRA 2022-Major-001, CRA 2023-Major-06) and Fundamental Research Funds for the Central Universities (2682024CX097, 2682021ZTPY088).
The authors declare that the research was conducted in the absence of any commercial or financial relationships that could be construed as a potential conflict of interest.
The author(s) declare that no Generative AI was used in the creation of this manuscript.
All claims expressed in this article are solely those of the authors and do not necessarily represent those of their affiliated organizations, or those of the publisher, the editors and the reviewers. Any product that may be evaluated in this article, or claim that may be made by its manufacturer, is not guaranteed or endorsed by the publisher.
The Supplementary Material for this article can be found online at: https://www.frontiersin.org/articles/10.3389/fenvs.2025.1540671/full#supplementary-material
An, Y., Dang, Y., Wang, J., Sun, J., and Feng, Y. (2023). Identification of heavily polluted areas based on a novel grey integrated incidence model: a case study of the Yangtze River Delta, China. Sust. Cities Soc. 92, 104466. doi:10.1016/j.scs.2023.104466
Bhandari, S., and Zhang, C. (2022). Urban green space prioritization to mitigate air pollution and the urban heat island effect in kathmandu metropolitan city, Nepal. Land 11 (11), 2074. doi:10.3390/land11112074
Cai, K., Zhang, Q., Li, S., Li, Y., and Ge, W. (2018). Spatial–Temporal variations in NO2 and PM2.5 over the Chengdu–Chongqing economic zone in China during 2005–2015 based on satellite remote sensing. Sensors 18 (11), 3950. doi:10.3390/s18113950
Chang, M., Zheng, J., Inoue, Y., Tian, X., Chen, Q., and Gan, T. (2018). Comparative analysis on the socioeconomic drivers of industrial air-pollutant emissions between Japan and China: insights for the further-abatement period based on the LMDI method. J. Clean. Prod. 189, 240–250. doi:10.1016/j.jclepro.2018.02.111
Chengdu Municipal Bureau of Statistics (2024). Chengdu statistical Yearbook. Available online at: https://cdstats.chengdu.gov.cn/cdstjj/c155010/list.shtml (Accessed July 1, 2024).
Ding, L., and Fang, X. (2022). Spatial–temporal distribution of air-pollution-intensive industries and its social-economic driving mechanism in Zhejiang Province, China: a framework of spatial econometric analysis. Environ. Dev. Sustain. 24 (2), 1681–1712. doi:10.1007/s10668-021-01503-z
Fowler, D., Pilegaard, K., Sutton, M. A., Ambus, P., Raivonen, M., Duyzer, J., et al. (2009). Atmospheric composition change: ecosystems–Atmosphere interactions. Atmos. Environ. 43, 5193–5267. doi:10.1016/j.atmosenv.2009.07.068
Jin, Q., Luo, Y., Meng, X., Feng, M., and Huang, C. (2023). Short-and long-term impacts of the COVID-19 epidemic on urban PM2.5 variations: evidence from a megacity, Chengdu. Atmos. Environ. 294, 119479. doi:10.1016/j.atmosenv.2022.119479
Kuang, B., Lu, X., Zhou, M., and Chen, D. (2020). Provincial cultivated land use efficiency in China: empirical analysis based on the SBM-DEA model with carbon emissions considered. Technol. Forecast. Soc. Chang. 151, 119874. doi:10.1016/j.techfore.2019.119874
Li, Y., Zhan, J., Liu, Y., Zhang, F., and Zhang, M. (2018). Response of ecosystem services to land use and cover change: a case study in Chengdu City. Resour. Conserv. Recycl. 132, 291–300. doi:10.1016/j.resconrec.2017.03.009
Liao, T., Wang, S., Ai, J., Gui, K., Duan, B., Zhao, Q., et al. (2017). Heavy pollution episodes, transport pathways and potential sources of PM2.5 during the winter of 2013 in Chengdu (China). Sci. Total Environ. 584, 1056–1065. doi:10.1016/j.scitotenv.2017.01.160
Liu, C., Liang, J., Li, Y., and Shi, K. (2023). Fractal analysis of impact of PM2.5 on surface O3 sensitivity regime based on field observations. Sci. Total Environ. 858, 160136. doi:10.1016/j.scitotenv.2022.160136
Liu, H., Fang, C., Zhang, X., Wang, Z., Bao, C., and Li, F. (2018a). The effect of natural and anthropogenic factors on haze pollution in Chinese cities: a spatial econometrics approach. J. Clean. Prod. 165, 323–333. doi:10.1016/j.jclepro.2017.07.127
Liu, L., Chen, Y., Wu, T., and Li, H. (2018b). The drivers of air pollution in the development of western China: the case of Sichuan province. J. Clean. Prod. 206, 1169–1176. doi:10.1016/j.jclepro.2018.06.260
Lu, D., Xu, J., Yue, W., Mao, W., Yang, D., and Wang, J. (2020). Response of PM2.5 pollution to land use in China. J. Clean. Prod. 244, 118741. doi:10.1016/j.jclepro.2019.118741
Ministry of Environmental Protection of China (2012). GB3095-2012. Ambient air quality standard. Beijing, China: China Environmental Science Press.
Nakamura, H. (2019). Relationship among land price, entrepreneurship, the environment, economics, and social factors in the value assessment of Japanese cities. J. Clean. Prod. 217, 144–152. doi:10.1016/j.jclepro.2019.01.201
Ning, G., Wang, S., Ma, M., Ni, C., Shang, Z., Wang, J., et al. (2018). Characteristics of air pollution in different zones of Sichuan Basin, China. Sci. Total Environ. 612, 975–984. doi:10.1016/j.scitotenv.2017.08.205
Nowak, D. J., Crane, D. E., and Stevens, J. C. (2006). Air pollution removal by urban trees and shrubs in the United States. Urban For. Urban Green. 4 (3-4), 115–123. doi:10.1016/j.ufug.2006.01.007
Qiu, W., He, H., Xu, T., Jia, C., and Li, W. (2021). The air quality changes and related mortality benefits during the coronavirus disease 2019 pandemic in China: results from a nationwide forecasting study. J. Clean. Prod. 308, 127327. doi:10.1016/j.jclepro.2021.127327
Shi, G., Lu, X., Zhang, H., Zheng, H., Zhang, Z., Chen, S., et al. (2022). Air pollutant emissions induced by rural-to-urban migration during China's urbanization (2005–2015). Env. Sci. Ecotechnol. 10, 100166. doi:10.1016/j.ese.2022.100166
Simayi, M., Shi, Y., Xi, Z., Li, J., Yu, X., Liu, H., et al. (2020). Understanding the sources and spatiotemporal characteristics of VOCs in the Chengdu Plain, China, through measurement and emission inventory. Sci. Total Environ. 714, 136692. doi:10.1016/j.scitotenv.2020.136692
Suthar, G., Singhal, R. P., Khandelwal, S., Kaul, N., Parmar, V., and Singh, A. P. (2024). Annual and seasonal assessment of spatiotemporal variation in PM2.5 and gaseous air pollutants in Bengaluru, India. Environ. Dev. Sustain. 26 (8), 20629–20652. doi:10.1007/s10668-023-03495-4
Tan, S., Xie, D., Ni, C., Zhao, G., Shao, J., Chen, F., et al. (2023). Spatiotemporal characteristics of air pollution in Chengdu-Chongqing urban agglomeration (CCUA) in Southwest, China: 2015–2021. J. Environ. Manage. 325, 116503. doi:10.1016/j.jenvman.2022.116503
Tan, Z., Lu, K., Jiang, M., Su, R., Dong, H., Zeng, L., et al. (2018). Exploring ozone pollution in Chengdu, southwestern China: a case study from radical chemistry to O3-VOC-NOx sensitivity. Sci. Total Environ. 636, 775–786. doi:10.1016/j.scitotenv.2018.04.286
Wang, C., Guo, M., Jin, J., Yang, Y., Ren, Y., Wang, Y., et al. (2022b). Does the spatial pattern of plants and green space affect air pollutant concentrations? Evidence from 37 garden cities in China. Plants 11 (21), 2847. doi:10.3390/plants11212847
Wang, J., Yang, Y., Zhang, Y., Niu, T., Jiang, X., Wang, Y., et al. (2019). Influence of meteorological conditions on explosive increase in O3 concentration in troposphere. Sci. Total Environ. 652, 1228–1241. doi:10.1016/j.scitotenv.2018.10.228
Wang, X., Yin, S., Zhang, R., Yuan, M., and Ying, Q. (2022c). Assessment of summertime O3 formation and the O3-NOX-VOC sensitivity in Zhengzhou, China using an observation-based model. Sci. Total Environ. 813, 152449. doi:10.1016/j.scitotenv.2021.152449
Wang, Y., Wang, Y., Xu, H., Zhao, Y., and Marshall, J. D. (2022a). Ambient air pollution and socioeconomic status in China. Environ. Health Perspect. 130 (6), 067001. doi:10.1289/EHP9872
Wu, Y., Zhang, S., Hao, J., Liu, H., Wu, X., Hu, J., et al. (2017). On-road vehicle emissions and their control in China: a review and outlook. Sci. Total Environ. 574, 332–349. doi:10.1016/j.scitotenv.2016.09.040
Xiao, K., Wang, Y., Wu, G., Fu, B., and Zhu, Y. (2018). Spatiotemporal characteristics of air pollutants (PM10, PM2.5, SO2, NO2, O3, and CO) in the inland basin city of Chengdu, southwest China. Atmosphere 9 (2), 74. doi:10.3390/atmos9020074
Xu, L., Zhong, X., Chen, F., Ye, R., Wu, X., Deng, J., et al. (2020). Spatiotemporal disequilibrium and spillover effect of fine particulate matter across China. Sci. Total Environ. 704, 135422. doi:10.1016/j.scitotenv.2019.135422
Xu, W., Wang, Y., Sun, S., Yao, L., Li, T., and Fu, X. (2022). Spatiotemporal heterogeneity of PM2.5 and its driving difference comparison associated with urbanization in China’s multiple urban agglomerations. Environ. Sci. Pollut. Res. 29, 29689–29703. doi:10.1007/s11356-021-17929-x
Yang, F., Shi, L., and Gao, L. (2023). Probing CO2 emission in Chengdu based on STRIPAT model and Tapio decoupling. Sust. Cities Soc. 89, 104309. doi:10.1016/j.scs.2022.104309
Yang, X., Wu, K., Lu, Y., Wang, S., Qiao, Y., Zhang, X., et al. (2021). Origin of regional springtime ozone episodes in the Sichuan Basin, China: role of synoptic forcing and regional transport. Environ. Pollut. 278, 116845. doi:10.1016/j.envpol.2021.116845
Zhang, J., Liu, Q., Chen, L., Li, H., Zhao, R., Huang, X., et al. (2022a). Interannual evolution of elemental carbon-containing particles in winter in the atmosphere of Chengdu, China. Sci. Total Environ. 804, 150133. doi:10.1016/j.scitotenv.2021.150133
Zhang, K., Zhao, C., Fan, H., Yang, Y., and Sun, Y. (2020a). Toward understanding the differences of PM2.5 characteristics among five China urban cities. Asia Pac. J. Atmos. Sci. 56, 493–502. doi:10.1007/s13143-019-00125-w
Zhang, L., Xu, X., Zhang, Y., Zhang, X., Wu, J., Sheng, X., et al. (2024). Characteristics of air pollution complex in a typical chemical industrial development zone in eastern China. Atmos. Environ. 319, 120274. doi:10.1016/j.atmosenv.2023.120274
Zhang, X., Chen, L., and Yuan, R. (2020b). Effect of natural and anthropic factors on the spatiotemporal pattern of haze pollution control of China. J. Clean. Prod. 251, 119531. doi:10.1016/j.jclepro.2019.119531
Zhang, Y., Shuai, C., Bian, J., Chen, X., Wu, Y., and Shen, L. (2019). Socioeconomic factors of PM2.5 concentrations in 152 Chinese cities: decomposition analysis using LMDI. J. Clean. Prod. 218, 96–107. doi:10.1016/j.jclepro.2019.01.322
Zhang, Y., Tian, Q., Feng, X., Hu, W., Ma, P., Xin, J., et al. (2022c). Modification effects of ambient temperature on ozone-mortality relationships in Chengdu, China. Environ. Sci. Pollut. Res. 29 (48), 73011–73019. doi:10.1007/s11356-022-20843-5
Zhang, Y., Wang, L., Tang, Z., Zhang, K., and Wang, T. (2022b). Spatial effects of urban expansion on air pollution and eco-efficiency: evidence from multisource remote sensing and statistical data in China. J. Clean. Prod. 344, 132973. doi:10.1016/j.jclepro.2022.132973
Zhao, S., Liu, S., Hou, X., Sun, Y., and Beazley, R. (2021). Air pollution and cause-specific mortality: a comparative study of urban and rural areas in China. Chemosphere 262, 127884. doi:10.1016/j.chemosphere.2020.127884
Zhou, X., Zhang, X., Wang, Y., Chen, W., and Li, Q. (2023). Spatio-temporal variations and socio-economic drivers of air pollution: evidence from 332 Chinese prefecture-level cities. Atmos. Pollut. Res. 14 (6), 101782. doi:10.1016/j.apr.2023.101782
Keywords: air pollution, megacity, spatiotemporal heterogeneity, socio-economic factors, geographical factors
Citation: Xiong X, Qiu J, Zhao R, Du P and Zhao L (2025) Spatiotemporal heterogeneities and drivers of air pollution in Chinese megacity: a case study of Chengdu. Front. Environ. Sci. 13:1540671. doi: 10.3389/fenvs.2025.1540671
Received: 06 December 2024; Accepted: 04 March 2025;
Published: 21 March 2025.
Edited by:
Saige Wang, University of Science and Technology Beijing, ChinaReviewed by:
Si Dai Guo, Southwest University of Science and Technology, ChinaCopyright © 2025 Xiong, Qiu, Zhao, Du and Zhao. This is an open-access article distributed under the terms of the Creative Commons Attribution License (CC BY). The use, distribution or reproduction in other forums is permitted, provided the original author(s) and the copyright owner(s) are credited and that the original publication in this journal is cited, in accordance with accepted academic practice. No use, distribution or reproduction is permitted which does not comply with these terms.
*Correspondence: Rui Zhao, cnVpemhhb0Bzd2p0dS5lZHUuY24=
Disclaimer: All claims expressed in this article are solely those of the authors and do not necessarily represent those of their affiliated organizations, or those of the publisher, the editors and the reviewers. Any product that may be evaluated in this article or claim that may be made by its manufacturer is not guaranteed or endorsed by the publisher.
Research integrity at Frontiers

Learn more about the work of our research integrity team to safeguard the quality of each article we publish.