 Yaling Xu
 Guozhu Yang3
 Junting Guo
 Chengye Zhang
94% of researchers rate our articles as excellent or good
Learn more about the work of our research integrity team to safeguard the quality of each article we publish.
Find out more
ORIGINAL RESEARCH article
Front. Environ. Sci. , 11 March 2025
Sec. Environmental Informatics and Remote Sensing
Volume 13 - 2025 | https://doi.org/10.3389/fenvs.2025.1531424
The direct removal of surface vegetation during surface coal mining has a negative impact on the surrounding ecological environment. Effective vegetation restoration is essential to mitigate these impacts. Therefore, accurate monitoring and assessment of vegetation restoration following mining disturbance is critical for ecological protection in mining areas. This study employs the Detecting Breakpoints and Estimating Segments in Trend (DBEST) to map the historical patterns of vegetation disturbance and subsequent recovery at the Shendong coal base. This is the first large-scale application of DBEST for such purposes. To examine the spatio-temporal trends in post-mining vegetation restoration, the Years to Recovery (Y2R) and amount of NDVI recovery were calculated based on the Normalized Difference Vegetation Index (NDVI) time-series. The results show that the DBEST has an accuracy of 0.90 in detecting vegetation destruction and 0.78 in detecting restoration. These findings highlight the substantial potential of this algorithm for monitoring vegetation disturbance in mining areas. The total area of vegetation destruction within the Shendong coal base is 449.65 km2, and the restoration area is 156.62 km2. Between 1992 and 2017, 46.90% of the disturbed areas achieved 80% of the pre-mining vegetation level, exceeding the average restoration level in China. The average Y2R was 4.68 years. Furthermore, NDVI restoration showed an initial increase followed by a decline with longer Y2R values, suggesting that while early restoration efforts were more effective, long-term restoration efficiency decreased. This finding emphasizes the necessity of concentrating on the restoration process at each stage of the planning and implementation of revegetation projects, particularly regarding the difficulties associated with long-term restoration. This is crucial for the development of more comprehensive and sustainable strategies.
As one of the world’s most significant energy resources, coal plays a crucial role in the global energy structure (Bilgen, 2014; Sun et al., 2020; Ming et al., 2024). The acceleration of industrialization and urbanization has led to an increased demand for coal, driving the development and utilization of coal resources on a global scale (Li et al., 2022). However, coal mining, particularly surface mining, has significantly disrupted surface ecosystems and adversely affected vegetation (Fang et al., 2021; Mason et al., 2021; Li et al., 2023). To effectively address the ecological impacts of coal mining, monitoring the spatio-temporal processes of vegetation disturbance have become a major focus for governments and scholars (Johansen et al., 2019; Ali et al., 2022). A thorough analysis of the spatio-temporal patterns of vegetation restoration after surface mining disturbances is essential for optimizing ecological restoration strategies and ensuring the sustainable development of mining regions (Silvia et al., 2021; Yang et al., 2024).
Since the end of the 20th century, remote sensing imagery has become a prominent tool for monitoring ecological environments (Shan et al., 2019). Numerous studies have utilized this technology to monitor vegetation disturbance in mining areas (Zhang et al., 2022). However, traditional research methods are often face technological and data limitations. For instance, post-classification comparison, image ratioing, trend analysis, etc. Post-classification comparison and image ratioing typically analyzing remotely sensed images taken at long intervals and comparing them to derive information on vegetation changes and their spatial distribution (Mugiraneza et al., 2020; Ang et al., 2021; He et al., 2021; Du et al., 2023). Trend analysis identifies the increase or decrease in vegetation by analyzing temporal trends in vegetation change. However, these approaches may oversimplify the time-series data, which is crucial for a comprehensive understanding of the dynamics of change. It may also lead to the omission of significant disturbance events and the introduction of biases in monitoring vegetation changes and restoration efforts (Huang et al., 2018a; Nguyen et al., 2018).
In recent years, numerous studies worldwide have investigated the spatial and temporal trends of vegetation restoration in mining areas, particularly in regions such as Inner Mongolia, Xinjiang, and Shaanxi in China, as well as coal mining areas of Australia, Canada, and South Africa. Remote sensing techniques and time-series analysis methods have been widely employed in these studies, especially for long-term monitoring (Lastovicka et al., 2020; Zerai et al., 2023). Time-series data effectively capture the dynamic change in vegetation throughout the monitoring period (DeVries et al., 2015; Liu et al., 2024). Researchers have developed several algorithms for analyzing vegetation index time-series utilizing remote sensing, which can be broadly categorized into two groups. The first group includes methods focused on analyzing and predicting long-term vegetation change trends, such as the Sen + Mann-Kendall trend analysis (Han et al., 2021), vegetation stability analysis (Liu et al., 2016), and future trend prediction (Zhou et al., 2020). These methods frequently employ linear regression with least squares fitting, which may overlook short-term vegetation changes. Consequently, new approaches that segment and fit time-series trajectories have been proposed (Vorovencii, 2021; Myroniuk et al., 2022). These methods identify mutation points in time-series trajectories, predict potential mutations, and extract critical information, such as the time, magnitude, and geographic location of vegetation changes. For example, Landsat-based Detection of Trends in Disturbance and Recovery (LandTrendr, Kennedy et al., 2010), Breaks for Additive Season and Trend (BFAST, Verbesselt et al., 2010), Continuous Change Detection and Classification (CCDC, Brown et al., 2020), Detecting Breakpoints and Estimating Segments in Trend (DBEST, Jamali et al., 2015), and others. This new automated monitoring tool shows promise for analyzing long-term vegetation changes. Tools such as LandTrendr and CCDC have been applied to monitor vegetation disturbances caused by mining (Yang et al., 2018; Zhang et al., 2021). However, Wang et al. (2017) identified limitations in these methods related to satellite sensors, data types and lengths, and their overall versatility. Xu et al. (2023) found that while CCDC generally outperforms LandTrendr in monitoring vegetation disturbance in mining areas, it still encounters difficulties in accurately and adaptively identifying the time of large-scale vegetation destruction accurately and adaptively, particularly in a coal base. In contrast, the DBEST offers advantages by explaining seasonal changes and decomposing time-series data. It is widely used in large-scale scenarios, such as forests monitoring (Rhif et al., 2022; Jamali et al., 2023; Jamali et al., 2024; Müller et al., 2024), and performs better with both periodic and non-periodic remotely sensed time-series data (Shen et al., 2018).
This study applies the DBEST algorithm on a large-scale to more accurately detect vegetation destruction and restoration, as well as to calculate the time required for recovery. To the best of our knowledge, this is the first application of the DBEST in a large-scale surface coal mining area. Additionally, the study assesses the spatio-temporal trends of vegetation restoration following mining disturbance and reveals a trend of decreasing restoration efficiency over the long term, an aspect that often overlooked in other studies. This research provides a scientific foundation and decision support for environmental protection and ecological restoration strategies in mining areas.
The Shendong coal base is located at the intersection of Shanxi, Shaanxi, and Inner Mongolia provinces, with geographic coordinates of 38°54’ - 39°37′ N and 109°42’ - 110°41′ E, as shown in Figure 1. The Shenfu Coal Field, which encompasses the Shendong Coal Base, is one of the seven largest coal fields in the world, with proven reserves of 223.6 billion tonnes. It is also the largest coal field in China, accounting for 15% of the country’s total coal reserves. The study area is situated in the transitional zone between the Loess Plateau and the Maowusu Desert in northern Shaanxi. This region has a continental semi-arid climate, characterized by limited water resources, an average annual precipitation of approximately 400 mm, and relatively sparse vegetation. It is a crucial area for national soil erosion monitoring and ecological management. Since 2008, the Shendong coal base has undergone a process of significant urbanization and expansion of industrial and mining areas due to extensive coal mining activities. Since 2013, the development of coal mining and large-scale ecological restoration efforts have pursued concurrently.
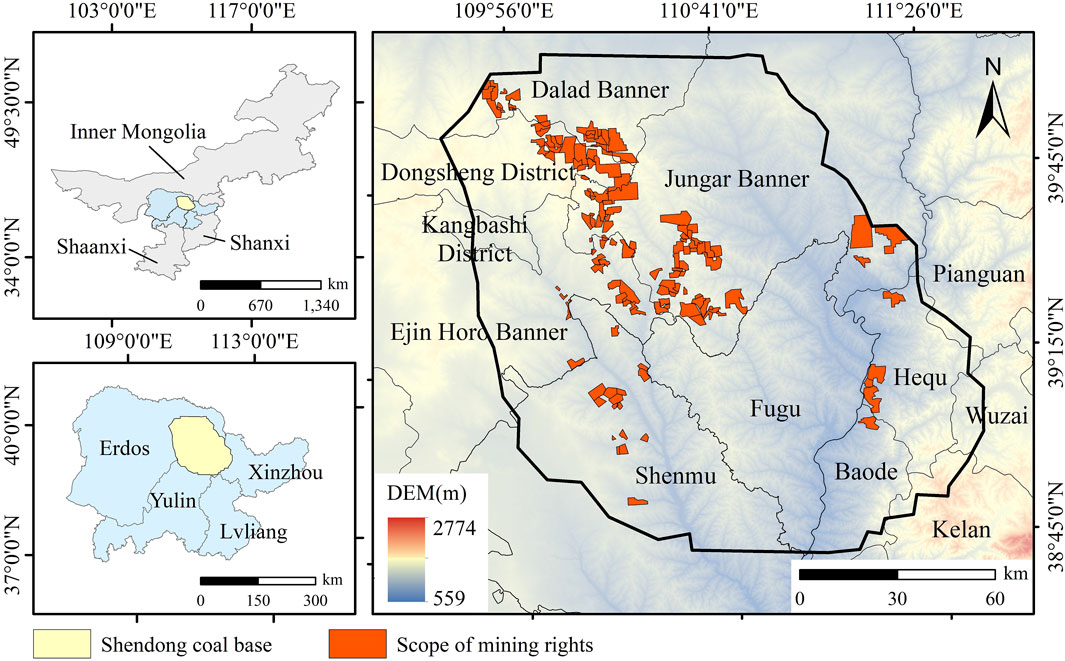
Figure 1. Geographic location of Shendong coal base.
The Normalized Difference Vegetation Index (NDVI) is a validated index of satellite imagery. It has been widely used as a reliable proxy for vegetation biomass, cover, and vigor, effectively reflecting ecosystem conditions (Huang et al., 2018b; Forkel et al., 2013). Analyzing ecosystem changes through NDVI time-series data is both practical and valuable. To evaluate the impact of surface coal mining on vegetation, this study employs the DBEST to reconstruct historical patterns of vegetation destruction and restoration. The DBEST consists of two main components: time-series decomposition and trend segmentation (Meshkini et al., 2024). Time-series decomposition separates the NDVI time-series into three components: trend, seasonality, and residuals. Since the long-term NDVI data used in this study capture inter-annual changes without cyclical variations, trend segmentation was applied directly to the NDVI time-series. This method focuses on identifying horizontal change points that characterize the trajectory of the time-series.
The candidate change point (i) in the NDVI time-series is estimated based on three parameters: the level shift threshold (θ1), the second level shift threshold (θ2), and the duration threshold (ψ) (see Table 1). This candidate change point, designated as the candidate mutation point, represents the most significant change feature in the time-series. Candidate change point need to satisfy three conditions: (1) The absolute value of the NDVI difference between candidate change point and the successive points must exceed θ1; (2) the change needs to be persistent within the set duration ψ, and the difference in the mean value needs to be greater than θ2; and (3) the time distance between candidate change point and neighboring candidate mutation points must be at least ψ. The output of the DBEST is illustrated in Figure 2.
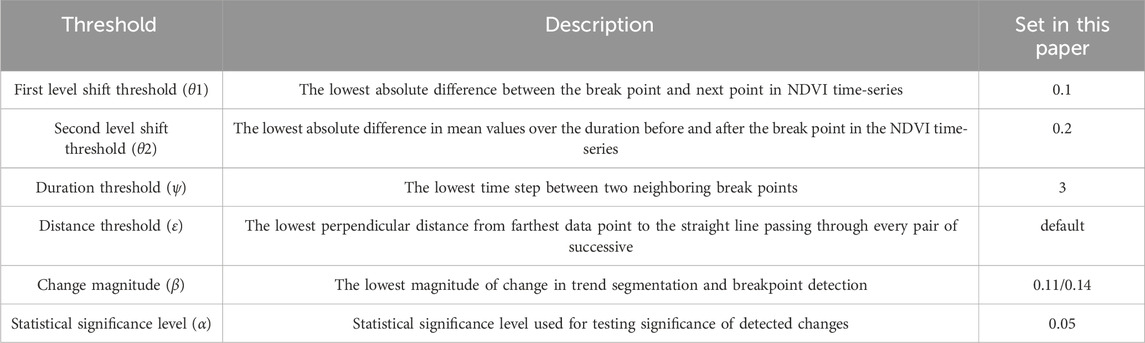
Table 1. Thresholds used in DBEST.
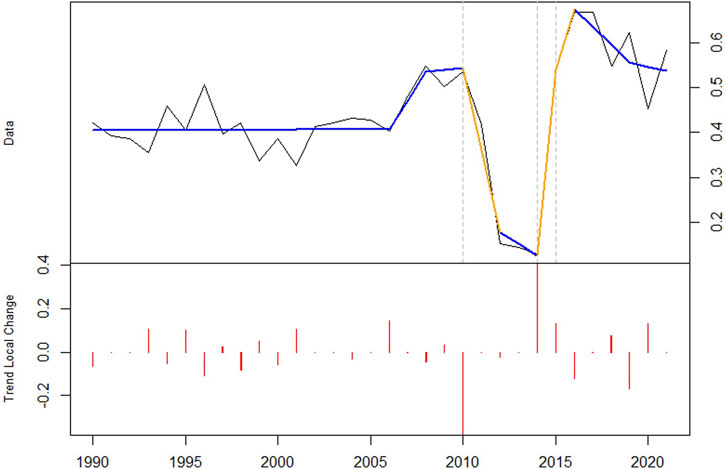
Figure 2. The output of the DBEST. The black curve represents the original NDVI curve. The blue curve represents the fitted trend of the NDVI time-series. The orange color highlights the segments of the time-series where breakpoints are detected. The red line segment represents the magnitude of change in the NDVI time-series at each breakpoint and are labeled as “Trend Local Change”. Both the “Data” and “Trend Local Change” values are dimensionless.
For the NDVI time series, the peak/valley detector function (f) is calculated at each time point i as described in the following equation. Specifically, the peak/valley detector function is set to 1 at the beginning of the time-series and 0 at the end. The points where f = 1 represent peaks or valleys in the time-series, while the points where f = 0 indicate either significant changes or no substantial change in the data.
where, ΔNDVI (i-1,i) = NDVIi- NDVIi-1; ΔNDVI (i, i+1) = NDVIi+1 - NDVIi.
A second turning point detector function (g) is calculated for all points in the time-series based on the peak/valley detector function and an iterative criterion. For each consecutive peak or valley, the perpendicular distance from the farthest data point to the straight line connecting each pair of successive peak and valley points is calculated. This distance is then compared to a predefined threshold. Any point at which the perpendicular distance exceeds the specified threshold is selected as a potential turning point. The corresponding turning point detection function is provided in the following equation.
where d (i) is the perpendicular distance from the point i to the line connecting the peak and valley; ε is the distance threshold set in Table 1. The calculation is iterated continuously until no more points with g(i) = 1 is generated. All points with g(i) = 1 is turning points.
The DBEST uses Bayesian information criterion (BIC) to determine the number of turning points. Local trends based on the h-function are used to calculate the differences in NDVI trends between consecutive turning points, as demonstrated in the following equation.
where, NDVIz and NDVIi represent the NDVI values at two different turning points. TLC refers to the difference in NDVI between two neighboring turning points, while the TLC value for non-turning points is zero.
Finally, the least squares method is used to fit the trend and obtain the results of the segmented trend. Prior to fitting, the turning points are arranged in descending order based on the absolute value of h(i). In this order, the turning points are sequentially added for the fitting of the original trend segments and for the BIC calculation. The turning points that are used in the fitting when the BIC reaches its minimum are identified as the breakpoints.
To evaluate the accuracy of DBEST in recognizing vegetation destruction and restoration in surface mining areas of the Shendong coal base, 5,000 pixels were randomly and uniformly selected as samples within the study area. These sample pixels were then subjected to a visual interpretation based on high-resolution remote sensing images and Unmanned Aerial Vehicle (UAV) images. The actual time of vegetation destruction for each sample pixel was determined by visual interpretation of historical high-resolution images in Google Earth, which served as the true value for accuracy assessment. To quantitatively assess the accuracy of DBEST, a confusion matrix was constructed using the reference dataset. Based on this matrix, three widely used accuracy metrics were calculated: overall accuracy (OA), producer accuracy (PA) and user accuracy (UA). The results of the field research are presented in Figure 3.
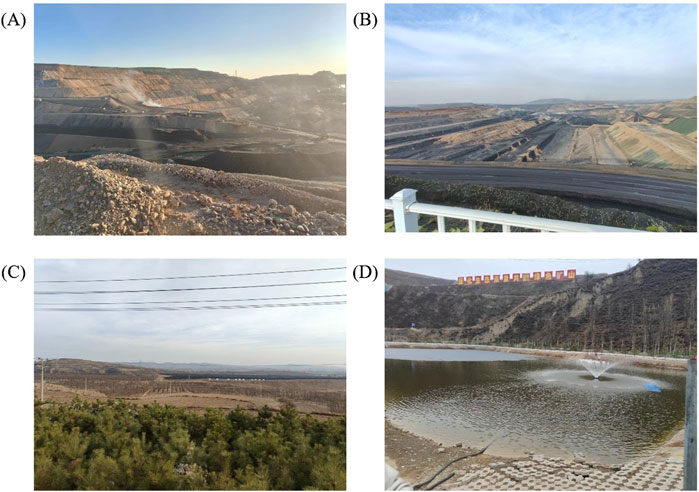
Figure 3. Field photos of some mine features at Shendong coal base. (A) Open-pit. (B) Open-pit and dumping sit. (C) Vegetation restoration area. (D) Impounding reservoir.
To further analyze the changes and effects of vegetation restoration at each pixel following the initial restoration event, this study utilizes the NDVI to compute restoration metrics after mining disturbance (Xulu et al., 2021). In accordance with the methodology proposed by Joanne et al. (2022) for the assessment of spectral restoration techniques in forest ecosystems, this study utilizes the Year to Recovery (Y2R) and amount of NDVI recovery (ΔNDVIregrowth) to describe the process of vegetation restoration in mining areas (Kennedy et al., 2012). The term “Y2R” refers to the number of years it takes for a pixel to be restored to 80% of its pre-mining vegetation level (i.e., NDVI value). In this context, the term “pre-mining NDVI” is defined as the average value from the 2 years preceding the disturbance. Achieving 80% of the pre-mining NDVI value is considered reaching the Y2R level. ΔNDVIregrowth characterizes the absolute change in NDVI in the 5th year after the disturbance, relative to the year of the disturbance, and is calculated as follows.
where, NDVIy5 refers to the NDVI value at 5th years after disturbance, while NDVIy represents the NDVI value in the year when the disturbance occurred. Since these two metrics require a 2-year temporal window before disturbance and 2 years after disturbance, the time-series analyzed for vegetation restoration in this paper spans from 1992 to 2017.
To generate a reference value of vegetation restoration in the Shendong coal base, we calculated the mean Y2R and associated standard scores (z-scores) as follows.
where, Z represents the standard score, x denotes the Y2R value of the pixel, μ is the mean and σ is the standard deviation of the Y2R values for the pixel.
Figure 4 illustrates the accuracy and error of vegetation disturbance detection in surface mining areas using the DBEST. Figures 4A, B present the OA, PA, and UA for detecting destruction and restoration times, respectively. The OA for detecting destruction and restoration time is 0.90 and 0.78, respectively, with PA and UA being closely aligned in both cases. Overall, the DBEST is more effective at detecting vegetation destruction than restoration in mining areas. To address the potential overlap in disturbance times across adjacent years, an error matrix was created to measure the discrepancy between the algorithm’s identified disturbance time and the actual value (see Figures 4C, D). For detecting vegetation destruction, the error rate within 1 year of the actual disturbance is 4.15%, while for restoration detection, the error rate within 1 year is 9.86%. The incorporation of a 1-year margin of error enhances the precision of DBEST, elevating its accuracy in the detection of destruction and restoration to 0.94 and 0.88, respectively. These findings indicate that DBEST is an effective tool for the detection of both vegetation destruction and restoration in the Shendong coal base.
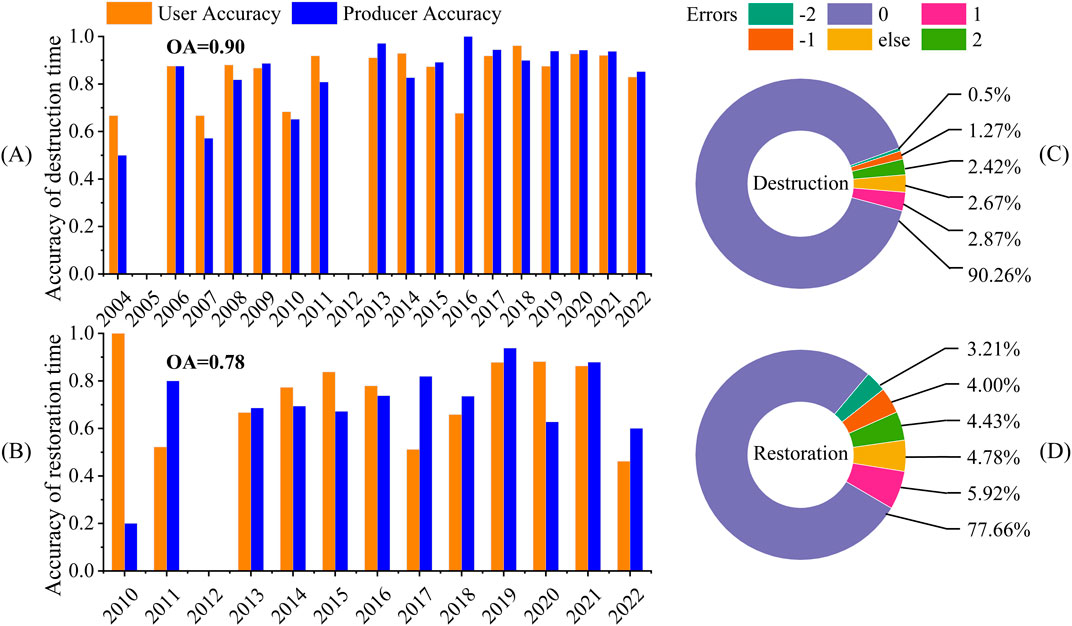
Figure 4. Accuracy of vegetation destruction and restoration. (A, B) Producer accuracy and User accuracy for vegetation disturbance and restoration. As there is no data available for 2012, any disturbance to vegetation that occurred in 2012 will be categorized as occurring in 2013. Accuracy of vegetation destruction and restoration was 0 in 2005. (C, D) Identification errors (in years) for vegetation destruction and restoration.
Figure 5 presents a statistical analysis of the relationship between the area of vegetation destruction and restoration over time in the surface mining area of the Shendong coal base. The data show a significant increase in vegetation destruction within the mining rights after 2008. This upward trend continued, peaking in 2013 with a destruction area of 91.55 km2. By 2022, the cumulative area of vegetation destruction had reached 449.65 km2. Most vegetation restoration activities occurred after 2013, following a pattern of initial growth and subsequent decline. Specifically, 5 km2 of vegetation was restored in 2013. From 2013 to 2016, the area of restoration increased annually, reaching 44.53 km2 in 2016, representing the highest level recorded during the study period. However, from 2017 to 2018, the restoration area sharply declined, with only 7.12 km2 restored in 2017 and 5.54 km2 in 2018. This representing an 84.01% reduction compared to 2016. After 2018, the restoration area fluctuated, with 32.77 km2 restored in 2019, the highest value since 2016. By 2022, the cumulative restoration area reached 156.62 km2.
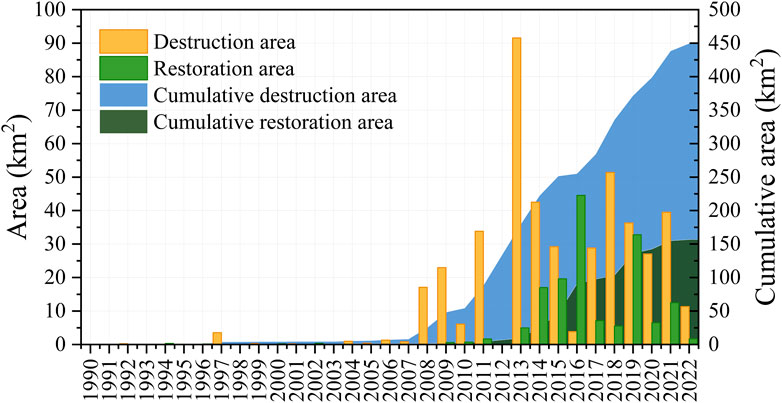
Figure 5. Inter-annual variation in the area of vegetation destruction and restoration.
The DBEST was utilized to identify the time-series data of vegetation in the surface mining area of the Shendong coal base. The spatial distribution of vegetation destruction is illustrated in Figures 6A–C. The data demonstrate that the extent of vegetation destruction in the surface mining area is considerable, spanning seven county-level administrative divisions: Shenmu City, Dongsheng District, Yijinholo Banner, Dalat Banner, Jungar Banner, Hequ County and Baode County. Furthermore, the spatial distribution of the vegetation destruction is notably heterogeneous. Table 2 provides a detailed breakdown of vegetation restoration proportions within each administrative division, based on the combined data for destruction and restoration. In all county-level units, the proportion of vegetation restoration remains below 50%. The highest restoration ratio is observed in Dongsheng District, reaching 44.07%, indicating relatively favorable restoration progress. In contrast, Hequ County has a low vegetation restoration ratio of only 13.03%, highlighting an urgent need for enhanced restoration efforts.
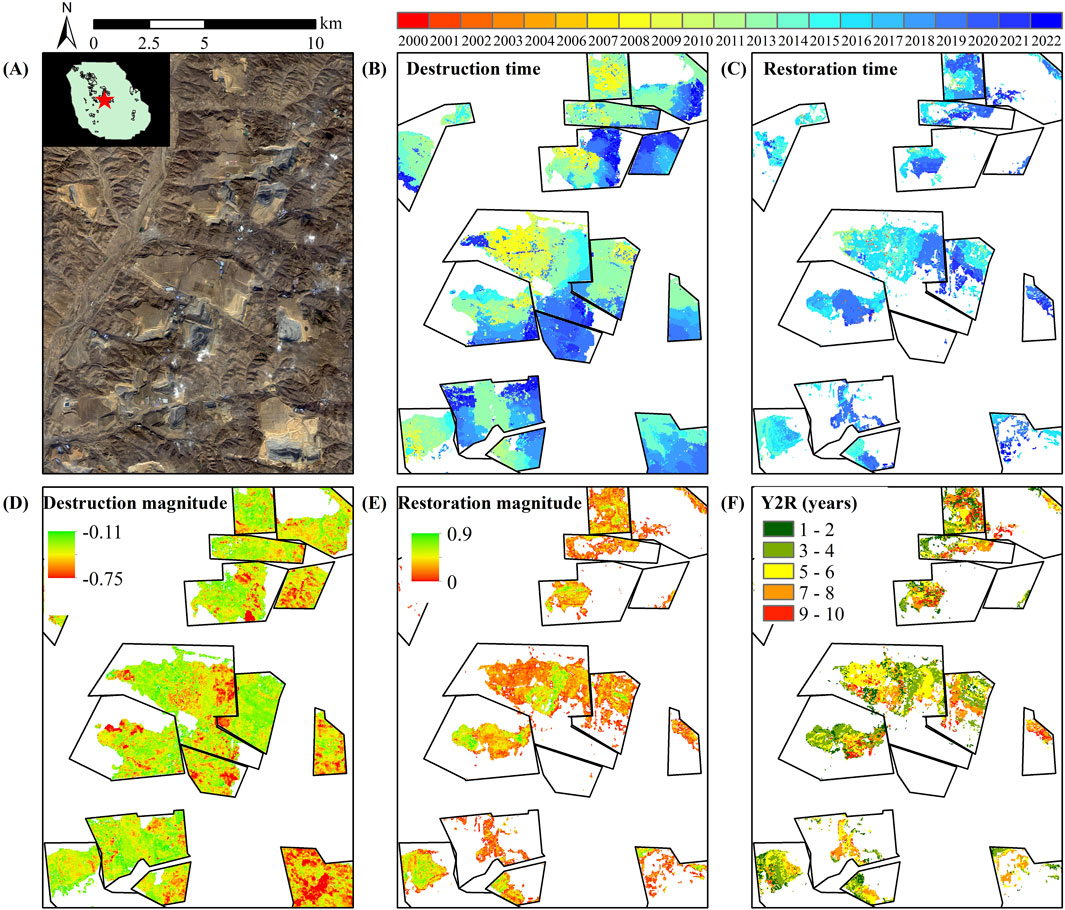
Figure 6. Spatio-temporal distribution of vegetation disturbance in Shendong coal base.
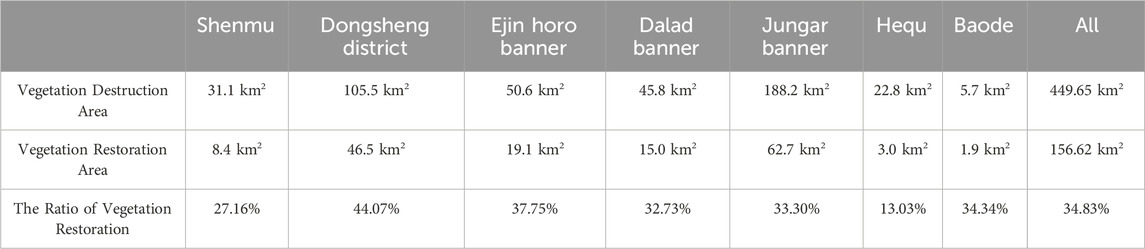
Table 2. Statistics on vegetation destruction and restoration proportions within each administrative division.
The intensity of vegetation destruction and restoration is characterized by the degree of change in NDVI. Figures 6D, E illustrate the spatial distribution of vegetation destruction and restoration intensities. The data indicate that the majority of vegetation destruction in the surface mining area falls within the NDVI range of −0.36 to 0, accounting for 90.44% of the recorded destruction incidents. Similarly, the majority of vegetation restoration activities occur within the NDVI range of 0.178–0.447, representing 76.89% of all restoration events in the region.
Mining activities disturbed approximately 449.65 km2 of vegetation in the Shendong coal base between 1990 and 2022. To calculate the ΔNDVIregrowth, data from the 5 years following the disturbance were utilized. The analysis focused on vegetation destruction that occurred between 1992 and 2017, during which approximately 284.1 km2 of vegetation was lost, accounting for 63.18% of the total vegetation disturbance over the entire study period. Figure 6F illustrates the spatial distribution of Y2R. Figure 7 illustrates the relationship between the area of vegetation restoration and Y2R, which indicates the time required to restore 80% of the pre-mining NDVI levels. The average Y2R for the restored areas was 4.68 years (standard deviation = 3.2 years). Overall, the percentage of restored areas initially increased and then declined with rising Y2R. The highest percentage of areas restored to 80% of their pre-mining NDVI level, was observed in the fifth year after disturbance, with a peak of 7.68%. By 2022, 46.09% of the affected areas had been effectively restored, while 53.91% had either not undergone restoration or failed reached 80% of the pre-mining vegetation levels.

Figure 7. Relationship between the area of vegetation restoration and Y2R.
To facilitate a more detailed analysis of the variation in the proportion of images reaching the Y2R level versus those not reaching it across different latitudes, this study divides the area into five regions, each analyzed in 0.2° latitude intervals, as illustrated in Figure 8. The data indicate that the proportion of ecological restoration in the surface mining area of the Shendong coal base reaching the Y2R level varies with latitude. The highest proportion of vegetation restoration, 51.51%, occurs between 39.6°N and 39.8°N. Conversely, the lowest proportion, 27.81%, is observed between 39.8°N and 40°N.
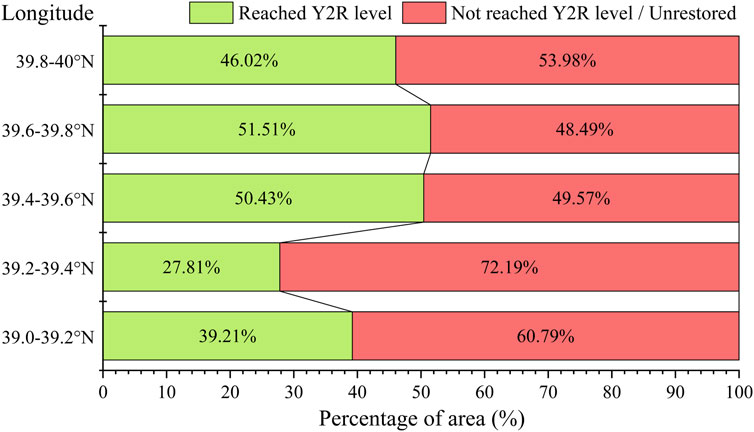
Figure 8. Percentage of area under vegetation restoration (reaching Y2R level) in different latitudinal.
For the pixels that reached the Y2R level, the relationships between Y2R and both ΔNDNIregrowth and the magnitude of NDVI destruction were statistically analyzed, as shown in Figure 9. Figure 9A shows that ΔNDNIregrowth in the surface mine area initially increases and then decreases as Y2R increases. The ΔNDNIregrowth for Y2R between 2 and 5 were higher than those for Y2R equal to 1 year, which indicated that vegetation restoration was more rapid during the early stages. However, the restoration rate subsequently declined. In contrast, Figure 9B shows that the magnitude of NDVI destruction showed an increasing and then decreasing trend with Y2R. For values of Y2R between 1 and 5, the destruction magnitude increased with Y2R, which implies that pixels experiencing greater initial disturbance require a longer recovery time.
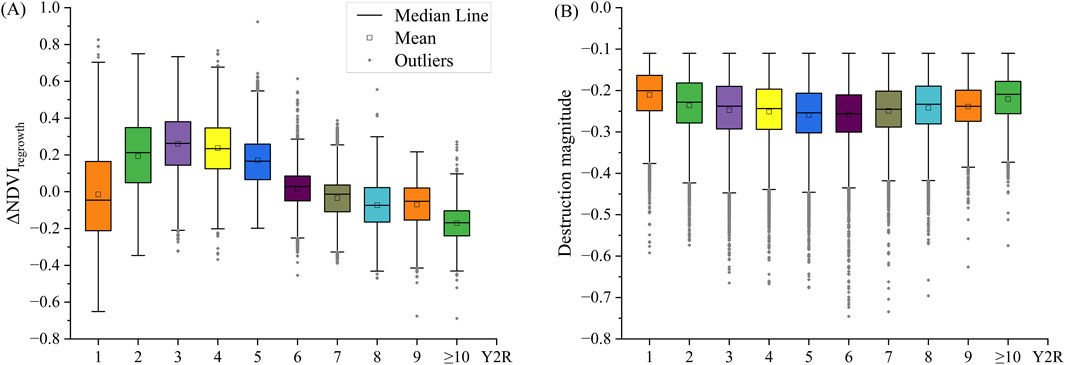
Figure 9. Variation of ΔNDNIregrowth and destruction magnitude with Y2R.
In this paper, the open-pit mines in the Shendong coal base are divided by county. The relationship between the Y2R of the seven different counties involved in the Shendong open-pit mines and the average of Y2R within the study area is then statistically calculated, as shown in Figure 10. The information indicates that the average Y2R values for Dongsheng District, Yijinholo Banner and Shenmu City are lower than the overall average value of the study area, suggesting that the ecological restoration in these three regions occurs at a faster rate. Dongsheng District exhibits the fastest restoration speed, with a Y2R value 0.22 years faster than the study area’s average. Conversely, the average of Y2R in Baode County, Hequ County, Jungar Banner and Dalat Banner were higher than the overall average, indicating a slower rate of ecological restoration in these counties. The slowest ecological restoration area is observed in Hequ County, where the Y2R is 0.66 years slower than the study area’s average.
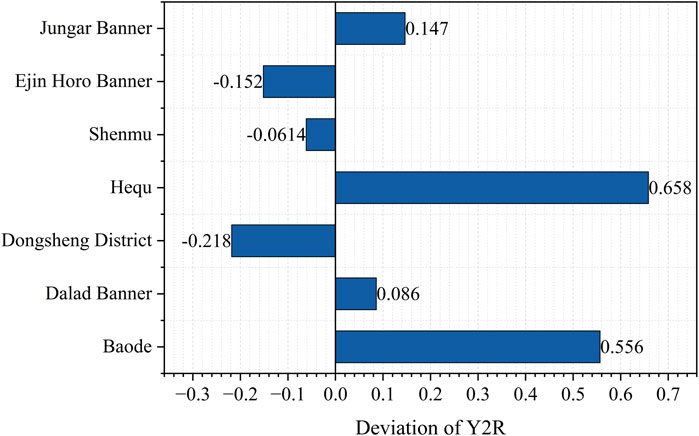
Figure 10. Difference in Y2R between different county zoning districts, relative to the study area, with positive values indicating that Y2R is higher than the study area average and negative values indicating that Y2R is lower than the study area average.
Within the Shendong coal base, the z-scores for different counties were calculated and counted pixel by pixel, as shown in Figure 11. The results indicate that the area of regions that recovered more rapidly (i.e., z-score <0) than the average for the study area was smaller than the area of regions that recovered more slowly (i.e., z-score >0). This accounted for 43.22% and 56.78% of the total area, respectively. Furthermore, it should be noted that the spatial distribution of Y2R z-scores differed between counties. In Hequ County, which exhibited the slowest vegetation restoration, only 37.60% of the area had a z-score <0. In contrast, Dongsheng District, which demonstrated the fastest restoration, had 54.81% of its area with a z-score >0. This highlights the spatial heterogeneity in ecological restoration across the region.
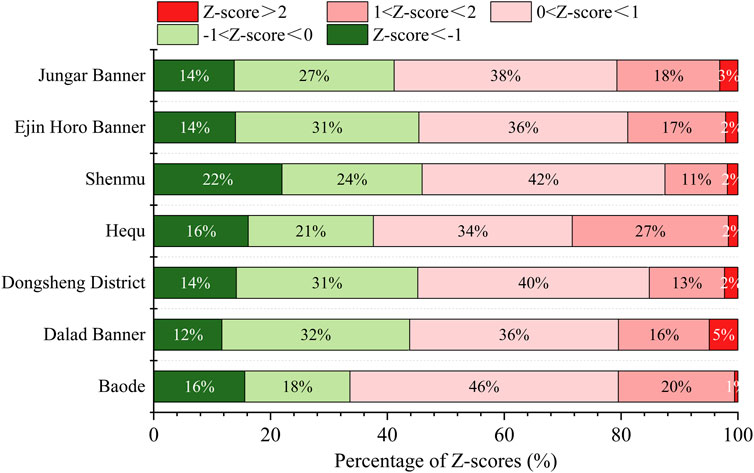
Figure 11. Percentage of Z-Scores for different county.
A significant difference in vegetation changes can be observed in remotely sensed imagery both within and outside mining claims. This suggests that mining activities have a considerable impact on the ecosystem. However, it is important to recognize that other factors, such as climate change, agricultural development, urbanization and forest fires, may also contribute to vegetation changes. Consequently, it is essential to differentiate between vegetation disturbances caused by mining and those triggered by other factors. Distinguishing the impacts of mining is crucial for a more accurate assessment of the ecological consequences of mining activities. Furthermore, this differentiation will provide a solid scientific foundation for the development of targeted ecological restoration and protection measures.
This paper demonstrates the capability of the DBEST to monitor vegetation disturbances across a large-scale surface mining region using the NDVI. The findings indicate that DBEST is highly effective in detecting breakpoints in surface mining operations at the Shendong coal base. The accuracy of identifying vegetation destruction and restoration was 0.90 and 0.78, respectively. This approach provides a valuable technical reference for other mining areas and countries. The adoption of similar methodologies will facilitate accurate monitoring of ecological restoration process, providing a solid scientific foundation for policy development and ecological protection.
Notably, DBEST was more effective at detecting destruction than restoration (Figure 4). This discrepancy is due to the smaller magnitude of NDVI change associated with vegetation restoration in the mining area compared to that of vegetation destruction, which hampers the effective recognition of all restoration events. Despite this, DBEST remains a rapid and efficient monitoring tool. One limitation of the method is that it tends to identify the time of destruction and restoration independently. Due to the presence of data noise, this can result in instances where restoration is recorded before destruction. To enhance the detection accuracy, the focus should be on data quality, model complexity, and parameter optimization: (1) Utilizing multi-source remote sensing data to improve the algorithm’s adaptability to complex environmental factors. (2) Classifying vegetation disturbance types in the mining area before breakpoint monitoring helps more accurately identify destruction and restoration events. (3) Dynamically adjusting the hyperparameters of the algorithm to adapt it to different modes at various stages of restoration, thereby improving the accuracy of its predictions.
As of 2022, the area of vegetation destruction in the Shendong coal base identified by the DBEST was 449.65 km2, while the area of vegetation restoration was 156.62 km2, which is consistent with previous study (Xu et al., 2024). The destruction of vegetation within the surface mining rights intensified after 2008, which is closely linked to the large-scale coal mining activities in the Shendong coal base that began in that year. The extensive excavation and land occupation associated with these mining activities are the primary factors contributing to the significant reduction in surface vegetation. Vegetation restoration were predominantly concentrated after 2013, with the overall area of vegetation restoration first increasing and then decreasing. This trend is likely attributable to the implementation of an ecological management plan by the Shendong coal base, which features a “three phases and three circles” layout. This approach incorporates substantial government financial support, enhancements to mining processes, and a combination of engineering and biological measures, with a particular emphasis on biological sand fixation and supplementary engineering protection. The availability of adequate funding, advanced technology and a well-designed management strategy have collectively facilitated the vegetation restoration process within the surface mines of the Shendong coal base.
The primary objective of vegetation restoration in areas affected by surface coal mining is to restore the vegetation to its pre-mining level (Zhang et al., 2023). To assess this progress, we calculated the time required to restore vegetation in the Shendong coal base to 80% of its pre-mining level. This calculation was based on the average NDVI of vegetation in the 2 years prior to mining. The Y2R metric is a measure of both the effectiveness of vegetation restoration and the time required for recovery. Figure 7 illustrates the relationship between the vegetation restoration area and Y2R. On average, it takes 4.68 years to restore vegetation in the Shendong coal base to 80% of its pre-mining level. Approximately 46.09% of the area meets the Y2R level, which is significantly higher than the national land reclamation rate in China, which is about 20% (Hu, 2019). This suggests that the restoration efforts in the Shendong coal base are highly effective. As Y2R increases, indicating a longer recovery time, ΔNDNIregrowth initially rises and then declines (see Figure 9). This pattern suggests that vegetation restoration is more rapid during the initial stages but subsequently declines. This deceleration may result from multiple factors, including the diminishing effectiveness of ecological restoration measures, deteriorating soil quality, or suboptimal environmental conditions impeding long-term recovery. Over time, the impact of restoration efforts may weaken. While initial interventions, such as human-assisted techniques, can effectively promote vegetation growth, their long-term success depends on maintaining soil fertility. A slowdown in recovery often occurs when soil nutrients are depleted due to insufficient fertilizer application or inadequate soil amendments. Additionally, restoration efficacy is further limited if the restored vegetation cannot adapt to fluctuating environmental conditions. This trend in ΔNDNIregrowth draws key challenges in sustaining the long-term recovery process, including issues with the durability of restoration measures, adverse environmental changes, or other ecological barriers that prevent vegetation from fully returning to near pre-mining level. To address these challenges, it is essential to rely on the combination of policy support, funding, technological innovation, and social participation. Enhancing the adaptability and durability of restoration measures is key, which may include soil improvement, ecological planting, and a diverse range of vegetation choices to support effective vegetation recovery under external pressures such as climate change. The regular monitoring and evaluation of restoration strategies are crucial, as they provide data that can be used to dynamically adjust strategies throughout different phases of the restoration process. Based on monitoring results, comprehensive and flexible strategies should be developed, taking into account the specific needs of each stage. The implementation of these measures will enhance ecosystem resilience and facilitate the recovery of vegetation to pre-mining conditions.
In subsequent studies, biodiversity and biomass will be incorporated as additional assessment indicators to further evaluate species richness, evenness, and the restoration of ecosystem functions. This expanded approach is expected to improve the overall comprehensiveness and reliability of ecosystem health evaluations. Moreover, it is crucial to incorporate the impacts of climate change and soil quality into future research frameworks, as these factors play a pivotal role in influencing vegetation recovery, particularly over the long term.
In this study, the DBEST was applied to the Shendong coal base to assess its efficacy in monitoring vegetation disturbance caused by large-scale surface mining. On this basis, the spatio-temporal trends of vegetation restoration after mining disturbance in the mining areas were further mapped and interpreted. The following conclusions were drawn.
(1) DBEST was demonstrated to be a valuable tool. The recognition accuracy of vegetation damage and restoration in the surface coal mining area reached 0.90 and 0.78, respectively. These results indicates that the DBEST can provide another reliable option for monitoring vegetation disturbance in the mining areas, which has high application value.
(2) Historical reconstruction and assessment of vegetation destruction and restoration process under surface mining. The total area of vegetation destruction caused by surface mining in the Shendong coal base is 449.65 km2, and most of the vegetation destruction occurred after 2008. The restoration area after vegetation destruction was 156.62 km2, which mainly occurred after 2013.
(3) Further evaluation of the restoration level of pixels in the surface mining area revealed that 46.90% of the area disturbed by mining during 1992–2017 met Y2R level at the end of the time-series. The average Y2R was 4.68 years, which exceeds the average for land reclamation in China. This indicates that the restoration of vegetation in the Shendong coal base has been effective.
(4) As Y2R value increased, ΔNDNIregrowth followed a pattern of initially rising and then declining, indicating that vegetation recovered more rapidly in the early stages of restoration. However, the restoration rate tends to slow down with time. This trend suggests that all stages of the restoration process should be carefully considered when planning and implementing vegetation restoration projects. Addressing the challenges associated with long-term restoration is crucial for developing more comprehensive and sustainable restoration strategies.
The raw data supporting the conclusions of this article will be made available by the authors, without undue reservation.
YX: Conceptualization, Investigation, Methodology, Visualization, Writing–original draft, Writing–review and editing. GY: Funding acquisition, Project administration, Writing–review and editing. YZ: Methodology, Software, Writing–original draft. JG: Funding acquisition, Project administration, Writing–review and editing. CZ: Conceptualization, Project administration, Writing–review and editing.
The author(s) declare that financial support was received for the research, authorship, and/or publication of this article. This study was sponsored by the Open Fund of State Key Laboratory of Water Resource Protection and Utilization in Coal Mining (grant number GJNY-20-113-14); the National Key Research and Development Program of China (grant numbers 2023YFF1306000); and the Science and Technology Development Plan Project of the Silk Road Economic Belt Innova-tion-Driven Development Pilot Zone and the Urumqi-Changji-Shihezi National Innovation Demonstration Zone (grant numbers 2023LQY02).
The authors would like to thank the National Aeronautics and Space Administration for the open access to Landsat data.
Author GY was employed by State Grid Electric Space Technology Company Limited.
The remaining authors declare that the research was conducted in the absence of any commercial or financial relationships that could be construed as a potential conflict of interest.
The author(s) declare that no Generative AI was used in the creation of this manuscript.
All claims expressed in this article are solely those of the authors and do not necessarily represent those of their affiliated organizations, or those of the publisher, the editors and the reviewers. Any product that may be evaluated in this article, or claim that may be made by its manufacturer, is not guaranteed or endorsed by the publisher.
Ali, N., Fu, X., Ashraf, U., Chen, J., Thanh, H. V., Anees, A., et al. (2022). Remote sensing for surface coal mining and reclamation monitoring in the central salt range, Punjab, Pakistan. Sustainability 14, 9835. doi:10.3390/su14169835
Ang, M. L. E., Arts, D., Crawford, D., Labatos, B. V., Ngo, K. D., Owen, J. R., et al. (2021). Socio-environmental land cover time-series analysis of mining landscapes using Google Earth Engine and Web-Based mapping. Remote Sens. Appl. 21, 100458. doi:10.1016/j.rsase.2020.100458
Bilgen, S. (2014). Structure and environmental impact of global energy consumption. Renew. Sust. Energy Rev. 38, 890–902. doi:10.1016/j.rser.2014.07.004
Brown, J. F., Tollerud, H. J., Barber, C. P., Zhou, Q., Dwyer, J. L., Vogelmann, J. E., et al. (2020). Lessons learned implementing an operational continuous United States national land change monitoring capability: the Land Change Monitoring, Assessment, and Projection (LCMAP) approach. Remote Sens. Environ. 238, 111356. doi:10.1016/j.rse.2019.111356
DeVries, B., Decuyper, M., Verbesselt, J., Zeileis, A., Herold, M., and Joseph, S. (2015). Tracking disturbance-regrowth dynamics in tropical forests using structural change detection and Landsat time series. Remote Sens. Environ. 169, 320–334. doi:10.1016/j.rse.2015.08.020
Du, S., Li, W., Xing, J., Zhang, C., She, C., Wang, S., et al. (2023). Change detection of open-pit mines based on FM-UNet++ and GF-2 satellite images. Coal Geol. Explor. 51 (7), 130–139. doi:10.12363/issn.1001-1986.22.12.0972
Fang, A., Bao, M., Chen, W., and Dong, J. (2021). Assessment of surface ecological quality of grassland mining area and identification of its impact range. Nat. Resour. Res. 30, 3819–3837. doi:10.1007/s11053-021-09868-8
Forkel, M., Carvalhais, N., Verbesselt, J., Mahecha, M. D., Neigh, C. S., and Reichstein, M. (2013). Trend change detection in NDVI time series: effects of inter-annual variability and methodology. Remote Sens. 5, 2113–2144. doi:10.3390/rs5052113
Han, Y., Ke, Y., Zhu, L., Feng, H., Zhang, Q., Sun, Z., et al. (2021). Tracking vegetation degradation and recovery in multiple mining areas in Beijing, China, based on time-series Landsat imagery. GISci. Remote Sens. 58 (8), 1477–1496. doi:10.1080/15481603.2021.1996319
He, T., Xiao, W., Zhao, Y., Chen, W., Deng, X., and Zhang, J. (2021). Continues monitoring of subsidence water in mining area from the Eastern Plain in China from 1986 to 2018 using Landsat imagery and Google Earth Engine. J. Clean. Prod. 279, 123610. doi:10.1016/j.jclepro.2020.123610
Hu, Z. (2019). The 30 years’ land reclamation and ecological restoration in China: review, rethinking and prospect. Coal Sci. Techno. 47 (1), 25–35. doi:10.13199/j.cnki.cst.2019.01.004
Huang, C., Chen, Y., Zhang, S., and Wu, J. (2018a). Detecting, extracting, and monitoring surface water from space using optical sensors: a review. Rev. Geophys. 56, 333–360. doi:10.1029/2018rg000598
Huang, Y., Liu, X., Li, X., Yan, Y., and Ou, J. (2018b). Comparing the effects of temporal features derived from synthetic time-series NDVI on fine land cover classification. IEEE J. Sel. Top. Appl. Earth Obs. Rem. Sens. 11, 4618–4629. doi:10.1109/jstars.2018.2869528
Jamali, S., Jönsson, P., Eklundh, L., Ardö, J., and Seaquist, J. (2015). Detecting changes in vegetation trends using time series segmentation. Remote Sens. Environ. 156, 182–195. doi:10.1016/j.rse.2014.09.010
Jamali, S., Olsson, P. O., Ghorbanian, A., and Müller, M. (2023). Examining the potential for early detection of spruce bark beetle attacks using multi-temporal Sentinel-2 and harvester data. ISPRS J. Photogramm. Remote Sens. 205, 352–366. doi:10.1016/j.isprsjprs.2023.10.013
Jamali, S., Olsson, P. O., Müller, M., and Ghorbanian, A. (2024). Kernel-based early detection of forest bark beetle attack using vegetation indices time series of sentinel-2. IEEE J. Sel. Top. Appl. Earth Obs. Remote Sens. 17, 12868–12877. doi:10.1109/jstars.2024.3425795
Joanne, C. W., Txomin, H., Michael, A. W., and Nicholas, C. C. (2022). Mapping, validating, and interpreting spatio-temporal trends in post-disturbance forest recovery. Remote Sens. Environ. 271, 112904. doi:10.1016/j.rse.2022.112904
Johansen, K., Erskine, P. D., and Mccabe, M. F. (2019). Using Unmanned Aerial Vehicles to assess the rehabilitation performance of open cut coal mines. J. Clean. Prod. 209, 819–833. doi:10.1016/j.jclepro.2018.10.287
Kennedy, R. E., Yang, Z., and Cohen, W. B. (2010). Detecting trends in forest disturbance and recovery using yearly Landsat time series: 1. LandTrendr - temporal segmentation algorithms. Remote Sens. Environ. 114, 2897–2910. doi:10.1016/j.rse.2010.07.008
Kennedy, R. E., Yang, Z., Cohen, W. B., Pfaff, E., Braaten, J., and Nelson, P. (2012). Spatial and temporal patterns of forest disturbance and regrowth within the area of the Northwest Forest Plan. Remote Sens. Environ. 122, 117–133. doi:10.1016/j.rse.2011.09.024
Lastovicka, J., Svec, P., Paluba, D., Kobliuk, N., Svoboda, J., Hladky, R., et al. (2020). Sentinel-2 data in an evaluation of the impact of the disturbances on forest vegetation. Remote Sen. 12 (12), 1914. doi:10.3390/rs12121914
Li, J., Peng, S., Zhang, C., Yang, F., and Sang, X. (2022). Quantitative remote sensing-based monitoring and evaluation of the ecological environment in mining areas: technology framework and application. Int. J. Min. Sci. Techno. 7, 9–25. doi:10.19606/j.cnki.jmst.2022.01.002
Li, J., Xu, Y., Zhang, C., Guo, J., Wang, X., and Zhang, Y. (2023). Unmixing the coupling influence from driving factors on vegetation changes considering spatio-temporal heterogeneity in mining areas: a case study in Xilinhot, Inner Mongolia, China. Environ. Monit. Assess. 195, 224. doi:10.1007/s10661-022-10815-0
Liu, X., Zhou, W., and Bai, Z. (2016). Vegetation coverage change and stability in large open-pit coal mine dumps in China during 1990–2015. Ecol. Eng. 95, 447–451. doi:10.1016/j.ecoleng.2016.06.051
Liu, Z., He, D., Shi, Q., and Cheng, X. (2024). NDVI time-series data reconstruction for spatial-temporal dynamic monitoring of Arctic vegetation structure. Geo-Spat. Inf. Sci., 1–19. doi:10.1080/10095020.2024.2336602
Mason, T. J., Krogh, M., Popovic, G. C., Glamore, W., and Keith, D. A. (2021). Persistent effects of underground longwall coal mining on freshwater wetland hydrology. Sci. Total Environ. 772, 144772. doi:10.1016/j.scitotenv.2020.144772
Meshkini, K., Solano-Correa, Y. T., Bovolo, F., and Bruzzone, L. (2024). Multiannual change detection in long and dense Satellite image time series based on dynamic time warping. IEEE T. Geosci. Remote Sens. 62, 1–12. doi:10.1109/tgrs.2024.3431631
Ming, X., Wang, Q., Luo, K., Zhang, L., and Fan, J. (2024). An integrated economic, energy, and environmental analysis to optimize evaluation of carbon reduction strategies at the regional level: a case study in Zhejiang, China. J. Environ. Manag. 351, 119742. doi:10.1016/j.jenvman.2023.119742
Mugiraneza, T., Nascetti, A., and Ban, Y. (2020). Continuous monitoring of urban land cover change trajectories with Landsat time series and LandTrendr-Google Earth Engine cloud computing. Remote Sens. 12 (18), 2883. doi:10.3390/rs12182883
Müller, M., Olsson, P. O., Eklundh, L., Jamali, S., and Ardö, J. (2024). Response and resilience to drought in northern forests revealed by Sentinel-2. Int. J. Remote Sens. 45 (15), 5130–5157. doi:10.1080/01431161.2024.2372076
Myroniuk, V., Bell, D. M., Gregory, M. J., Vasylyshyn, R., and Bilous, A. (2022). Uncovering forest dynamics using historical forest inventory data and Landsat time series. For. Ecol. Manag. 513, 120184. doi:10.1016/j.foreco.2022.120184
Nguyen, L. H., Joshi, D. R., Clay, D. E., and Henebry, G. M. (2018). Characterizing land cover/land use from multiple years of Landsat and MODIS time series: a novel approach using land surface phenology modeling and random forest classifier. Remote Sens. Environ. 238, 111017. doi:10.1016/j.rse.2018.12.016
Rhif, M., Ben Abbes, A., Martinez, B., de Jong, R., Sang, Y., and Farah, I. R. (2022). Detection of trend and seasonal changes in non-stationary remote sensing data: case study of Tunisia vegetation dynamics. Ecol. Inf. 69, 101596. doi:10.1016/j.ecoinf.2022.101596
Shan, W., Jin, X., Ren, J., Wang, Y., Xu, Z., Fan, Y., et al. (2019). Ecological environment quality assessment based on remote sensing data for land consolidation. J. Clean. Prod. 239, 118126. doi:10.1016/j.jclepro.2019.118126
Shen, X., An, R., Feng, L., Ye, N., Zhu, L., and Li, M. (2018). Vegetation changes in the three-river headwaters region of the Tibetan plateau of China. Ecol. Indic. 93, 804–812. doi:10.1016/j.ecolind.2018.05.065
Silvia, F., Talia, V., and Matteo, M. D. (2021). Coal mining and policy responses: are externalities appropriately addressed? A meta-analysis. Environ. Sci. Policy 126, 39–47. doi:10.1016/j.envsci.2021.09.013
Sun, X., Shao, H., Xiang, X., Yuan, L., Zhou, Y., and Xian, W. (2020). A coupling method for eco-geological environmental safety assessment in mining areas using PCA and Catastrophe Theory. Nat. Resour. Res. 29, 4133–4148. doi:10.1007/s11053-020-09682-8
Verbesselt, J., Hyndman, R., Newnham, G., and Culvenor, D. (2010). Detecting trend and seasonal changes in satellite image time series. Remote Sens. Environ. 114, 106–115. doi:10.1016/j.rse.2009.08.014
Vorovencii, I. (2021). Changes detected in the extent of surface mining and reclamation using multitemporal Landsat imagery: a case study of Jiu Valley, Romania. Environ. Monit. Assess. 193, 30. doi:10.1007/s10661-020-08834-w
Wang, E., Wang, X., and Chen, Y. (2017). The Breakpoints detection method using time series of vegetation fractional coverage. J. Geo-Inf. Sci. 19, 1355–1363. doi:10.3724/SP.J.1047.2017.01355
Xu, Y., Guo, L., Li, J., Zhang, C., Ran, W., Hu, J., et al. (2023). Automatically identifying the vegetation destruction and restoration of various open-pit mines utilizing remotely sensed images: auto-VDR. J. Clean. Prod. 414, 137490. doi:10.1016/j.jclepro.2023.137490
Xu, Y., Li, J., Zhang, C., Raval, S., Guo, L., and Yang, F. (2024). Dynamics of carbon sequestration in vegetation affected by large-scale surface coal mining and subsequent restoration. Sci. Rep. 14, 13479. doi:10.1038/s41598-024-64381-1
Xulu, S., Phungula, P. T., Mbatha, N., and Moyo, I. (2021). Multi-year mapping of disturbance and reclamation patterns over tronox’s hillendale mine, South Africa with DBEST and Google Earth engine. Land 10, 760. doi:10.3390/land10070760
Yang, Y., Erskine, P. D., Lechner, A. M., Mulligan, D., Zhang, S., and Wang, Z. (2018). Detecting the dynamics of vegetation disturbance and recovery in surface mining area via Landsat imagery and LandTrendr algorithm. J. Clean. Prod. 178, 353–362. doi:10.1016/j.jclepro.2018.01.050
Yang, Z., Zhang, J., and Zhao, Y. (2024). A novel index for exposed coal mapping using Landsat imagery. Ecol. Indic. 166, 112395. doi:10.1016/j.ecolind.2024.112395
Zerai, F. T., Gorsevski, P. V., Panter, K. S., Farver, J., and Tangestani, M. H. (2023). Integration of ASTER and soil survey data by principal components analysis and one-class support vector machine for mineral prospectivity mapping in Kerkasha, Southwestern Eritrea. Nat. Resour. Res. 32, 2463–2493. doi:10.1007/s11053-023-10268-3
Zhang, C., Li, F., Li, J., Xing, J., Yang, J., Guo, J., et al. (2022). Recognition of land use on open-pit coal mining area based on DeepLabv3+ and GF-2 high-resolution images. Coal Geol. Explor. 50 (6), 94–103. doi:10.3969/j.issn.1001-1986.2022.06.010
Zhang, C., Li, F., Li, J., Zhang, K., Ran, W., Du, M., et al. (2023). Assessing the effect, attribution, and potential of vegetation restoration in open-pit coal mines’ dumping sites during 2003-2020 utilizing remote sensing. Ecol. Indic. 155, 111003. doi:10.1016/j.ecolind.2023.111003
Zhang, M., He, T., Li, G., Xiao, W., Song, H., Lu, D., et al. (2021). Continuous detection of surface-mining footprint in copper mine using Google Earth Engine. Remote Sen. 13 (21), 4273. doi:10.3390/rs13214273
Keywords: open-pit mines, mining disturbance, DBEST, vegetation, destruction, revegetation
Citation: Xu Y, Yang G, Zhang Y, Guo J and Zhang C (2025) Mapping and interpreting spatio-temporal trends in vegetation restoration following mining disturbances in large-scale surface coal mining areas. Front. Environ. Sci. 13:1531424. doi: 10.3389/fenvs.2025.1531424
Received: 20 November 2024; Accepted: 24 February 2025;
Published: 11 March 2025.
Edited by:
Erhan Sener, Süleyman Demirel University, TürkiyeReviewed by:
Krzysztof Ostafin, Jagiellonian University, PolandCopyright © 2025 Xu, Yang, Zhang, Guo and Zhang. This is an open-access article distributed under the terms of the Creative Commons Attribution License (CC BY). The use, distribution or reproduction in other forums is permitted, provided the original author(s) and the copyright owner(s) are credited and that the original publication in this journal is cited, in accordance with accepted academic practice. No use, distribution or reproduction is permitted which does not comply with these terms.
*Correspondence: Junting Guo, MjAwMjk5MTBAY2VpYy5jb20=
Disclaimer: All claims expressed in this article are solely those of the authors and do not necessarily represent those of their affiliated organizations, or those of the publisher, the editors and the reviewers. Any product that may be evaluated in this article or claim that may be made by its manufacturer is not guaranteed or endorsed by the publisher.
Research integrity at Frontiers
Learn more about the work of our research integrity team to safeguard the quality of each article we publish.