 Zhiming Zhu
 Wenxue Lin
94% of researchers rate our articles as excellent or good
Learn more about the work of our research integrity team to safeguard the quality of each article we publish.
Find out more
ORIGINAL RESEARCH article
Front. Environ. Sci., 09 April 2025
Sec. Social-Ecological Urban Systems
Volume 13 - 2025 | https://doi.org/10.3389/fenvs.2025.1523850
This article is part of the Research TopicUrban Carbon Emissions and Anthropogenic ActivitiesView all 19 articles
In the context of the “dual-carbon” goal and the building of a moderately prosperous society, it is of great significance to explore in depth the impact of livelihood development on urban carbon emissions. This paper uses the Human Development Index (HDI) as a proxy for assessing livelihood development. Based on the data of a panel of 41 cities in the Yangtze River Delta urban agglomeration from 2000 to 2021, this study constructs the fixed effect model, mediating effect and moderating effect models to empirically test the impact of livelihood development on CO2 emissions from energy consumption and its mechanism. The HDI of the Yangtze River Delta urban agglomeration exhibited a steady increase from 0.64 in 2000 to 0.81 in 2021, marking a significant leap from a moderate to a very high level of human development, with an overall increase of 27.41%. The results show that there is a significant inverted U-shaped relationship between livelihood development and urban CO2 emissions. Innovation inputs play an intermediary role and investment intensity positively moderates the inverted U-shaped relationship between livelihood development and CO2 emissions. Moreover, the analysis finds that the impact of livelihood development on CO2 emissions varies significantly among regions with different geographic locations and resource endowments. The inverted U-shaped relationship between livelihood development and CO2 emissions is more pronounced in central cities and non-resource-based cities. The above research results show that urban carbon emissions can be effectively reduced by optimizing livelihood development, and provide a scientific basis for achieving the target of carbon peak. This study reveals the relationship between livelihood development and CO2 emissions, provides a new perspective for sustainable urban development, and provides a basis for promoting the simultaneous realization of livelihood development and carbon emission reduction targets in the Yangtze River Delta urban agglomeration.
Human society has now entered the “Anthropocene” (Crutzen, 2002), which means that human activities have become a major driver of global environmental change (Will et al., 2007; Tyrrell, 2011; Zalasiewicz et al., 2011). Global warming and sea level rise are altering the earth system, posing a severe threat to the natural environment and human life, and are mostly driven by human excessive carbon dioxide emissions (Marra et al., 2015; Kijewska and Bluszcz, 2016; Tyagi et al., 2016). China’s economic development and social activities have advanced significantly since the country’s reform and opening up. Notable advancements have been made in education, national health and medical care, and the pace at which people’s livelihoods are developing thanks to economic growth. People’s living conditions have improved more swiftly as a result of the east wind of economic progress. However, China’s traditional and crude approach to development has resulted in large energy consumption and CO2 emissions. According to the IEA’s CO2 Emissions in 2023 report, China’s carbon emissions grew to 12.6 billion tons in 2023, with per capita emissions 15% higher than those of advanced economies (IEA, 2024). A commitment to emission peak and carbon neutrality has been put forth by China in response to the urgent issue of global warming. Enhancing livelihood development and fostering green and low-carbon development are the clear objectives of the 20th CPC National Congress, which emphasized the significance of people’s livelihood and green development. Enhancing people’s quality of life can encourage more economic growth, while economic development itself gives the means and conditions for doing so. Therefore, the growth of people’s livelihoods should have a carbon emission reduction effect, as it is a crucial sector to support China’s social development. Thus, the primary issue that must be addressed as a priority is how to alter the course of development to maximize the improvement of livelihood development at the lowest possible cost to the environment.
Due to the Environmental Kuznets Curve (EKC) hypothesis, CO2 emissions will have an inverted U-shaped tendency to rise and then decline as the economy grows (Kuznets, 1955; Grossman and Krueger, 1995). Studies have generally taken economic growth as an indicator of development. However, human beings are the core beneficiaries of the development process. Thus, the evaluation of development should not only focus on the inputs, but also emphasize the results that the society obtains from the development (Hussain and Dey, 2021). Therefore, the Human Development Index (HDI) provides a more comprehensive measure of the development (Cracolici et al., 2010; Sen et al., 2010; Cumming and von Cramon-Taubadel, 2018). The HDI was first released by the United Nations Development Program in 1990 (UNDP, 1990), and contains three sub-indicators: health, education, and standard of living. It serves as a tool for comprehensively reflect prosperity in the economy, advancement in society, and balance with the environment. It has since become the most influential indicator of human development worldwide (Morse, 2020). Therefore, this paper selects the HDI to measure the level of livelihood development in the Yangtze River Delta urban agglomeration.
Urban agglomerations are becoming the hub for energy resources due to the rapid expansion of urban areas, and they are also taking on more responsibility for reducing carbon emissions. The Yangtze River Delta, the biggest and most economically significant metropolitan agglomeration in China, is not only a pioneer in creating a “happy circle” for people’s livelihood, but also a typical model for energy conservation and emission reduction (He et al., 2021). “14th Five-Year Comprehensive Work Plan for Energy Conservation and Emission Reduction” explicitly proposed to strictly control coal consumption in the Yangtze River Delta Urban Agglomeration. In this context, accurately assessing the carbon emissions from energy consumption and the level of livelihood development in the Yangtze River Delta urban area is highly important. Additionally, it is crucial to empirically evaluate the impact and mechanisms of energy-related carbon emission reductions in livelihood development. These efforts aim to enhance the quality of life for residents and encourage a synchronized peak in carbon emissions.
This paper potentially makes contributions in the following three areas. First, we integrate livelihood development and carbon emissions into a single research framework, offering an innovative approach to enhancing the degree of livelihood development and lowering carbon emissions. Subsequently, we conduct an empirical investigation into the precise pathways by which livelihood development influences carbon emissions, including both innovation inputs and investment intensity. Our goal is to offer recommendations for future initiatives aimed at reducing carbon emissions. Thirdly, to ascertain the varying effects of livelihood development on carbon emissions, we carried out a heterogeneous analysis of urban geographic location and resource reliance.
These three distinct strands represent the research that is relevant to this particular investigation. The first strand is the research on CO2 emissions. Research currently conducted indicates that many factors, including population size, urbanization rate, economic development level, and foreign direct investment, have varying degrees of impact on carbon dioxide emissions (Liu et al., 2017; Wang S. et al., 2019; Ma et al., 2022; Wu and Xu, 2023). In terms of research methods of influencing factors, there are mainly IPAT or STIRPAT models, Kaya constant equation and LMDI method (Shao et al., 2016; Chen et al., 2018; Guan et al., 2018; Yang et al., 2022). The STIRPAT model is traditionally defined as the Stochastic (ST) estimation of environmental impacts (I) by regression (R) on population (P), affluence (A), and technology (T) (Wei, 2011).
The second strand focuses on the measurement of livelihood development. Some scholars have constructed different indicator systems for measurement through the understanding of the connotation of livelihood development. For instance, (Chen et al., 2020) selected indicators from the five dimensions of economic progress, quality of life, societal advancement, environmental stewardship, and scientific and technological innovation as an assessment system for the city’s livelihood based on the entropy value method (Chen et al., 2020). Ye et al. (2018) constructed the indicators of the sense of livelihood acquisition and livelihood satisfaction and carried out the questionnaire measurements and empirical analyses. Wang et al. (2022) constructed China’s livelihood development indicator system from the four dimensions of economic prosperity, quality of life, societal progress, and environmental conservation. While some scholars have utilized objective indicators such as Better Life Index, Human Development Index and Genuine Progress Index to measure the level of human wellbeing (Wang et al., 2018; Michalos and Hatch, 2020; Pala, 2024).
The third strand is dedicated to examining the impact of urban development on the reduction of energy-related carbon emissions within the context of livelihood improvement. According to some research, nations with more developed livelihoods typically have greater per capita carbon dioxide emissions and a higher prevalence of environmental issues (Kvon et al., 2019). However, Van Tran’s study shows that environmental quality can be improved by livelihood development (Van Tran et al., 2019). Research on the connection between human development and the decrease of carbon emissions is scarce at the moment. For the most part, it looks at how the HDI affects carbon emissions, but the relationship has not been thoroughly established. The influence of the level of human development on CO2 emissions is found to be industry-specific (Mohmmed et al., 2019). Specifically, the human development index (HDI) has a negative regression coefficient in the agricultural sector. This suggests that human activities can help reduce carbon emissions in this sector. Researchers also found that humans can reduce agricultural carbon emissions through improved farming practices (Aminetzah et al., 2020). For example, Brazil and the United States currently use low- and no-tillage practices on about 40% of hectares, reducing fuel use and denitrification, thereby reducing greenhouse gas emissions. Conversely, in the transportation and bunker sectors, the HDI shows a positive regression coefficient. This implies that human activities have led to increased carbon emissions in these areas. According to the IEA, passenger and freight activity rebounded after the coronavirus (COVID-19) pandemic in 2022, leading to a 3% increase in CO2 emissions from transportation over the previous year (IEA, 2023). Ocean shipping, heavily dependent on bunker fuels, is projected to see ship-source greenhouse gas emissions increase by up to 250% by 2050 from 2012 levels due to rising global freight volumes (Wan et al., 2018). The energy, industry, and manufacturing sectors did not exhibit any significant effects. Using quantile regression based on panel data of emerging economies, Banday and Kocoglu (2023) found that HDI had a significant carbon abatement effect in all quartiles. (Maji, 2019) verified the carbon abatement effect of HDI by employing a systematic GMM approach to assess data from 42 sub-Saharan nations (Maji, 2019). Additionally, (Yumashev et al., 2020) included the HDI’s quadratic term into the model and verified the inverted “U” nonlinear relationship between livelihood development and CO2 emissions (Yumashev et al., 2020). Subsequently, other researchers like (Hussain and Dey, 2021) also used the HDI as an indicator of development and found the existence of environmental Kuznets curves in 30 countries from 1990 to 2016 (Hussain and Dey, 2021). Through a comparison of the model’s GDP and HDI performance, Majewska and Gierałtowska (2022) determined that the model which uses the HDI as a measure of affluence fits better than GDP, based on data from 2000 to 2019 for Central and Eastern European nations.
In general, prior studies have not resulted in a consistent criterion for measuring the level of livelihood development. Furthermore, there is no agreement on how to understand the carbon emission reduction effects of livelihood development. There has been little quantitative investigation of the impact mechanism in the correlation between livelihood development and carbon emissions, and even less on the heterogeneity of these driving relationships. Based on this, the study attempts to investigate through theoretical and empirical analyses the extent to which livelihood development affects urban CO2 emissions, whether or not it shares features with other studies, and what the processes and outcomes of this function are. To be more precise, this paper uses 41 prefecture-level cities in the Yangtze River Delta urban agglomeration from 2000 to 2021 as research samples. Estimates are made first for carbon emissions and the degree of livelihood development. The impact of livelihood development on reducing carbon emissions is then empirically tested using the STIRPAT model. Also, a controlling variable called investment intensity is presented. Subsequently, the geographical and typological diversity of the correlation between the two are examined with the goal of acting as a guide for developing livelihood development plans that complement low-emission development.
In the early development stages, industrialization was gaining momentum due to a spike in energy use, particularly from fossil fuels, and significant CO2 emissions from human activity. People’s standard of living was comparatively underdeveloped, and their knowledge of and capacity for environmental protection was constrained. The mid-development phase has witnessed structural changes because of the rise of the service and high-tech sectors, which have slowed down the growth of carbon emissions, reduced reliance on heavy and energy-intensive industries, and raised public awareness of environmental issues. When people’s livelihoods have advanced to a high degree, governments and corporations start to place more emphasis on environmental preservation and sustainable development. People also recognize the necessity to employ “clean energy” and reduce pollution. Society starts to transition to a more sustainable development model with a decrease in carbon emissions when governments start to take action, such as making investments in clean energy and enforcing environmental rules (Yumashev et al., 2020). Consequently, the following hypothesis is put forth:
Hypothesis 1: The livelihood development has a carbon emission reduction effect. And there is an inverted U-shaped relationship between livelihood development and CO2 emissions.
The livelihood development can reduce CO2 emissions by increasing investment in science and technology innovation. The insatiable demand for human’s own development serves as a catalyst for scientific and technical advancement, which in turn serves as a major impetus for energy conservation and emission reduction (Zou et al., 2022). Through legislative support and investment in science and technology education, livelihood development may offer a strong foundation and sustained momentum for scientific and technology innovation. Firstly, livelihood development creates an atmosphere that is conducive to creativity. The livelihood development can influence the introduction of policies by the government in this area. Examples of such policies include those that encourage businesses and research institutions to invest more in innovation by offering R&D funds, tax breaks, intellectual property protection, and other incentives. Secondly, livelihood development offers a consistent flow of skilled individuals who foster innovation. More investment in STEM education, higher spending on education and science and technology, and reasonable modifications to national public budget expenditures based on human development needs will all contribute to the creation of more innovative individuals and offer a human resource base for innovation. Investment in innovation significantly reduces CO2 emissions. More financing for innovation will, on the one hand, lead to decreased CO2 emissions through the development of energy-efficient buildings, the iterative improvement of technology, research and development into renewable energy sources, integration of energy systems, etc. On the other hand, funding for innovation can be used to raise public knowledge of the significance of reducing carbon emissions and to motivate more individuals to live low-carbon lives through public awareness and education, thus lowering CO2 emissions.
Hypothesis 2: Innovation inputs play a mediating effect in the impact of livelihood development on CO2 emissions.
One of the “troika” forces behind economic growth is thought to be investment, and fixed asset investment, which makes up a large portion of investment, has grown to be crucial for fostering economic development and enhancing people’s quality of life (Bond et al., 2010). A moderating effect on the route of livelihood development that influences CO2 emissions could be expected from investment intensity. On the one hand, higher investment intensity might guarantee that the improvement of livelihoods has a favorable effect on cutting carbon emissions. The development of environmentally friendly infrastructure, including green buildings and low-carbon transportation systems, is aided by fixed asset investment. This influences the degree to which the development of livelihood improves the environmental quality. Adjusting investment intensity, on the other hand, increases the desire of enterprises to implement green projects. The need for green development and the need to update the economic development paradigm are being emphasized by the government more and more. It also tends to allocate fixed asset investment to sectors of the economy that are dedicated to developing low-carbon technology and increasing carbon efficiency, which encourages businesses to adopt low-carbon practices and advances the reduction of carbon emissions.
Hypothesis 3: Investment intensity plays a moderating effect in the impact of livelihood development on CO2 emissions.
CO2 emissions per capita (CE). The measurement of urban CO2 emissions draws on Han and Xie (2017), which extrapolated urban CO2 emissions through energy consumption such as electricity, natural gas, and liquefied petroleum gas. The per capita CO2 emissions were then calculated by dividing the total carbon emissions by the population of each city. The specific calculation method is shown in Equations 1, 2.
Here,
Human Development Index (HDI). According to the calculation methodology in the Human Development Report 2023–24, the HDI is based on the health, education and standard of living (UNDP, 2024). Then it is measured by calculating the geometric mean of the levels of the indicators in these three dimensions. The calculation method is shown in Equations 3-6.
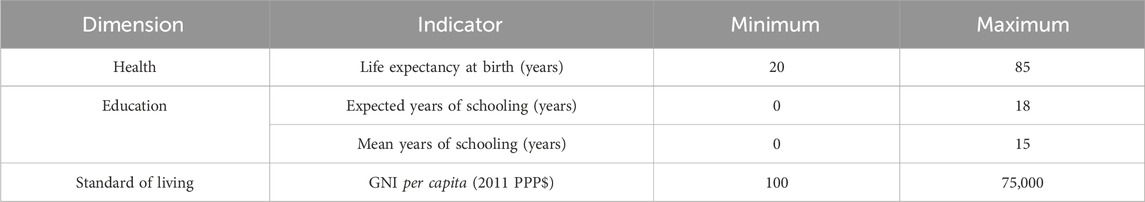
Table 1. Indicator thresholds for each dimension of HDI.
The STIRPAT model, which is an enhanced version of the IPAT model, was selected as the analytical framework for this paper using the following underlying expression (York et al., 2003). The IPAT model is shown in Equation 7:
Where I denotes environmental pressure, P, A and T denote demographic, economic and technological factors; a, b, c and d are the model parameters; ε is the random error term. Referring to the related literature on the impact of HDI on CO2 emissions, the quadratic term of HDI is added to the model and logarithm is taken on both sides of the model. The expanded baseline regression model is shown in Equation 8.
Where
Referring to Yang and Niu’s research idea to construct the mediation effect model in order to test the mediating effect of innovation inputs (Baron and Kenny, 1986; Yang and Niu, 2023). The model is shown in Equations 9, 10:
Where
Equation 11 is constructed to test the moderating effect of investment intensity (Yang and Niu, 2023).
Where
This paper takes 41 cities in the Yangtze River Delta urban agglomeration from 2000 to 2021 as the research sample. The data come from China City Statistical Yearbook1, China Electric Power Yearbook2, National Statistical Yearbook3, national population census (2000, 2010, 2020)4, the World Bank database5, statistical yearbooks of provinces and cities, and national economic and social development bulletins6, etc. GDP data were calculated using 2000 as the base period. In addition, we use interpolation and trend extrapolation methods to supplement some missing data. The interpolation method is used to estimate the missing value between two known data points (Fan and Pei, 2023). Meanwhile, the trend extrapolation method predicts future data values based on the historical trends observed in the data, allowing us to estimate values beyond the existing dataset’s range (Zhenjun et al., 2023). Therefore, based on the above two methods, we can ensure the consistency and analyzability of data to a certain extent. Table 2 displays the descriptive statistics for each variable.
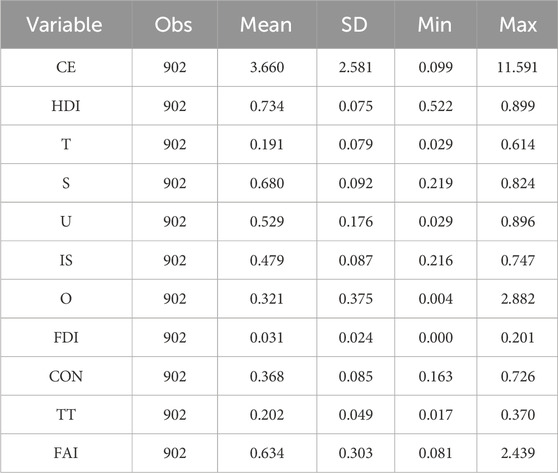
Table 2. Variable description statistics.
Using the previously mentioned Equations 1–6, data on the evolution of livelihood development and CO2 emissions during the course of the research period are calculated. The average human development index of 41 cities was chosen as the livelihood development data of the Yangtze River Delta urban agglomerations in order to analyze the data evolution characteristics of these areas. The annual per capita carbon emission data of these areas was then calculated by adding and dividing the total carbon emission and population of each city. Figure 1 displays the results of the calculation.
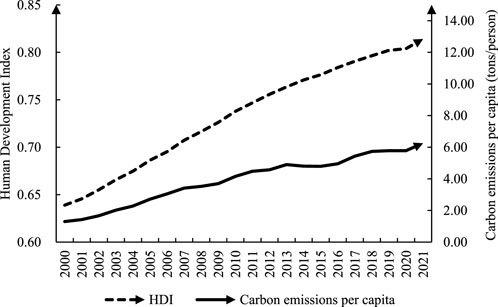
Figure 1. Trends in CO2 emissions and HDI.
With a rise of 27.41%, the HDI of the Yangtze River Delta urban agglomeration completed the transition from the medium to the very high human development level in 2021, rising steadily from 0.64 in 2000 to 0.81 in 2021, as shown in Figure 1. Between 2000 and 2006, it was at the medium human development. The objective of “building a moderately affluent society in all aspects” was presented during the 16th National Congress of the Communist Party of China in 2002, which introduces new demands for the development of livelihoods. Therefore, the Yangtze River Delta urban agglomeration is working toward greater economic growth, advancements in science and education, and more stable means of subsistence for its residents. After reaching the high human development level in 2007, the HDI hit 0.79 in 2018. During this period, the region’s citizens enjoyed an improvement in their standard of life and saw a discernible rise in the level of economic growth. The new rural social pension insurance policy went into effect in 2009, resulting in a large increase in social security payments. The 2010 World Expo was subsequently hosted in Shanghai, which sped up the region’s economic upgrading, restructuring, and transformation. It also encouraged the building of transportation infrastructure, which further aided in the region’s economic development. Between 2019 and 2021, the Yangtze River Delta urban agglomeration achieved to very high human development. After a reasonably prosperous society was achieved in 2020, there was a notable improvement in people’s quality of life, a steady rise in the protection of the rights to development and subsistence, then the new phase of more coordinated growth in human development (Ren et al., 2021).
In addition, the overall trend in the Yangtze River Delta urban agglomeration’s per capita CO2 emissions is a sharp rise followed by a slow plateau. In particular, there was an annual growth rate of approximately 9.95% on average in per capita CO2 emissions between 2000 and 2013, rising from 1.29 tons per person in 2000 to 4.90 tons per person in 2013. The nation set goals for 7.5% average annual GDP growth and 47% urbanization rate during the 11th Five-Year Plan period7. The Yangtze River Delta urban agglomeration’s rapid economic development and the ongoing rise in urbanization have resulted in a rapid increase in CO2 emissions. Due in large part to China’s aggressive push of low-carbon development, per capita CO2 emissions increased negatively in 2014 and 2015. The State Council’s adoption and approval of the National Climate Change Response Plan (2014–2020) in 2014 has played a significant role in hastening the reduction of carbon emissions. It lays out explicit guidelines for decreasing CO2 emissions intensity and expanding forests area. During the “13th Five-Year Plan” period, China has set a target of reducing energy consumption per unit of GDP by 15% by 2020 compared with 2015. The Yangtze River Delta’s industrial structure shifted to a larger percentage of tertiary industry as its economic growth method has continuously changed. The pace at which CO2 emissions increased fell sharply. In 2021, the average person’s CO2 emissions increased to 6.25 tons. As the pandemic spreads during this time, there is a greater chance that a global value chain would break, which could trigger a worldwide energy crisis. This situation may endanger the development of energy in the Yangtze River Delta. It also poses challenges for climate governance and the achievement of the “dual carbon” target CO2 emissions might have gone up as a result of this.
The F, LM and Hausman tests led to the selection of the two-way fixed effect model to investigate how livelihood improvement affects carbon emission reduction. Table 3 presents the results of the measurement.

Table 3. Regression results.
Table 3’s column (1) regression findings show that, at the 1% level, the HDI and its squared term coefficient are both significantly negative. Since the HDI has a range of values from 0 to 1, its logarithmic value is negative in the model. Therefore, an important inverted “U” shape is found between the HDI and carbon emissions. This is consistent with the findings of some of the scholars above. Hypothesis 1 is preliminarily tested. It is not rigorous to conclude that the inverted “U” relationship is based solely on the significance of the coefficients of the primary and secondary terms. Then we continued to use the Utest test command to verify the result (Liu and Mu, 2024). The p-value of Utest test for the inverted “U” curve with carbon emission is less than 0.01. The slope of the curve is positive (1.73, p < 0.01) and then negative (−1.69, p < 0.01). The HDI’s extreme point, which is 0.68 and falls within the range of HDI values, suggests that the relationship between carbon emissions and livelihood development is shaped like an inverted “U”. The inflection point value is 0.68, meaning that livelihood development will have a suppressive effect on carbon emissions when HDI is higher than 0.68. And after calculation, hypothesis 1 is correct since livelihood development has a dominant effect on reducing carbon emissions at this point. An improvement in the HDI denotes not just a rise in the economic status of the population, but also a notable improvement in their health and education levels. When it comes to this process, individuals with higher levels of education and overall quality typically have stronger concepts related to environmental protection, are more conscious of the significance of climate change and environmental protection, and are more likely to take action to protect the environment. They may even engage in social and political activities to influence policy decisions and encourage the implementation of environmental protection measures to facilitate human development in a sustainable manner (Yumashev et al., 2020).
The regression model incorporates the HDI indices of the three dimensions to enhance the examination of the impact of livelihood development on CO2 emissions. The resulting tables are arranged in columns (2), (3), and (4) of Table 3. Considering the significance of the data, we examined the relationship between the health index and CO2 emissions using the total population (P) data as a control variable. The findings show that an increase in the health index significantly increases CO2 emissions. One possible explanation for this could be that although life expectancy has improved dramatically due to improvements in health and medical technology, the energy-intensive nature of medication research and medical services may contribute to a rise in CO2 emissions. Column (3) data indicates a considerable restraining effect of the education index on CO2 emissions. Education can help people become more aware of environmental issues on a personal and societal level, support the advancement of green technologies, and lower CO2 emissions. The income index has a considerable impact on the rise in CO2 emissions, as seen by Column (4). Economic development is reflected in the rising income index, and the Yangtze River Delta region’s economic development is heavily reliant on fossil fuels like coal and oil, which can raise CO2 emissions. In the sub-dimension regression, only the education index can reduce carbon emissions. However, the degree of human development can significantly reduce carbon emissions. This shows that in order to reach the aim of carbon peaking, we need raise the whole level of livelihood development rather than relying solely on one dimension.
The following robustness tests are carried out to confirm the benchmark regression’s scientific validity. The results are shown in Table 4.
(1) Replace the explanatory variables. Replace the CO2 emissions data with the CO2 emissions of each city published by China Emission Accounts and Datasets (CEADs) to re-estimate the model. The results are shown in column (1) of Table 4.
(2) Exclude some samples. There is a big difference between municipalities, provincial capitals and sub-provincial cities and ordinary prefecture-level cities in terms of livelihood development. As a result, the regression does not include the aforementioned samples. The outcomes are displayed in Column (2).
(3) Control variable shrinking tail. We employ a 1% shrinking tail treatment to prevent the extreme values of the control variables from significantly affecting the regression findings. The results are shown in column (3). The empirical findings demonstrate the robustness of the benchmark results by demonstrating that the inverted “U” curve link between CO2 emissions and livelihood development remains constant.
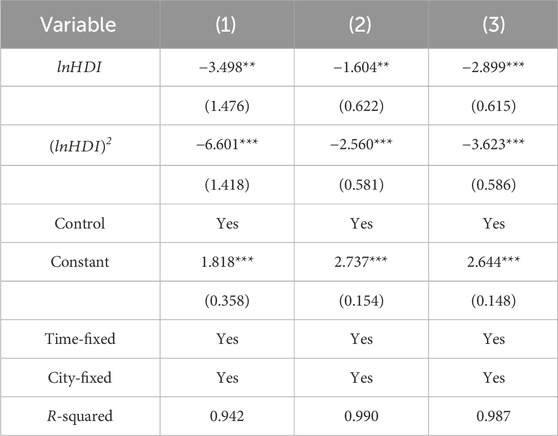
Table 4. Robustness test results.
The findings of a step-by-step regression of Equations 9 , 10 to investigate how livelihood development influences urban CO2 emissions are presented in Table 5. The link between livelihood development and innovation inputs is U-shaped, as seen by column (1). During the examination period, most cities were found to the right of the turning point, suggesting that improvements in living conditions facilitate investment in innovation. Following the addition of mediating variables, column (2) shows that innovation inputs have a regression coefficient of −0.195 on carbon emissions, indicating that innovation inputs suppress carbon emissions. Additionally, the coefficients of lnHDI and (lnHDI)2 are both significant and lower than in the baseline regression model, indicating that innovation inputs play a part in mediating the effect of livelihood development on carbon emissions. Hypothesis 2 is valid.
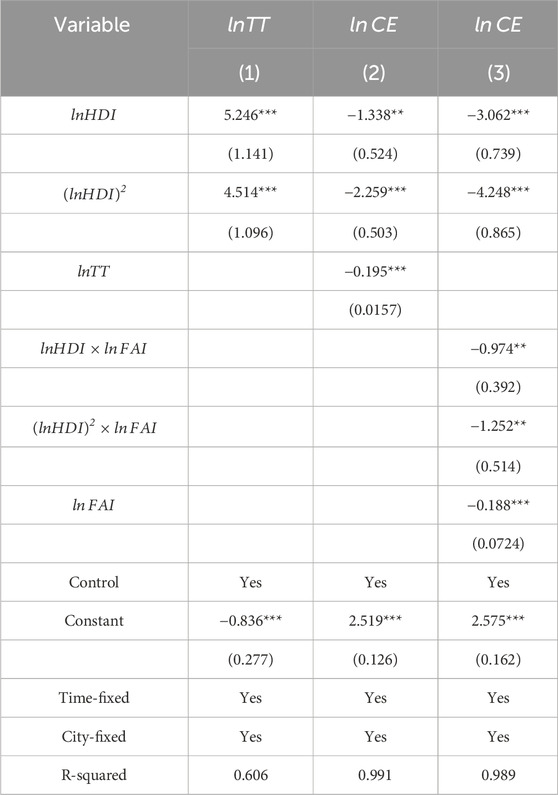
Table 5. Regression results of mediating and moderating effects.
The data in column (3) shows that investment intensity has a positive moderating effect on the connection between CO2 emissions and livelihood development, as seen by the significantly negative coefficients of both lnHDI*lnFAI and (lnHDI)2*lnFAI. Based on Haans and Pieters (Haans et al., 2016), the shift of the turning point and the curve’s shape can be used to analyze the moderating effect of investment intensity. The effect of investment intensity on the shape of the curve is mainly reflected by the positivity and negativity of
To examine geographical differences in the relationship between livelihood development and carbon emissions, group regressions are utilized. These regional variations are based on the Outline of the Plan for the Integrated Development of the Yangtze River Delta Region, which classifies 27 cities—including Shanghai, Nanjing, and Changzhou—as the center area and the remaining 14 as non-center area cities. The HDI and its squared term coefficients of the central cities are shown to be significantly negative at the 1% level in columns (1) through (2) of Table 6. The P-value of the Utest test is less than 0.01, indicating that the development of livelihood development and carbon emissions of the central cities have an inverted U-shaped relationship. The city in the central area has now passed the turning point, with an HDI value of 0.64, and the improvement of people’s livelihoods has demonstrated a carbon-reducing effect. The HDI and its squared term coefficient of non-central cities show a significant positive relationship, but they fail the U test. The rationale is that there is an incremental relationship between livelihood development and carbon emissions in non-central cities. It is indicated by the fact that all of these cities’ HDI are situated on the right side of the positive U-shaped curve’s inflection point. According to Lian, the Fisher’s Permutation test was used to determine the significance of the variation in coefficients across groups, with the number of samples set at 1000 (Lian et al., 2010). The results show that the p-values for the primary and secondary terms are less than 0.01, which suggests that there is a substantial difference between the two groups’ coefficients. Cities in the central region may gain from their better geographic location, quicker advancements in living standards, health, and education, higher degrees of livelihood development, and a population that is more aware of the need to protect the environment. However, when the level of livelihood development rises, non-central region cities will see an increase in energy consumption, which would raise carbon emissions.
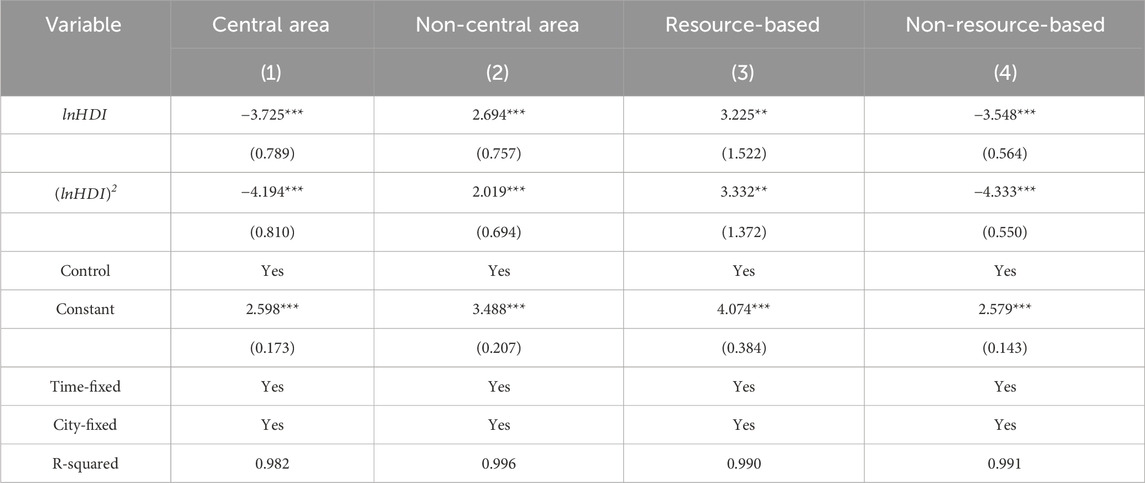
Table 6. Results of heterogeneity test.
The State Council’s National Sustainable Development Plan for Resource-based Cities (2013–2020) criteria is used to divide the cities under investigation into resource-based and non-resource-based categories. This categorization allows for a comparative examination of the ways in which the influence of livelihood development on carbon emissions differs depending on the resource endowment of these cities. The HDI and its squared term in resource-based cities show significantly positive coefficients from columns (3) to (4) of Table 6, but they fail the Utest test at the 5% significant level, suggesting that there is still evidence of a carbon-increasing effect in resource-based cities related to livelihood development. In non-resource cities, the relationship between the livelihood development and carbon emissions is formed like an inverted “U”. The results of the significance test for group differences in coefficients demonstrate a significant difference between the two groups’ coefficients. The explanation could be that non-resource cities are able to reduce carbon emissions through technological innovation and upgrading of the industrial structure, whereas resource cities have more abundant energy and resources and become unduly dependent on resources in the process of promoting urbanization, which raises carbon emissions (Yan et al., 2021).
This research measured the human development index and CO2 emissions from energy consumption using panel data from the Yangtze River Delta urban agglomeration from 2000 to 2021. It then built the STIRPAT model to examine the impact of livelihood development on reducing carbon emissions empirically. The findings of the study were as follows: (1) The relationship between livelihood development and carbon emissions shows an inverted “U” shape, indicating a large reduction in carbon emissions at this level. After a series of robustness tests, the finding holds true. (2) The mechanism test shows that by boosting investment in innovation, livelihood development lowers CO2 emissions. The regulation effect of investment intensity on the relationship between livelihood development and CO2 emissions is positive. The curve is more convex and the inflection point is somewhat pushed to the right under the regulation of investment intensity. (3) In central cities and non-resource cities, the relationship between livelihood development and CO2 emissions is more substantial in an inverted U shape.
In order to improve the livelihood development and meet the aim of carbon peaking as soon as feasible, this study makes the following recommendations for the Yangtze River Delta urban agglomeration based on the conclusions mentioned above.
Firstly, enhance public service systems for human development. To protect a higher degree of human development, the government should create a strong public service system for the entirety of human existence and implement the sharing of high-quality public services as soon as possible. To lessen the pollution that landfills and incineration contribute to the environment, hospitals and associated organizations should improve waste management and streamline medical service procedures. The government should aggressively maximize the distribution of educational resources, ensure that all citizens have access to high school education, and consistently raise the educational attainment of its citizens. For cities with high levels of HDI (e.g., Shanghai, Nanjing, Suzhou, and Hefei), they should focus on advanced waste management technologies and accelerate cross-jurisdictional sharing of high-quality healthcare and education resources through digital platforms to become regional centers of innovation and service excellence. As for cities with an average level of HDI (e.g., Anqing, Liuan, Fuyang, etc.), these cities should prioritize the improvement of basic waste management infrastructure and the expansion of educational opportunities in order to reduce regional disparities.
Secondly, promote innovation investment and green finance. The government ought to make the most of the regulatory effects of investment intensity and bolster the contribution of innovation investment to the reduction of carbon emissions. Local governments ought to support the green finance system and encourage the development of low-carbon technologies. When assigning fixed-asset investments, they also need to pay attention to green and sustainable projects. For these initiatives, it is imperative to improve environmental evaluations and openness. These initiatives will all have a major impact on reducing carbon emissions.
Thirdly, formulate policies in light of different characteristics of cities. Policies on livelihood development should be developed by the state and pertinent agencies in accordance with local circumstances. We can propose different policy concerns for different types of cities based on the heterogeneity analysis. On the one hand, in the regional heterogeneity analysis, we categorize the 41 cities into central area cities and non-central area cities according to the policy report. Central area cities (e.g., Shanghai, Hangzhou, Wuhu, etc.) should invest more in public services such as education and healthcare, build more low-carbon and energy-saving public facilities, and improve the quality of life for their residents. These central cities should play a leading role in promoting resource sharing and collaborative development with neighboring non-central cities through the establishment of regional cooperation mechanisms. Non-central area cities (e.g., Lianyungang, Lishui, Huangshan, etc.) should focus on improving public transportation and energy efficiency, leveraging their ecological advantages to create ecologically livable cities, and developing low-carbon industries such as eco-agriculture and rural tourism to promote residents’ employment and income generation. On the other hand, in the type heterogeneity analysis, we classify cities into resource-based cities and non-resource-based cities. Resource-based cities (e.g., Xuzhou, Suqian, Huzhou, etc.) should increase ecological restoration in resource extraction areas to improve the ecological environment and enhance residents’ quality of life. They should also accelerate the optimization of their energy structure, reducing dependence on traditional fossil fuels and increasing the use of renewable energy. Non-resource-based cities (e.g., Changzhou, Nantong, Ningbo, etc.) should promote the greening of public service facilities such as education and healthcare to improve energy efficiency and reduce carbon emissions. Additionally, these cities should strengthen scientific and technological innovation and support enterprises in the research and development and application of low-carbon technologies to enhance industrial competitiveness. These measures will not only reinforce the inverted U-shaped relationship between livelihood development and carbon emissions in central and non-resource-based cities but also facilitate the transition of non-central and resource-based cities to low-carbon development.
Although this study provides new insights into how livelihood development affects CO2 emissions, there are still some limitations. First, this study uses panel data from the Yangtze River Delta urban agglomeration rather than time series data from individual cities. The focus on quantitative analysis may not adequately capture the specific characteristics of each city. Therefore, specific findings and policy recommendations cannot be provided for each city. Additionally, this study focuses on the mediating role of innovation inputs and the moderating role of investment intensity between livelihood development and CO2 emissions in the Yangtze River Delta urban agglomeration. However, other potential influencing factors, such as public services and social trust, are not included in the analysis. This may affect the comprehensiveness of the mechanism analysis.
In response to these limitations, future research can be expanded and deepened in the following ways. First, conduct specific and in-depth urban analysis. Future research can use county-level data to conduct more specific and in-depth analyses of urban agglomerations, building on the overall impact studies. For example, using county-level carbon emissions data to analyze the heterogeneity of different counties in the relationship between livelihood development and carbon emissions can provide more targeted recommendations for city-level policymaking (Zhu et al., 2024). Second, enrich the mechanism variables. Future studies may consider adding factors such as public services and social trust as mechanism variables to enrich the current findings. For example, the optimization of public services may affect carbon emissions by improving residents’ quality of life and promoting green consumption (Prabhu and Pai, 2012). Social trust may play an important role in environmental protection by reducing CO2 emissions through social expectations and public opinion pressure (Zhang and Fu, 2023).
The raw data supporting the conclusion of this article will be made available by the authors, without undue reservation.
ZZ: Conceptualization, Formal Analysis, Funding acquisition, Software, Writing – review and editing. WL: Conceptualization, Data curation, Investigation, Methodology, Software, Validation, Visualization, Writing – original draft, Writing – review and editing.
The author(s) declare that financial support was received for the research and/or publication of this article. This work was supported by both the Research on Technology Benefit Sharing and Protection Mechanisms of China’s Direct Investments in Countries Along the Belt and Road Route under the Program of the National Social Science Foundation of China (20BJL063) and the Jiangsu Provincial Social Science Applied Research Excellence Project, “Research on Carbon Peak Prediction and Carbon Reduction Paths in Jiangsu Urban Agglomeration under the ‘Dual Carbon’ Target” (22SYB-119).
The authors declare that the research was conducted in the absence of any commercial or financial relationships that could be construed as a potential conflict of interest.
The authors declare that the research was conducted in the absence of any commercial or financial relationships that could be construed as a potential conflict of interest.
The author(s) declare that no Generative AI was used in the creation of this manuscript.
All claims expressed in this article are solely those of the authors and do not necessarily represent those of their affiliated organizations, or those of the publisher, the editors and the reviewers. Any product that may be evaluated in this article, or claim that may be made by its manufacturer, is not guaranteed or endorsed by the publisher.
The Supplementary Material for this article can be found online at: https://www.frontiersin.org/articles/10.3389/fenvs.2025.1523850/full#supplementary-material
1China City Statistical Yearbook: https://data.cnki.net/yearBook/single?id=N2024050590&pinyinCode=YZGCA.
2China Electric Power Yearbook: http://www.ceppc.org.cn/dlnj/.
3National Statistical Yearbook: https://www.stats.gov.cn/sj/ndsj/.
4National population census: https://www.stats.gov.cn/sj/pcsj/.
5World Bank: https://data.worldbank.org.
6City yearbooks and statistical bulletins: https://data.cnki.net/home.
7Outline of the 11th Five-Year Plan for National Economic and Social Development of the People’s Republic of China: https://www.gov.cn/gongbao/content/2006/content_268766.htm.
Aminetzah, D., Denis, N., Henderson, K., Katz, J., and Mannion, P. (2020). Agriculture and climate change Reducing agriculture emissions through improved farming practices.
Banday, U. J., and Kocoglu, M. (2023). Modelling simultaneous relationships between human development, energy, and environment: fresh evidence from panel quantile regression. J. Knowl. Econ. 14 (2), 1559–1581. doi:10.1007/s13132-022-00921-2
Baron, R. M., and Kenny, D. A. (1986). The moderator–mediator variable distinction in social psychological research: conceptual, strategic, and statistical considerations. J. personality Soc. Psychol. 51 (6), 1173–1182. doi:10.1037/0022-3514.51.6.1173
Bond, S., Leblebicioǧlu, A., and Schiantarelli, F. (2010). Capital accumulation and growth: a new look at the empirical evidence. J. Appl. Econ. 25 (7), 1073–1099. doi:10.1002/jae.1163
Chen, M., Liu, Y., Liu, W., and Wang, S. (2020). Measurement, source decomposition and formation mechanism of regional differences in urban livelihood development in China. Statistical Research 37 (5), 54–67. doi:10.13653/j.cnki.jqte.2020.01.002
Chen, Z., Wu, S., Ma, W., Liu, X., Cai, B., Liu, J., et al. (2018). Driving forces of carbon dioxide emission for China’s cities: empirical analysis based on extended STIRPAT Model. China Popul. Resour. Environ. 28 (10), 45–54. doi:10.12062/cpre.20180729
Cracolici, M. F., Cuffaro, M., and Nijkamp, P. (2010). The measurement of economic, social and environmental performance of countries: a novel approach. Soc. Indic. Res. 95, 339–356. doi:10.1007/s11205-009-9464-3
Cumming, G. S., and von Cramon-Taubadel, S. (2018). Linking economic growth pathways and environmental sustainability by understanding development as alternate social–ecological regimes. Proc. Natl. Acad. Sci. 115 (38), 9533–9538. doi:10.1073/pnas.1807026115
Fan, Z., and Pei, X. (2023). Spatial-temporal Evolution and Analysis of Influencing Factors of Energy Consumption and in the Yangtze River Economic. Belt. Resour. Resour. Environ. Yangtze Basin 32, 2225–2236. doi:10.11870/cjlyzyyhj202311001
Grossman, G. M., and Krueger, A. B. (1995). Economic growth and the environment. Q. J. Econ. 110 (2), 353–377. doi:10.2307/2118443
Guan, D., Meng, J., Reiner, D. M., Zhang, N., Shan, Y., Mi, Z., et al. (2018). Structural decline in China’s CO2 emissions through transitions in industry and energy systems. Nat. Geosci. 11 (8), 551–555. doi:10.1038/s41561-018-0161-1
Haans, R. F., Pieters, C., and He, Z. L. (2016). Thinking about U: theorizing and testing U-and inverted U-shaped relationships in strategy research. Strategic Manag. J. 37 (7), 1177–1195. doi:10.1002/smj.2399
Han, F., and Xie, R. (2017). Does the agglomeration of producer services reduce carbon emissions. J. Quant. Tech. Econ. 34 (03), 40–58. doi:10.13653/j.cnki.jqte.2017.03.003
He, Y., Lin, Y., Zhou, G., Zhu, Y., and Tang, K. (2021). Spatial pattern and drivers of urbanization in China’s mid-level developing urban agglomeration: a case study of Chang-Zhu-Tan. Reg. Sustain. 2 (1), 83–97. doi:10.1016/j.regsus.2020.12.001
Hussain, A., and Dey, S. (2021). Revisiting environmental Kuznets curve with HDI: new evidence from cross-country panel data. J. Environ. Econ. Policy 10 (3), 324–342. doi:10.1080/21606544.2021.1880486
Kijewska, A., and Bluszcz, A. (2016). Analysis of greenhouse gas emissions in the European Union member states with the use of an agglomeration algorithm. J. Sustain. Min. 15 (4), 133–142. doi:10.1016/j.jsm.2017.02.001
Kuznets, S. (1955). Economic growth and income inequality. Am. Econ. Rev. 45 (1), 1–28. doi:10.4324/9780429311208-4
Kvon, G. M., Prokopyev, A. I., Shestak, V. A., Larionova, A. A., and Shikh, E. V. (2019). Features of cost advantages from implementation of energy-saving projects. Int. J. Energy Econ. Policy 9 (3), 53–58. doi:10.32479/ijeep.7645
Lian, Y., Peng, F., and Su, Z. (2010). Financing constraints and liquidity management behavior. Journal of Financial Research 10, 158–171.
Liu, C., Nie, F., and Ren, D. (2020). Research on the measurement of human development level in China: Research on HDI Expansion Based on New development Concept. Inquiry into Econ. Issues 3, 58–73.
Liu, P., and Mu, Y. (2024). Green finance, carbon trading and industrial performance:Influencing mechanism and evidence from the 7 pilot projects of China. China Soft Sci. 4, 25–36. doi:10.3969/j.issn.1002-9753.2024.04.003
Liu, Y., Gao, C., and Lu, Y. (2017). The impact of urbanization on GHG emissions in China: the role of population density. J. Clean. Prod. 157, 299–309. doi:10.1016/j.jclepro.2017.04.138
Ma, M., Rozema, J., Gianoli, A., and Zhang, W. (2022). The impacts of city size and density on CO 2 emissions: evidence from the Yangtze River Delta urban agglomeration. Appl. Spatial Analysis Policy 15, 529–555. doi:10.1007/s12061-021-09406-2
Majewska, A., and Gierałtowska, U. (2022). Impact of economic affluence on CO2 emissions in CEE countries. Energies 15 (1), 322. doi:10.3390/en15010322
Maji, I. K. (2019). Impact of clean energy and inclusive development on CO2 emissions in sub-Saharan Africa. J. Clean. Prod. 240, 118186. doi:10.1016/j.jclepro.2019.118186
Marra, A., Antonelli, P., Dell’Anna, L., and Pozzi, C. (2015). A network analysis using metadata to investigate innovation in clean-tech–Implications for energy policy. Energy Policy 86, 17–26. doi:10.1016/j.enpol.2015.06.025
Michalos, A. C., and Hatch, P. M. (2020). Good societies, financial inequality and secrecy, and a good life: from Aristotle to Piketty. Appl. Res. Qual. Life 15, 1005–1054. doi:10.1007/s11482-019-09717-0
Mohmmed, A., Li, Z., Arowolo, A. O., Su, H., Deng, X., Najmuddin, O., et al. (2019). Driving factors of CO2 emissions and nexus with economic growth, development and human health in the Top Ten emitting countries. Resour. Conservation Recycl. 148, 157–169. doi:10.1016/j.resconrec.2019.03.048
Morse, S. (2020). To rank or not to rank with indices? That is the question. Sustainability 12 (14), 5572. doi:10.3390/su12145572
Pala, O. (2024). Assessment of the social progress on European Union by logarithmic decomposition of criteria importance. Expert Syst. Appl. 238, 121846. doi:10.1016/j.eswa.2023.121846
Prabhu, A., and Pai, M. (2012). Buses as low-carbon mobility solutions for urban India: evidence from two cities. Transp. Res. Rec. 2317 (1), 15–23. doi:10.3141/2317-03
Ren, D., Cao, G., and Long, S. (2021). Analysis of the coordination degree of social development in China based on the framework of HDI. J. Quant. Technol. Econ 38, 88–106. doi:10.13653/j.cnki.jqte.2021.06.004
Sen, A., Stiglitz, J., and Fitoussi, J.-P. (2010). Mis-measuring our lives: why GDP doesn't add up?.
Shao, S., Liu, J., Geng, Y., Miao, Z., and Yang, Y. (2016). Uncovering driving factors of carbon emissions from China’s mining sector. Appl. Energy 166, 220–238. doi:10.1016/j.apenergy.2016.01.047
Tyagi, S., Tiwari, S., Mishra, A., Hopke, P. K., Attri, S. D., Srivastava, A. K., et al. (2016). Spatial variability of concentrations of gaseous pollutants across the National Capital Region of Delhi, India. Atmos. Pollut. Res. 7 (5), 808–816. doi:10.1016/j.apr.2016.04.008
Tyrrell, T. (2011). Anthropogenic modification of the oceans. Philosophical Trans. R. Soc. A Math. Phys. Eng. Sci. 369 (1938), 887–908. doi:10.1098/rsta.2010.0334
UNDP (2024). Human development report 2023-24. UNDP (New York: United Nations Development Programme).
UNDP, THU-CIDP, and Center, S.I. (2019). China Institute for Development Planning at Tsinghua University. National Human Development Report Special Edition. (Beijing).
Van Tran, N., Van Tran, Q., Do, L. T. T., Dinh, L. H., and Do, H. T. T. (2019). Trade off between environment, energy consumption and human development: do levels of economic development matter? Energy 173, 483–493. doi:10.1016/j.energy.2019.02.042
Wan, Z., el Makhloufi, A., Chen, Y., and Tang, J. (2018). Decarbonizing the international shipping industry: solutions and policy recommendations. Mar. Pollut. Bull. 126, 428–435. doi:10.1016/j.marpolbul.2017.11.064
Wang, D., Hou, Y., Li, X., Huang, Y., and Wang, Y. (2022). Spatio-temporal analysis of China's livelihood development: evidence from a functional index model. Appl. Spatial Analysis Policy 15 (4), 1493–1523. doi:10.1007/s12061-022-09460-4
Wang, M., Kang, W., and Zhang, B. (2019). A study on the characteristics of China Human Development Index and driving forces since the reform and opening-up. China Population, Resources and Environment 29 (10), 70–78. doi:10.12062/cpre.20190632
Wang, S., Huang, Y., and Zhou, Y. (2019). Spatial spillover effect and driving forces of carbon emission intensity at the city level in China. J. Geogr. Sci. 29, 231–252. doi:10.1007/s11442-019-1594-1
Wang, S., Luo, Y., Han, Y., and Li, J. (2018). Regional difference and determinants of human well-being in China: based on the analysis of human development index. Progress in Geography 37 (8), 1150–1158. doi:10.18306/dlkxjz.2018.08.014
Wei, T. (2011). What STIRPAT tells about effects of population and affluence on the environment? Ecol. Econ. 72, 70–74. doi:10.1016/j.ecolecon.2011.10.015
Will, S., Paul, J. C., and John, R. M. (2007). The anthropocene: are humans now overwhelming the great forces of nature. AMBIO A J. Hum. Environ. 36 (8), 614–621. doi:10.1579/0044-7447(2007)36[614:TAAHNO]2.0.CO;2
Wu, Y., and Xu, H. (2023). The effect of FDI agglomeration on carbon emission intensity: evidence from city-level data in China. Sustainability 15 (2), 1716. doi:10.3390/su15021716
Yan, J., Zhao, J., Yang, X., Su, X., Wang, H., Ran, Q., et al. (2021). Does low-carbon city pilot policy alleviate urban haze pollution? Empirical evidence from a quasi-natural experiment in China. Int. J. Environ. Res. Public Health 18 (21), 11287. doi:10.3390/ijerph182111287
Yang, S., Zhang, Y., and Geng, Y. (2022). An LMDI-based investigation of the changes in carbon emissions of the transportation sector in the Yangtze River Economic Belt. China Environmental Science 42 (10), 4817–4826. doi:10.3969/j.issn.1000-6923.2022.10.040
Yang, Y., and Niu, X. (2023). Impact of social trust on the effectiveness of environmental regulations on carbon emission reduction: based on panel data from 281 prefecture-level cities in China. China Popul. Resour. Environ 33, 82–92. doi:10.12062/cpre.20221030
Ye, X., Xie, C., and Mao, Z. (2018). The sense of gain and the satisfaction of people’s livelihood in China: measuring and variance analysis. The Journal of Quantitative & Technical Economics 35 (10), 3–20. doi:10.13653/j.cnki.jqte.2018.10.001
York, R., Rosa, E. A., and Dietz, T. (2003). STIRPAT, IPAT and ImPACT: analytic tools for unpacking the driving forces of environmental impacts. Ecol. Econ. 46 (3), 351–365. doi:10.1016/s0921-8009(03)00188-5
Yumashev, A., Ślusarczyk, B., Kondrashev, S., and Mikhaylov, A. (2020). Global indicators of sustainable development: evaluation of the influence of the human development index on consumption and quality of energy. Energies 13 (11), 2768. doi:10.3390/en13112768
Zalasiewicz, J., Williams, M., Haywood, A., and Ellis, M. (2011). The Anthropocene: a new epoch of geological time? Philosophical Trans. R. Soc. A Math. Phys. Eng. Sci. 369 (1938), 835–841. doi:10.1098/rsta.2010.0339
Zhang, Y., and Fu, B. (2023). Social trust contributes to the reduction of urban carbon dioxide emissions. Energy 279, 128127. doi:10.1016/j.energy.2023.128127
Zhenjun, Y., Shun, S., Hao, H., Hongyan, A., Wang, L., and Qianhao, L. (2023). Research on the level of fishery mechanization in Beijing based on trend extrapolation. Journal of Chinese Agricultural Mechanization 44 (6), 217. doi:10.13733/j.jcam.issn.2095-5553.2023.06.031
Zhu, Z., Qi, X., Jia, Y., and Huang, r. (2024). Analysis of spatial-temporal pattern and influencing factors of CO2 emissions in the Yangtze River Delta urban agglomeration. Resources and Environment in the Yangtze Basin 33, 242–253. doi:10.11870/cjlyzyyhj202402002
Keywords: CO2 emissions from energy consumption, human development index, Yangtze River delta urban agglomeration, livelihood development, fixed effect model
Citation: Zhu Z and Lin W (2025) Impact of livelihood development on CO2 emissions: empirical evidence from Yangtze River delta urban agglomeration. Front. Environ. Sci. 13:1523850. doi: 10.3389/fenvs.2025.1523850
Received: 06 November 2024; Accepted: 24 March 2025;
Published: 09 April 2025.
Edited by:
Ji Zheng, The University of Hong Kong, Hong Kong SAR, ChinaReviewed by:
Ying Zhu, Xi’an University of Architecture and Technology, ChinaCopyright © 2025 Zhu and Lin. This is an open-access article distributed under the terms of the Creative Commons Attribution License (CC BY). The use, distribution or reproduction in other forums is permitted, provided the original author(s) and the copyright owner(s) are credited and that the original publication in this journal is cited, in accordance with accepted academic practice. No use, distribution or reproduction is permitted which does not comply with these terms.
*Correspondence: Wenxue Lin, bGlud2VueHVlMjAxOUAxNjMuY29t
Disclaimer: All claims expressed in this article are solely those of the authors and do not necessarily represent those of their affiliated organizations, or those of the publisher, the editors and the reviewers. Any product that may be evaluated in this article or claim that may be made by its manufacturer is not guaranteed or endorsed by the publisher.
Research integrity at Frontiers
Learn more about the work of our research integrity team to safeguard the quality of each article we publish.