 Parveen Kumar
 Nudrat Fatima2
 Muhammad Kamran Khan
94% of researchers rate our articles as excellent or good
Learn more about the work of our research integrity team to safeguard the quality of each article we publish.
Find out more
ORIGINAL RESEARCH article
Front. Environ. Sci. , 28 February 2025
Sec. Environmental Economics and Management
Volume 13 - 2025 | https://doi.org/10.3389/fenvs.2025.1391418
This article is part of the Research Topic Greenhouse Gas Emission (GHG) Reduction and Economic Structural Transformation View all 18 articles
This study investigates the key factors influencing CO2 emissions in the state of Haryana from 2005 to 2023, focusing on economic and demographic determinants. Understanding the relationship between economic growth, population dynamics, and environmental impact is crucial for formulating effective sustainable development policies. The study employs a comprehensive dataset where CO2 emissions serve as the dependent variable, while Net State Domestic Product (NSDP) at constant prices, the square of NSDP, population growth, and life expectancy act as independent variables. To ensure robust analysis, stationarity tests are conducted to assess the data properties, followed by Dynamic Ordinary Least Squares (DOLS) and Canonical Cointegration Regression to explore long-run relationships among these variables. Empirical findings indicate a positive and statistically significant relationship between CO2 emissions, NSDP, and population growth, suggesting that economic expansion and population increase drive higher emissions. Conversely, life expectancy exhibits a negative association with CO2 emissions, implying that improvements in public health and longevity may contribute to reduced emissions. The results highlight the environmental challenges posed by economic and demographic growth, emphasizing the need for balanced policy measures that align economic progress with sustainability goals. The unexpected negative relationship between life expectancy and emissions underscores the complex interplay between socioeconomic development and environmental sustainability, warranting further investigation.
The imminent threat of global warming has garnered widespread attention on both international and national stages, underscoring its urgency. As the Earth’s climate continues to evolve, the consequences of rising temperatures (Ghoshal and Bhattacharya, 2008; CMIE, 2011), shifting weather patterns, and environmental disruptions are becoming increasingly evident. At the heart of this global challenge lies the critical concern of greenhouse gas emissions, with carbon dioxide (CO2) being a pivotal contributor (Lamb et al., 2021). Reducing emissions can help address climate change, expand access to clean energy, and promote socio-economic development in nations (Mehmood et al., 2023). India, as one of the world’s most populous and rapidly developing nations, plays a substantial role in the global climate landscape (Kumar, 2020). The country’s economic growth, industrialization, and urbanization have led to a surge in energy consumption (Wang et al., 2023), often driven by the burning of fossil fuels. India’s energy demand is rising rapidly, with significant implications for the global energy market (Radulescu et al., 2024; Liu et al., 2023). The Government of India has made substantial progress in expanding access to electricity and clean cooking solutions while implementing various energy market reforms and integrating a high share of renewable energy sources into its grid. With a population of 1.45 billion and a rapidly growing economy, India’s energy needs are surging as the nation urbanizes and its manufacturing sector expands (CMIE, 2011). This increased demand is met through a diverse mix of energy sources, with coal expected to remain the dominant energy supplier. Furthermore, India continues to strengthen its institutional framework to attract the necessary investments to meet its growing energy needs. The energy sector, largely reliant on fossil fuels, is a major contributor to greenhouse gas emissions and climate change (Liu et al., 2023). Under the Paris Climate Agreement, India has pledged to decrease the emissions intensity of its gross domestic product (GDP) by 33%–35% from 2005 to 2030, a significant increase from its previous commitment of a 20%–25% reduction from 2005 to 2020 (NAPCC, 2008). Consequently, India’s carbon footprint has expanded significantly, making it one of the top contributors to global CO2 emissions. India’s global share of CO2 emissions reached 7.07% in 2022, marking an increase of 182% since 2000 (OWID, 2024). Haryana, one of the northernmost states in India, is strategically located adjacent to the national capital, Delhi, and is bordered by Uttar Pradesh to the east, Punjab to the west, Himachal Pradesh to the north, and Rajasthan to the south. The state encircles New Delhi from three sides and is one of India’s major automobile hubs, contributing to two-thirds of the country’s passenger car production, 50% of its tractors, and 60% of its motorcycles. In addition to its strength in the automotive sector, Haryana has also emerged as a prominent base for the knowledge industry, particularly in IT and biotechnology. Haryana’s development trajectory, marked by industrial growth, agricultural activities, and urban expansion, offers a unique case study for understanding localized drivers of CO2 emissions. Throughout the reference period, Haryana’s per capita emissions consistently exceeded the national average (OWID, 2024). The state’s emissions witnessed a notable rise, climbing from 39.57 million metric tons of CO2 in 2005 to 75.72 million metric tons of CO2 in 2023. The proportion of emissions originating from the energy sector within the broader spectrum of economy-wide emissions increased from approximately 70% in 2005 to around 77% in 2023. Concurrently, the contribution of emissions from the Industrial Processes and Product Use (IPPU) sector escalated from about 2% in 2005 to roughly 8% in 2018. In contrast, the percentage of emissions associated with the agriculture, forestry, and other land-use sector declined from approximately 24% in 2005 to about 12% in 2023. Haryana’s CO2 emission levels are significantly higher compared to many other Indian states due to its industrial belt, high vehicular density, and extensive agricultural burning practices. Key metrics often show that Haryana’s air quality index frequently exceeds safe limits, with CO2 and particulate matter (PM2.5, PM10) levels consistently above the national averages. As Haryana continues to evolve, so do its challenges and responsibilities in the realm of environmental sustainability. Furthermore, emissions from the waste sector decreased from around 4% in 2005 to roughly 3% in 2023 (GHGPI 2023). Previous studies have extensively explored the relationship between GDP and environmental degradation in India and other countries; however, there is a noticeable gap in research specifically focusing on Haryana, particularly with a quadratic approach to GDP. This study introduces novel dimensions by incorporating indicators such as CO2 emissions, economic growth in terms of GDP per capita, and the square of GDP to test the Environmental Kuznets Curve (EKC) hypothesis. Additionally, factors like population growth and life expectancy are included. This approach provides a more nuanced understanding of the complex relationship between economic growth and environmental degradation, enriching the existing literature by examining less conventional variables.
The remainder of the paper is structured as follows: Section 2 delves into the literature review, while Section 3 expounds on the methodological considerations for estimating CO2 emissions in Haryana, including an overview of the data sources utilized. In Section 4, we present the state-level results, and the concluding remarks can be found in Section 5.
Numerous studies have identified a dynamic relationship between economic growth variables and environmental degradation. For example, Danish et al. (2021) analyzed the Indian economy from 1971 to 2018, focusing on CO2 emissions, nuclear energy, population density, and GDP using the Dynamic Autoregressive Distributed Lag Model (DARDL). They concluded that both nuclear energy and population density contribute to the Environmental Kuznets Curve (EKC). Ohlan (2015) explored the impact of population density, energy consumption, economic growth, and trade openness on CO2 emissions during the period 1970–2013. The study confirmed a long-run relationship between these factors, showing that population density, energy consumption, and economic growth significantly increased CO2 emissions. A similar study conducted by Pandey and Rastogi (2018) for the period 1971 to 2017 found that economic growth led to an increase in CO2 emissions. Kartal et al. (2023) investigated the long-term implications of reduced coal consumption on energy usage, CO2 emissions, and economic growth, focusing specifically on China and India. Utilizing yearly data from 1990 to 2021 and employing an innovative dynamic autoregressive distributed lag model, their findings revealed that coal consumption causally influenced CO2 emissions. Mehmood et al. (2024) examined the relationship between various types of CO2 emissions and economic growth in the United States and China using the bootstrap autoregressive distributed lag approach. Their findings indicated that CO2 emissions from coal exceeded those from oil in both countries. The study also revealed a positive correlation between GDP and CO2 emissions. Akram et al. (2023) conducted a study to analyze the convergence and divergence of CO2 emissions across 16 major Indian states from 2003 to 2019. They found that Haryana continues to follow an upward trajectory in per capita CO2 emissions during the study period. Acheampong (2019) examined the complex interplay between economic growth, energy consumption, and CO2 emissions in sub-Saharan Africa and globally over the past decade. The study uncovered that economic expansion stimulated energy consumption in sub-Saharan Africa while simultaneously reducing carbon emissions globally and in the Caribbean Latin American region. Interestingly, carbon emissions positively correlated with economic growth, while energy consumption had an adverse impact on GDP in most regions. An Environmental Kuznets Curve (EKC) phenomenon was observed both globally and within sub-Saharan Africa, highlighting the intricate relationship between economic advancement and environmental considerations over the past decade. Jian et al. (2021) analyzed the influence of non-economic factors on energy consumption and CO2 emissions in China from 1991 to 2019. The study found that education, law and order, and social globalization had a mitigating effect, while population growth positively correlated with energy consumption and CO2 emissions during this period. Yuping et al. (2021) employed advanced econometric methodologies to examine the short- and long-term elasticities of CO2 emissions from various macroeconomic factors. Their findings indicated that renewable energy consumption and globalization contributed to reducing CO2 emissions, whereas non-renewable energy sources had a negative impact. The study also confirmed the EKC hypothesis in Argentina, showing that economic growth initially increased environmental pollution until a certain income threshold was reached, beyond which further growth reduced the environmental impact. Khezri et al. (2022) conducted an in-depth investigation into the impact of renewable energy deployment on short-term emissions reductions across 19 advanced and developing nations, including 17 countries in sub-Saharan Africa. The study revealed that increased economic complexity was associated with higher energy efficiency and reduced CO2 emissions. It also suggested that adopting renewable energy sources could effectively mitigate short-term carbon emissions, particularly in nations with lower economic complexity. Armeanu et al. (2018) explored the relationship between pollution and the economy within EU-28 countries, focusing on the EKC theory. Using data from 1990 to 2014 and a specialized mathematical model, the study provided evidence supporting the EKC theory for specific pollution categories. They found correlations between GDP per capita and greenhouse gas pollution, as well as between energy consumption and greenhouse gas pollution. The analysis indicated that economic growth led to increased greenhouse gas pollution in the short term, and there was a bidirectional relationship between energy usage and greenhouse gas pollution. Liu et al. (2023), Kumar (2019), and Ramadhan et al. (2023) found that urban population growth increased demands for vehicles, buildings, and food, leading to higher greenhouse gas (GHG) emissions. Urbanization triggered changes in housing, household size, and industrial structure, driving up energy demand and CO2 emissions. Cavusoglu and Gimba (2021) found that over the long term, inflation and CO2 emissions negatively affected life expectancy, while GDP per capita, food production, human capital, and health expenditure had a notably positive influence. Das and Debnath (2023) investigated the net impact of CO2 emissions on life expectancy in India. Using the ARDL cointegration technique, the study concluded that there is a long-term and quadratic relationship between life expectancy and CO2 emissions. Wang and Li (2021) investigated 154 countries and observed that population aging, per capita GDP, population density, and life expectancy have non-linear effects on per capita CO2 emissions, whereas population, urbanization, and unemployment have linear effects. Several studies, such as those by Rajan et al. (2020) and Tam et al. (2023), have explored greenhouse gas (GHG) emissions in India using various methodologies, including annual energy statistics and input-output methods, primarily at the national level. However, our review identifies a research gap concerning Haryana, where no studies have examined the relationship between net state domestic product, life expectancy, population growth, and CO2 emissions at the state level. This paper aims to address this gap by analyzing the multifaceted factors influencing CO2 emissions in Haryana from 2005 to 2023.
The EKC hypothesis, first proposed by Grossman and Krueger in 1995, posits a link between environmental degradation and economic development. According to this hypothesis, there is an inverted U-shaped relationship between environmental decline and economic progress. Initially, environmental degradation increases with economic growth, but it eventually decreases after reaching a certain income threshold. This concept serves as a key indicator of a country’s stage of economic development. They have described this relationship as follows:
In Equation 1, CO2 represents carbon dioxide emissions, NSDP denotes net state domestic product, NSDPS indicates the square of Net State Domestic Product, while Zt represents other factors influencing the dependent variable (life expectancy and population growth) in our study (Table 1). Additionally,
Table 1. Description of the variables.
In our subsequent empirical analysis, author elucidates the procedures for addressing heteroscedasticity’s impact by logarithmically transforming variables, following the approach recommended by Wang and Zhang (2020).
In the transformed equation, the ln denotes the natural logarithm; the subscripts’t’ (t = 1, …, T) refer to the time dimensions, respectively. The parameters
In our research, we utilize advanced econometric tools such as the Augmented Dickey-Fuller (ADF) test and the Phillips-Perron (PP) test for unit root analysis, Dynamic Ordinary Least Squares (DOLS), and Canonical Cointegration Regression to systematically investigate the multifaceted factors influencing CO2 emissions in Haryana, India. This rigorous methodology is designed to provide a comprehensive analysis of the intricate dynamics at play within the region, aiming to contribute meaningfully to the broader discourse on climate change mitigation. Our findings will offer valuable insights to inform policymakers’ decisions, empower researchers, and benefit stakeholders invested in Haryana’s sustainable development. Our analytical journey begins with the essential Unit Root Test, a fundamental step in time series analysis, employing the Augmented Dickey-Fuller (ADF) test. The primary objective here is to ascertain whether differencing is necessary to render the data stationary, a crucial consideration for subsequent analyses. We then employ Dynamic Ordinary Least Squares (DOLS) and follow Cheung and Lai (1995) for lag criteria, a powerful econometric technique renowned for its effectiveness in estimating cointegrated time series models. DOLS is particularly valuable when analyzing long-term relationships between variables, as it accounts for endogeneity and autocorrelation issues commonly encountered in time series data, ensuring the robustness of our analysis. Additionally, we utilize Canonical Cointegration Regression to further our analysis. This technique considers the cointegrating vectors among variables, capturing the essence of long-term relationships and allowing us to identify the strength and nature of these interactions over time. By examining how CO2 emissions, NSDP, population growth, and other factors interact, we aim to shed light on the complex dynamics influencing environmental and economic outcomes in Haryana.
Descriptive statistics for all variables under analysis are presented in Table 2. CO2 has a mean value of 19.41 in the sample, with a maximum value of 19.66 and a minimum value of 18.95. Regarding NSDP, the average value is 17.03, ranging from a minimum of 15.97 to a maximum of 17.96. Similarly, for Population growth, the mean and median values are 1.56 and 1.43, respectively, with a standard deviation of 0.18. For life expectancy; the mean and standard deviation are 68.68 and 1.10, respectively.
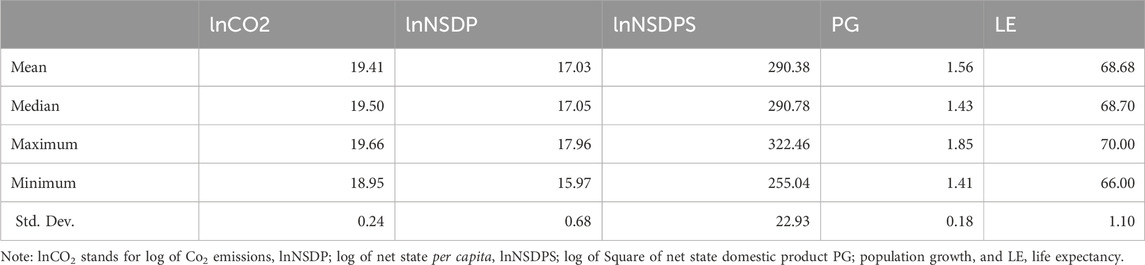
Table 2. Descriptive statistics.
The pairwise correlation matrix is presented in Table 3. The results demonstrate a strong positive correlation between CO2 emissions, NSDP and NSDP. The correlation coefficient between CO2 emissions and life expectancy is 0.68 and a moderate positive correlation between GDP and life expectancy. However, there exists a weak negative correlation between CO2 emission and population growth (PG).
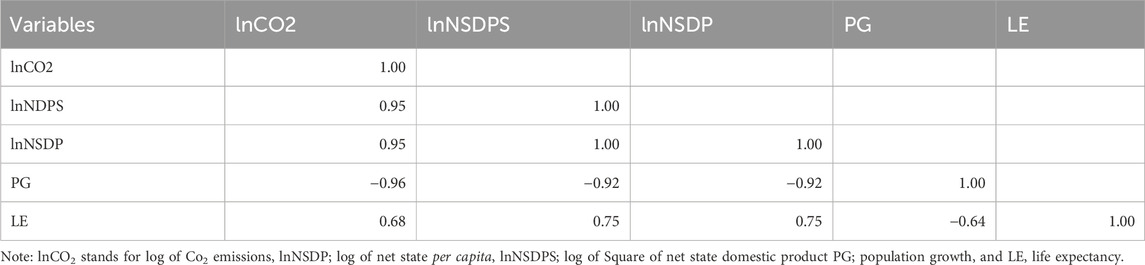
Table 3. Correlation analysis.
The unit root test results in Table 4 evaluate whether the given variables are stationary at their levels or require differencing to become stationary. The table presents findings from both the Augmented Dickey-Fuller (ADF) test and the Phillips-Perron (PP) test Phillips and Perron (1998). The variables lnCO2, lnNDPS, and lnNSDP are non-stationary at their levels but become stationary after first differencing. In contrast, the variables PG and LE are stationary at their levels. Table 5 provides insights into the annual growth rate of CO2 emissions from 2006 to 2023. The second column represents the percentage change in CO2 emissions specifically related to agriculture and allied activities. Within the Agriculture, Forestry, and Other Land Use (AFOLU) sector, emissions originate from three primary sub-sectors: Livestock, Land and Aggregate Sources, and Non-CO2 Emission Sources on Land. The third and fourth columns also detail various sources of CO2 emissions.
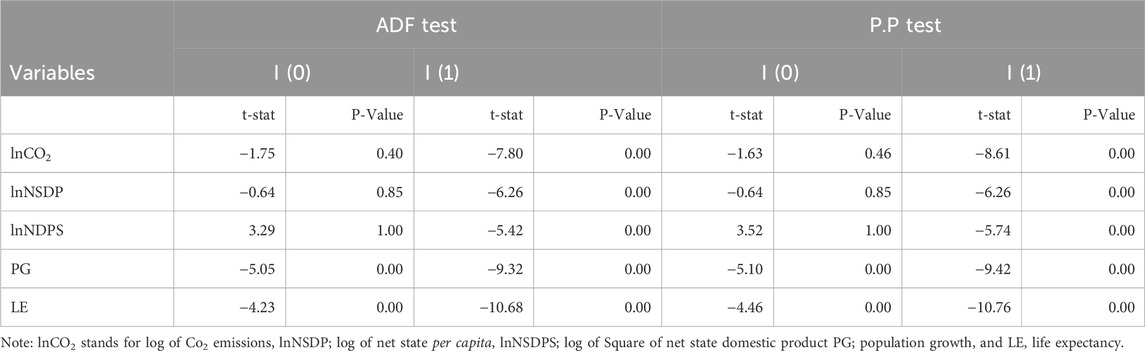
Table 4. Results of Unit root test.
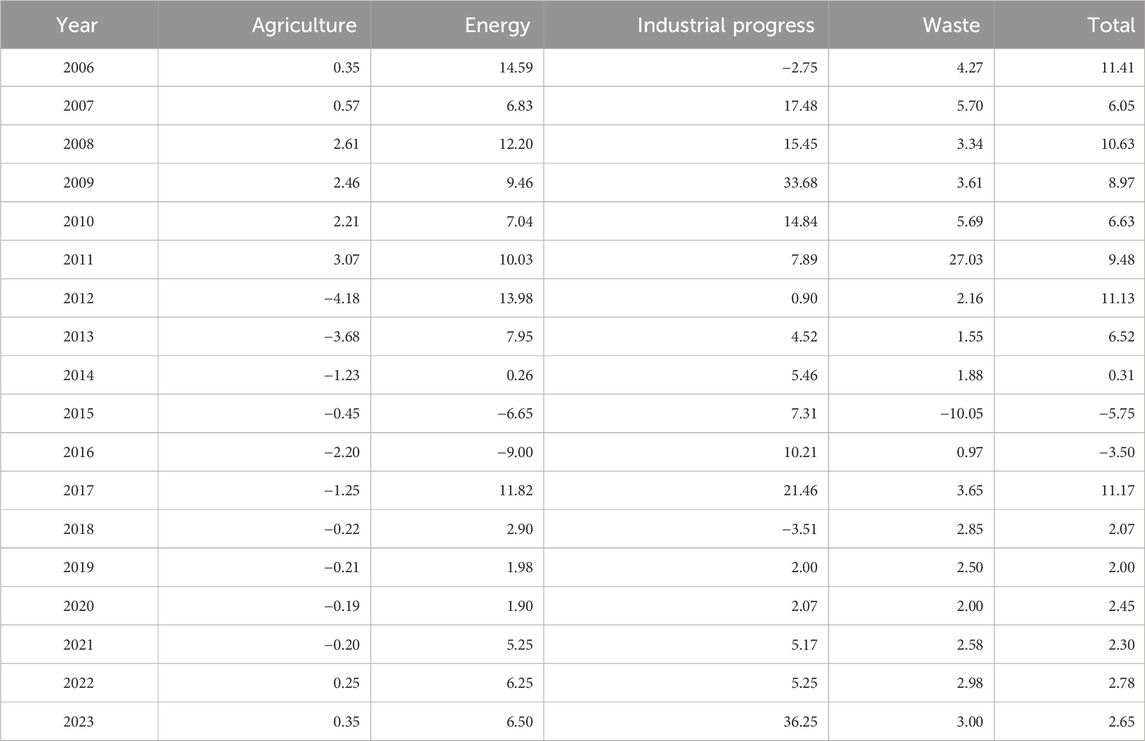
Table 5. Annual Growth Rate of CO2 emission.
The emissions from the Energy sector are categorized into two main components: Fuel Combustion and Fugitive Emissions. Fuel Combustion includes emissions from various sources such as Public Electricity Generation, Transportation, Captive Power Plants, Industrial Processes, Agricultural Activities, Commercial Operations, and Residential Use. Fugitive Emissions, on the other hand, primarily result from fuel production. In the Industrial Processes and Product Use (IPPU) sector, emissions are predominantly driven by the Chemical, Metal, and Mineral Industries, as well as Non-Energy Products from Fuels and Solvent Use. Within the Waste sector, key sources of greenhouse gas (GHG) emissions include Solid Waste Disposal, Domestic Wastewater, and Industrial Wastewater. In the context of Haryana, the Waste sector contributed nearly 3% of the total economy-wide emissions in 2022 (Figure 1).
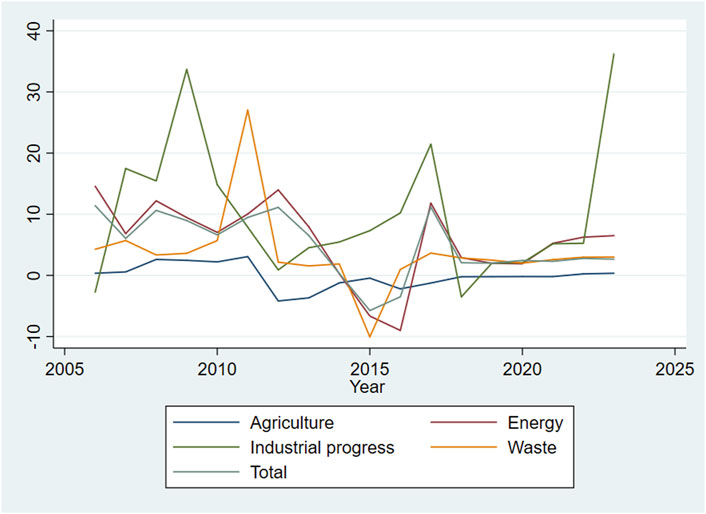
Figure 1. Annual CO2 emission Growth from different Sectors.
The results of the Dynamic Ordinary Least Squares (DOLS) regression analysis, presented in Table 6, By utilizing Equation 3 offer valuable insights into the intricate relationship between various factors and CO2 emissions. The coefficient for NSDP indicates that a one-percent increase in NSDP leads to a significant increase of 2.22 percent in CO2 emissions. This positive coefficient implies that higher values of NSDP are associated with elevated CO2 emissions, and this relationship is highly statistically significant, with a p-value of 0.00. The coefficient for the log of NSDPS is −0.06. This signifies that with each one-unit increase in the log of NSDS, there is a corresponding decrease of 0.06 units in the log of CO2 emissions. This negative coefficient suggests that as a nation’s Net State Domestic Product (NSDP) grows, there is a tendency for CO2 emissions to decrease. This coefficient is also statistically significant, with a p-value of 0.00, implying a robust and reliable relationship between NSDPS and CO2 emissions. This aligns with the Environmental Kuznets Curve (EKC) concept, indicating that environmental quality may initially deteriorate with economic development before ultimately improving. Our findings are consistent with previous research by Grossman and Krueger (1991), Kumar and Radulescu (2024), Aldy (2005), and Hanif (2018). Examining PG (Annual Population Growth), the coefficient of 0.56 suggests that a one-unit increase in annual population growth results in a moderate increase of 0.56 units in the log of CO2 emissions. A larger population naturally leads to heightened energy demands for heating, cooling, transportation, and electricity, primarily met by fossil fuels like coal, oil, and natural gas, all of which emit CO2 when burned. Additionally, accommodating the growing populace triggers rapid industrialization and urbanization, fostering energy-intensive industries, expanding infrastructure, and extensive transportation networks—all contributors to increased CO2 emissions. The denser population in Haryana necessitates more transportation services, including fossil fuel-dependent modes like cars and airplanes, further elevating emissions. Extensive agricultural activities to feed the larger population, particularly livestock farming, generate methane emissions, adding to the state’s carbon footprint. Moreover, heightened consumerism results in increased production and disposal of goods, often with associated carbon footprints. Infrastructure development, waste generation, and deforestation further compound these emissions. While population is just one factor influencing emissions, these dynamics emphasize the need for sustainable practices, such as energy efficiency, renewable energy adoption, and responsible resource management, to mitigate the impact of Haryana’s high population on CO2 emissions and promote environmental sustainability. Lastly, considering LE (Life Expectancy), the coefficient of −0.01 implies that a one-unit increase in life expectancy is linked to a slight decrease of 0.01 units in the log of CO2 emissions. However, it is important to recognize that this coefficient is characterized by a low t-statistic of −0.31 and a high p-value of 0.05, suggesting that the association between life expectancy and CO2 emissions is statistically significant. Our findings support the conclusions of the previous study by Saidmamatov et al. (2024).
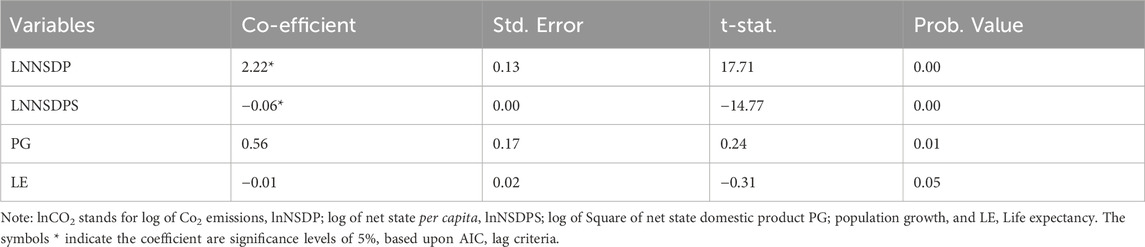
Table 6. Results of DOLS.
The robust findings obtained through Canonical Cointegration Regression analysis Table 7 reveal compelling and statistically significant associations between the independent variables (lnNDPS, lnNSDP, PG, and LE) and the dependent variable. In particular, economic growth (lnNSDP) and population growth (PG) are positively correlated with the dependent variable, signifying their substantial impact, in line with the previous study by Mohmmed et al. (2019). Conversely, the square of economic growth (lnNSDP) and life expectancy (LE) exhibit negative correlations, indicating their influential roles in explaining variations in the dependent variable within the regression model. These results underscore the importance of these variables in shaping the observed patterns in the dependent variable.
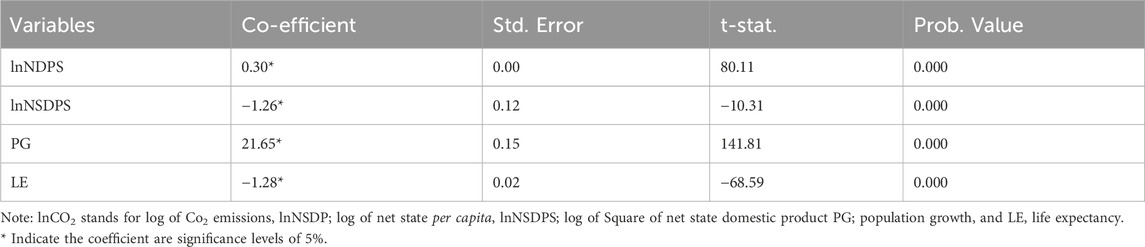
Table 7. Canonical co integration regression.
This study thoroughly examines the factors influencing CO2 emissions in the state of Haryana, India, spanning the period from 2005 to 2023. Notably, it highlights a positive and statistically significant relationship between CO2 emissions and both NSDP and population growth. This finding underscores the challenge of balancing economic growth and population expansion with environmental sustainability in Haryana. Conversely, the study reveals a negative association between CO2 emissions and life expectancy, suggesting that efforts to enhance public health and life expectancy may inadvertently lead to reduced CO2 emissions. The research emphasizes significant findings, including a strong positive correlation between GDP and CO2 emissions, indicating that as income levels rise, pollution levels also increase. However, the study also uncovers complexities within this relationship, with the emergence of inverted U-shaped (EKC) patterns presenting nuanced scenarios. Overall, these findings underscore the complex interplay between environmental factors and socio-economic indicators in pursuing sustainable development goals in Haryana. They call for a nuanced approach to policymaking that harmonizes economic growth, population management, and environmental conservation in the region. In light of these results, policymakers in Haryana are encouraged to consider strategies prioritizing environmental sustainability alongside economic and social development. These strategies may include promoting renewable energy sources, improving urban planning to reduce emissions from transportation, and implementing policies supporting both public health and environmental wellbeing. In essence, this study contributes valuable insights into the intricate relationship between various factors and CO2 emissions in Haryana, providing a foundation for informed and sustainable policy decisions to mitigate the adverse effects of CO2 emissions while fostering holistic development in the region. The study acknowledges one limitation regarding policy suggestions: CO2 is a transboundary pollutant, so assuming that current atmospheric CO2 concentrations solely arise from production and consumption activities within India’s national states may not be suitable.
The datasets presented in this study can be found in online repositories. The names of the repository/repositories and accession number(s) can be found in the article/supplementary material.
Written informed consent was obtained from the individual(s) for the publication of any potentially identifiable images or data included in this article.
PK: Conceptualization, Data curation, Formal Analysis, Investigation, Methodology, Project administration, Software, Validation, Writing–original draft, Writing–review and editing. NF: Investigation, Visualization, Writing–original draft, Writing–review and editing. MK: Data curation, Methodology, Validation, Writing–original draft, Writing–review and editing. HA: Writing–review and editing, Funding acquisition.
The author(s) declare that no financial support was received for the research, authorship, and/or publication of this article. Princess Nourah bint Abdulrahman University Researchers Supporting Project number (PNURSP2025R549), Princess Nourah bint Abdulrahman University, Riyadh, Saudi Arabia.
The authors declare that the research was conducted in the absence of any commercial or financial relationships that could be construed as a potential conflict of interest.
All claims expressed in this article are solely those of the authors and do not necessarily represent those of their affiliated organizations, or those of the publisher, the editors and the reviewers. Any product that may be evaluated in this article, or claim that may be made by its manufacturer, is not guaranteed or endorsed by the publisher.
CO2, Carbon dioxide emissions; NSDP, Net State Domestic Product; PG, Population growth; DOLS, Dynamic modified ordinary least squares; OWID, Our World in Data.
Acheampong, A. O. (2019). Modelling for insight: does financial development improve environmental quality? Energy Econ. 83, 156–179. doi:10.1016/j.eneco.2019.06.025
Akram, V., Rath, B. N., and Sahoo, P. K. (2023). Club convergence in per capita carbon dioxide emissions across Indian states. Environ. Dev. Sustain. 26, 19907–19934. doi:10.1007/s10668-023-03443-2
Aldy, J. E. (2005). An environmental Kuznets curve analysis of U.S. State-level carbon dioxide emissions. J. Environ. Dev. 14 (1), 48–72. doi:10.1177/1070496504273514
Armeanu, D., Vintilă, G., Andrei, J. V., Gherghina, Ş. C., Drăgoi, M. C., and &Teodor, C. (2018). Exploring the link between environmental pollution and economic growth in EU-28 countries: is there an environmental Kuznets curve? PloS one 13 (5), e0195708. doi:10.1371/journal.pone.0195708
Cavusoglu, B., and Gimba, O. J. (2021). Life expectancy in Sub-Sahara Africa: an examination of long-run and short-run effects. Asian Dev. Policy Rev. 9 (1), 57–68. doi:10.18488/journal.107.2021.91.57.68
CMIE (2011). Energy. Available at: https://economicoutlook.cmie.com
Charfeddine, L., and Mrabet, Z. (2017). The impact of economic development and social-political factors on ecological footprint: a panel data analysis for 15 MENA countries. Renew. Sustain. energy Rev. 76, 138–154. doi:10.1016/j.rser.2017.03.031
Cheung, Y. W., and Lai, K. S. (1995). Lag order and critical values of the augmented Dickey–Fuller test. J. Bus. and Econ. Statistics 13 (3), 277–280. doi:10.2307/1392187
Danish, , Ozcan, B., and Ulucak, R. (2021). An empirical investigation of nuclear energy consumption and carbon dioxide (CO2) emission in India: bridging IPAT and EKC hypotheses. Nucl. Eng. Technol. 53, 2056–2065. doi:10.1016/j.net.2020.12.008
Das, S., and Debanth, A. (2023). Impact of CO2 emission on life expectancy in India: an autoregressive distributive lag (ARDL) bound test approach. Future Bus. J. 9 (1), 5. doi:10.1186/s43093-022-00179-9
Ghoshal, T., and Bhattacharya, R. (2008). State level carbon dioxide emissions of India 1980 – 2000. Contemp. Issues Ideas Soc. Sci. 4 (No.1), 41–73.
Grossman, G. M., and Krueger, A. B. (1991). Environmental impacts of a North American free trade agreement.
Hanif, I. (2018). Impact of economic growth, nonrenewable and renewable energy consumption, and urbanization on carbon emissions in Sub-Saharan Africa. Environ. Sci. Pollut. Res. 25 (15), 15057–15067. doi:10.1007/s11356-018-1753-4
Jian, L., Sohail, M. T., Ullah, S., and Majeed, M. T. (2021). Examining the role of non-economic factors in energy consumption and CO2 emissions in China: policy options for the green economy. Environ. Sci. Pollu. Resea. 28, 67667–67676.
Kartal, M. T., KılıçDepren, S., Ali, U., and &Nurgazina, Z. (2023). Long-run impact of coal usage decline on CO2 emissions and economic growth: evidence from disaggregated energy consumption perspective for China and India by dynamic ARDL simulations. Energy and Environ., 0958305X231152482. doi:10.1177/0958305X231152482
Khezri, M., Heshmati, A., and Khodaei, M. (2022). Environmental implications of economic complexity and its role in determining how renewable energies affect CO2 emissions. Appl. Ener. 306, 117948.
Kumar, P. (2019). Analysis of financial performance of oil and gas industry in India. Think India J. 22 (10), 1869–1875.
Kumar, P. (2020). Economic growth and convergence in India (1980-81 to 2019-20). PalArch's J. Archaeol. Egypt/Egyptology 17 (7), 12492–12509.
Kumar, P., and Radulescu, M. (2024). CO2 emission, life expectancy, and economic growth: a triad analysis of Sub-Saharan African countries. Environ. Dev. Sustain., 1–28. doi:10.1007/s10668-023-04391-7
Lamb, W. F., Wiedmann, T., Pongratz, J., Andrew, R., Crippa, M., Olivier, J. G., et al. (2021). A review of trends and drivers of greenhouse gas emissions by sector from 1990 to 2018. Environ. Res. Lett. 16 (7), 073005. doi:10.1088/1748-9326/abee4e
Liu, H., Wong, W. K., Cong, P. T., Nassani, A. A., Haffar, M., and Abu-Rumman, A. (2023). Linkage among Urbanization, energy Consumption, economic growth and carbon Emissions. Panel data analysis for China using ARDL model. Fuel 332, 126122. doi:10.1016/j.fuel.2022.126122
Liu, X., Yuan, S., Yu, H., and Liu, Z. (2023). How ecological policy stringency moderates the influence of industrial innovation on environmental sustainability: the role of renewable energy transition in BRICST countries. Renew. Energy 207, 194–204. doi:10.1016/j.renene.2023.01.045
Mehmood, K., Hassan, S. T., Qiu, X., and Ali, S. (2024). Comparative analysis of CO2 emissions and economic performance in the United States and China: navigating sustainable development in the climate change era. Geosci. Front. 15 (5), 101843. doi:10.1016/j.gsf.2024.101843
Mehmood, K., Qiu, X., and Abrar, M. M. (2023). Unearthing research trends in emissions and sustainable development: potential implications for future directions. Gondwana Res. 119, 227–245. doi:10.1016/j.gr.2023.02.009
Merlin, M. L., and Chen, Y. (2021). Analysis of the factors affecting electricity consumption in DR Congo using fully modified ordinary least square (FMOLS), dynamic ordinary least square (DOLS) and canonical cointegrating regression (CCR) estimation approach. Energy 232, 121025. doi:10.1016/j.energy.2021.121025
Mohmmed, A., Li, Z., Arowolo, A. O., Su, H., Deng, X., Najmuddin, O., et al. (2019). Driving factors of CO2 emissions and nexus with economic growth, development and human health in the Top Ten emitting countries. Resour. Conservation Recycl. 148, 157–169. doi:10.1016/j.resconrec.2019.03.048
Moridian, A., Radulescu, M., Kumar, P., Radu, M. T., and Mohammad, J. (2024). New insights on immigration, fiscal policy and unemployment rate in EU countries–A quantile regression approach. Heliyon 10 (13), e33519. doi:10.1016/j.heliyon.2024.e33519
NAPCC (2008). National action plan on climate change. New Delhi: Prime Minister's Council on Climate Change, Ministry of Environment and Forest, Government of India.
OWID (2024). Available at: https://ourworldindata.org/co2-emissions
Ohlan, R. (2015). The impact of population density, energy consumption, economic growth and trade openness on CO 2 emissions in India. Nat. hazards 79, 1409–1428. doi:10.1007/s11069-015-1898-0
Pandey, K. K., and Rastogi, H. (2019). Effect of energy consumption and economic growth on environmental degradation in India: a time series modelling. Energy Procedia 158, 4232–4237. doi:10.1016/j.egypro.2019.01.804
Phillips, P. C., and Perron, P. (1988). Testing for a unit root in time series regression. Biometrika 75 (2), 335–346. doi:10.2307/2336182
Radulescu, M., Mohammed, K. S., Kumar, P., Baldan, C., and Dascalu, N. M. (2024). Dynamic effects of energy transition on environmental sustainability: fresh findings from the BRICS+ 1. Energy Rep. 12, 2441–2451. doi:10.1016/j.egyr.2024.08.052
Rajan, A., Ghosh, K., and Shah, A. (2020). Carbon footprint of India’s groundwater irrigation. Carbon Manag. 11 (3), 265–280. doi:10.1080/17583004.2020.1750265
Ramadhan, H. K., Nirmala, T., Aida, N., and &Ratih, A. (2023). Analysis of economic growth on carbon dioxide gas emissions in G20 countries. Asian J. Econ. Bus. Account. 23 (14), 1–7. doi:10.9734/ajeba/2023/v23i141000
Saidmamatov, O., Saidmamatov, O., Sobirov, Y., Marty, P., Ruzmetov, D., Berdiyorov, T., et al. (2024). Nexus between life expectancy, CO2 emissions, economic development, water, and agriculture in aral sea basin: empirical assessment. Sustainability 16 (7), 2647. doi:10.3390/su16072647
Tam, K. P., Chan, H. W., and Clayton, S. (2023). Climate change anxiety in China, India, Japan, and the United States. J. Environ. Psychol. 87, 101991. doi:10.1016/j.jenvp.2023.101991
Wang, Q., and Li, L. (2021). The effects of population aging, life expectancy, unemployment rate, population density, per capita GDP, urbanization on per capita carbon emissions. Sustain. Prod. Consum. 28, 760–774. doi:10.1016/j.spc.2021.06.029
Wang, Q., Yang, X., and Li, R. (2023). Does intellectual property protection improve energy efficiency? Evidence from the impact of intellectual property income on energy intensity. Energy and Environ., 0958305X231180694. doi:10.1177/0958305X231180694
Wang, Q., and Zhang, F. (2020). Does increasing investment in research and development promote economic growth decoupling from carbon emission growth? An empirical analysis of BRICS countries. J. Clean. Prod. 252, 119853. doi:10.1016/j.jclepro.2019.119853
Keywords: CO2 emission, economic growth, environmental Kuznets curve, life expectancy, NSDP
Citation: Kumar P, Fatima N, Khan MK and Alnafisah H (2025) Deciphering the drivers of CO2 emissions in Haryana: a comprehensive analysis from 2005 to 2023. Front. Environ. Sci. 13:1391418. doi: 10.3389/fenvs.2025.1391418
Received: 25 February 2024; Accepted: 22 January 2025;
Published: 28 February 2025.
Edited by:
Xiaojun Deng, Zhejiang University of Finance and Economics, ChinaCopyright © 2025 Kumar, Fatima, Khan and Alnafisah. This is an open-access article distributed under the terms of the Creative Commons Attribution License (CC BY). The use, distribution or reproduction in other forums is permitted, provided the original author(s) and the copyright owner(s) are credited and that the original publication in this journal is cited, in accordance with accepted academic practice. No use, distribution or reproduction is permitted which does not comply with these terms.
*Correspondence: Hind Alnafisah, aGFhbG5hZmlzYWhAcG51LmVkdS5zYQ==
Disclaimer: All claims expressed in this article are solely those of the authors and do not necessarily represent those of their affiliated organizations, or those of the publisher, the editors and the reviewers. Any product that may be evaluated in this article or claim that may be made by its manufacturer is not guaranteed or endorsed by the publisher.
Research integrity at Frontiers
Learn more about the work of our research integrity team to safeguard the quality of each article we publish.