- School of Business and Management, The Hong Kong University of Science and Technology, Kowloon, Hong Kong SAR, China
Climate risks include two elements: physical risks and transition risks. Exploring the impact of climate risks on green technology innovation contributes to sustainable development. This study uses panel data from 269 cities in China from 2008 to 2022 to explore the impact of climate risks on green technology innovation, and it employs Spatial Dubin Models for spatial effects analysis. The main research conclusions are as follows. First, the two components of climate risks—physical risks and transition risks—significantly hinder green technology innovation. Second, physical risks suppress green technology innovation by reducing market potential, while transition risks do so by decreasing foreign direct investment. Third, over time, green technology innovation shows a spatial clustering pattern of “low-low” and “high-high.” Fourth, physical risks create negative spatial spillover effects, while transition risks generate positive ones. Fifth, the spatial spillover effects of physical risks are mainly seen in the central region, while those of transition risks are primarily observed in the eastern and western regions, indicating significant regional heterogeneity. Finally, transition risks promoted green technology innovation in the period of 2018–2022, which is different from their suppressive effects in other time periods. In general, this study establishes a more comprehensive analytical framework that fills existing research gaps.
1 Introduction
Agricultural, industrial and household sectors are the main causes of climate change and global warming (Abbas et al., 2022; Elahi et al., 2024). Global warming has intensified the instability of the climate system, causing climate factors to gradually become a new source of risk affecting the stability of economic and financial activities (Cai and Lontzek, 2019; Rising et al., 2022; Zhao et al., 2024). The “China Climate Change Blue Book (2023),” released in July 2023, indicates that China’s rate of warming is significantly higher than the global average, with a notable increase in the frequency and intensity of extreme heat, extreme cold, and extreme precipitation in recent years. Currently, China is in a crucial stage of economic transformation and upgrading, and its vast territory, large population, and diverse climate changes make it particularly sensitive to climate risks (Wang et al., 2024b). Climate risks include physical risks and transition risks, physical risks refer to the direct impacts on society and the economy caused by natural environmental changes due to climate change, such as the increased frequency and intensity of extreme heat, extreme cold, and extreme precipitation, while transition risks measured by carbon emissions per unit of Gross Domestic Product (GDP), arise from policy and market changes during economic transformation to address climate change. Against the backdrop of increasing climate risks (Elahi et al., 2022), green technology innovation has emerged, which can effectively mitigate climate risks and reduce the harms caused by climate change (Schiederig et al., 2012; Waseem et al., 2021; Habiba et al., 2022; Lin et al., 2023; Xiao and Fei, 2024).
The existing literature’s research conclusions partially address the impact of physical risks and transition risks on green technology innovation. The existing literature clarifies the concept of physical risks, which includes extreme heat, extreme cold, and extreme precipitation. Moreover, previous studies have explored the impact of extreme heat and extreme precipitation on green technology innovation, yielding some contradictory conclusions. Meanwhile, the existing literature has clarified the measurement transition risks and explained their impact on economic variables such as foreign direct investment (FDI) and industrial structure. More importantly, existing research has demonstrated the significance of green technology innovation, such as its ability to promote economic growth, reduce carbon emissions, alleviate energy poverty, and facilitate green transition, making it necessary to pursue green technology innovation.
Although exploring the relationship between climate risks and green technology innovation is crucial for achieving sustainable development, existing research has not comprehensively and systematically addressed this issue. For example, climate risks typically include both physical risks and transition risks, but existing research often focuses on only one aspect, neglecting the other. Meanwhile, the measurement indicators for physical risks include extreme heat, extreme cold, and extreme precipitation, yet few studies encompass all three aspects simultaneously. Additionally, the existing literature has not addressed the impact of transition risks on green technology innovation. Furthermore, existing research has not mentioned the mediating variables of climate risks affecting green technology innovation. Finally, existing research primarily focuses on simple causal inference without considering the spillover effects of various variables in spatial dimensions.
The main research topic of this paper is to comprehensively explore the impact of climate change on green technology innovation and to address the shortcomings of existing research. Therefore, the marginal contributions of this study are as follows. First, this research measures climate risks from both physical and transition risks perspectives and calculates their respective effects on green technology innovation. Second, it comprehensively assesses physical risks from the three aspects of extreme heat, extreme cold, and extreme precipitation. Third, this study includes the mediating effects analysis that is often overlooked in existing research on this topic. Fourth, while exploring the causal relationships between variables, this study also measures the spatial spillover effects of each variable.
This study uses data from 269 cities in China from 2008 to 2022. It explores the impact of climate risks on green technology innovation through panel regression models and employs mediation effects analysis to identify the mediating variables through which climate risks influence green technology innovation. Additionally, this research investigates the spatial spillover effects of each variable using Spatial Dubin Models. This paper is divided into seven sections: introduction, literature review, theoretical foundation and research hypothesis, research design and methods, empirical analysis, robustness tests, and conclusions and discussions. The introduction part provides an overview of the research topic, outlining the significance of the study. The literature review part reviews existing studies on climate risks and green technology innovation, highlighting gaps in the current research and establishing the context for this study. The theoretical foundation and research hypothesis part presents the theoretical framework guiding the research and formulates the hypotheses to be tested. The research design and methods part details the research design, data sources, and methodologies employed to analyze the effects of climate risks on green technology innovation. The empirical analysis section presents the results of the empirical analysis, showcasing the findings regarding the impact of climate risks on green technology innovation, as well as the spatial spillover effects. The robustness tests part conducts various robustness tests to validate the reliability and consistency of the study’s findings. Finally, the conclusions and discussions section summarizes the key findings, discusses their implications for policy and practice, and suggests directions for future research.
2 Literature review
Green technology innovation mainly refers to technological innovations that improve resource utilization efficiency, reduce pollutant emissions, and promote the transition of the economy to a green economy (Wang et al., 2019; Lv et al., 2021; Shang et al., 2022; Bai et al., 2023). Regarding climate risks, based on existing literature, this paper identifies two main aspects: physical risks and transition risks (Chen et al., 2022). The following will review the relationships between the variables discussed in the paper, in conjunction with existing literature.
Although existing literature has thoroughly analyzed the connotation of physical risks and examined their impact on some economic variables, there have been few comprehensive studies on the impact of physical risks on green technology innovation. The main conclusions of existing research are as follows. First, the casualties and damage to production facilities caused by physical risks directly impact enterprise production costs and efficiency, while infrastructure damage increases capital costs, leading regions with higher physical risks to face higher bond issuance costs and the need to offer higher yields compared to areas with lower risks (Escaleras and Register, 2011; Zscheischler et al., 2018; Painter, 2020). Second, damage to key transportation routes, such as roads and railways, caused by climate disasters may lead to supply chain disruptions, resulting in decreased sales and production for enterprises (Huang et al., 2018). Third, some studies indicate that certain components of physical risks affect green technology innovation, but their conclusions are somewhat contradictory. For instance, one study suggests that extreme precipitation can promote green technology innovation in the short term, while extreme high and low temperatures do not (Wang et al., 2024a). However, other studies argue that the negative impact of extreme precipitation on green technology innovation is the most significant, while some research claims that extreme high temperatures promote green technology innovation (Ling and Gao, 2023; Wen et al., 2023; Hou et al., 2024). Therefore, analyzing the impact of physical risks on green technology innovation helps to complement existing research.
Regarding transition risks, existing research has mentioned their impact on some economic variables, but no studies have addressed the influence of transition risks on green technology innovation. The following are the conclusions from the existing literature. First, transition risks can alter the comparative advantages of a region and increase transition costs, leading multinational companies to take these factors into account, which in turn affects the quantity and structure of international capital inflows (Doytch, 2021; An et al., 2022; Gu and Hale, 2023). Second, transition risks can lead to changes in industrial structure, negatively impacting industries related to fossil fuel production and consumption, resulting in changes in asset values and debt defaults, which affect the stability of the financial system (Lin and Sun, 2016; Semieniuk et al., 2021). However, existing literature has not established a connection between transition risks and green technology innovation, so it is necessary to supplement the relationship between the two.
In addition, existing literature indicates that green technology innovation also impacts a wide range of economic variables, as detailed below. First, green technology innovation has a significant positive correlation with economic growth in both the long term and short term, while it has a significant negative correlation with carbon emissions (Meirun et al., 2021; Zhang, 2021; Dong et al., 2022; Chen et al., 2023). Second, green technology innovation effectively alleviates energy poverty and improves energy efficiency (Lee et al., 2022). Finally, green technology innovation promotes the transition of energy consumption to green energy (Song et al., 2023; Wei et al., 2023). Since green technology innovation can bring various benefits, it is necessary to explore the factors that can influence it.
Based on the above literature, although existing studies have addressed physical risks, transition risks, and green technology innovation, they have not fully measured the relationship among the three. Additionally, the enhancement of green technology innovation can bring various benefits. Therefore, it is necessary to explore how climate risks, including physical risks and transition risks, influence green technology innovation, while also conducting mediating effects analysis to determine the influencing mechanisms. Next, this paper will elaborate on the theoretical basis and research hypotheses, thereby providing further support for the study.
3 Theoretical foundations and research hypothesis
3.1 Climate change economics
Climate change economics was first proposed by Nordhaus in 1991. He constructed an Integrated Assessment Model (IAM) that combines ecological and economic systems, using marginal analysis to conduct a cost-benefit analysis of economic growth and environmental governance, thereby establishing a connection between climate and the economy (Nordhaus, 2007). Subsequently, Stern conducted a comprehensive analysis of the economic, social, and environmental impacts of climate change in 2006, which is considered the most thorough report in the field of climate change economics to date. Stern argued that all countries will be affected by climate change, with the poorest nations experiencing the earliest and most severe impacts. The harm caused by climate change could amount to 20% or more of global GDP, while the cost of actions to reduce greenhouse gas emissions to avoid severe impacts could be limited to about 1% of global GDP per year. If countries around the world take coordinated international action, it can prevent the severe effects of climate change, and if countries act together as required, by 2050, the market value of low-carbon technologies could reach at least $500 billion, or even higher (Nordhaus, 2007; Stern, 2008). However, it is still unknown what kind of impact environmental changes will have on green technology innovation. Based on the discussion of climate change economics mentioned above, there is reason to believe that climate risks may hinder green technology innovation. Since physical risks often have a broad reach, they may create negative spatial spillover effects (Gopalakrishnan and Damanpour, 1997; Shen et al., 2021). Therefore, the following two research hypotheses are proposed.
Hypothesis 1:. Both physical risks and transition risks will have a negative impact on green technology innovation.
Hypothesis 2:. Physical risks will generate negative spatial spillover effects.
3.2 Externality theory
In economics, externalities refer to the effects of economic behavior on the public that are not reflected in market prices. Specifically, they can be divided into positive externalities that have a beneficial impact on the public and do not require repayment, and negative externalities that have an adverse impact on the public and do not require payment (Tisdell, 1970). Generally, the measurement method for transition risks is the carbon emissions per unit of GDP (Gu and Hale, 2023; Ciccarelli and Marotta, 2024). Carbon emissions can be seen as a good that generates negative externalities. When a region increases its own carbon emissions, it does not incur additional costs, but it can pollute the environment of nearby areas, thereby stimulating green technology innovation in those areas. Based on this, the following hypothesis is proposed.
Hypothesis 3:. Transition risks will generate positive spatial spillover effects.
3.3 Environmental Kuznets curve
The Environmental Kuznets Curve (EKC) is a theoretical framework in economics that illustrates the connection between economic growth and environmental pollution. According to the EKC, as a country or region develops economically, environmental pollution initially rises alongside economic growth. However, once a specific turning point is reached, further economic advancement leads to a decrease in environmental pollution, resulting in an inverted “U” shaped curve representing this relationship (Kaika and Zervas, 2013).
Economic growth benefits environmental improvement because, as the growth rate increases, people have more disposable income and are therefore more willing to pay higher prices for better environmental standards. The primary drivers of long-term economic growth are technological advancements and improvements in productivity, which help conserve raw materials and reduce energy consumption, all of which are closely related to green technology innovation (Sun et al., 2021). The transition risks are measured by carbon emissions per unit of GDP (Gu and Hale, 2023; Ciccarelli and Marotta, 2024), and thus, based on the above discussion, it is closely related to environmental pollution and economic growth, and should be influenced by EKC, with its coefficient changing over time. Therefore, Hypothesis 4 is proposed.
Hypothesis 4:. The impact of transition risks on green technological innovation will vary over time.
4 Research design and methods
4.1 Variable definitions
4.1.1 Dependent variable
The dependent variable of this study is the level of green technology innovation (lnInnovation). Based on existing research, this study uses the total number of green invention applications and green utility model applications in each region per year. Since inventions and utility models are two components of patents, this measurement reflects the status of green patents in each region, thereby indicating the level of green innovation (Du et al., 2019; Lv et al., 2021; Shang et al., 2022). To avoid the impact of dimensionality on model estimation, the logarithm of this variable is taken.
4.1.2 Core independent variables
Climate risk includes two aspects: physical risks and transition risks. This study will measure these two dimensions separately (Chen et al., 2022).
To measure physical risks (lnPhysical), the article uses the total number of extreme high-temperature days, extreme low-temperature days, and extreme precipitation days in each region per year (Escaleras and Register, 2011; Han et al., 2018; Wang et al., 2024a). To avoid the impact of dimensionality on model estimation, the logarithm of this variable is also taken.
For transition risks (lnTransition), this study refers to existing literature and measures them by dividing the carbon emissions of each region per year by the regional GDP (Gu and Hale, 2023; Ciccarelli and Marotta, 2024). This represents the carbon emissions per unit of GDP. With a constant GDP, higher carbon emissions indicate greater transition risks faced by the region. Similarly, to avoid the impact of dimensionality, the logarithm of this variable has also been taken.
Therefore, this paper has established the measurement of the core independent variables.
4.1.3 Mediator variables
To comprehensively explore the mechanisms through which climate risk affects green technology innovation, this study will conduct a mediation effects analysis and propose the following intermediary variables based on existing research.
Market potential (MktPotential), as an intermediary variable for physical risks, means that physical risk first impacts market potential, which in turn affects the city’s capacity for green technology innovation (Midelfart-Knarvik et al., 2000; Hanson, 2005). Green technology innovation primarily focuses on green inventions and green utility models, both of which require sufficient market conditions to be effective. Physical risks, including extreme heat, extreme cold, and extreme precipitation, can disrupt agricultural and industrial productivity, damage infrastructure, and alter the cost-benefit scenarios across various industries, thereby reducing market potential (Baker, 2009; Hong et al., 2019). In this context, market potential is understood as the potential demand and profitability for goods and services, including green technologies used to mitigate the impacts of physical risks (Arora and Gambardella, 2010). The erosion of market potential due to physical risks can diminish profit incentives for research and development, hindering green technology innovation, while an increase in market potential can promote it, as seen in regions with high market potential that may experience a rise in green technology patents and investments due to firms seeking to capitalize on the demand for environmentally friendly solutions (Arora and Gambardella, 2010). Therefore, physical risks, market potential, and green technology innovation are interconnected, making it theoretically justified to explore market potential as a mediating effect in the influence of physical risks on green technology innovation. The calculation method for MktPotential is to divide the GDP of each neighboring area by the distance to that area, and then sum these values for all neighboring areas. Then, the dimensions are processed to reduce their dimensionality, resulting in the market potential data.
Foreign direct investment (lnFDI), as an intermediary variable for transition risks, suggests that an increase in transition risks will reduce the attractiveness of foreign investment, which in turn affects green technology innovation (Song et al., 2015; Ali et al., 2022). Existing research indicates that FDI interacts with multiple economic variables, some of which are related to climate risk and green technology innovation (Chen and Wu, 2017; Gao et al., 2022; Ren et al., 2024). Specifically, climate change affects the attractiveness of FDI through multiple channels. From the perspective of transition risks, foreign investors’ location choices in China are influenced by local environmental regulations, leading them to prefer areas with less variation in site selection (Lin and Sun, 2016). Furthermore, multinational companies incorporate climate transition risks into their long-term investment decisions, favoring investments in regions with lower transformation risks (An et al., 2022). In summary, transition risks, stemming from policy uncertainties aimed at low-carbon and sustainable development, can lead to significant changes in industrial structure and investment environments, and the high costs of adapting to these changes may undermine investor confidence, negatively affecting their economic activities (Semieniuk et al., 2021). Meanwhile, the “Pollution Halo” hypothesis suggests that FDI can bring advanced production technologies and environmental protection technologies, while also promoting local green technology innovation through demonstration effects, learning effects, and technology spillover effects (Letchumanan and Kodama, 2000). Therefore, the mechanism by which transition risks affect green technology innovation through FDI has been identified. The data for lnFDI is obtained by taking the logarithm of the foreign investment amount for each city each year.
At this point, the intermediary variables used in the study have been determined.
4.1.4 Control variables
To minimize the impact of other factors on green technology innovation, this study selects per capita government expenditure (lnGovExpenditure), per capita GDP (lnGDPper), the share of the tertiary industry (Tertiary), and technological level (Tech) as control variables, based on existing research on the influencing factors of green technology innovation (Li et al., 2023; Xu et al., 2023). Specifically, government expenditure reflects financial support for innovation, while per capita GDP indicates economic capacity for investment in new technologies. The share of the tertiary industry captures the impact of economic structure on innovation, and technological level represents existing capabilities that facilitate green technology development. Together, these variables help isolate the specific effects on green technology innovation. To avoid the impact of dimensionality, control variables with larger magnitudes have been transformed using logarithms. The calculation method for lnGovExpenditure is the total fiscal expenditure of each region per year divided by the population, followed by taking the logarithm. The calculation method for lnGDPper is each region’s GDP per year divided by the population, also followed by taking the logarithm. For Tertiary, it is calculated as the output of the tertiary industry in each region per year divided by GDP. Tech is calculated as the annual research and development (R&D) expenditure of each region divided by GDP.
4.2 Model settings
4.2.1 Benchmark regression models
To examine the impact of climate risks on green technology innovation, a panel regression model with double fixed effects is constructed for both physical risks and transition risks, as shown in Equations 1, 2.
In the above equations,
4.2.2 Mediation effects models
To further analyze the mechanism by which climate risks affect green technology innovation, the following mediation effects models are constructed, referencing existing research (Midelfart-Knarvik et al., 2000; Hanson, 2005; Song et al., 2015; Ali et al., 2022). See Equations 3–6.
In the above equations,
4.2.3 Spatial effects models
To explore the spatial spillover effects of each variable, it is necessary to construct spatial effects models. First, a spatial weight matrix needs to be established based on the geographical locations of the various regions (Zeng, 2022). See Equation 7.
Second, it is necessary to test the spatial correlation of the data using the global Moran’s I and local Moran’s I. Only if the data shows significant spatial correlation can a spatial econometric model be used. See Equations 8, 9.
In Equations 8, 9, n represents the cities, X represents the core variables, namely, green technology innovation, physical risks, and transition risks, and W represents the spatial weight matrix. Third, construct Spatial Dubin Models to explore the spatial spillover effects of the variables, see Equations 10, 11.
In Equations 10, 11, W is the spatial weight matrix, and the definitions of other variables are the same as in Equations 1, 2.
All model settings used in this study have been completed. Empirical analysis will be conducted after explaining the data sources.
4.3 Data sources
To ensure data availability and consistency in statistical standards, this study excluded all cities in Taiwan province, as well as the Hong Kong Special Administrative Region and the Macao Special Administrative Region. Ultimately, panel data from 269 cities in mainland China from 2008 to 2022 was selected as the research sample for statistical modeling analysis. Climate risks data, intermediary variables data, and control variables data are sourced from the “China Urban Statistical Yearbook,” “China Environmental Statistical Yearbook,” “China Population Statistical Yearbook,” and the statistical yearbooks of various cities. Data on green technology innovation comes from all valid patent information published by the National Intellectual Property Administration. Since the Spatial Dubin Model requires no missing data, a small number of missing values for the variables needed for this model have been filled using linear interpolation. However, the mediation effects analysis does not require complete data, so to ensure data authenticity, missing values for the intermediary variables are not filled.
5 Empirical analysis
5.1 Benchmark regressions
5.1.1 Descriptive statistics
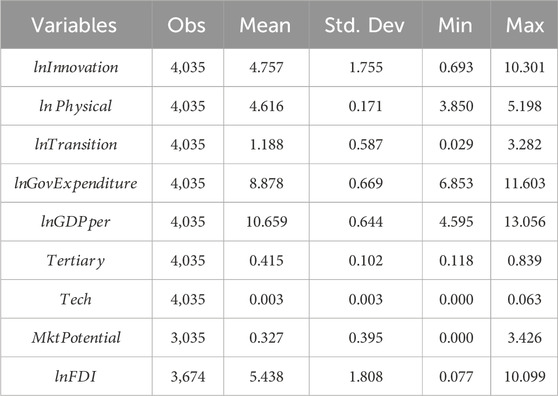
Before conducting empirical analysis, descriptive statistics are needed to grasp the overall characteristics of the data, as shown in Table 1.
From Table 1, the data used in the study is large in volume and covers a wide range of samples. Additionally, there are no missing values except for the mediating variables, the data shows good concentration, and there are no significant differences in dimensions, making it suitable for empirical analysis.
5.1.2 Correlation analysis
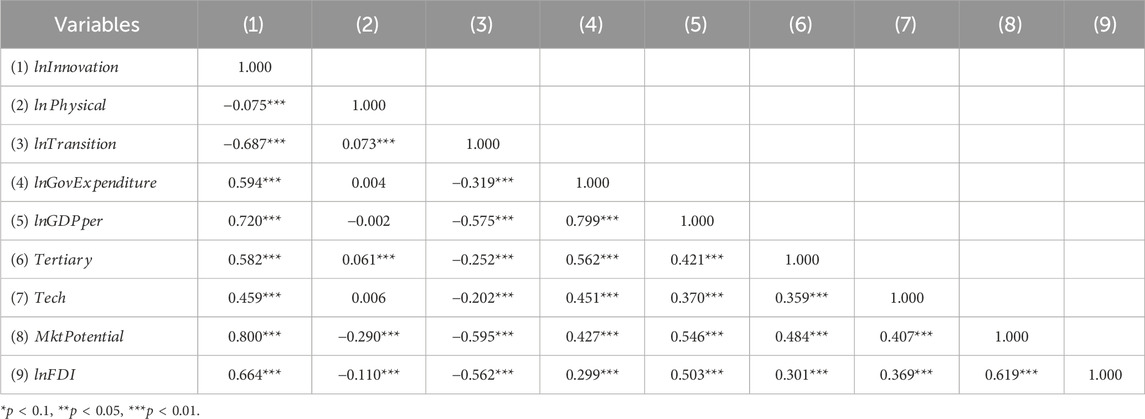
Before conducting empirical analysis, it is necessary to calculate the correlation coefficients between the variables to ensure that the analysis is meaningful. See Table 2.
The correlation coefficients of the core variables lnPhysical and lnTransition with lnInnovation are −0.075 and −0.687, respectively, both significant at the 1% level, indicating negative correlations between physical risks, transition risks, and green technology innovation. Such negative correlations will be further explored through regression analysis.
5.1.3 Benchmark regression results
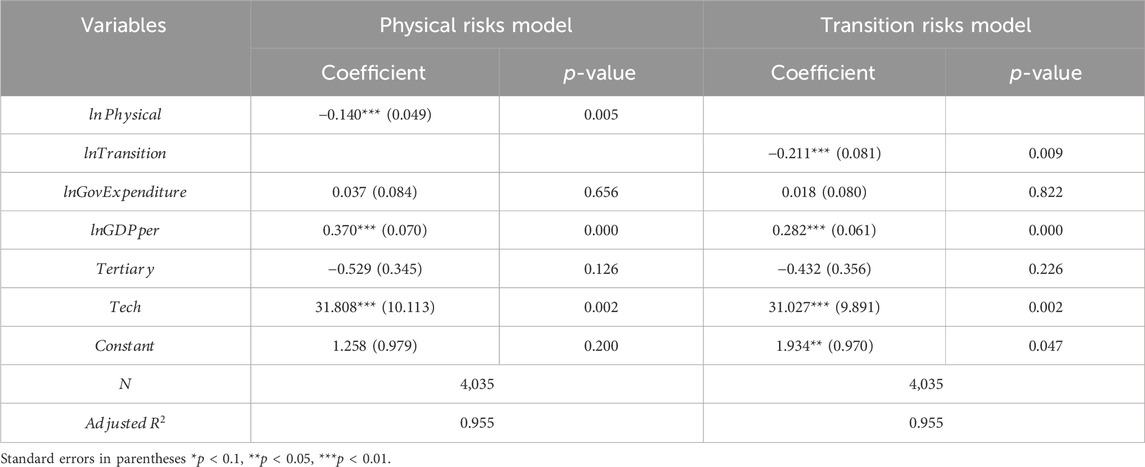
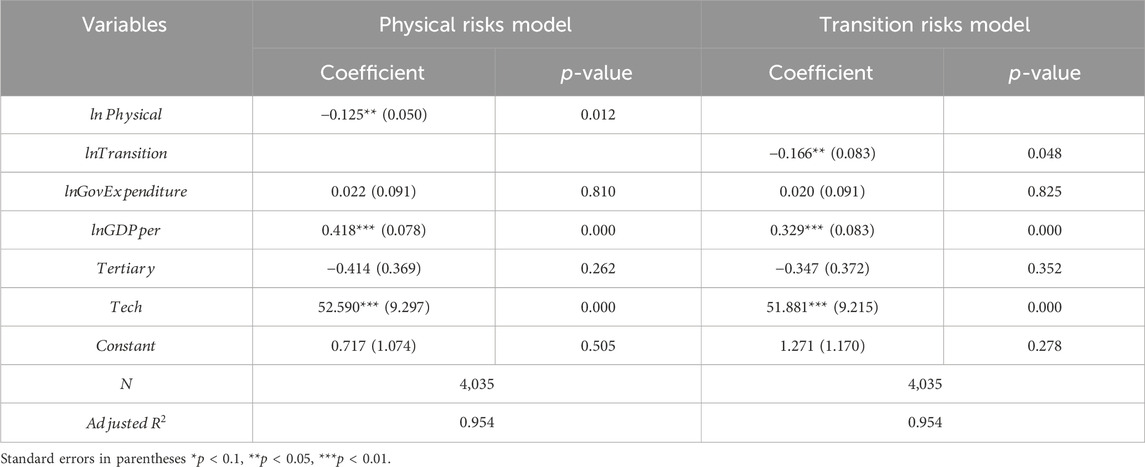
The benchmark regression models are run according to Equations 1, 2, and the results are shown in Table 3.
From the above table, the coefficient of lnPhysical is −0.140, which is significant at the 1% level, and the coefficient of lnTransition is −0.211, also significant at the 1% level. Clearly, both physical risks and transition risks have a significant negative impact on green technology innovation. Physical risks undermine the material environment needed for green technology innovation. Transition risks may, to some extent, affect environmental policies and the attractiveness of investments, thereby hindering green technology innovation. As for the further economic mechanisms, they will be analyzed in the next section. Finally, Hypothesis 1 has also been validated, indicating that climate risks have a negative impact on green technology innovation.
5.2 Mediation effects analysis
5.2.1 Mediation effects of physical risks
According to Equations 3, 4, the mediating effects model of physical risk is run, and the results are shown in Table 4.
In Table 4, the impact coefficient of lnPhysical on MktPotential is −0.048, which is significant at the 10% level. The impact coefficients of MktPotential and lnPhysical on lnInnovation are 0.102 and −0.118, respectively, both significant at the 10% level. This validates the mechanism analysis in Section 4.1.3, which indicates that physical risks have a negative impact on production, damaging infrastructure and altering the cost-benefit ratio, thereby suppressing market potential. The decline in market potential adversely affects the profit incentives for research and development, which is detrimental to green technology innovation. Clearly, physical risks adversely affect green technology innovation by reducing market potential.
5.2.2 Mediation effects of transition risks
Similarly, based on Equations 5, 6, the mediating effects model of transition risks is run, and the results are shown in Table 5.
From the above table, the effect of lnTransition on lnFDI is −0.798, which is significant at the 1% level. The effects of lnFDI and lnTransition on lnInnovation are 0.032 and −0.247, respectively, both significant at the 1% level. This is also consistent with the discussion in Section 4.1.3, which states that as foreign investors typically incorporate transition risks into their long-term investment decisions and prefer to invest in regions with lower transition risks, an increase in transition risks will reduce FDI. However, according to the “Pollution Halo” hypothesis, there is a positive correlation between FDI and green technology innovation, so the decline in FDI leads to a reduction in green technology innovation. It can be concluded that transition risks inhibit green technology innovation by suppressing foreign direct investment.
5.3 Spatial effects analysis
5.3.1 Spatial correlation tests
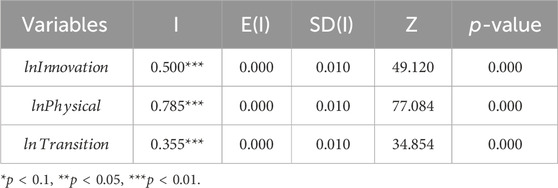
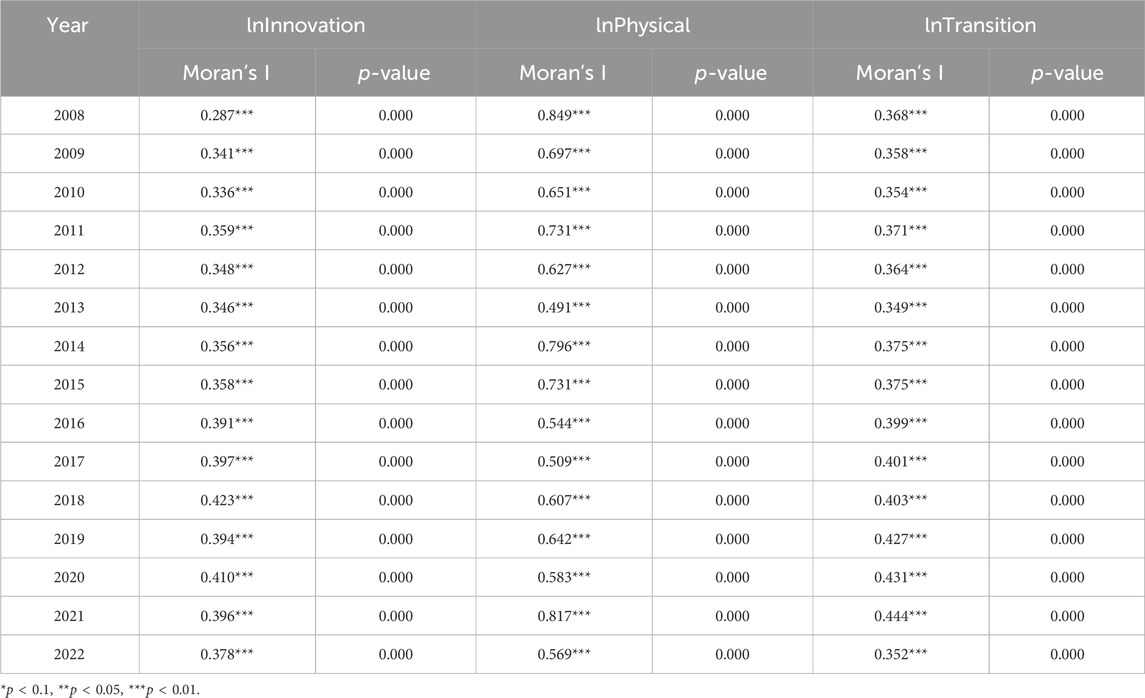
The presence of significant spatial correlation among variables is a prerequisite for establishing spatial econometric models. Therefore, based on Equations 8, 9, a global Moran’s I test and calculation of Moran’s index for each year are conducted on the core variables to verify spatial correlation. See Tables 6, 7.
From the two tables above, both the global and year-specific tests show that the spatial correlation of the three core variables, lnInnovation, lnPhysical, and lnTransition, is significant at the 1% level. This indicates an obvious spatial correlation. Next, the Moran scatter plots of the variable lnInnovation for the years 2008, 2013, 2018, and 2022 are plotted to observe the evolution of its spatial clustering over time, as shown in Figure 1.
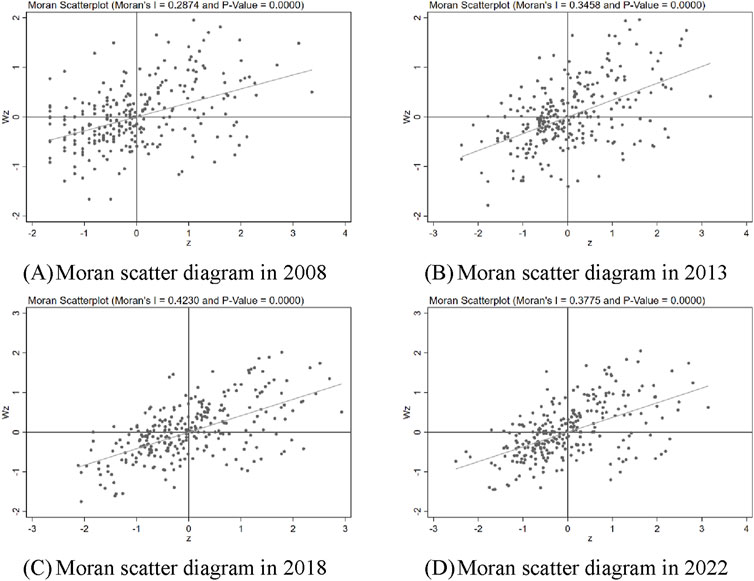
Figure 1. Moran scatter Diagrams. (A) Moran scatter diagram in 2008 (B) Moran scatter diagram in 2013. (C) Moran scatter diagram in 2018 (D) Moran scatter diagram in 2022.
From Figure 1, it can be observed that over time, the spatial distribution of lnInnovation has shifted from a loose distribution across all four quadrants to being primarily concentrated in the first and third quadrants, indicating “low-low” and “high-high” clustering. This suggests that the degree of spatial clustering of green technology innovation has gradually increased over time. Policymakers should adopt targeted strategies for “low-low” and “high-high” areas in green technology innovation. They can establish incubators and provide support in “low-low” areas, while promoting knowledge transfer and collaboration in “high-high” areas to encourage balanced growth. These measures can help accelerate the positive changes mentioned above. Next, the Spatial Dubin Models will be used to further explore the relationships in spatial dimensions.
5.3.2 Spatial model results
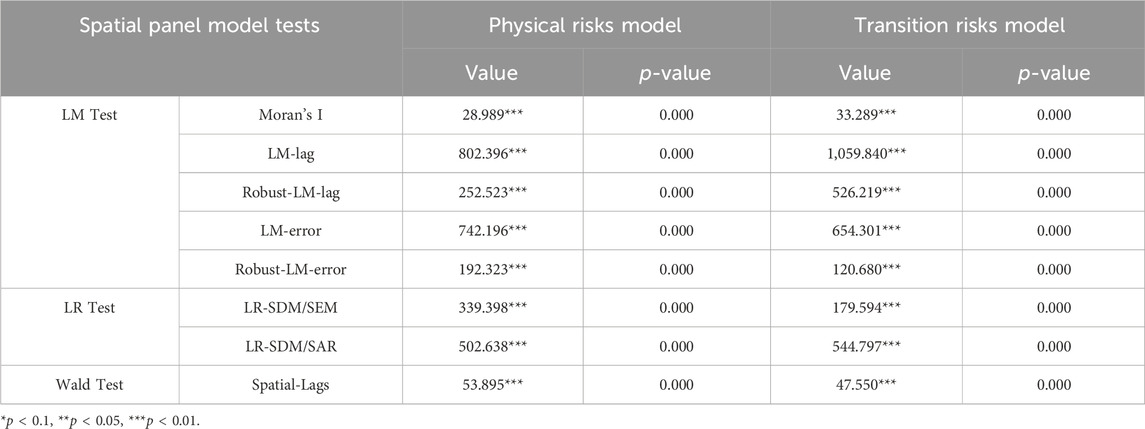
To select the appropriate spatial econometric model, tests are conducted on lnInnovation, lnPhysical, lnTransition, and the control variables. LM (Least Squares Mean Square) test, LR (Likelihood Ratio) test, and Wald test are performed (see Table 8).
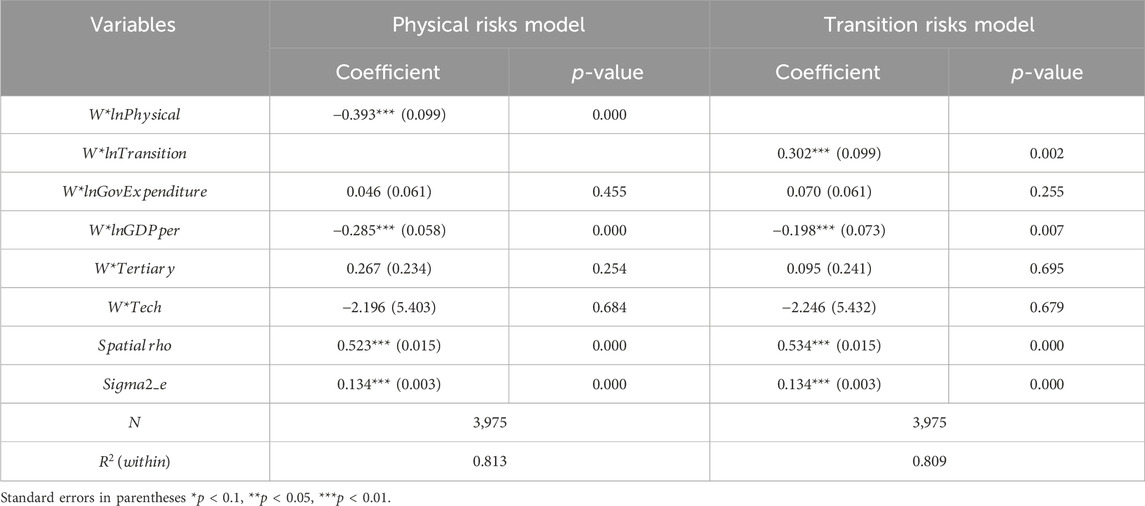
The LM test shows that all hypothesis tests reject the null hypothesis of “no spatial autocorrelation,” indicating significant spatial autocorrelation. The LR test also rejects the null hypothesis at the 1% significance level, suggesting that the Spatial Dubin Models are the most appropriate choice. The Wald test indicates that the spatial lag terms in the Spatial Dubin Models are highly significant, making the analysis of spatial spillover effects using the Spatial Dubin Models reasonable. Therefore, the model estimations are based on Equations 10, 11 using fixed effects, and the results are shown in Table 9.
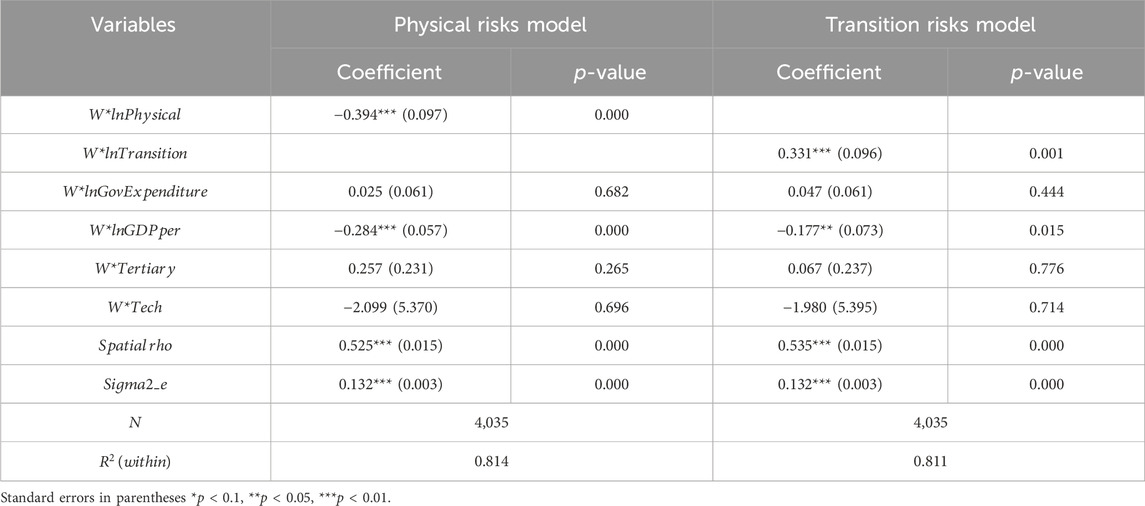
From Table 9, the spatial lag coefficients (Spatial rho) of the two models are 0.525 and 0.535, respectively, and are significant at the 1% level. This indicates that there is a significant spatial clustering effect in the level of green technology innovation in cities, with a notable positive spillover effect, meaning that a city’s green technology innovation is easily influenced by various factors from neighboring areas.
In terms of spatial spillover effects, the spatial spillover coefficients for lnPhysical and lnTransition are −0.394 and 0.331, respectively, both significant at the 1% level. This indicates that the physical risks of one region negatively affect green technology innovation in neighboring areas, while the transition risks of one region positively influence green technology innovation in neighboring areas. The reasons for these phenomena should be consistent with the discussions in the “Theoretical Foundations and Research Hypothesis” section. Specifically, physical risks tend to have a broad impact, often damaging the innovation infrastructure of multiple regions, thereby suppressing green technology innovation in neighboring areas. In contrast, transition risks can create negative externalities in the environment, which in turn stimulate technological innovation in nearby regions. These also confirm Hypothesis 2 and Hypothesis 3, which state that physical risks generate negative spatial spillover effects, while transition risks produce positive spatial spillover effects. Next, spatial effects decomposition will be conducted.
5.3.3 Spatial effects decomposition
To conduct an in-depth exploration of spatial spillover effects, a decomposition of spatial effects is performed. Specifically, the impact of independent variables on dependent variables within the same region can be expressed as direct effect, while the influence of independent variables from other regions on the dependent variable in the current region is considered as indirect effect. See Table 10.
For the lnPhysical variable, both the indirect effect and total effect are significant at the 1% level, and both are negative, while the direct effect is not significant. This indicates that the spatial spillover effects of physical risks are primarily through the indirect effect, meaning that the physical risks from neighboring areas spill over into the current region, suppressing green technology innovation in current region.
For the lnTransition variable, the coefficients for the direct effect, indirect effect, and total effect are −0.125, 0.481, and 0.356, respectively, and are significant at least at the 10% level. This indicates that the improvement in green technology innovation in the current region is primarily driven by the transition risks from other areas.
The above results further validate the discussion in the “Theoretical Foundations and Research Hypothesis” section, indicating that a region is sensitive to both physical risks and transition risks from neighboring areas, thereby reaffirming Hypothesis 2 and Hypothesis 3.
Then, regional heterogeneity analysis will also be conducted.
5.3.4 Regional heterogeneity analysis
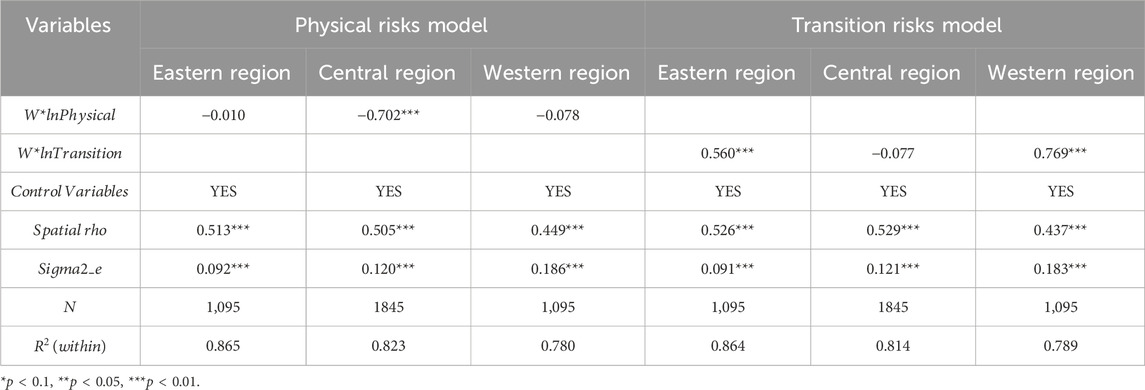
Due to significant differences in resource endowments and economic development across regions, it is necessary to explore the regional differential impacts of climate risk on green technology innovation. The sample of 269 cities is divided into eastern, central, and western regions, and model estimations are conducted for each region (Li and Qi, 2016; Nie et al., 2019). The model estimations are also based on Equations 10, 11, with the results shown in Table 11.
According to Table 11, first, the spatial lag term coefficients (Spatial rho) for all six models are significant, indicating that the analysis of regional heterogeneity is meaningful. Second, the negative spatial spillover effects of lnPhysical are primarily observed in the central region, while they are not significant in the eastern and western regions. This indicates that the negative spatial spillover effects of physical risks on green technology innovation mainly manifests in the central region. Third, the positive spillover effects of lnTransition are primarily evident in the eastern and western regions, while they are not significant in the central region. This indicates that the positive spatial spillover effects of transition risks on green technology innovation mainly occur in the eastern and western regions. Clearly, the models exhibit significant regional heterogeneity.
The findings suggest that regional characteristics play a crucial role in how physical and transition risks impact green technology innovation. In the central region, physical risks significantly hinder green technology innovation of neighboring areas. This is because the central region faces greater climate and physical risks compared to the eastern and western regions, with a broader impact, the spatial spillover effects are more significant (Ren et al., 2022; Wang et al., 2022). Conversely, the positive spillover effects of transition risks in the eastern and western regions can be attributed to more supportive policies that foster innovation (Shen et al., 2020; Zhuo and Deng, 2020). Overall, the analysis highlights the importance of considering regional differences when evaluating the impact of risks on technological development.
5.3.5 Period heterogeneity analysis
Due to China’s rapid economic growth and the selected sample spanning 15 years, during which China’s per capita GDP increased from approximately 3,400 US dollars to around 12,700 US dollars, the economic situation, policy orientation, and environmental pressures varied. Therefore, this study divides the 15 years into three segments of 5 years each and re-runs the benchmark regressions to explore whether the impact of climate risks on green technology innovation changes over time. See Table 12.
For the lnPhysical variable, its impact on green technology innovation is negative in all three periods, but it is only significant in the first and third periods, while it is not significant in the second period. This may be due to the randomness of physical risks, as there were not many natural disasters during the second period, leading to a non-significant coefficient. This result is acceptable and further confirms the negative impact of physical risks on green technology innovation. However, for the lnTransition variable, unlike the significant negative coefficients in the first and second periods, the coefficient in the third period is significantly positive. Obviously, during the period from 2018 to 2022, transition risks stimulated green technology innovation rather than suppressed it. This also validates Hypothesis 4, which states that the impact of transition risks on green technology innovation changes over different time periods. Specifically, the empirical analysis above shows an inverted U-shaped trend similar to EKC.
Next, robustness checks will be conducted to examine the robustness level of the study.
6 Robustness tests
6.1 Remove samples
A robustness check is conducted by removing some samples. The sample of 269 cities includes four municipalities that are directly under the management of central government—Beijing, Shanghai, Tianjin, and Chongqing. Although these are cities, they have provincial administrative levels, larger populations, higher GDPs, and broader regions, which may impact the overall models. Therefore, these four cities are removed, and the Spatial Dubin Models are re-estimated, with the results shown in Table 13.
Comparing Tables 9, 13, the coefficients and significance levels of all variables have not changed substantially, indicating that the models are relatively robust.
6.2 System generalized method of moments estimation
To address the potential endogeneity issues in the spatial econometric models, the system generalized method of moments (GMM) estimation is employed to re-estimate the models, using generated lagged variables as instrumental variables to handle the endogeneity problem. The results of estimating the Spatial Dubin Models using the system GMM method are shown in Table 14.
The system GMM requires two necessary conditions: no second-order autocorrelation in the disturbance terms and jointly valid instrumental variables, which correspond to AR(2) and Sargan test p-values both being greater than 0.05 (Saygın and İskenderoğlu, 2022; Onaga et al., 2023). Therefore, both system GMM estimates are valid, and according to the estimation results, lnPhysical and lnTransition show significant negative and positive spatial spillover effects, respectively, which is consistent with previous results, indicating that the models are robust.
6.3 Winsorization
By applying winsorization, outliers in the data are prevented from affecting estimations. The top 1% and bottom 1% of values are replaced with the upper and lower quartiles, respectively. The benchmark regressions are then re-run, and the results are shown in Table 15.
Comparing Tables 3, 15, the coefficients and significance levels of all variables have not changed substantially. Therefore, it can be concluded that the models are not affected by outliers.
6.4 Placebo tests
Although three methods have been used to test the robustness of the models, it is still not eliminating the influence of other unobservable factors on green technology innovation. Therefore, placebo tests are conducted. The basic logic of the tests is that only changes in climate risks affect green technology innovation, not other factors. Thus, the true values of climate risks are kept constant, while the matching relationships between climate risks and cities are randomly disrupted. The estimated coefficients are then examined. If there are no significant changes in the coefficients, it can be concluded that climate risks indeed affect green technology innovation. After 1,000 random matchings, kernel density plots are obtained, as shown in Figure 2.
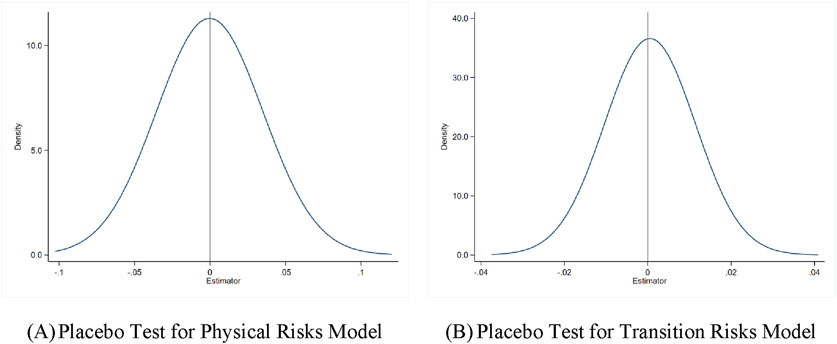
Figure 2. Kernel density plots. (A) Placebo Test for Physical Risks Model (B) Placebo Test for Transition Risks Model.
From Figure 2, in 1,000 random samples, the coefficients of lnPhysical and lnTransition remain stable, overall showing a normal distribution without significant deviations. The models pass the placebo tests.
In the next section, the research conclusions and implications will be discussed based on the empirical results.
7 Conclusion and discussions
The study is based on panel data from 269 cities in China from 2008 to 2022, comprehensively exploring the impact of climate risks on green technology innovation. The main research conclusions are as follows.
First, the two components of climate risks—physical risks and transition risks—have a significant negative impact on green technology innovation. Second, physical risks suppress green technology innovation by reducing market potential, while transition risks hinder green technology innovation by decreasing foreign direct investment. Third, over time, green technology innovation gradually exhibits a spatial clustering pattern of “low-low” and “high-high.” Fourth, physical risks generate negative spatial spillover effects, while transition risks produce positive spatial spillover effects. Fifth, the spatial spillover effects of physical risks are mainly evident in the central region, while the spatial spillover effects of transition risks are primarily observed in the eastern and western regions. Finally, transition risks promoted green technology innovation in the period of 2018–2022, which is different from their suppressive effects in other time periods.
These conclusions are all theoretical, and guiding practice based on theory is the significance of research. Therefore, based on the research findings, the following policy recommendations are proposed to effectively address the challenges identified.
First, it is essential to develop comprehensive policies that tackle both physical and transition risks simultaneously. This approach should encourage green technology innovation and promote sustainable development across all sectors. By integrating these two aspects, a resilient framework that not only mitigates risks but also fosters economic growth through environmentally friendly practices can be created.
Second, to further stimulate green technology innovation, policies should be designed to enhance market potential and attract foreign investment. This could involve creating incentives for businesses that invest in sustainable technologies, as well as establishing partnerships with international firms to share knowledge and resources. By improving the investment climate, the advancement of green technologies can be indirectly promoted, and their widespread adoption can also be ensured.
Third, it is crucial to address the negative spatial spillover effects caused by physical risks. Policies should focus on eliminating these risks within local areas while also considering the interconnectedness with neighboring regions. This could involve collaborative efforts between local governments to implement risk reduction strategies that benefit both the local community and the wider region. By taking a holistic approach, it can be ensured that improvements in one area do not inadvertently create new risks in another.
Furthermore, policymakers must pay close attention to regional heterogeneity when formulating strategies. Differentiated policies should be developed based on the unique spatial clustering characteristics of different regions. This means recognizing that low-innovation areas may require targeted support to foster development, while high-innovation areas might benefit from policies that strengthen technology diffusion. More importantly, to leverage the “low-low” and “high-high” clustering patterns of green technology innovation, policymakers should implement targeted strategies. For “low-low” areas, they can establish innovation incubators, provide financial support, and enhance education to build local capacity. In “high-high” areas, promoting knowledge transfer and collaboration with lagging areas can facilitate resource sharing. Creating networks between these regions will foster balanced and inclusive growth in green technology innovation.
Finally, policymakers should consider the heterogeneity across time periods. As time progresses and the impact of transition risks on green technology innovation shifts from hindrance to promotion, it may be appropriate to downplay the harms caused by transition risks and view them as one of the means to promote green technology innovation.
This study also has its limitations. For example, the panel data selected is a short panel, which may not fully reflect trends over the time dimension. Future research on this topic could consider conducting time series analysis. Meanwhile, due to data availability limitations, the selected 269 cities in China do not encompass all 333 cities, resulting in some missing data. Future research could consider filling in this missing data before conducting the analysis. Finally, this study verified two possible mediating effects, but there may be multiple mediating variables through which climate risks impact green technology innovation, warranting further exploration in future research.
Data availability statement
The original contributions presented in the study are included in the article/Supplementary Material, further inquiries can be directed to the corresponding author.
Author contributions
YW: Conceptualization, Data curation, Formal Analysis, Investigation, Methodology, Resources, Software, Validation, Visualization, Writing–original draft, Writing–review and editing.
Funding
The author(s) declare that no financial support was received for the research, authorship, and/or publication of this article.
Conflict of interest
The author declares that the research was conducted in the absence of any commercial or financial relationships that could be construed as a potential conflict of interest.
Generative AI statement
The author(s) declare that no Generative AI was used in the creation of this manuscript.
Publisher’s note
All claims expressed in this article are solely those of the authors and do not necessarily represent those of their affiliated organizations, or those of the publisher, the editors and the reviewers. Any product that may be evaluated in this article, or claim that may be made by its manufacturer, is not guaranteed or endorsed by the publisher.
Supplementary material
The Supplementary Material for this article can be found online at: https://www.frontiersin.org/articles/10.3389/fenvs.2024.1510883/full#supplementary-material
References
Abbas, A., Zhao, C., Waseem, M., Ahmed khan, K., and Ahmad, R. (2022). Analysis of energy input–output of farms and assessment of greenhouse gas emissions: a case study of cotton growers. Front. Environ. Sci. 9. doi:10.3389/fenvs.2021.826838
Ali, N., Phoungthong, K., Techato, K., Ali, W., Abbas, S., Dhanraj, J. A., et al. (2022). FDI, green innovation and environmental quality nexus: new insights from BRICS economies. Sustainability 14, 2181. doi:10.3390/su14042181
An, Y., Liu, N., Zhang, L., and Zheng, H. (2022). Adapting to climate risks through cross-border investments: industrial vulnerability and smart city resilience. Clim. Change 174, 10. doi:10.1007/s10584-022-03431-x
Arora, A., and Gambardella, A. (2010). The market for technology. Handb. Econ. Innov. 1, 641–678. doi:10.1016/S0169-7218(10)01015-4
Bai, D., Hu, J., Irfan, M., and Hu, M. (2023). Unleashing the impact of ecological civilization pilot policies on green technology innovation: evidence from a novel SC-DID model. Energy Econ. 125, 106813. doi:10.1016/j.eneco.2023.106813
Baker, S. M. (2009). Vulnerability and resilience in natural disasters: a marketing and public policy perspective. J. Public Policy Mark. 28, 114–123. doi:10.1509/jppm.28.1.114
Cai, Y., and Lontzek, T. S. (2019). The social cost of carbon with economic and climate risks. J. Polit. Econ. 127, 2684–2734. doi:10.1086/701890
Chen, C., and Wu, Y. (2017). Impact of foreign direct investment and export on urbanization: evidence from China. China World Econ. 25, 71–89. doi:10.1111/cwe.12187
Chen, H., Yi, J., Chen, A., Peng, D., and Yang, J. (2023). Green technology innovation and CO2 emission in China: evidence from a spatial-temporal analysis and a nonlinear spatial durbin model. Energy Policy 172, 113338. doi:10.1016/j.enpol.2022.113338
Chen, Y., Zhang, D., Wu, F., and Ji, Q. (2022). Climate risks and foreign direct investment in developing countries: the role of national governance. Sustain. Sci. 17, 1723–1740. doi:10.1007/s11625-022-01199-8
Ciccarelli, M., and Marotta, F. (2024). Demand or Supply? An empirical exploration of the effects of climate change on the macroeconomy. Energy Econ. 129, 107163. doi:10.1016/j.eneco.2023.107163
Dong, F., Zhu, J., Li, Y., Chen, Y., Gao, Y., Hu, M., et al. (2022). How green technology innovation affects carbon emission efficiency: evidence from developed countries proposing carbon neutrality targets. Environ. Sci. Pollut. Res. 29, 35780–35799. doi:10.1007/s11356-022-18581-9
Doytch, N. (2021). Do FDI inflows to Eastern Europe and Central Asia respond to the business cycle? A sector level analysis. J. Econ. Asymmetries 23, e00194. doi:10.1016/j.jeca.2020.e00194
Du, K., Li, P., and Yan, Z. (2019). Do green technology innovations contribute to carbon dioxide emission reduction? Empirical evidence from patent data. Technol. Forecast. Soc. Change 146, 297–303. doi:10.1016/j.techfore.2019.06.010
Elahi, E., Khalid, Z., Tauni, M. Z., Zhang, H., and Lirong, X. (2022). Extreme weather events risk to crop-production and the adaptation of innovative management strategies to mitigate the risk: a retrospective survey of rural Punjab, Pakistan. Technovation 117, 102255. doi:10.1016/j.technovation.2021.102255
Elahi, E., Zhu, M., Khalid, Z., and Wei, K. (2024). An empirical analysis of carbon emission efficiency in food production across the Yangtze River basin: towards sustainable agricultural development and carbon neutrality. Agric. Syst. 218, 103994. doi:10.1016/j.agsy.2024.103994
Escaleras, M., and Register, C. A. (2011). Natural disasters and foreign direct investment. Land Econ. 87, 346–363. doi:10.3368/le.87.2.346
Gao, C., Wen, Y., and Yang, D. (2022). Governance, financial development and China’s outward foreign direct investment. PLOS ONE 17, e0270581. doi:10.1371/journal.pone.0270581
Gopalakrishnan, S., and Damanpour, F. (1997). A review of innovation research in economics, sociology and technology management. Omega 25, 15–28. doi:10.1016/S0305-0483(96)00043-6
Gu, G. W., and Hale, G. (2023). Climate risks and FDI. J. Int. Econ. 146, 103731. doi:10.1016/j.jinteco.2023.103731
Habiba, U., Xinbang, C., and Anwar, A. (2022). Do green technology innovations, financial development, and renewable energy use help to curb carbon emissions? Renew. Energy 193, 1082–1093. doi:10.1016/j.renene.2022.05.084
Han, B., Kong, D., and Liu, S. (2018). Do analysts gain an informational advantage by visiting listed companies? Contemp. Acc. Res. 35, 1843–1867. doi:10.1111/1911-3846.12363
Hanson, G. H. (2005). Market potential, increasing returns and geographic concentration. J. Int. Econ. 67, 1–24. doi:10.1016/j.jinteco.2004.09.008
Hong, H., Li, F. W., and Xu, J. (2019). Climate risks and market efficiency. J. Econom. 208, 265–281. doi:10.1016/j.jeconom.2018.09.015
Hou, X., Kong, S., and Xiang, R. (2024). Extreme high temperatures and corporate low-carbon actions. Sci. Total Environ. 925, 171704. doi:10.1016/j.scitotenv.2024.171704
Huang, H. H., Kerstein, J., and Wang, C. (2018). The impact of climate risk on firm performance and financing choices: an international comparison. J. Int. Bus. Stud. 49, 633–656. doi:10.1057/s41267-017-0125-5
Kaika, D., and Zervas, E. (2013). The Environmental Kuznets Curve (EKC) theory—Part A: concept, causes and the CO2 emissions case. Energy Policy 62, 1392–1402. doi:10.1016/j.enpol.2013.07.131
Lee, C.-C., Yuan, Z., Lee, C.-C., and Chang, Y.-F. (2022). The impact of renewable energy technology innovation on energy poverty: does climate risk matter? Energy Econ. 116, 106427. doi:10.1016/j.eneco.2022.106427
Letchumanan, R., and Kodama, F. (2000). Reconciling the conflict between the `pollution-haven' hypothesis and an emerging trajectory of international technology transfer. Res. Policy 29, 59–79. doi:10.1016/S0048-7333(99)00033-5
Li, K. X., and Qi, G. (2016). Transport connectivity and regional development in China. J. Int. Logist. Trade 14, 142–155. doi:10.24006/jilt.2016.14.2.142
Li, X., Guo, F., Xu, Q., Wang, S., and Huang, H. (2023). Strategic or substantive innovation? The effect of government environmental punishment on enterprise green technology innovation. Sustain. Dev. 31, 3365–3386. doi:10.1002/sd.2590
Lin, L., and Sun, W. (2016). Location choice of FDI firms and environmental regulation reforms in China. J. Regul. Econ. 50, 207–232. doi:10.1007/s11149-016-9303-9
Lin, T., Wu, W., Du, M., Ren, S., Huang, Y., and Cifuentes-Faura, J. (2023). Does green credit really increase green technology innovation? Sci. Prog. 106, 368504231191985. doi:10.1177/00368504231191985
Ling, S., and Gao, H. (2023). How does climate risk matter for corporate green innovation? Empirical evidence from heavy-polluting listed companies in China. Front. Energy Res. 11, 1177927. doi:10.3389/fenrg.2023.1177927
Lv, C., Shao, C., and Lee, C.-C. (2021). Green technology innovation and financial development: do environmental regulation and innovation output matter? Energy Econ. 98, 105237. doi:10.1016/j.eneco.2021.105237
Meirun, T., Mihardjo, L. W., Haseeb, M., Khan, S. A. R., and Jermsittiparsert, K. (2021). The dynamics effect of green technology innovation on economic growth and CO2 emission in Singapore: new evidence from bootstrap ARDL approach. Environ. Sci. Pollut. Res. 28, 4184–4194. doi:10.1007/s11356-020-10760-w
Midelfart-Knarvik, K. H., Overman, H. G., and Venables, A. J. (2000). Comparative advantage and economic geography: estimating the location of production in the EU. CEPR Discuss. Pap. 2618.
Nie, Y., Li, Q., Wang, E., and Zhang, T. (2019). Study of the nonlinear relations between economic growth and carbon dioxide emissions in the Eastern, Central and Western regions of China. J. Clean. Prod. 219, 713–722. doi:10.1016/j.jclepro.2019.01.164
Nordhaus, W. D. (2007). A review of the stern review on the economics of climate change. J. Econ. Lit. 45, 686–702. doi:10.1257/jel.45.3.686
Onaga, I. F., Arize, A. C., Onwumere, J. U. J., and Kalu, E. U. (2023). Monetary policy transmission channels and the performance of the real sectors in selected sub-Saharan African countries: a system-GMM approach. Future Bus. J. 9, 49. doi:10.1186/s43093-023-00226-z
Painter, M. (2020). An inconvenient cost: the effects of climate change on municipal bonds. J. Financ. Econ. 135, 468–482. doi:10.1016/j.jfineco.2019.06.006
Ren, X., An, Y., He, F., and Goodell, J. W. (2024). Do FDI inflows bring both capital and CO2 emissions? Evidence from non-parametric modelling for the G7 countries. Int. Rev. Econ. Finance 95, 103420. doi:10.1016/j.iref.2024.103420
Ren, X., Li, Y., Shahbaz, M., Dong, K., and Lu, Z. (2022). Climate risk and corporate environmental performance: empirical evidence from China. Sustain. Prod. Consum. 30, 467–477. doi:10.1016/j.spc.2021.12.023
Rising, J. A., Taylor, C., Ives, M. C., and Ward, R. E. T. (2022). Challenges and innovations in the economic evaluation of the risks of climate change. Ecol. Econ. 197, 107437. doi:10.1016/j.ecolecon.2022.107437
Saygın, O., and İskenderoğlu, Ö. (2022). Does the level of financial development affect renewable energy? Evidence from developed countries with system generalized method of moments (System-GMM) and cross-sectionally augmented autoregressive distributed lag (CS-ARDL). Sustain. Dev. 30, 1326–1342. doi:10.1002/sd.2319
Schiederig, T., Tietze, F., and Herstatt, C. (2012). Green innovation in technology and innovation management – an exploratory literature review. RD Manag. 42, 180–192. doi:10.1111/j.1467-9310.2011.00672.x
Semieniuk, G., Campiglio, E., Mercure, J., Volz, U., and Edwards, N. R. (2021). Low-carbon transition risks for finance. WIREs Clim. Change 12, e678. doi:10.1002/wcc.678
Shang, L., Tan, D., Feng, S., and Zhou, W. (2022). Environmental regulation, import trade, and green technology innovation. Environ. Sci. Pollut. Res. 29, 12864–12874. doi:10.1007/s11356-021-13490-9
Shen, C., Li, S., Wang, X., and Liao, Z. (2020). The effect of environmental policy tools on regional green innovation: evidence from China. J. Clean. Prod. 254, 120122. doi:10.1016/j.jclepro.2020.120122
Shen, F., Liu, B., Luo, F., Wu, C., Chen, H., and Wei, W. (2021). The effect of economic growth target constraints on green technology innovation. J. Environ. Manage. 292, 112765. doi:10.1016/j.jenvman.2021.112765
Song, M., Tao, J., and Wang, S. (2015). FDI, technology spillovers and green innovation in China: analysis based on Data Envelopment Analysis. Ann. Oper. Res. 228, 47–64. doi:10.1007/s10479-013-1442-0
Song, Y., Zhang, Z., Sahut, J.-M., and Rubin, O. (2023). Incentivizing green technology innovation to confront sustainable development. Technovation 126, 102788. doi:10.1016/j.technovation.2023.102788
Sun, Y., Li, M., Zhang, M., Khan, H. S. U. D., Li, J., Li, Z., et al. (2021). A study on China’s economic growth, green energy technology, and carbon emissions based on the Kuznets curve (EKC). Environ. Sci. Pollut. Res. Int. 28, 7200–7211. doi:10.1007/s11356-020-11019-0
Tisdell, C. (1970). On the theory of externalities. Econ. Rec. 46, 14–25. doi:10.1111/j.1475-4932.1970.tb02462.x
Wang, C., Li, W., Li, J., and Wan, L. (2024a). The effects of extreme climate events on green technology innovation in manufacturing enterprises. J. Bus. Econ. Manag. 25, 337–355. doi:10.3846/jbem.2024.21170
Wang, Q., Qu, J., Wang, B., Wang, P., and Yang, T. (2019). Green technology innovation development in China in 1990–2015. Sci. Total Environ. 696, 134008. doi:10.1016/j.scitotenv.2019.134008
Wang, X., Li, H., Wang, Y., and Zhao, X. (2022). Assessing climate risk related to precipitation on cultural heritage at the provincial level in China. Sci. Total Environ. 835, 155489. doi:10.1016/j.scitotenv.2022.155489
Wang, Z., Fu, H., Ren, X., and Gözgör, G. (2024b). Exploring the carbon emission reduction effects of corporate climate risk disclosure: empirical evidence based on Chinese A-share listed enterprises. Int. Rev. Financ. Anal. 92, 103072. doi:10.1016/j.irfa.2024.103072
Waseem, M., Khurshid, T., Abbas, A., Ahmad, I., and Javed, Z. (2021). Impact of meteorological drought on agriculture production at different scales in Punjab, Pakistan. J. Water Clim. Change 13, 113–124. doi:10.2166/wcc.2021.244
Wei, J., Wen, J., Wang, X.-Y., Ma, J., and Chang, C.-P. (2023). Green innovation, natural extreme events, and energy transition: evidence from Asia-Pacific economies. Energy Econ. 121, 106638. doi:10.1016/j.eneco.2023.106638
Wen, J., Zhao, X.-X., Fu, Q., and Chang, C.-P. (2023). The impact of extreme weather events on green innovation: which ones bring to the most harm? Technol. Forecast. Soc. Change 188, 122322. doi:10.1016/j.techfore.2023.122322
Xiao, Q., and Fei, L. (2024). How does climate vulnerability impact green innovation? A hindrance to sustainable development. Innov. Green Dev. 3, 100169. doi:10.1016/j.igd.2024.100169
Xu, A., Zhu, Y., and Wang, W. (2023). Micro green technology innovation effects of green finance pilot policy—from the perspectives of action points and green value. J. Bus. Res. 159, 113724. doi:10.1016/j.jbusres.2023.113724
Zeng, L. (2022). The driving mechanism of urban land green use efficiency in China based on the EBM model with undesirable outputs and the spatial Dubin model. Int. J. Environ. Res. Public. Health 19, 10748. doi:10.3390/ijerph191710748
Zhang, H. (2021). Technology innovation, economic growth and carbon emissions in the context of carbon neutrality: evidence from BRICS. Sustainability 13, 11138. doi:10.3390/su132011138
Zhao, F., Wang, J., and Xiao, H. (2024). Climate change disclosure and stock price informativeness, evidence from China. Appl. Econ. Lett., 1–10. doi:10.1080/13504851.2024.2334438
Zhuo, C., and Deng, F. (2020). How does China’s Western Development Strategy affect regional green economic efficiency? Sci. Total Environ. 707, 135939. doi:10.1016/j.scitotenv.2019.135939
Keywords: climate risks, green technology innovation, Spatial Dubin Models, spatial spillover effects, regional heterogeneity
Citation: Wu Y (2025) The impact of climate risks on green technology innovation: an empirical study based on panel data of 269 cities in China. Front. Environ. Sci. 12:1510883. doi: 10.3389/fenvs.2024.1510883
Received: 14 October 2024; Accepted: 19 December 2024;
Published: 07 January 2025.
Edited by:
Xiaohang Ren, Central South University, ChinaReviewed by:
Adnan Abbas, Nanjing University of Information Science and Technology, ChinaHaiqin Fu, Central South University, China
Copyright © 2025 Wu. This is an open-access article distributed under the terms of the Creative Commons Attribution License (CC BY). The use, distribution or reproduction in other forums is permitted, provided the original author(s) and the copyright owner(s) are credited and that the original publication in this journal is cited, in accordance with accepted academic practice. No use, distribution or reproduction is permitted which does not comply with these terms.
*Correspondence: Yangyulong Wu, eWFuZ3l1bG9uZzg1M0BvdXRsb29rLmNvbQ==
 Yangyulong Wu