- 1School of Tourism, Shandong Women’s University, Jinan, China
- 2College of Geography and Environment, Shandong Normal University, Jinan, China
The industrial economy occupies a crucial position in China’s national economy, and industrial eco-efficiency (IEE) as a significant indicator of regional green development levels. Balancing the positive interaction between industrial economy and resource environment, and enhancing ecological efficiency in industrial development are vital for achieving sustainable regional economic development. This study measures the IEE of 115 cities in coastal China based on panel data of industrial resources and the environment factors. Subsequently, it further analyzes the influencing mechanisms and future trends of IEE. The results indicate that the overall IEE in coastal China is on an upward trend, with higher efficiency values in provinces and regions characterized by faster economic development and better environmental conditions. Significant changes in spatial patterns are observed, with the gaps between cities narrowing and a “multi-core” development model emerging. Factors such as per capita GDP, the ratio of industrial pollution control investment to GDP, innovation index, the proportion of foreign direct investment to GDP, and industrial labor productivity significantly positively influence IEE. In contrast, the proportion of industrial added value to GDP, urbanization rate, and the number of industrial enterprises exhibit notable negative inhibitory effects. Moreover, the interaction effect between industrialization level and other factors is most significant. In the future, IEE is expected to continue improving, although the sustainability of these changes appears weak. These findings reveal the potential impact mechanisms of resource consumption and environmental pollution caused by industrial activities on economic benefit output. This study provides a scientific basis for optimizing energy development layout, enhancing the comprehensive utilization of energy resources, and improving ecological compensation and protection mechanisms.
1 Introduction
As the only country in the world with a complete industrial system, China has experienced rapid industrial development in recent years. The development of industrial sectors has become a key driver of China’s high economic growth, with the industrial economy occupying a crucial position in national economic development. A notable feature is the increase in China’s industrial added value from 13.17 trillion yuan in 2008 to 39.91 trillion yuan in 2023, with an average annual growth rate of 7.67%. This sector accounts for the largest share of value added among all industries and has shown an upward trend year by year. Concurrently, the share of China’s industrial added value in the global total has been rising, reaching 30.2% of the global manufacturing value added in 2022. However, this rapid development has also placed significant pressure on resources and the environment. Specifically, the extensive development model characterized by high resource consumption, high pollution, and low productivity resulting from industrial development has led to prominent resource and environmental issues in China, with increasingly evident economic externalities. (Chen et al., 2013; Gehrsitz, 2017). As of 2022, China remained the world’s largest energy consumer, accounting for 26.4% of global energy consumption, with industrial energy consumption comprising 70% of the national total. Meanwhile, environmental pollution problems arising from industrial energy consumption, such as wastewater and exhaust gas emissions, have become increasingly severe (Wu et al., 2015). Currently, the resource and environmental issues caused by industrial development have become major obstacles to China’s ecological security, making industrial ecological problems a critical “bottleneck” in China’s economic growth (Cao et al., 2018). Therefore, how to balance the positive interaction between industrial economy and resource environment, and how to enhance IEE, are urgent and crucial issues that China needs to address.
As industrialization advances, global issues such as resource scarcity and worsening environmental pollution are becoming increasingly prominent. Accurately assessing IEE is crucial for improving resource and environmental performance in industrial production processes (Chen et al., 2020). However, the academic community currently faces challenges in defining the essence of ecological efficiency, particularly in assessing ecological efficiency with a focus on industrial production. For instance, Maxime et al. (2006) believes that eco-efficiency is a method for evaluating sustainable development parameters, aiming to reduce resource consumption and environmental impact. Schmidheiny and Stigson (2000) point out that eco-efficiency aims to lower ecological effects and resource capacity to a level comparable to the Earth’s carrying capacity while meeting basic human needs and improving quality of life. Despite these varied definitions, research on IEE aims to achieve sustainable economic and social development, emphasizing minimization of resource and environmental consumption and maximization of economic benefits in industrial production processes (Liu Y. et al., 2020). Based on this, IEE is primarily focused on measuring the ratio of outputs to inputs in industrial production processes (Schaltegger and Sturm, 1990). “Outputs” include industrial economic benefits and emissions of pollutants generated, while “inputs” represent resources and energy consumed during production processes (Leontief, 1936). Previous studies have typically used indicators such as capital investment and various energy resource consumption as input measures, and economic output value as an output measure to construct an indicator system (Zhang et al., 2017; Moutinho et al., 2018). In addition, regarding the measurement methods of IEE, Data Envelopment Analysis (DEA) is one of the most representative approaches (Wu, 2015). Early scholars often used traditional DEA models such as Charnes-Cooper-Rhodes and Banker-Charnes-Cooper for calculations (Chung et al., 1997). In recent years, Slacks-Based Measure (SBM) models or super-efficiency DEA models have emerged (Shuai and Fan, 2020; Liu et al., 2022), providing new and effective methods for evaluating IEE. In terms of selecting research subjects, previous studies have often focused on specific sectors within the industrial industry, with a predominant focus on energy-intensive industries (Pravdić, 1995; Rigina, 2002), as industrial sectors are key targets for improving IEE. For example, Azadeh et al. (2007) empirically analyzed the spatiotemporal distribution of industrial energy efficiency in Organization for Economic Cooperation and Development countries’ manufacturing sectors such as steel, cement, and paper using DEA models. Other studies have employed DEA models incorporating undesirable outputs and directional distance functions to assess the spatiotemporal variations in energy efficiency within the cement manufacturing industry in India (Mandal, 2010; Mukherjee, 2010). However, the industrial economic situation in coastal regions has been significantly overlooked. Since the 1980s, China’s marine economy has rapidly developed, leading to increased attention on the exploitation of coastal resources and environments. Consequently, the speed and scope of pollution have continued to rise, making the ecological issues in coastal areas impossible to ignore (Lin and Wang, 2021). In addition, another focus of research on IEE is the analysis of influencing factors, which forms the basis for proposing future development directions. The selection of influencing factors must consider both data availability and the unique characteristics of the industrial sector compared to others. Relevant studies have suggested that IEE is mainly influenced by social development factors (Liu Z. et al., 2020). The economic development level, industrial development level, and human capital status are the most representative indicators (Verhoef and Nijkamp, 2002; Ren et al., 2003). In recent years, factors such as market environment, institutional structure, technological capabilities, and the proportion of state-owned enterprises have gradually been included in the selection of influencing factors (Wang et al., 2017; Zhang and Zhao, 2018). For example, Wang and Yuan (2018) argue that a higher proportion of state-owned enterprises significantly inhibits energy conservation and emissions reduction, providing insights into efficiency improvement.
Indeed, the evaluation framework for the coordinated development of resources, economy, and environment has already gained recognition (Ahmed et al., 2020). However, previous studies have rarely constructed an interconnected evaluation system based on the connotations of IEE (Yang L. et al., 2024). Furthermore, effective optimization strategies for the sustainable development of coastal industrial areas, through the simulation of future trends and analysis of influencing mechanisms, have not received sufficient attention. The Hurst index can effectively reflect the trend intensity and long-term persistence of a subject’s development over a certain period, making it particularly useful for understanding the behavioral patterns of complex systems. It has been widely proven to be applicable to fields such as stock market analysis, river flow levels, and climate change (Tong et al., 2018; Tao et al., 2022). Therefore, this study focuses on 115 cities in China’s coastal areas, measures and analyzes the characteristics and influencing factors of IEE, and explores its future evolution trends. Firstly, we construct an IEE evaluation system from three dimensions: industrial resource input, industrial economic output, and industrial pollution emissions. We use a mixed directional distance function model to measure IEE and analyze its spatiotemporal evolution characteristics. Second, we employ the Tobit model and geo-detector to investigate the influencing mechanisms of IEE. Finally, we simulate and predict the future evolution trends of IEE by calculating the NICH index and the Hurst index, and propose optimization strategies. The results of this study can provide a valuable basis for decision-makers in marine industrial governance. Additionally, the findings are crucial for promoting the transformation and upgrading of regional industrial structures, further fostering human-land coordination and protecting marine ecosystems.
2 Study area and data sources
2.1 Study area
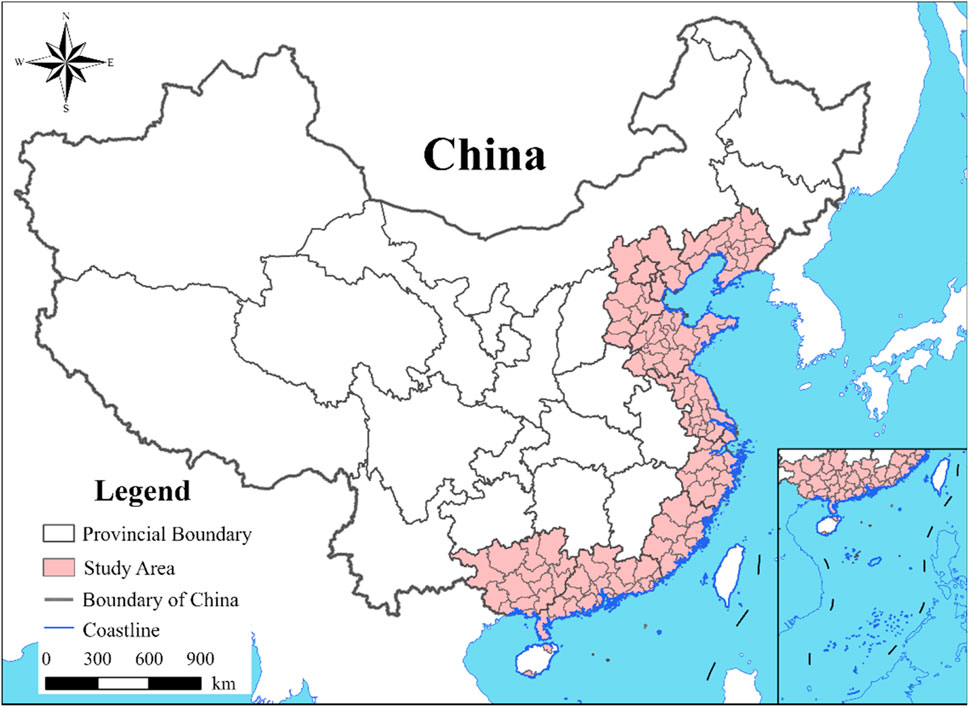
Coastal areas generally possess geographical advantages such as favorable climate, convenient external communication, and conducive conditions for economic development. Approximately 60% of the world’s population resides within 100 km of the coast, a trend that is even more pronounced in China. The 14 coastal provinces of China are characterized by good environmental conditions, developed economies, and high population carrying capacities. The GDP of these provinces consistently accounts for over 60% of the national total. Based on this, this study selected 115 cities across 12 coastal provinces (excluding Taiwan, Hong Kong, and Macau) in China as the research area. These provinces include Beijing, Tianjin, Hebei, Liaoning, Shanghai, Jiangsu, Zhejiang, Fujian, Shandong, Guangdong, Guangxi Zhuang Autonomous Region, and Hainan. Considering data availability, only Haikou and Sanya were included from Hainan Province. Additionally, although Beijing does not have a coastal location, it was included in the study area due to its significant locational advantages as the capital and a national central city (Figure 1).
2.2 Data sources
The data of this study were obtained from the China Urban Statistical Yearbook, China Urban Construction Statistical Yearbook, China Industrial Statistical Yearbook, China Environmental Statistical Yearbook, and China Regional Economic Statistical Yearbook for the years 2004–2021, as well as relevant statistical yearbooks, economic and social development statistical bulletins, water resources bulletins, and environmental statistical bulletins from various cities. Additionally, the calculation method for the innovation index of certain cities is derived from the China Urban and Industrial Innovation Report published by the Fudan University Industrial Development Research Center. We carefully considered the continuity and operability of the data, conducting thorough organization and cleaning for the relevant data from 115 cities within the study area. This approach effectively minimized errors due to data gaps. For the missing data in certain years, we applied exponential smoothing and moving average methods for preprocessing. Furthermore, the SPSS software was used to identify and remove outliers.
3 Methodology
3.1 Framework and indicator system for IEE
The concept of IEE emphasizes optimizing economic benefits and environmental impacts in industrial production through improved resource utilization efficiency and reduced environmental pollution (Matsumoto and Chen, 2021). Specifically, it focuses on coordinating the material exchange and energy transformation processes in industrial economic development, assessing the overall benefits of industrial energy, economy, and environment. This holistic approach reflects the sustainability of industrial resource and environmental development systems (Xing et al., 2018). The basic idea underscores the coordinated development among resources, economy, and environment, where the resource system serves as the foundational dynamic for economic and environmental systems, the economic system sustains continuous development of resource and environmental systems, and the environmental system acts as the carrier for both economic and resource systems. These interconnected systems aim to minimize environmental pollution while creating value through products and services (Meng et al., 2022) (Figure 2).
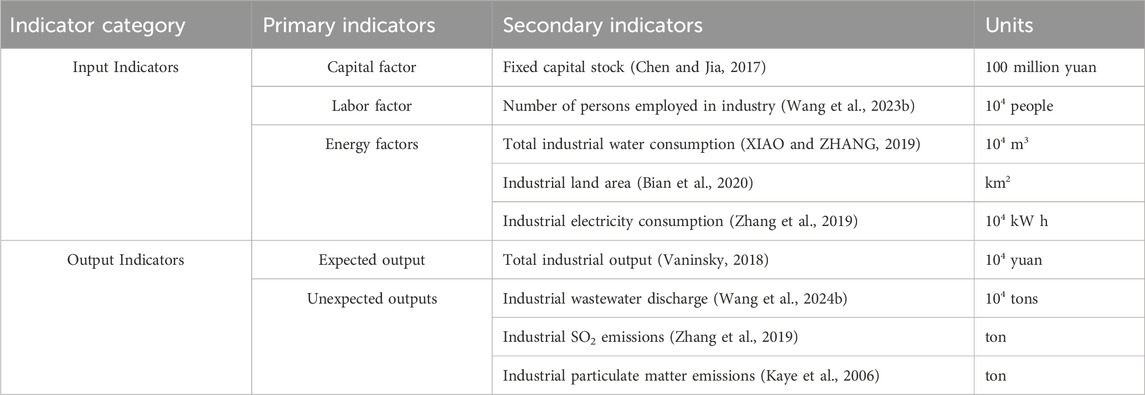
Based on the above framework, this study fully considers the industrial economic development in China’s coastal regions. It establishes an evaluation index system for IEE in China’s coastal areas, focusing on industrial resource input, industrial economic output, and industrial pollution emissions (Table 1).
3.2 Methods for evaluating IEE
3.2.1 Hybrid directional distance function
Directional distance function models are commonly employed in efficiency assessment processes that incorporate unexpected outputs. In previous studies, radial and directional DEA models have been used to compute directional distance functions, which may result in non-zero slack between inputs and outputs, leading to efficiency values higher than actual efficiency. Alternatively, using non-radial, non-angular SBM models to compute directional distance functions can result in proportional changes between inputs and outputs, potentially yielding efficiency values lower than actual efficiency (Zhou et al., 2010). To avoid the aforementioned issues, this study adopts the approach proposed by Tone (2015), extending the radial and non-radial directional distance functions into a hybrid directional distance function. This model integrates the characteristics of both radial and non-radial distance functions. While capturing the proportional relationship between observed and actual values, it also reflects the non-radial differences among variables.
Consider the input-output matrices X and Y, where the output matrix Y is further divided into the desirable output matrix Yd and the undesirable output matrix Yu. X is (r × n), Yd is (s × n), and Yu is (t × n), representing r input variables, s desirable output variables, and t undesirable output variables, respectively, for n decision-making units (Färe and Grosskopf, 2010; Zhou et al., 2012). Decompose X into two parts m = m1 + m2, that is, radial inputs and non-radial inputs
subject to
where
3.2.2 Kernel density analysis
Kernel density analysis is a non-parametric method used to estimate the dynamic evolution of random variables (Xie and Yan, 2008). This approach can investigate the spatial differentiation density among various cities in China’s coastal regions, providing a more intuitive reflection of the regional differences in industrial resource environmental efficiency among different cities. The model is presented as shown in Equation 2:
where
3.2.3 Malmquist index model
The Malmquist index allows for the decomposition of efficiency, enabling the examination of efficiency variations across different time periods (Caves, 1981). Under the technological conditions of time t, the change in technical efficiency from t to t + 1 can be measured using the Malmquist index. The Malmquist index was calculated using Equation 3.
Similarly, under the technological conditions of time t + 1, the change in technical efficiency from t to t+1 can also be measured using the Malmquist index. Its calculation is shown in Equation 4.
where Dt and D+1 represent the output distance functions for periods t and t + 1, respectively. Similarly, xt and xt+1 denote the inputs for periods t and t + 1, while yt and yt+1 represent the outputs for these respective periods.
To avoid potential biases arising from time selection, this study adopts the geometric mean of the Malmquist index to measure the change in total factor productivity from period t to t + 1. Its calculation is shown in Equation 5.
When assuming constant returns to scale, the Malmquist index can be decomposed. Its calculation is shown in Equation 6.
where Tfpch represents changes in total factor productivity, Effch represents changes in technical efficiency, Tech reflects technological change, Pech denotes changes in pure technical efficiency, and Sech represents changes in scale efficiency. If Tfpch is greater than 1, it indicates an improvement in total factor productivity. If Effch is greater than 1, it suggests an enhancement in technical efficiency. A Tech value greater than 1 signifies technological progress, while Pech greater than 1 reflects an improvement in the application of technology. Sech greater than 1 indicates an optimization of scale efficiency. Conversely, if any of these indices are less than 1, it implies a decline or deterioration in the corresponding efficiency.
3.3 Analysis of influencing factors
3.3.1 Selection and description of variables
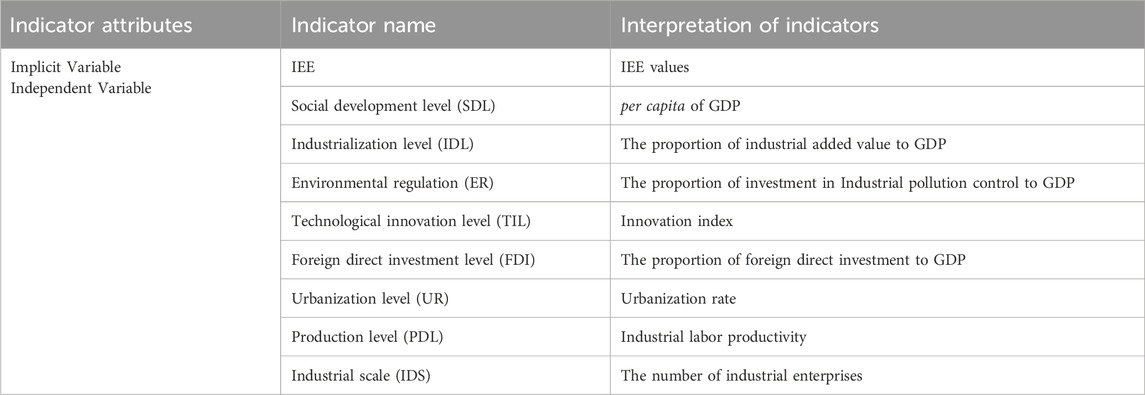
The influencing factors chosen for this study are listed in Table 2. Based on previous research, these variables are significantly related to industrial development and its potential ecological impact. The per capita regional GDP is a macroeconomic indicator used to assess the economic development status of a country or region. The proportion of industrial added value to GDP is a key indicator of the contribution of the industrial sector to regional economic output, reflecting the significance of industrial activities within the economy. Compared to other sectors, the high pollution levels of industrial activities have a more pronounced negative impact on the ecological environment. The proportion of investment in industrial pollution control to GDP represents the government’s emphasis on environmental governance. The level of technological innovation can measure the capacity of industrial enterprises to innovate and produce technological advancements, ideally supporting efficient resource utilization and environmental management, thereby improving industrial ecological efficiency. The proportion of foreign direct investment to GDP indicates the dependence of regional industrial development on foreign investment and its potential spillover effects, which may influence industrial ecological efficiency in different ways. Previous studies suggest that the urbanization rate may exhibit an inverted U-shaped relationship with environmental pollution (Zhang T. et al., 2023), warranting further investigation of its relationship with industrial ecological efficiency. Industrial labor productivity reflects the labor efficiency of industrial workers per unit of time and serves as a comprehensive economic measure of industrial enterprise management, operation, and production technology. The number of industrial enterprises can represent the prosperity of industrial economic development, and while promoting economic growth, the impact on the ecological environment also deserves further discussion.
3.3.2 Methodology of influence factor analysis
To address issues related to censored dependent variables, Tobin (1958) first proposed the Tobit model. In this study, the calculated values of IEE range between 0 and 1, categorizing them as “censored dependent variables”. If ordinary least squares regression is used, it may result in inconsistency or bias in the results. Therefore, this study employs the Tobit model to estimate parameters and conduct regression analysis on the factors influencing IEE in China’s coastal regions. The basic expression is shown in Equation 7.
where Ymn represents the dependent variable, where m denotes the IEE of the mth city. Xmn represents the independent variables. α0 denotes the intercept. αn is the vector of estimated coefficients, and εm represents the random error term.
Based on the effects of industrial economy, technological level, environmental protection, and incorporating the Tobit model, we derive the basic expression of IEE as shown in Equation 8:
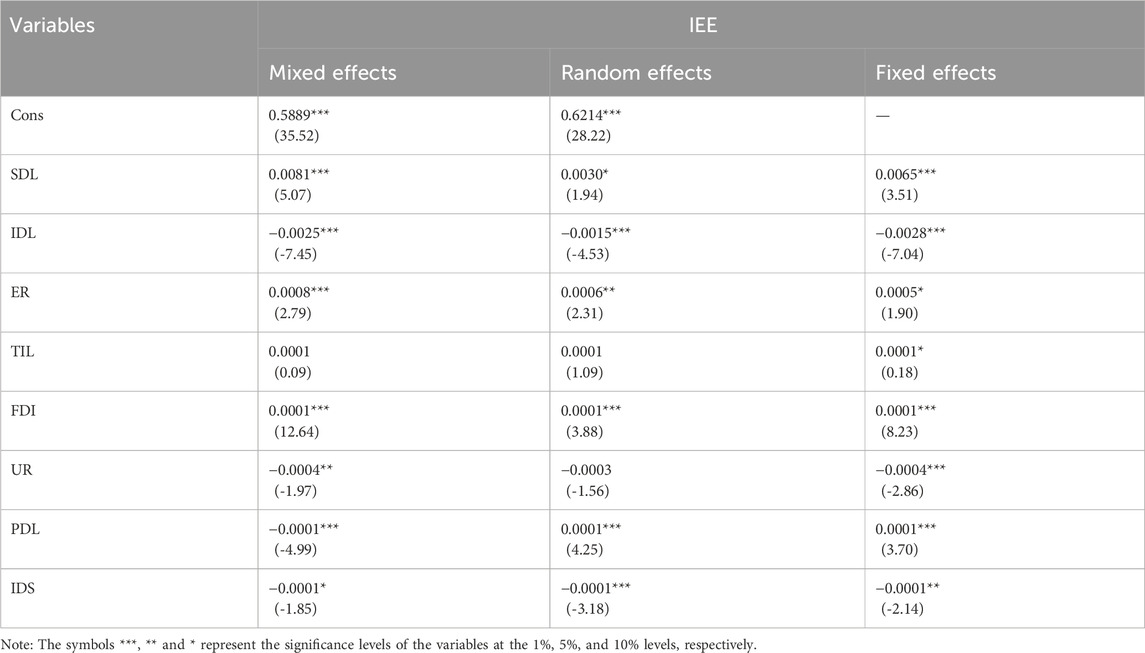
Based on the computational results, this study conducted LR and Hausman tests using Stata 14.0 software. The results reject the null hypotheses of mixed effects and random effects. Therefore, we opt for fixed effects results for the regression analysis.
Geo-detector was originally used to detect the mechanisms of disease risk and is now commonly employed to detect spatial heterogeneity of geographic factors, thereby revealing their underlying driving mechanisms (Fotheringham et al., 2000; Wang et al., 2010). This study applies factor interaction detection in geo-detector to identify the influencing factors of IEE in China’s coastal regions, Equation 9 as follows:
where Y and Yn denote the total number of study areas and the number of units into which the study area is divided, respectively. L represents the sub-regions of the detection factor. w2 and w2 n respectively denote the overall variance and the variance within sub-regions of the study area. q signifies the detection power of the factor, ranging from 0 to 1. A higher q indicates a greater influence of the detection factor, whereas a lower q indicates a lesser influence.
3.4 Methods for simulating evolutionary trends
During the urban industrial development process, IEE exhibits evolving trends. Therefore, this study simulates and predicts the future evolution of IEE by calculating the NICH and the Hurst index. The NICH Index, also known as the Relative Growth Rate Index, is primarily used to measure the relationship between the economic growth rate of a region and the overall growth level of the area. The NICH Index is a crucial economic analysis tool that enables researchers to better understand the dynamics of regional or industrial development, providing a scientific basis for policy formulation and economic development planning. This study employs the NICH Index to represent the relative relationship between the changes in IEE of various cities during the study period and the overall changes in IEE in the study area. This approach is used to assess the relative growth and trends in IEE across different cities. Its calculation is shown in Equation 10.
where
The Hurst index effectively reflects the trend intensity of variables over the study period (Hurst, 1951). In this study, it is used to gauge the sustainability of future development of IEE. The Hurst index was calculated using Equation 11.
where, E represents the IEE value, while Et denotes the time series. We recognize that there are various methods to calculate the Hurst index, each with different applicability, which may lead to different estimated values. In this study, we used the R/S (rescaled range) analysis method to determine the Hurst index by analyzing the long-term correlations of the time series data, which we believe is suitable for the prediction model of IEE’s future trends. If the ratio between the range R(T) and the standard deviation S(T) follows the relationship R/S∝TH, it indicates the presence of the Hurst phenomenon (Granero et al., 2008).
4 Results
4.1 IEE characteristics
4.1.1 Spatial characteristics of IEE
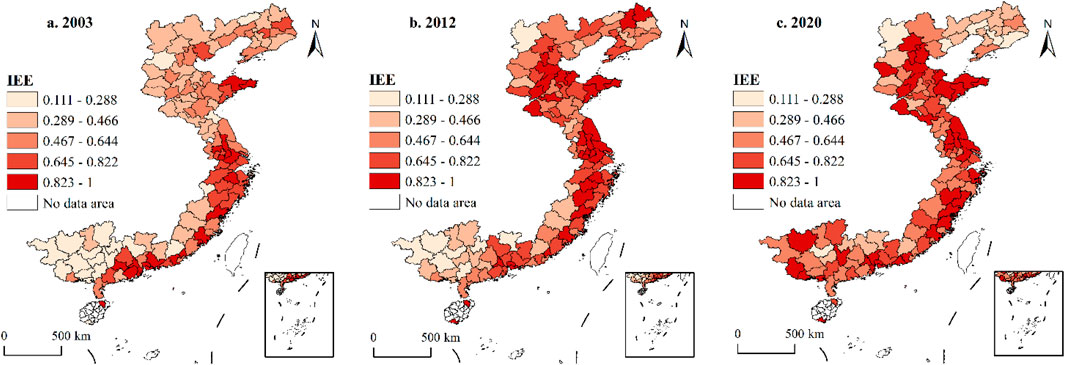
Figure 3 illustrates the spatial pattern and the evolution of spatial disparities in IEE in China’s coastal areas from 2003 to 2020. The spatial pattern of IEE in these regions has experienced significant changes. In 2003, the high IEE areas were mainly concentrated in the Yangtze River Delta, Pearl River Delta, and Shandong Peninsula. By 2020, the number of cities with high IEE levels had increased, expanding to include regions such as Guangxi, Zhejiang, and Hebei. Specifically, cities such as Dongguan, Weihai, Yantai, Foshan, Shenzhen, and Suzhou consistently maintained an IEE level between 0.823 and 1, indicating high efficiency. This may be attributed to the relatively high total industrial output and relatively low industrial environmental pollution emissions in these cities, which contributes to the improvement of IEE. Conversely, Laibin City has consistently remained in the low IEE category. This is due to its low capital stock, limited basic resource inputs required for industrial development, and high emissions of industrial pollutants such as wastewater and exhaust gas, which are higher than those in most other coastal cities, leading to its low IEE.
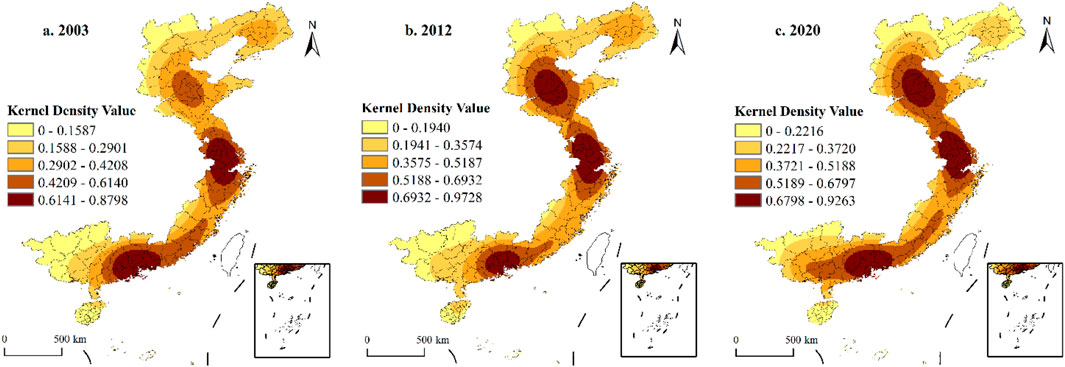
Figure 4 shows the kernel density maps of IEE in China’s coastal regions for the years 2003, 2012, and 2020. In 2003, cities with higher kernel density values were primarily concentrated in the Yangtze River Delta and the Pearl River Delta regions, with the highest average city density reaching 0.913. These regions exhibited strong spillover effects on the surrounding areas. In the Yangtze River Delta, the high-density areas appeared as patches, showing a slight tendency to extend northward and southward. The Pearl River Delta displayed a strip-like distribution from the southwest to the northeast. The Beijing-Tianjin-Hebei region showed signs of emerging as a new core cluster, with kernel density values slightly lower than those of the Yangtze River Delta and the Pearl River Delta, averaging 0.553. By 2012, the overall increase in kernel density was modest. The Beijing-Tianjin-Hebei urban agglomeration had become a new core cluster, with a kernel density value of 0.730. The Pearl River Delta and the Yangtze River Delta remained the primary core clusters. However, the aggregation in the Pearl River Delta had slightly weakened, reducing its influence towards the northeast. Conversely, the aggregation in the Yangtze River Delta had intensified, showing a trend of extending northwards, gradually connecting with the Beijing-Tianjin-Hebei region to form a contiguous cluster. The region centered on Shenyang, Liaoyang, and Anshan showed increased aggregation, indicating a tendency to become a small-scale core cluster. In 2020, the spatial distribution of IEE exhibited a multi-core aggregation pattern with significant increases. The highest average city density reached 0.940. The Beijing-Tianjin-Hebei region had developed into a new core cluster, surpassing the Pearl River Delta in spatial extent. The core cluster centered around the Pearl River Delta expanded southwestward and northeastward, forming a horizontally elongated distribution. The core clusters centered around the Yangtze River Delta and the Beijing-Tianjin-Hebei region had connected into a contiguous development pattern with strong spillover effects. Meanwhile, the aggregation region centered on Shenyang, Liaoyang, and Anshan had gradually diminished, failing to form a new core cluster.
4.1.2 Temporal characteristics of IEE
Figure 5 illustrates the average efficiency values for 12 coastal provinces in China in 2003, 2012, and 2020. A static analysis of the temporal evolution of IEE reveals that five provinces, namely, Beijing, Tianjin, Jiangsu, Fujian, and Guangxi, have experienced an increase in IEE. Notably, Guangxi has shown the most significant upward trend, with its efficiency rising from 0.24 in 2003 to 0.71 in 2020, achieving an average annual growth rate of 6.59%. In contrast, the other four provinces have exhibited weaker upward trends, with annual growth rates below 6.20%. Hebei, Liaoning, Shanghai, Zhejiang, Shandong, and Hainan demonstrate a trend of initial increases followed by subsequent declines in IEE. Among these, Liaoning exhibits the greatest fluctuation, with efficiency rising from 0.49 in 2003 to 0.65 in 2012, before dropping to 0.31 in 2020, resulting in an average annual change rate of −2.66%. This fluctuation is attributed to Liaoning’s economic structure, which predominantly relies on traditional heavy industries, leading to issues such as inefficient resource utilization and continuous increases in pollutant emissions, thereby resulting in lower IEE. Additionally, Guangdong shows a trend of initial decline followed by a subsequent increase, though the upward trend is not significant, with an average annual change rate of −0.37%.
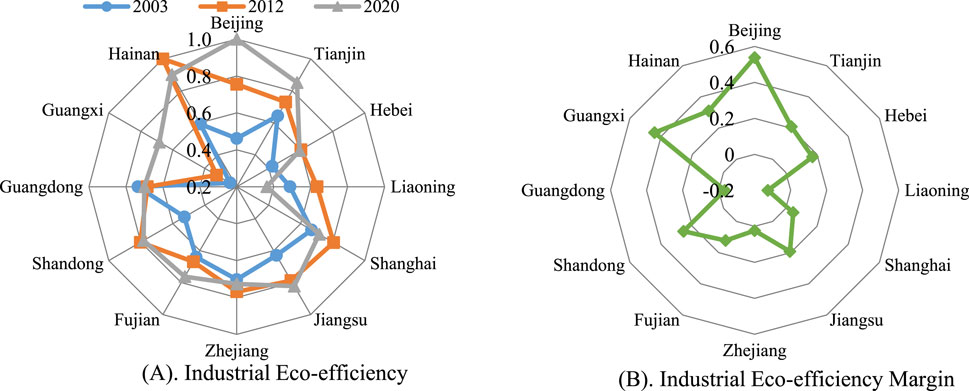
Figure 5. Change characteristics of IEE. (A) Industrial Eco-efficiency. (B) Industrial Eco-efficiency Margin.
The study employs the Deap2.1 software to calculate indices of IEE changes (Tfpch), technical efficiency changes index (Effch), technological progress change index (Techch), pure technical efficiency changes index (Pech), and scale efficiency change index (Sech) for the period from 2003 to 2020. This facilitates the analysis of dynamic changes and heterogeneity in efficiency (Supplementary Table S1). The Tfpch values for 36 cities, including Beijing, Shijiazhuang, Qingdao, and Yantai, are all greater than 1, indicating an improvement in IEE in these cities over the study period. Regarding the technical efficiency change index, Effch values are greater than 1 for nearly half of the cities, suggesting that the majority of cities experienced significant technical efficiency changes from 2003 to 2020, contributing substantially to IEE. In terms of the technological progress change index, only 33 cities, including Shijiazhuang, Nanjing, Qingdao, and Dongying, have Techch values greater than 1, indicating that technological progress was relatively slow in most coastal cities during the study period, contributing minimally to IEE. The pure technical efficiency changes index (Pech) values exceed 1 for over 63% of the cities, including Tianjin, Dalian, Shanghai, and Zibo, implying that changes in pure technical efficiency made a minimal contribution to IEE in these cities. Conversely, the scale efficiency changes index (Sech) values for 55 cities, including Tianjin, Zhenjiang, Jining, and Nanning, are all less than 1, indicating that changes in scale efficiency contributed minimally to changes in technical efficiency in these cities.
4.2 Analysis of influencing factors
4.2.1 Analysis of influential factors based on Tobit modeling
Table 3 presents the regression results on the factors influencing IEE. The analysis reveals that per capita GDP, the proportion of foreign direct investment to GDP, and industrial labor productivity have a significant positive impact on IEE, with all factors being significant at the 1% level. Per capita GDP has the highest coefficient of 0.0082, indicating it has the strongest effect on IEE. Investments in industrial pollution control as a percentage of GDP and the innovation index also positively influence IEE, with significance at the 5% and 10% levels respectively, and coefficients of 0.0050 and 0.0010. Conversely, the proportion of industrial added value to GDP, the urbanization rate, and the number of industrial enterprises have a negative impact on IEE. The inhibitory effects of the proportion of industrial added value to GDP and the urbanization rate are particularly significant, with coefficients of 0.0054 and 0.0006 respectively, indicating that the proportion of industrial added value to GDP has a greater negative impact on IEE. The negative effect of the number of industrial enterprises is significant at the 10% level, with a coefficient of only 0.0001, suggesting that the adverse effect of industrial scale on IEE is relatively weak.
4.2.2 Analysis of influential factors based on geo-detector
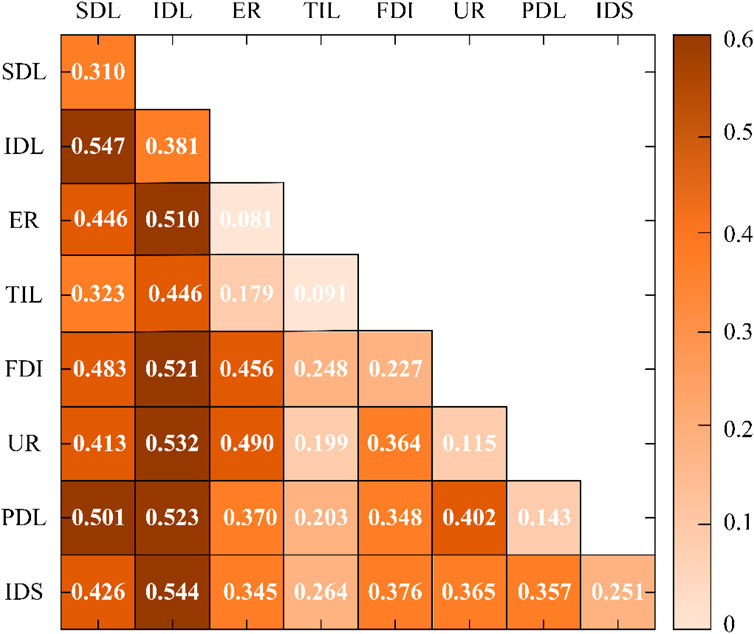
Figure 6 shows the interaction detection results of factors influencing the IEE along China’s coastal regions. The findings indicate that the spatial variations in IEE are not the result of individual factors acting in isolation, but rather, they are primarily characterized by two types of interactions: double-factor enhancement and non-linear enhancement. This suggests that the interplay between any two driving factors can better explain the spatial disparities in IEE. Specifically, the interaction between SDL and IDL has the most significant impact on IEE, with the highest q-value of 0.547, explaining approximately 56% of the variation. Additionally, interactions that explain more than 50% of IEE variations include: IDL∩IDS, IDL∩UR, IDL∩PDL, IDL∩FDI, SDL∩PDL, and IDL∩ER. The level of socio-economic development reflects the scale and stage of socio-economic progress, with higher industrialization levels indicating an increasing proportion of industrial output in the national economy. On one hand, socio-economic development positively influences IEE, as the promotion of industrialization relies on the socio-economic development level as a carrier. On the other hand, the continuous expansion of industrial scale demands higher resource utilization efficiency, labor productivity, and environmental management efficiency during industrial production, which in turn facilitates foreign investment attraction and accelerates urbanization. Therefore, the interactions between industrialization level and factors such as socio-economic development level, urbanization level, foreign investment level, and production level positively contribute to the enhancement of IEE.
4.2.3 Robustness test
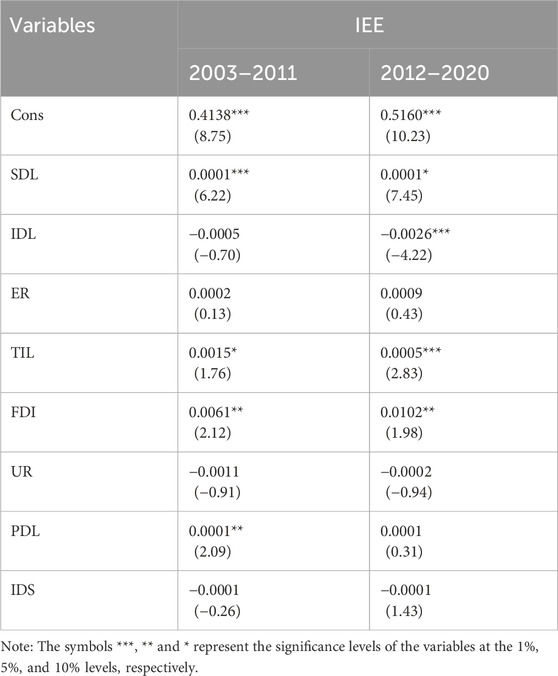
Considering the potential presence of omitted variables or bidirectional causality among variables in the model construction, which may lead to endogeneity issues, robustness tests were conducted to ensure the reliability of the regression results. This study employed Tobit estimation on the IEE for two sub-samples, covering the periods 2003-2011 and 2012-2020, respectively (Table 4). In the regressions for both sub-samples, the results of the LR test and Hausman test only rejected the null hypothesis of the mixed regression, leading to the selection of random effects for analysis. The results indicate that per capita GDP, the proportion of industrial pollution control investment in GDP, the innovation index, the proportion of foreign direct investment in GDP, and industrial labor productivity have significant positive impacts on the industrial resource and environmental efficiency in China’s coastal regions. In contrast, the proportion of industrial added value in GDP, the urbanization rate, and the number of industrial enterprises exhibit notable negative effects. Although there are some differences in the significance levels of individual independent variables due to the numerous variables involved, the signs of the coefficients for all variables are consistent with those in the full sample. Therefore, the robustness test results are considered reliable.
4.3 Simulation of evolutionary trends
This study superimposes the spatial distribution maps of NICH index and the Hurst index in China’s coastal regions to derive the future development trends of IEE (Figure 7). The results indicate that areas with significant improvement form two primary bands. The first extends from north to south, covering key cities such as Chengde, Beijing, Baoding, Dezhou, Linyi, Lianyungang, and Yancheng, the second stretches from northeast to southwest, including cities like Quzhou, Sanming, Meizhou, Guangzhou, Qingyuan, Guigang, Nanning, and Baise. Cities with moderate improvement and minor decline are fewer in number and more dispersed, including Zaozhuang, Ningbo, Tianjin, Shenyang, Nanjing, Zibo, and Shaoguan. Areas experiencing significant decline are more clustered, primarily found in Liaoning province’s cities such as Dalian, Yingkou, Dandong, and Huludao, as well as in the Yangtze River Delta region’s cities like Hangzhou, Jiaxing, Shanghai, and Suzhou. Except for cities such as Nanning, Huizhou, Quanzhou, Suzhou, Jinan, and Chengde, which exhibit strong sustainability, most other cities demonstrate weaker sustainability. In the future, while some cities in Liaoning, Zhejiang, and Guangdong provinces are projected to experience continuous declines in IEE, the majority of cities are expected to show ongoing improvements. Notably, cities with strong and sustained improvement are predominantly located in parts of Hebei, Shandong, and Guangxi provinces.
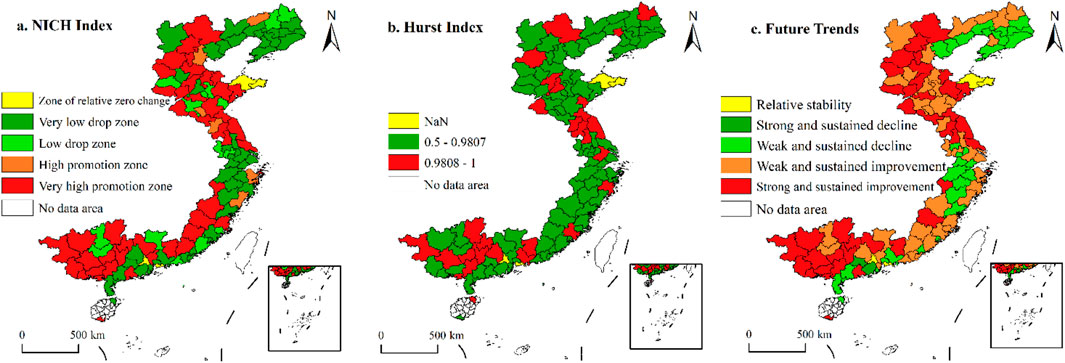
Figure 7. NICH index, Hurst index and future development trend. (A) NICH Index. (B) Hurst Index. (C) Future Trends.
5 Discussion
5.1 Influence mechanism and future trends of IEE
This study analyzes the impact of eight factors, including social, economic, and industrial, on IEE. The results indicate that social development level, environmental regulation, technological innovation level, foreign investment level, and production level all contribute to the improvement of IEE, as illustrated in Figure 8. On one hand, the process of industrialization inevitably brings certain industrial economic benefits, and the improvement of economic benefits simultaneously implies an enhancement of the social development level. The increase in socioeconomic levels and the substantial inflow of foreign investment can provide more favorable financial support and economic demand for environmental regulation measures such as energy conservation and emission reduction, resource recycling, and technological research and development (Wang F. et al., 2023). This enhances regional talent attraction and is conducive to improving IEE. On the other hand, in 2018, China’s innovation index exceeded 200 for the first time, with a year-on-year growth of 10.9%. The continuous optimization of technological innovation capabilities and the talent agglomeration effect have injected new vitality into industrial upgrading (Zheng and Peng, 2019). To some extent, this can improve industrial labor productivity, and the resulting strong spatial spillover effects can expand economic output and social development levels, thereby enhancing IEE. However, the proportion of industrial added value in GDP, urbanization rate, and the number of industrial enterprises show significant negative effects, indicating that the expansion of industrialization level, urbanization level, and industrial scale can hinder the improvement of IEE.
In the operation of the coastal region’s market economy, the industrial sector has played a critical role (Wang et al., 2019). However, IEE comprehensively considers resource inputs, output benefits, and environmental pollution outputs. Given that the industrial sector is the largest consumer of resources and producer of pollution, an increase in the number of industrial enterprises indicates an expansion of industrial scale, leading to a heavily industrialized economic structure. Lei et al. (2024) demonstrated that severe industrialization of the economic structure leads to a significant decline in both ecological efficiency and its coordination with urbanization. Although the expansion of industrial scale has brought considerable economic benefits to the coastal regions, it has also resulted in exacerbated pollution. This explains the observed negative impact of increased industrial output and the growing number of industrial enterprises on IEE during the study period. Regarding the urbanization rate, its increase implies a rise in urban population, which plays a crucial role in regional development. Coastal areas are among the most populous and dynamic regions of China, particularly in the eastern and central areas where the urban population often exceeds the sustainable threshold (Zheng et al., 2024). Rapid population growth in cities may lead to several adverse consequences, such as industrial land expansion, environmental pollution, and intensified resource consumption (Ohene-Asare et al., 2020). These factors partially clarify why an increased urbanization rate contributes to a decrease in IEE. Although China’s coastal areas play a significant role in terms of urbanization and economic contribution, the economic and environmental disparities across different cities and regions create substantial heterogeneity in the factors influencing IEE (Shen et al., 2024). Most cities in the southern part of the study area are in the growth or maturity stage of resource development. Resource development serves as a favorable condition for attracting foreign investment (Ruan et al., 2020), helping southern industries obtain more investment and resources, thus having a significant positive impact on IEE. In northern cities, a substantial amount of highly polluting and energy-intensive industries were established in earlier years. Although the region’s advantageous natural resources have largely maintained ecological balance, persistent industrial pollution has exacerbated ecological vulnerability (Ruan et al., 2020). In recent years, the government has intensified its regulatory efforts, which has led to a slight improvement in IEE in northern cities; however, the negative impact of industrial scale remains significant.
The results of multi-factor interactions reveal that the interaction between industrialization level and other factors is significantly stronger than the interactions among other factors, with the combined effect with social development level being particularly prominent. Per capita GDP is an essential foundational factor for regional construction and development, as well as a crucial indicator of regional economic growth. Robust economic development facilitates industrial agglomeration within a region and provides financial support for an intensive industrial structure. The proportion of industrial added value in GDP represents the level of industrial development in an area. Regional development should not solely rely on traditional industries; it is essential to actively promote the integration of traditional industries with various sectors and to foster the transformation and upgrading of extensive industrial sectors (Dai et al., 2020). This approach aims to achieve a green extension of the industrial value chain, thereby enhancing urban IEE.
The results based on the Hurst index indicate that there is significant spatial heterogeneity in the future IEE of coastal cities. The central region exhibits a strong upward trend for future enhancement, exemplified by the Yangtze River Delta urban agglomeration centered on Shanghai. This trend may be attributed to the ease of product exports in this area, making it attractive to international investors, thereby expanding access to international markets, enhancing competitiveness, and subsequently improving IEE. This aligns with the findings of Li and Lin (2017). Another contributing factor could be the national ecological redline policies, which mandate strict compliance and the implementation of relevant management policies. The political pressure from the central government requires industrial enterprises to adopt more incentives to promote IEE (Yu et al., 2018). In contrast, the northern region is expected to face a downward trend in the future. As an established industrial base, this region struggles to achieve effective improvement in the short term in response to nationally established ecological management policies. Consequently, the northern region lacks momentum for sustained growth in IEE.
5.2 Optimization of countermeasure
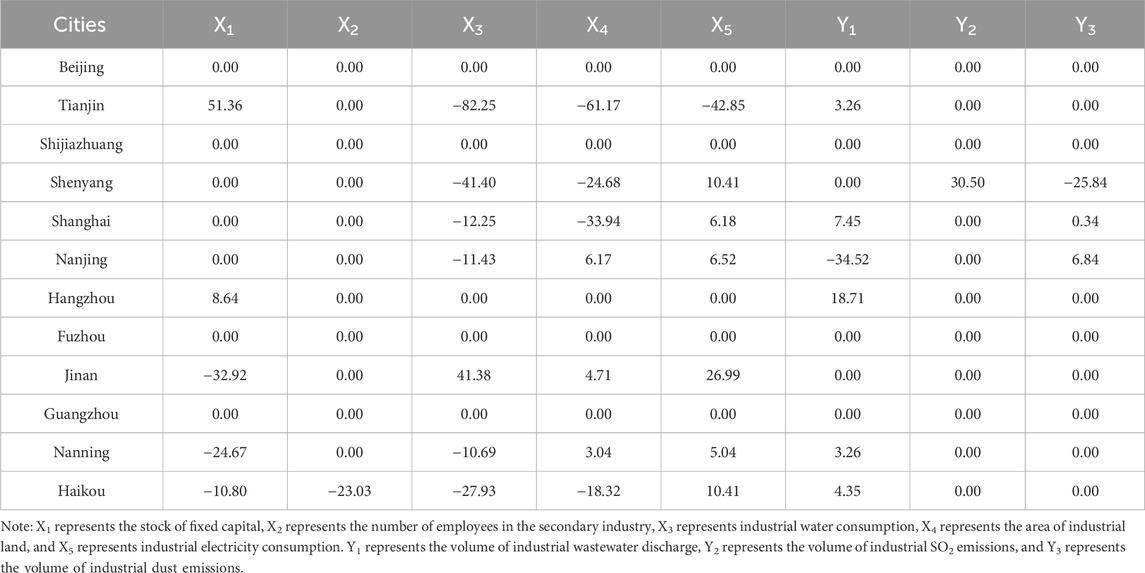
To assess the sources of industrial ecological inefficiency in China’s coastal areas, projection analysis was used to identify the development shortfalls and improvement paths for IEE (Table 5). It was found that inefficient regions generally exhibit redundancy in industrial resource inputs and industrial pollutant emissions. Specifically, industrial water and electricity consumption are the main redundant inputs, while industrial SO2 and dust emissions are the primary undesirable output redundancies. Additionally, some cities exhibit insufficient capital and labor inputs, with significant regional differences in the improvement margins of input-output indicators. To address the primary causes of industrial ecological inefficiency, enhancing the allocation of input-output resources and promoting the orderly flow of these factors are effective measures (Wang and Yang, 2019). This approach can help bridge the development gaps among regions. Firstly, to address the issue of insufficient capital and labor inputs in some cities, it is recommended to encourage investment from cities with relatively high capital redundancy rates to increase capital input and strengthen the industrial economic development momentum of those cities (Cao et al., 2022). Promoting labor transfer and sharing by allowing more highly skilled industrial workers to work in areas with labor shortages can improve regional labor productivity and drive industrial economic development. Secondly, existing industrial enterprises in various regions should be encouraged to gradually transition to new industries characterized by low energy consumption, high output, and low emissions, thereby reducing industrial resource inputs, particularly in terms of water and electricity consumption. Thirdly, efforts should continue to update outdated equipment in regions, which will help reduce industrial resource consumption and lower industrial pollutant emissions, thereby promoting the coordinated development of regional industrial economy and environment.
For regions with differing social, economic, and cultural conditions, differentiated efficiency improvement policies should be formulated to achieve rational development of the ecological economy (Zhang et al., 2024). First, the industrial pollutant emissions in most cities in Liaoning and Hebei provinces remain high. These cities are part of China’s old industrial base and have a large number of traditional manufacturing enterprises. However, significant challenges exist, such as unbalanced industrial structure and weak product upgrading capacity (Zhang L. et al., 2023). To address these issues, the government can encourage resource-sharing collaboration between cities, sharing resources, knowledge, and technology that support industrial ecological efficiency (Yang et al., 2023). For instance, inter-city industrial symbiosis programs could be established, where waste or by-products from one industry are used as raw materials for another, thus reducing waste and resource consumption. Highly polluting industries can also be encouraged to relocate to less environmentally sensitive areas, thereby reducing pollution burdens in densely populated urban areas and improving overall ecological efficiency. Second, cities in the Yangtze River Delta and Pearl River Delta regions have higher levels of economic development and urbanization but also relatively high industrial resource consumption. These cities must focus on promoting industrial upgrading and transformation, encouraging traditional manufacturing enterprises to adopt cleaner technologies and modernize production processes. Measures such as using environmentally friendly equipment, supporting automation, and promoting green manufacturing practices are recommended (Chen and Liu, 2022). Third, some southern cities have relatively low socio-economic development levels but significant potential for optimizing industrial energy and resource use. Given the financial constraints, the government can provide fiscal support or low-interest loans to help enterprises replace inefficient equipment and adopt smart energy management systems. The establishment of government-enterprise collaboration platforms to explore localized green development pathways is also encouraged. The government can provide timely technical support, policy consultation, and other resources to help enterprises improve environmental protection and resource utilization (Niu et al., 2024). Fourth, the innovation advantages of Beijing and Shanghai should be leveraged to drive the development of surrounding regions (Wang X. et al., 2024). Green investment and innovation should be promoted by offering subsidies, tax incentives, or low-interest loans to encourage enterprises to invest in green initiatives, such as renewable energy, waste recycling, and resource-efficient technologies.
5.3 Limitations and outlook
This study provides a comprehensive research framework for the evaluation, influencing mechanisms, and future trend prediction of IEE, along with an empirical analysis. However, we must acknowledge certain limitations of this study. Although the Hurst index can effectively predict the future trends of IEE, the inherent limitations of the data and models may restrict the comprehensiveness of the results. The length and overlapping nature of different time series may lead to varying calculation results, thereby affecting the accurate assessment of future trend predictions. Yang M. et al. (2024) found that when the Hurst index is relatively small, the prediction error tends to be large, whereas the error sharply decreases as the Hurst index increases. Moreover, while the Hurst index can provide insights into future developmental trends, it cannot predict how long these trends will persist (Tong et al., 2018). In the future, we plan to explore IEE trends further by comparing the differences among various models.
6 Conclusion
This study uses 115 cities in China’s coastal areas as spatial units to measure IEE based on an input-output model, explore influencing factors, and simulate future evolutionary trends. The results show that IEE is generally on the rise, with significant spatial pattern changes. Regions with rapid economic development and better environmental conditions tend to have higher levels of IEE. The “multi-core” development model began to emerge, with the Yangtze River Delta, Pearl River Delta, and Beijing-Tianjin-Hebei regions serving as strong radiating and driving forces. The econometric analysis reveals that per capita GDP, the proportion of industrial pollution control investment to GDP, innovation index, the proportion of foreign direct investment to GDP, and industrial labor productivity have a significantly positive impact on IEE. Conversely, the proportion of industrial added value to GDP, urbanization rate, and the number of industrial enterprises have a notably negative impact on IEE. From the analysis of factor interaction detection, the interaction effects between industrialization level factors and other factors are significantly stronger than those between other factors. Among these, the interaction between industrialization level and social development level has the most significant impact on IEE. In China’s coastal areas, 48.70% of cities have IEE in a state of improvement and sustained DEA effectiveness. The overall Hurst value is 0.9807, and 75.65% of cities have Hurst values below the overall level, indicating that future changes in IEE have relatively weak sustainability. Overall, the future trend for IEE in China’s coastal areas is expected to continue improving. This study can help policymakers formulate reasonable and appropriate resource and environmental policies, promoting the sustainable and coordinated development of regional industrial structures and ecological environments.
Data availability statement
The original contributions presented in the study are included in the article/Supplementary Material, further inquiries can be directed to the corresponding author.
Author contributions
YS: Formal Analysis, Methodology, Visualization, Writing–original draft, Writing–review and editing. TZ: Investigation, Methodology, Validation, Writing–original draft, Writing–review and editing. BZ: Funding acquisition, Supervision, Writing–original draft. LY: Data curation, Writing–original draft. JW: Supervision, Validation, Writing–review and editing.
Funding
The author(s) declare that financial support was received for the research, authorship, and/or publication of this article. This research was supported by the National Natural Science Foundation of China (42201308), Shandong Provincial Natural Science Foundation, China (ZR2021ME203 and ZR2021QD127), Shandong Province Undergraduate Teaching Reform Project (Z20220004), Jinan City-School Integration Project (JNSX2023036), Shandong Philosophy and Social Sciences Youth Talent Team (2024-QNRC-02).
Acknowledgments
The authors would like to gratefully acknowledge the reviewers and the members of the editorial team who helped to improve this paper through their thorough review.
Conflict of interest
The authors declare that the research was conducted in the absence of any commercial or financial relationships that could be construed as a potential conflict of interest.
Generative AI statement
The author(s) declare that no Generative AI was used in the creation of this manuscript.
Publisher’s note
All claims expressed in this article are solely those of the authors and do not necessarily represent those of their affiliated organizations, or those of the publisher, the editors and the reviewers. Any product that may be evaluated in this article, or claim that may be made by its manufacturer, is not guaranteed or endorsed by the publisher.
Supplementary material
The Supplementary Material for this article can be found online at: https://www.frontiersin.org/articles/10.3389/fenvs.2024.1504751/full#supplementary-material
References
Ahmed, Z., Asghar, M. M., Malik, M. N., and Nawaz, K. (2020). Moving towards a sustainable environment: the dynamic linkage between natural resources, human capital, urbanization, economic growth, and ecological footprint in China. Resour. Policy 67, 101677. doi:10.1016/j.resourpol.2020.101677
Azadeh, A., Amalnick, M., Ghaderi, S., and Asadzadeh, S. (2007). An integrated DEA PCA numerical taxonomy approach for energy efficiency assessment and consumption optimization in energy intensive manufacturing sectors. Energy policy 35 (7), 3792–3806. doi:10.1016/j.enpol.2007.01.018
Bian, J., Ren, H., and Liu, P. (2020). Evaluation of urban ecological well-being performance in China: a case study of 30 provincial capital cities. J. Clean. Prod. 254, 120109. doi:10.1016/j.jclepro.2020.120109
Cao, G., Yang, L., Liu, L., Ma, Z., Wang, J., and Bi, J. (2018). Environmental incidents in China: lessons from 2006 to 2015. Sci. total Environ. 633, 1165–1172. doi:10.1016/j.scitotenv.2018.03.271
Cao, Y. N., Wu, T., Kong, L. Q., Wang, X. Z., Zhang, L. F., and Ouyang, Z. Y. (2022). The drivers and spatial distribution of economic efficiency in China's cities. J. Geogr. Sci. 32 (8), 1427–1450. doi:10.1007/s11442-022-2004-7
Caves, R. E. (1981). Diversification and seller concentration: evidence from changes, 1963-72. Rev. Econ. statistics 63, 289–293. doi:10.2307/1924100
Chen, C., Sun, Y., Lan, Q., and Jiang, F. (2020). Impacts of industrial agglomeration on pollution and ecological efficiency-A spatial econometric analysis based on a big panel dataset of China’s 259 cities. J. Clean. Prod. 258, 120721. doi:10.1016/j.jclepro.2020.120721
Chen, L., and Jia, G. (2017). Environmental efficiency analysis of China's regional industry: a data envelopment analysis (DEA) based approach. J. Clean. Prod. 142, 846–853. doi:10.1016/j.jclepro.2016.01.045
Chen, Y., and Liu, L. (2022). Improving eco-efficiency in coal mining area for sustainability development: an emergy and super-efficiency SBM-DEA with undesirable output. J. Clean. Prod. 339, 130701. doi:10.1016/j.jclepro.2022.130701
Chen, Z., Wang, J.-N., Ma, G.-X., and Zhang, Y.-S. (2013). China tackles the health effects of air pollution. lancet 382 (9909), 1959–1960. doi:10.1016/s0140-6736(13)62064-4
Chung, Y. H., Färe, R., and Grosskopf, S. (1997). Productivity and undesirable outputs: a directional distance function approach. J. Environ. Manag. 51 (3), 229–240. doi:10.1006/jema.1997.0146
Dai, B., Gu, X., and Xie, B. (2020). Policy framework and mechanism of life cycle management of industrial land (LCMIL) in China. Land Use Policy 99, 104997. doi:10.1016/j.landusepol.2020.104997
Färe, R., and Grosskopf, S. (2010). Directional distance functions and slacks-based measures of efficiency. Eur. J. Operational Res. 200 (1), 320–322. doi:10.1016/j.ejor.2009.01.031
Fotheringham, A. S., Brunsdon, C., and Charlton, M. (2000). Quantitative geography: perspectives on spatial data analysis. London, UK: Sage.
Gehrsitz, M. (2017). The effect of low emission zones on air pollution and infant health. J. Environ. Econ. Manag. 83, 121–144. doi:10.1016/j.jeem.2017.02.003
Granero, M. S., Segovia, J. T., and Pérez, J. G. (2008). Some comments on Hurst exponent and the long memory processes on capital markets. Phys. A Stat. Mech. its Appl. 387 (22), 5543–5551. doi:10.1016/j.physa.2008.05.053
Hurst, H. E. (1951). Long-term storage capacity of reservoirs. Trans. Am. Soc. Civ. Eng. 116 (1), 770–799. doi:10.1061/taceat.0006518
Kaye, J. P., Groffman, P. M., Grimm, N. B., Baker, L. A., and Pouyat, R. V. (2006). A distinct urban biogeochemistry? Trends Ecol. and Evol. 21 (4), 192–199. doi:10.1016/j.tree.2005.12.006
Lei, Y., Xiao, Y., Wang, F., Wang, R., and Huang, H. (2024). Investigation on the complex relationship between urbanization and eco-efficiency in urban agglomeration of China: the case study of Chengdu-Chongqing urban agglomeration. Ecol. Indic. 159, 111704. doi:10.1016/j.ecolind.2024.111704
Leontief, W. W. (1936). Quantitative input and output relations in the economic systems of the United States. Rev. Econ. statistics 18, 105–125. doi:10.2307/1927837
Li, J., and Lin, B. (2017). Does energy and CO2 emissions performance of China benefit from regional integration? Energy policy 101, 366–378. doi:10.1016/j.enpol.2016.10.036
Lin, B., and Wang, M. (2021). The role of socio-economic factors in China's CO2 emissions from production activities. Sustain. Prod. Consum. 27, 217–227. doi:10.1016/j.spc.2020.10.029
Liu, Y., Qu, Y., Cang, Y., and Ding, X. (2022). Ecological security assessment for megacities in the Yangtze River basin: applying improved emergy-ecological footprint and DEA-SBM model. Ecol. Indic. 134, 108481. doi:10.1016/j.ecolind.2021.108481
Liu, Y., Zhu, J., Li, E. Y., Meng, Z., and Song, Y. (2020a). Environmental regulation, green technological innovation, and eco-efficiency: the case of Yangtze river economic belt in China. Technol. Forecast. Soc. Change 155, 119993. doi:10.1016/j.techfore.2020.119993
Liu, Z., Zhang, H., Zhang, Y.-J., and Zhu, T.-T. (2020b). How does industrial policy affect the eco-efficiency of industrial sector? Evidence from China. Appl. Energy 272, 115206. doi:10.1016/j.apenergy.2020.115206
Mandal, S. K. (2010). Do undesirable output and environmental regulation matter in energy efficiency analysis? Evidence from Indian cement industry. Energy policy 38 (10), 6076–6083. doi:10.1016/j.enpol.2010.05.063
Matsumoto, K. I., and Chen, Y. (2021). Industrial eco-efficiency and its determinants in China: a two-stage approach. Ecol. Indic. 130, 108072. doi:10.1016/j.ecolind.2021.108072
Maxime, D., Marcotte, M., and Arcand, Y. (2006). Development of eco-efficiency indicators for the Canadian food and beverage industry. J. Clean. Prod. 14 (6-7), 636–648. doi:10.1016/j.jclepro.2005.07.015
Meng, Y., Wang, M., Xu, W., Guan, X., and Yan, D. (2022). Structure construction, evolution analysis and sustainability evaluation of Water-Ecological-Economic system. Sustain. Cities Soc. 83, 103966. doi:10.1016/j.scs.2022.103966
Moutinho, V., Madaleno, M., Robaina, M., and Villar, J. (2018). Advanced scoring method of eco-efficiency in European cities. Environ. Sci. Pollut. Res. 25, 1637–1654. doi:10.1007/s11356-017-0540-y
Mukherjee, K. (2010). Measuring energy efficiency in the context of an emerging economy: the case of Indian manufacturing. Eur. J. Operational Res. 201 (3), 933–941. doi:10.1016/j.ejor.2009.04.012
Niu, Z., Yan, C., and Tan, F. (2024). Green innovation and eco-efficiency: interaction between society and environment of sustainable development demonstration belt in China. Environ. Technol. and Innovation 34, 103620. doi:10.1016/j.eti.2024.103620
Ohene-Asare, K., Tetteh, E. N., and Asuah, E. L. (2020). Total factor energy efficiency and economic development in Africa. Energy Effic. 13 (6), 1177–1194. doi:10.1007/s12053-020-09877-1
Pravdić, V. (1995). The chemical industry in the Croatian Adriatic region: identification of environmental problems, assessment of pollution risks, and the new policies of sustainability. Sci. total Environ. 171 (1-3), 265–274. doi:10.1016/0048-9697(95)04694-8
Ren, W., Zhong, Y., Meligrana, J., Anderson, B., Watt, W. E., Chen, J., et al. (2003). Urbanization, land use, and water quality in Shanghai: 1947–1996. Environ. Int. 29 (5), 649–659. doi:10.1016/s0160-4120(03)00051-5
Rigina, O. (2002). Environmental impact assessment of the mining and concentration activities in the Kola Peninsula, Russia by multidate remote sensing. Environ. Monit. Assess. 75, 11–31. doi:10.1023/a:1014248522919
Ruan, F., Yan, L., and Wang, D. (2020). The complexity for the resource-based cities in China on creating sustainable development. Cities 97, 102571. doi:10.1016/j.cities.2019.102571
Schaltegger, S., and Sturm, A. (1990). Ökologische rationalität: ansatzpunkte zur ausgestaltung von ökologieorientierten managementinstrumenten. Unternehm., 273–290.
Schmidheiny, S., and Stigson, B. (2000). Eco-efficiency: creating more value with less impact. Geneva, Switzerland: World Business Council for Sustainable Development.
Shen, J., Cui, L., Wei, Y. D., and Wang, S. (2024). Domesticating sustainability transitions: spatial and temporal variation of industrial eco-efficiency in China. Appl. Geogr. 173, 103452. doi:10.1016/j.apgeog.2024.103452
Shuai, S., and Fan, Z. (2020). Modeling the role of environmental regulations in regional green economy efficiency of China: empirical evidence from super efficiency DEA-Tobit model. J. Environ. Manag. 261, 110227. doi:10.1016/j.jenvman.2020.110227
Tao, S., Peng, W., and Xiang, J. (2022). Spatiotemporal variations and driving mechanisms of vegetation coverage in the Wufeng Mountainous Area, China. Ecol. Inf. 70, 101737. doi:10.1016/j.ecoinf.2022.101737
Tobin, J. (1958). Estimation of relationships for limited dependent variables. Econ. J. Econ. Soc. 26, 24–36. doi:10.2307/1907382
Tong, S., Lai, Q., Zhang, J., Bao, Y., Lusi, A., Ma, Q., et al. (2018). Spatiotemporal drought variability on the Mongolian Plateau from 1980–2014 based on the SPEI-PM, intensity analysis and Hurst exponent. Sci. total Environ. 615, 1557–1565. doi:10.1016/j.scitotenv.2017.09.121
Vaninsky, A. (2018). Energy-environmental efficiency and optimal restructuring of the global economy. Energy 153, 338–348. doi:10.1016/j.energy.2018.03.063
Verhoef, E. T., and Nijkamp, P. (2002). Externalities in urban sustainability: environmental versus localization-type agglomeration externalities in a general spatial equilibrium model of a single-sector monocentric industrial city. Ecol. Econ. 40 (2), 157–179. doi:10.1016/s0921-8009(01)00253-1
Wang, C., Wang, F., Zhang, X., Yang, Y., Su, Y., Ye, Y., et al. (2017). Examining the driving factors of energy related carbon emissions using the extended STIRPAT model based on IPAT identity in Xinjiang. Renew. Sustain. Energy Rev. 67, 51–61. doi:10.1016/j.rser.2016.09.006
Wang, F., Wu, M., and Du, X. Y. (2023a). Does industrial upgrading improve eco-efficiency? Evidence from China's industrial sector. Energy Econ. 124, 106774. doi:10.1016/j.eneco.2023.106774
Wang, H., and Yang, J. (2019). Total-factor industrial eco-efficiency and its influencing factors in China: a spatial panel data approach. J. Clean. Prod. 227, 263–271. doi:10.1016/j.jclepro.2019.04.119
Wang, J. F., Li, X. H., Christakos, G., Liao, Y. L., Zhang, T., Gu, X., et al. (2010). Geographical detectors-based health risk assessment and its application in the neural tube defects study of the Hsun Region, China. Int. J. Geogr. Inf. Sci. 24 (1), 107–127. doi:10.1080/13658810802443457
Wang, Q., Yang, T., and Li, R. (2023b). Economic complexity and ecological footprint: the role of energy structure, industrial structure, and labor force. J. Clean. Prod. 412, 137389. doi:10.1016/j.jclepro.2023.137389
Wang, Q., and Yuan, B. (2018). Air pollution control intensity and ecological total-factor energy efficiency: the moderating effect of ownership structure. J. Clean. Prod. 186, 373–387. doi:10.1016/j.jclepro.2018.03.106
Wang, X., Ding, H., and Liu, L. (2019). Eco-efficiency measurement of industrial sectors in China: a hybrid super-efficiency DEA analysis. J. Clean. Prod. 229, 53–64. doi:10.1016/j.jclepro.2019.05.014
Wang, X., Nan, T., Liu, F., and Xiao, Y. (2024a). Analysis of the spatiotemporal evolution characteristics and policy factors of eco-innovation efficiency in Chinese urban agglomerations. Ecol. Indic. 163, 112106. doi:10.1016/j.ecolind.2024.112106
Wang, Y., Wang, W., Chen, Y., and Wu, L. (2024b). Projection of ecological water consumption under carbon emission in Chinese provinces. J. Clean. Prod. 448, 141630. doi:10.1016/j.jclepro.2024.141630
Wu, Q., Zhang, X., Shang, Z., and Li, Z. (2015). Political-economy based institutional industry complex and sustainable development: the case of the salt-chemical industry in Huai’an, China. Energy policy 87, 39–47. doi:10.1016/j.enpol.2015.08.042
Wu, Y. (2015). Energy efficiency estimation based on Bayesian method and industrial economic transition: taking Shandong as an example. Int. Bus. Res. 8 (10), 35. doi:10.5539/ibr.v8n10p35
Xiao, L.-M., and Zhang, X.-P. (2019). Spatio-temporal characteristics of coupling coordination between green innovation efficiency and ecological welfare performance under the concept of strong sustainability. J. Nat. Resour. 34 (2), 312–324. doi:10.31497/zrzyxb.20190208
Xie, Z., and Yan, J. (2008). Kernel density estimation of traffic accidents in a network space. Comput. Environ. urban Syst. 32 (5), 396–406. doi:10.1016/j.compenvurbsys.2008.05.001
Xing, Z., Wang, J., and Zhang, J. (2018). Expansion of environmental impact assessment for eco-efficiency evaluation of China's economic sectors: an economic input-output based frontier approach. Sci. Total Environ. 635, 284–293. doi:10.1016/j.scitotenv.2018.04.076
Yang, L., Chen, S., Chiu, Y.-H., Chang, T.-H., and Wang, Y. (2024a). Reassessment of industrial eco-efficiency in China under the sustainable development goals: a meta two-stage parallel entropy dynamic DDF-DEA model. J. Clean. Prod. 447, 141275. doi:10.1016/j.jclepro.2024.141275
Yang, M., Wang, R., Zeng, Z., and Li, P. (2024b). Improved prediction of global gold prices: an innovative Hurst-reconfiguration-based machine learning approach. Resour. Policy 88, 104430. doi:10.1016/j.resourpol.2023.104430
Yang, Y., Chen, W., and Gu, R. (2023). How does digital infrastructure affect industrial eco-efficiency? Considering the threshold effect of regional collaborative innovation. J. Clean. Prod. 427, 139248. doi:10.1016/j.jclepro.2023.139248
Yu, Y., Huang, J., and Zhang, N. (2018). Industrial eco-efficiency, regional disparity, and spatial convergence of China's regions. J. Clean. Prod. 204, 872–887. doi:10.1016/j.jclepro.2018.09.054
Zhang, J., Liu, Y., Chang, Y., and Zhang, L. (2017). Industrial eco-efficiency in China: a provincial quantification using three-stage data envelopment analysis. J. Clean. Prod. 143, 238–249. doi:10.1016/j.jclepro.2016.12.123
Zhang, L., Li, G., Ding, D., Qiao, L., Wang, J., Li, M., et al. (2023a). Coastline eco-efficiency and sustainable development of Bohai Rim cities. Ocean and Coast. Manag. 243, 106769. doi:10.1016/j.ocecoaman.2023.106769
Zhang, T., Sun, Y., Zhang, X., Yin, L., and Zhang, B. (2023b). Potential heterogeneity of urban ecological resilience and urbanization in multiple urban agglomerations from a landscape perspective. J. Environ. Manag. 342, 118129. doi:10.1016/j.jenvman.2023.118129
Zhang, T., Sun, Y. X., Wang, R., Yang, Y., Yin, L., Li, L. G., et al. (2024). A new framework for assessing and dealing with heat risk from an urban resilience perspective. J. Clean. Prod. 479, 144008. doi:10.1016/j.jclepro.2024.144008
Zhang, X., and Zhao, Y. (2018). Identification of the driving factors’ influences on regional energy-related carbon emissions in China based on geographical detector method. Environ. Sci. Pollut. Res. 25, 9626–9635. doi:10.1007/s11356-018-1237-6
Zhang, Y., Shen, L., Shuai, C., Bian, J., Zhu, M., Tan, Y., et al. (2019). How is the environmental efficiency in the process of dramatic economic development in the Chinese cities? Ecol. Indic. 98, 349–362. doi:10.1016/j.ecolind.2018.11.006
Zheng, H., Wu, Y., He, H., Delang, C. O., Lu, J., Yao, Z., et al. (2024). Urbanization and urban energy eco-efficiency: a meta-frontier super EBM analysis based on 271 cities of China. Sustain. Cities Soc. 101, 105089. doi:10.1016/j.scs.2023.105089
Zheng, J. L., and Peng, X. T. (2019). Does an ecological industry chain improve the eco-efficiency of an industrial cluster? Based on empirical study of an energy-intensive industrial cluster in China. Sustainability 11 (6), 1651. doi:10.3390/su11061651
Zhou, P., Ang, B., and Han, J. (2010). Total factor carbon emission performance: a Malmquist index analysis. Energy Econ. 32 (1), 194–201. doi:10.1016/j.eneco.2009.10.003
Keywords: industrial eco-efficiency, resource consumption, environmental pollution, simulation forecast, China’s coastal areas
Citation: Sun Y, Zhang T, Zhang B, Yin L and Wang J (2024) Exploring the potential mechanisms and future trends of industrial eco-efficiency: a case study of coastal China. Front. Environ. Sci. 12:1504751. doi: 10.3389/fenvs.2024.1504751
Received: 02 October 2024; Accepted: 25 November 2024;
Published: 10 December 2024.
Edited by:
Rangaswamy Mohanraj, Bharathidasan University, IndiaReviewed by:
Yi-Che Shih, National Cheng Kung University, TaiwanHe Huang, Tsinghua University, China
Copyright © 2024 Sun, Zhang, Zhang, Yin and Wang. This is an open-access article distributed under the terms of the Creative Commons Attribution License (CC BY). The use, distribution or reproduction in other forums is permitted, provided the original author(s) and the copyright owner(s) are credited and that the original publication in this journal is cited, in accordance with accepted academic practice. No use, distribution or reproduction is permitted which does not comply with these terms.
*Correspondence: Teng Zhang, dGVuZ3o3NzdAMTYzLmNvbQ==
 Yixuan Sun
 Teng Zhang2*
 Jingjing Wang