- 1College of Geography Science, Hebei Normal University, Shijiazhuang, China
- 2Hebei Laboratory of Environmental Evolution and Ecological Construction, Shijiazhuang, China
- 3Hebei Technology Innovation Center for Geographic Information Application, Institute of Geographical Sciences, Hebei Academy of Sciences, Shijiazhuang, China
- 4School of Resources and Environment, College of Carbon Neutrality, Linyi University, Linyi, China
- 5Key Laboratory for Agricultural Water Resources, Hebei Key Laboratory for Agricultural Water Saving, Center for Agricultural Resources Research, Institute of Genetics and Developmental Biology, Chinese Academy of Sciences, Shijiazhuang, China
Climate change is expected to increase the frequency and severity of climate extremes, which will negatively impact crop production. As one of the main food and feed crops, maize is also vulnerable to extreme climate events. In order to accurately and comprehensively assess the future climate risk to maize, it is urgent to project and evaluate the stress of extreme climate related maize production under future climate scenarios. In this study, we comprehensively evaluated the spatio-temporal changes in the frequency and intensity of six extreme climate indices (ECIs) across China’s maize harvest region by using a multi-model ensemble method, and examined the capability of the Coupled Model Intercomparison Project Phase 6 (CMIP6) to capture these variations. We found that the Independence Weight Mean (IWM) ensemble results calculated by multiple Global Climate Models (GCMs) with bias correction could better reproduce each ECI. The results indicated that heat stress for maize showed consistent increase trends under four future climate scenarios in the 21st century. The intensity and frequency of the three extreme temperature indices in 2080s were significantly higher than these in 2040s, and in the high emission scenario were significantly higher than these in the low emission scenario. The three extreme precipitation indices changed slightly in the future, but the spatial changes were more significant. Therefore, with the uncertainty of climate change and the differences of climate characteristics in different regions, the optimization of specific management measures should be considered in combination with the specific conditions of future local climate change.
1 Introduction
As the population grows, so does the demand for food that mainly from crop production (Xia and Yan, 2023; Hatfield and Dold, 2018). Since crop growth and development are highly impacted by the climate conditions during the growing season (Rizzo et al., 2022; Xiao et al., 2021), climate variability and change pose considerable threats and challenges to global food security under the background of global warming (Pörtner et al., 2022; Wang et al., 2020; Lobell et al., 2011). Generally, extreme climate is more likely to affect crop production than seasonal mean climate changes over the same period (Fu et al., 2023; Zhang et al., 2018; Jin et al., 2017). Climate warming is expected to lead to more frequent climate extremes (Lesk et al., 2022; Zhu and Troy, 2018), and have serious negative impacts on the physiological process and behavior of crops, ultimately reducing crop yields (Shi et al., 2021; Lesk et al., 2016). Heat stress triggered by supra-optimal temperatures can lead to physiological damage and ultimately cause yield loss (Asseng et al., 2015; Lobell et al., 2013). Similarly, drought caused by low precipitation had adverse effects on crop transpiration and photosynthesis processes (Li F. et al., 2022; Liu et al., 2022). In addition, long-term waterlogging caused by excessive precipitation can damage crop growth (Wang et al., 2023; Li et al., 2019). Therefore, given that extreme climate events can lead to severe agricultural disasters, understanding trends in the frequency and intensity of agroclimatic extreme events is critical to ensuring food security in a warming climate environment (Zhang et al., 2023; Xiao et al., 2022; Bai et al., 2022).
The climate-related risks to crop production primarily depend on the degree of exposure to various extreme climate events occurring at different spatio-temporal scales (Bradshaw et al., 2022; Zhang et al., 2021). Based on the response of special crops to various climate factors (e.g., temperature, precipitation, radiation, wind, etc.), a series of targeted indices have been developed to investigate how climate affects crop growth and production (Bai et al., 2021). Generally, temperature and precipitation are the main climate factors affecting crop growth and development, and are also two primary variables used in the development of climate indices (Zhao et al., 2022). Overall, the exposure of crop growth processes to extreme climate events and the future change can be systematically quantified by using corresponding climate indices (Li et al., 2018). However, previous studies have mainly considered changes in extreme climate indices (ECIs) in a specific period of time, and often neglected the specific growth period of crops. As different growth periods of crops have different responses to different extreme climates, the definition and analysis of ECIs combined with crop phenology and development stage can more accurately reflect the extreme climate stress faced by crops (Xiao et al., 2022). Thus, it is necessary to explore the stress intensity of extreme climate events that crops are prone to during specific growth period under the background of climate warming.
Due to the easy availability of historical climate records and crop observations, most studies mainly focused on the impact of extreme climate events on crop production over the past few decades (Li et al., 2018; Butler and Huybers, 2015; Zhang et al., 2014). As the global climate continues to warm, the occurrence of extreme climate will become more frequent and the threat will become more serious in the future (Zampieri et al., 2019). Understanding and projecting temporal and spatial changes in extreme climate events under future climate scenarios are essential to cope with future climate risks and formulate corresponding strategies (Mangani et al., 2018). Recently, the probability of occurrence of extreme climate events for future climate scenarios can be projected by Global Climate Models (GCMs), which is provided by the World Climate Research Program (WCRP) of Coupled Model Inter-comparison Project phase 6 (CMIP6) (Zampieri et al., 2019). CMIP6 integrated the information from simulations of the Representative Concentration Pathway (RCP) in CMIP5 and future Societal Development Pathways, and could better project climate change in the future (O’Neill et al., 2016). Therefore, studies are need to projected extreme climate risks for crops by combining well-defined ECIs with the latest GCM data from CMIP6.
Maize (Zea may L.) is not only an important source of food and feed, but also an important source of fuel, playing a pivotal role in agriculture and national economy (Luo et al., 2023). However, world’s maize supply over the past decades was under stress due to growing food demand and industrial consumption (Villoria and Chen, 2018). In China, maize is one of the most important crops with the largest sown area and highest yield (Wu et al., 2021; Xiao and Tao, 2016). the sowing area of maize is stable above 4.3 × 10⁷ ha all year round and yield is more than 2.5 × 10¹¹ kg. Related studies have investigated the threat of changing climate to maize yield. In northeast China, maize yield will decrease by 311.48 kg/hm2 with every 1 day increase in the summer extreme low temperature index. Xiao and Tao (2016) revealed that the changing trend of climate variables reduced maize yield by 15%–30% in North China (Xiao and Tao, 2016). Generally, maize is grown during summer season, when extreme heat and extreme precipitation events are most likely to occur (Li et al., 2021). A large number of abnormal climatic events have been observed during the growing season of maize in China (Dong et al., 2021; Cicchino et al., 2010). In order to alleviate the pressure of extreme climate events on maize production, it is necessary to explore the potential exposure of maize to extreme climate stress in the future. Currently, more and more studies focus on the effects of climate extremes on maize growth and development (dos Santos et al., 2022; Li Z. et al., 2022; Zhang et al., 2020; Tingem et al., 2008).
In this study, according to the extreme climate disasters that relate to maize growth and development, we defined six ECIs that are closely related to maize yield, and assessed the spatiotemporal characteristics of selected ECIs in historical (1981–2010) and future periods (2031–2100) based on historical climate data and future climate data from 18 GCMs provided by CMIP6. The main objectives were to (1) access the ability of individual GCM and the multi-model ensemble result to reproduce extreme climate events across the major maize producing areas in China, and (2) project the possible trends of extreme climate events under future climate scenarios.
2 Materials and methods
2.1 Study area
The study areas across mainland China have diverse climate environments and complex crop planting structures (Xie et al., 2023). According to the cropping system and growth environment, the whole study area was divided into four maize planting subregions, namely, Zone I, Zone II, Zone III and Zone IV (Figure 1). Moreover, according to the different sowing time, it is divided into spring maize and summer maize. Overall, Zone I, Zone III and Zone IV are spring maize planting areas, and Zone II is summer maize planting areas (Luo et al., 2020).
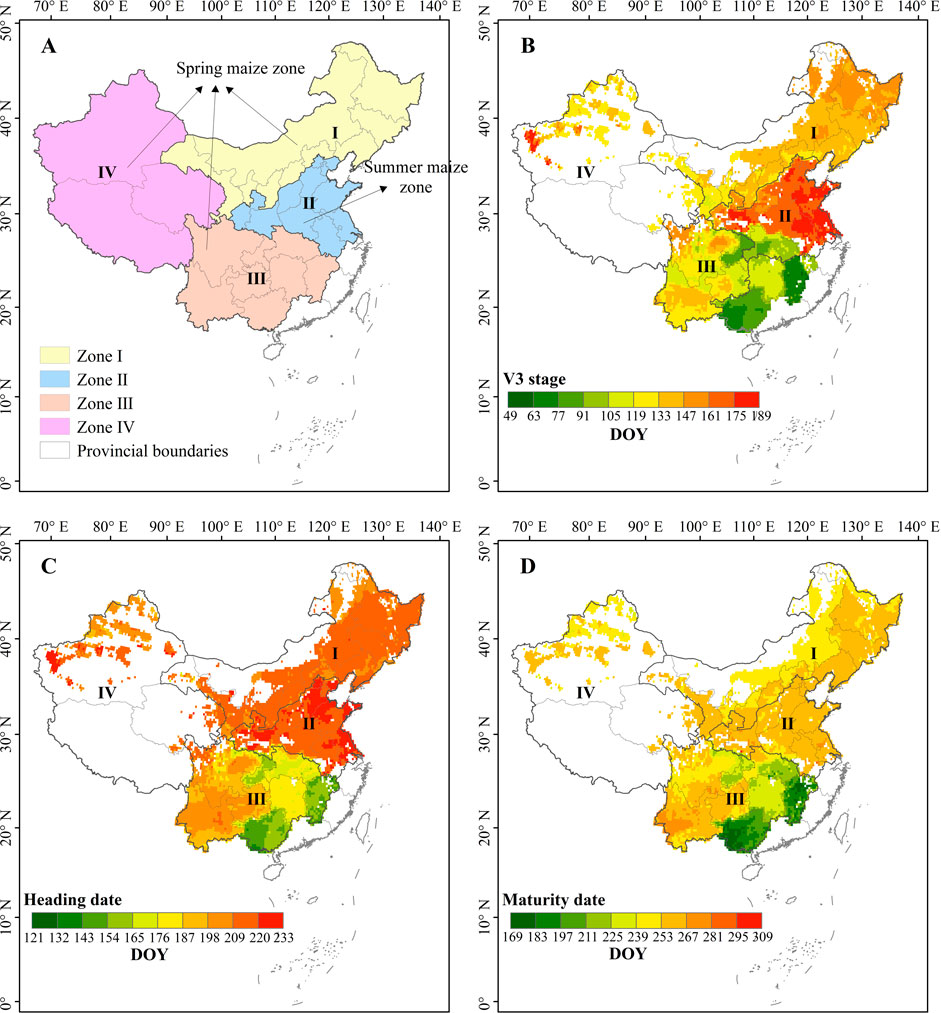
Figure 1. Four zones in the maize growing area of China (A) and three phenological stages for maize (B–D). Zone Ⅰ, Zone Ⅲ and Zone Ⅳ represent the spring maize zone, and Zone Ⅱ represents the summer maize zone in Figure (A). Figure (B–D) show the phenological days of maize V3 stage, heading and maturity, green and red indicate the early and late days of the corresponding phenological days of year, respectively.
2.2 CMIP6 data and reanalysis data
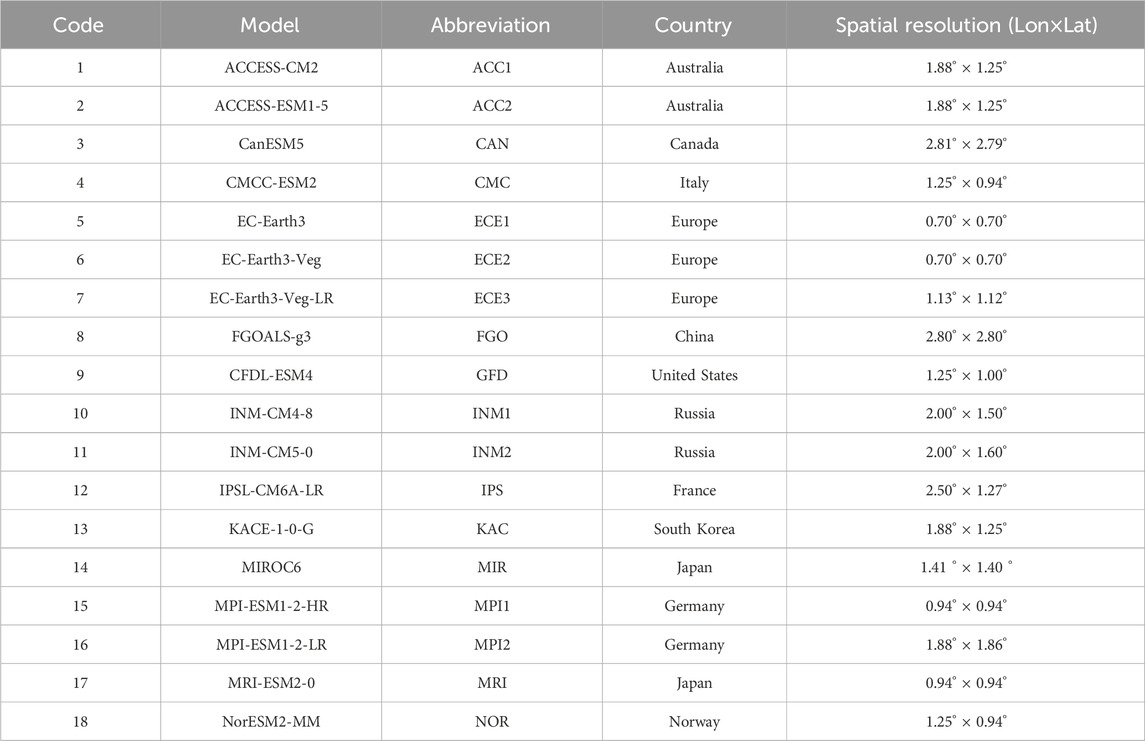
Based on the availability and completeness of the future climate data, we selected 18 GCMs from the Coupled Model Inter-comparison Project phase 6 (CMIP6; Table 1). The detailed descripition of CMIP6 can be found at the website https://aims2.llnl.gov/search/cmip6/. Each GCM includes historical climate simulation and future climate projections, which mainly included daily maximum, minimum and average temperature, and daily precipitation. The historical climate data selected in this study is Historical version, and the time span is 1981–2014. Considering the representativeness of future climate scenarios and the completeness of data under corresponding future climate scenarios, we selected four typical scenarios, including Shared Socioeconomic Pathway (SSP) 126, SSP245, SSP370 and SSP585, with a time span from 2015 to 2100. In detail, SSP126 is the updated RCP2.6 with a stable radiative forcing of 2.6 W m−2 in 2100, and SSP245 is the updated RCP4.5, which is the medium forcing scenario, and the radiation intensity is stable at 4.5 W m−2 in 2100. For SSP370, the radiation intensity is forced to stabilize at 7.0 W m−2 in 2100. And SSP585 is the updated RCP8.5, which indicates a high forcing scenario of 8.5 W m−2 in 2100 (Eyring et al., 2016; Meinshausen et al., 2011). Due to differences in spatial resolution of each GCM, the method of Double Line Interpolation Method (DLIM) was adopted to interpolate data of each GCM into a grid of 0.25° × 0.25° (Shi et al., 2014).
To assess the ability of each GCM to project extreme climate events in maize producing areas of China over historical periods, the reanalysis datasets of ECMWF Reanalysis v5 (ERA5) (https://cds.climate.copernicus.eu/), including daily minimum and maximum temperature data, daily average temperature and daily precipitation were selected as observations. ERA5 is the latest reanalysis data set of the European Centre for Medium-Range Weather Forecasts (ECMWF) with a spatial resolution of 0.25° × 0.25° and a temporal resolution of 1 h.
2.3 Maize phenology data
Maize phenology data were obtained from the ChinaCropPhen1km dataset (https://figshare.com/), which was a 1 km grid crop phenology dataset of China from 2000 to 2015 established based on Leaf Area Indices (LAI) products from Global Land Surface Satellite (GLASS) (Luo et al., 2020). Compared to the phenological records from the agricultural meteorological stations of the China Meteorological Administration (CMA), the data set had a high precision and the error is less than 10 days (Luo et al., 2020). In order to characterize the influence of extreme climate events in special maize growth stages, three key phenological periods, including early vegetative stage of maize when the third leaf is fully expanded (i.e., V3 stage), heading and maturity dates for both spring maize and summer maize, were selected in this study. The multi-year average dates of three phenological stages from 2000 to 2014 were calculated, with a spatial resolution of 1 km. Then, the average phenological dates in the 0.25° × 0.25° grid was calculated to obtain the maize phenology data used in this study (Figures 1B–D).
2.4 Extreme climate indices (ECIs)
The most common extreme climate disasters suffered by maize are mainly high temperature stress, drought and heavy precipitation (Shi et al., 2021). Related studies have pointed to high temperatures (Tmax greater than 34 C) as the main hazard of maize in the heading and flowering stages, and grain filling period [i.e., reproductive growth period from heading to maturity (RGP)] (Huo et al., 2023). In this study, we defined RGP as the period from 10 days before maize heading to 30 days after the heading to facilitate the calculation of extreme high temperature indices of this stage. To comprehensively assess the occurrence of high temperature stress, three extreme high temperature indices [i.e., hot days (HD), heat stress intensity (HSI) and consecutive hot days (HCD)] during maize RGP (Table 2) were developed. Moreover, in order to comprehensively assess the occurrence and frequency of extreme precipitation (e.g., heavy precipitation, continuous precipitation and drought) during the growth period from V3 stage to maturity of maize, we defined three extreme precipitation indices (i.e., heavy precipitation days (R20), consecutive wet days (CWD) and consecutive dry days (CDD) recommended by the CCI/WCRP/JCOMM Expert Team on Climate Change Detection and Indices (ETCCDI) (Xiao et al., 2022). Details of the above six ECIs are shown in Table 2.
2.5 Bias correction
Future climate projections from GCMs often show systematic bias (Hiruta et al., 2022). We used the Delta Change Method (DCM) to conduct bias correction (Beyer et al., 2020), and the base period of bias correction was 1981–2010. The formulas for DCM are as follows Equations 1, 2:
where
2.6 Multi-model ensemble methods
The Earth’s climate system is complex, so it is often impossible for an individual GCM to adequately describe all the physical processes of climate change. To reduce uncertainty, the average or combined results of multiple GCMs are used in climate projections (Tebaldi and Knutti, 2007). Bishop and Abramowitz (2013) proposed Independence Weighted Mean method (IWM) that defined inter-model dependencies using the covariance of model errors (Bishop and Abramowitz, 2013). In this study, we used IWM to aggregate the results of ECIs under multiple GCMs. Overall, the aim of IWM is to minimize Equation 3:
where
The solution of Equation 4 can be expressed as Equation 5:
where
Using the ECIs associated with maize production under a multi-GCM integrated with IWM, this study focused on assessing the spatio-temporal changes of extreme climate stress in three different 30-year periods, with the base period from 1981 to 2010, the 2040 s from 2031 to 2060, and the 2080s from 2071 to 2100.
2.7 Data evaluation method
We selected Taylor Diagram (TD) to visually compare the differences between model projections and observed data (Taylor, 2001). Typically, TD can provide the standard deviation (STD), correlation coefficient (CC) and root mean square error (RMSE) between projected and observed values. In detail, the radian axis is CC, and the horizontal and vertical axes are STDs. The closer the values of CC and STD are to 1, the better the model can reproduce the observed values. RMSE is the distance from the model point to the reference point (REF). Generally, the smaller the value of RMSE, the closer the model point is to the reference point. Therefore, when the CC is larger, the RMSE is smaller, and the STD is closer to 1, the simulation ability of the GCM is better (Equations 7–9).
where
In this study, we used TD to evaluate the reliability of six ECIs calculated from 18 individual GCMs and multi-model integrations using AM and IWM. Specially, the CC, STD and RMSE of ECIs simulated by GCMs from CMIP6 and calculated by ERA5 data during 1981–2014 were analyzed.
2.8 Cumulative distribution functions
The differences in physical parameters and resolution of different GCM will lead to great differences in the final simulation results. In order to reduce the uncertainty of a single GCM prediction and improve its reliability, 18 GCM simulation results were treated with AM and IWM. The cumulative distribution function (CDF) is the integral of the probability density function (PDF), which represents the probability that a random variable is less than or equal to a particular value. We use the probability density function to explain the cumulative distribution probability of extreme events for each GCM and after AM and IWM processing results Equation 10.
where is the probability of different extreme climate indices (ECIs), x represents the six defined extreme climate indices,
3 Results
3.1 Comparison between observed and projected ECIs
As shown in Figure 2, the ability to project ECIs was improved significantly by bias correction of GCM data. The CCs between the projection results of ECIs from GCMs and that from the reanalysis data significantly increased (Figure 2), and the RMSE significantly decreased (Table 3). Therefore, to some extent, the bias correction for GCM data could effectively reduce the errors and uncertainties of ECIs projected by GCMs. For the multi-model integration results of each ECI, the ensemble results of AM and IWM have better performance regardless of bias correction (Figure 2). Moreover, the RMSEs of the IWM ensemble results for all ECIs were smaller than that of AM ensemble results (Table 3), and the CCs of the IWM ensemble results for all ECIs were greater than that of AM ensemble results (Supplementary Table S1). These results indicated that the IWM ensemble results calculated by multiple GCMs with bias correction could better reproduce each ECI. In addition, we used cumulative distribution function (CDF) to evaluate the reliability of six ECIs derived from 18 GCMs and averaged by AM and IWM. Overall, the results calculated from the AM and IWM performed better than those from the various GCMs. Moreover, the curve of CDF from IWM method was closer to the observed distribution (Figure 3), which indicated that the results obtained by IWM were best and acceptable in this study.
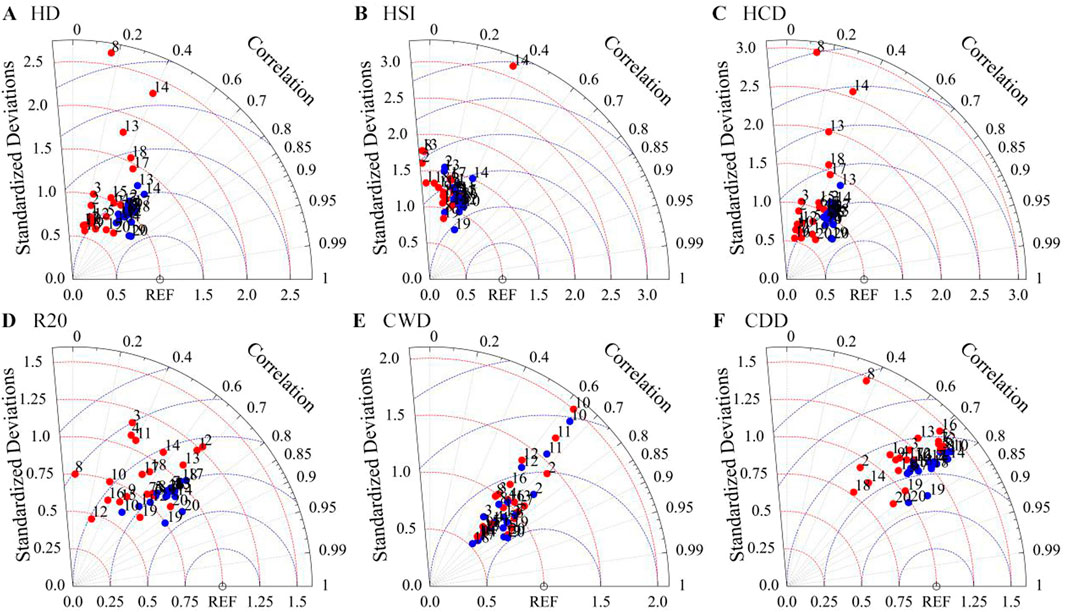
Figure 2. Taylor diagram (TD) information for 6 extreme climate indices (ECIs) (A–F). (○ denote the observed data, red dots and blue dots denote the results without and with bias correction treatment, respectively. The numbers denote the code of GCM (1–18) as Table 1, AM (19) and IWM (20), respectively).
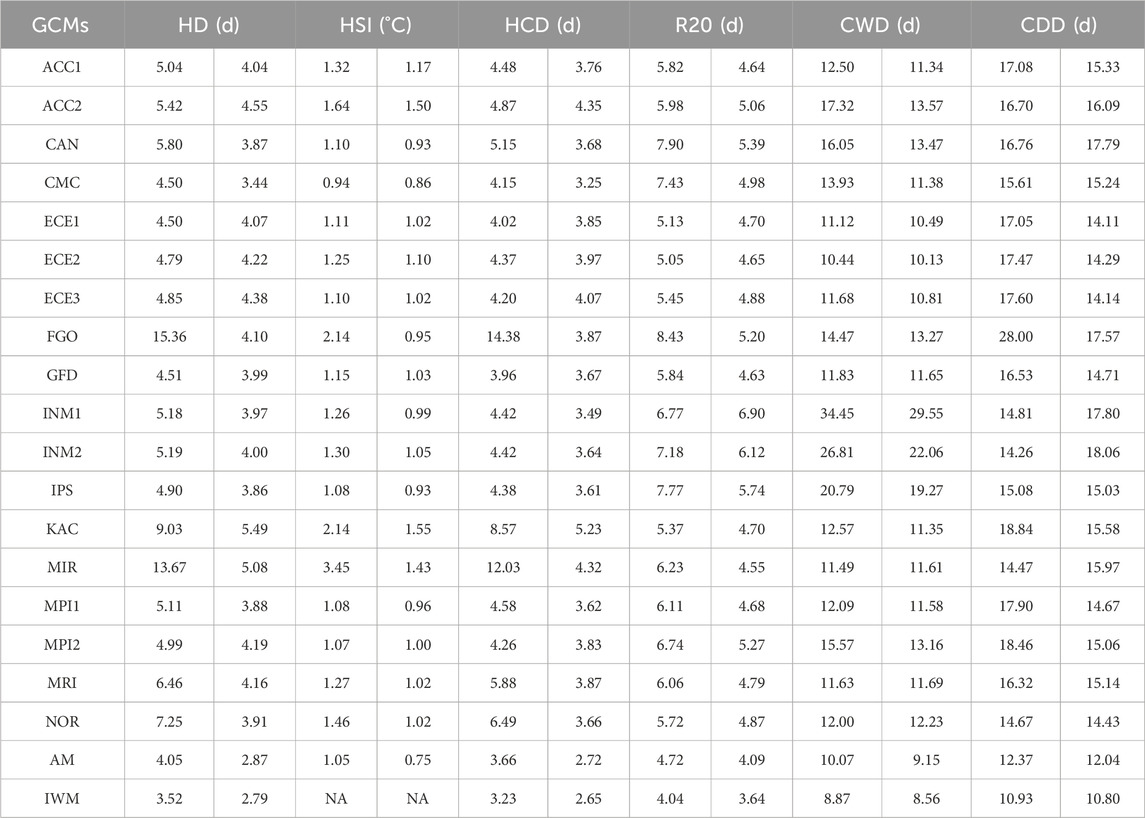
Table 3. Root Mean Square Errors (RMSEs) between each Global Change Model (GCM), the multi-model Arithmetic Mean (AM), Independence Weighted Mean (IWM) and observed values for the 6 extreme climate indices (ECIs) during 1981–2014. Each index corresponds to the RMSEs of GCMs with uncorrected bias in the first column and the RMSEs of GCMs with corrected bias in the second column. NA denotes no available value.
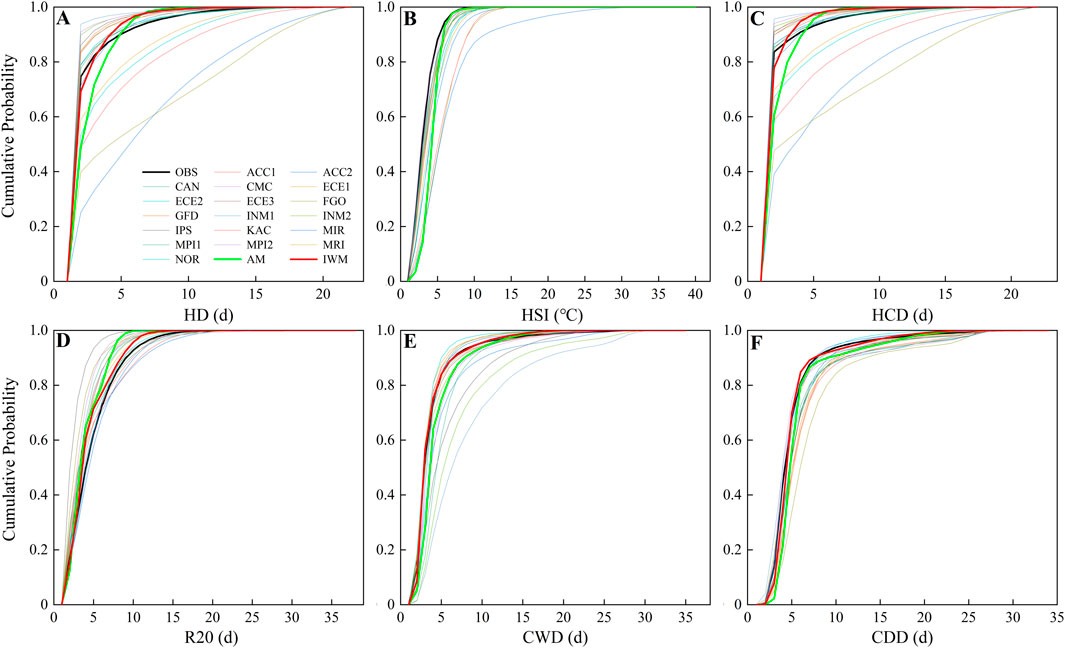
Figure 3. Curves of cumulative distribution function (CDF) for six extreme climate indices (ECIs) (A–F).
3.2 Spatial distribution of observed climate extremes during 1981–2010
As shown in Figure 3, the six ECIs across maize producing areas in China during 1981–2010 showed certain spatial heterogeneity. Overall, the days of HD and HCD were less than 4 days in most areas, except for some areas in Zone Ⅳ and a small area in the eastern part of Zone Ⅲ (Figures 4A, C), indicating that the frequency of extreme high temperature occurred in most maize growing areas was relatively low. However, the results were based on a 30-year average, with more days of extreme heat events occurring in individual extreme years. In addition, most of the areas experiencing high temperature pressures with HSI values less than 36.5°C, except for parts of Zone Ⅳ that reach more than 38°C (Figure 4B). During the historical period of 1981–2010, extreme precipitation (i.e., R20) occurred mainly in Zone Ⅲ located in the south, while the other three zones occurred less frequently (Figure 4D). In terms of the spatial distribution of continuous wet and continuous drought, CWD mainly occurred in the western part of Zone Ⅲ, and most of the regions exceeded 30 days (Figure 4E). However, CDD occurred mainly in the western part of Zone Ⅰ and Zone Ⅳ located in the northern region (Figure 4F). In summary, based on a 30-year average of ECIs occurred during maize RGP indicated a lower frequency of extreme high temperature occurrences. In contrast, R20 and CWD exhibit significant stress in a specific single region, which is also the case for CDD.
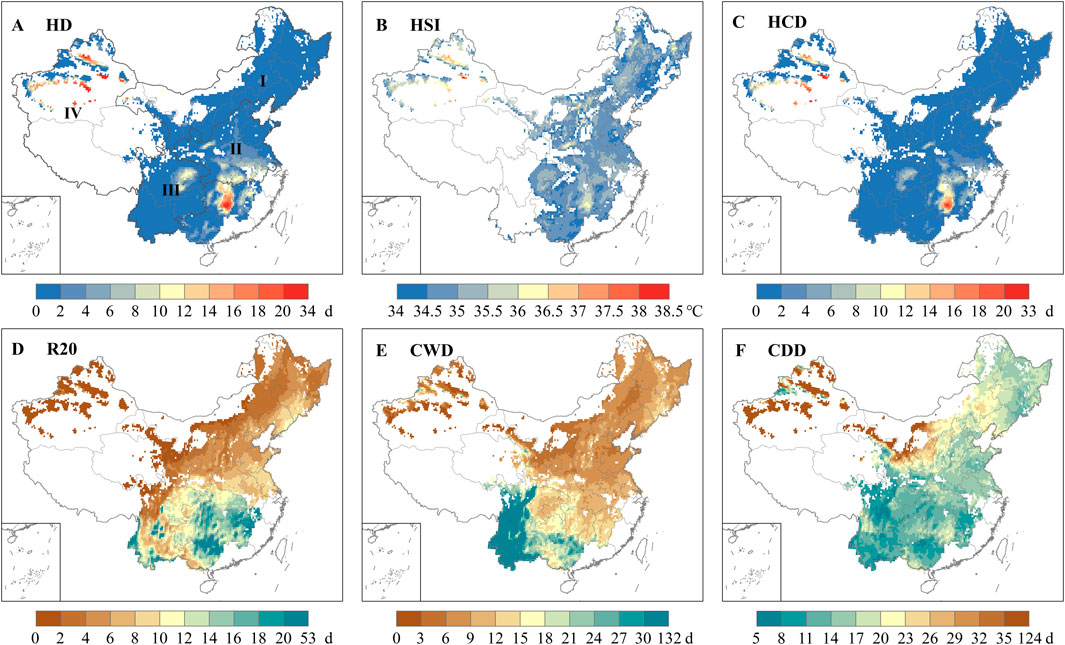
Figure 4. The spatial distribution of average observe extreme climate indices (ECIs) (A–F) during the historical period from 1981 to 2010 in China.
3.3 Projections of climate extremes in the future
For different future climate scenarios, the three extreme heat indices (i.e., HD, HSI and HCD) show increasing trend in the four study sub-zones, and the increase amplitude was greater under the high-emission scenarios, especially under the SSP585 (Figures 5A–C; Supplementary Figures S1A–C, S2A–C, S3A–C). And the three extreme precipitation indices (i.e., R20, CWD and CDD) showed different trends in the four sub-zones. We found that the three precipitation indices had similar trend and intensity in Zone I and Zone II under four future climate scenarios (Figures 5D–F; Supplementary Figures S1D–F). The three extreme precipitation indices showed evident greater intensity in Zone III, while the intensity of R20 and CWD was lower in Zone IV, and the intensity of CDD was higher (Supplementary Figures S2D–F, S3D–F). In term of trends of extreme precipitation, R20 showed significant increase trends in Zone I, Zone II and Zone III, and CWD showed similar trends in Zone I and Zone II, while CDD had no obvious trend in the future.
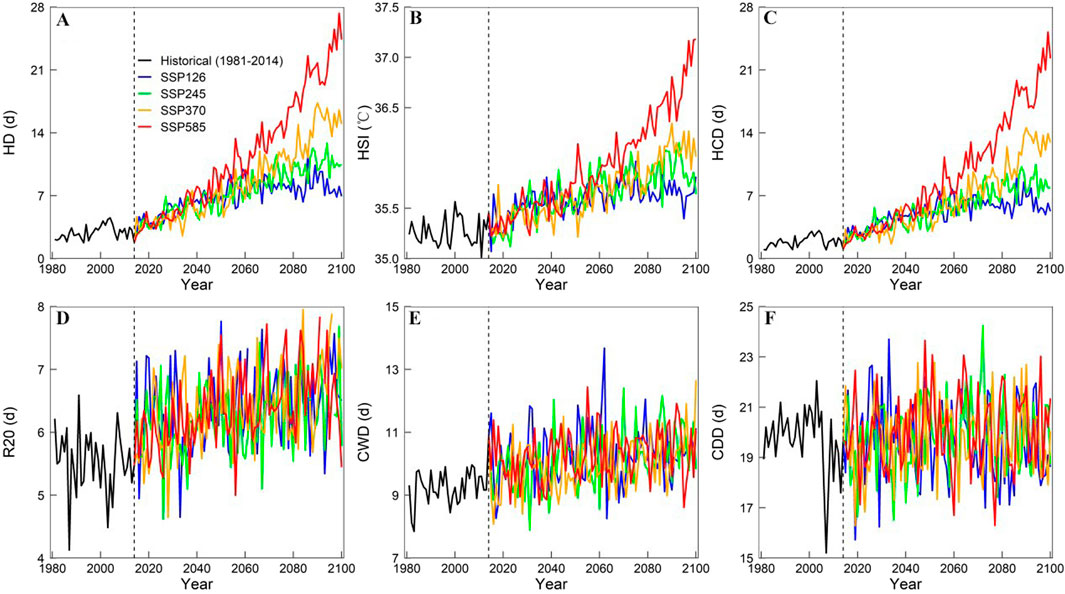
Figure 5. The trends of six extreme climate indices (ECIs) (A–F) in Zone I during historical and future periods under four climate scenarios.
Spatial changes in extreme temperature indices show a consistent change in 2040s and 2080s under four future climate scenarios (Figure 6; Supplementary Figures S4, S5). For HD, the increases in 2080s period under SSP370 and SSP585 were greater than that in 2040s, which showed an evident change in spatial (Figures 6F, H). The increase of HSI showed strong spatial heterogeneity under future climate scenarios, which had significant increases in Zone Ⅳ in two future periods and the increase amplitude was greater under the high emission scenarios, especially under the SSP585 (Supplementary Figure S4H). There has no significant spatial characteristics in HCD in 2040s and the spatial changes were mainly concentrated in Zone Ⅱ and Zone Ⅲ in 2080s, especially under the high emission scenarios (Supplementary Figures S5D–H).
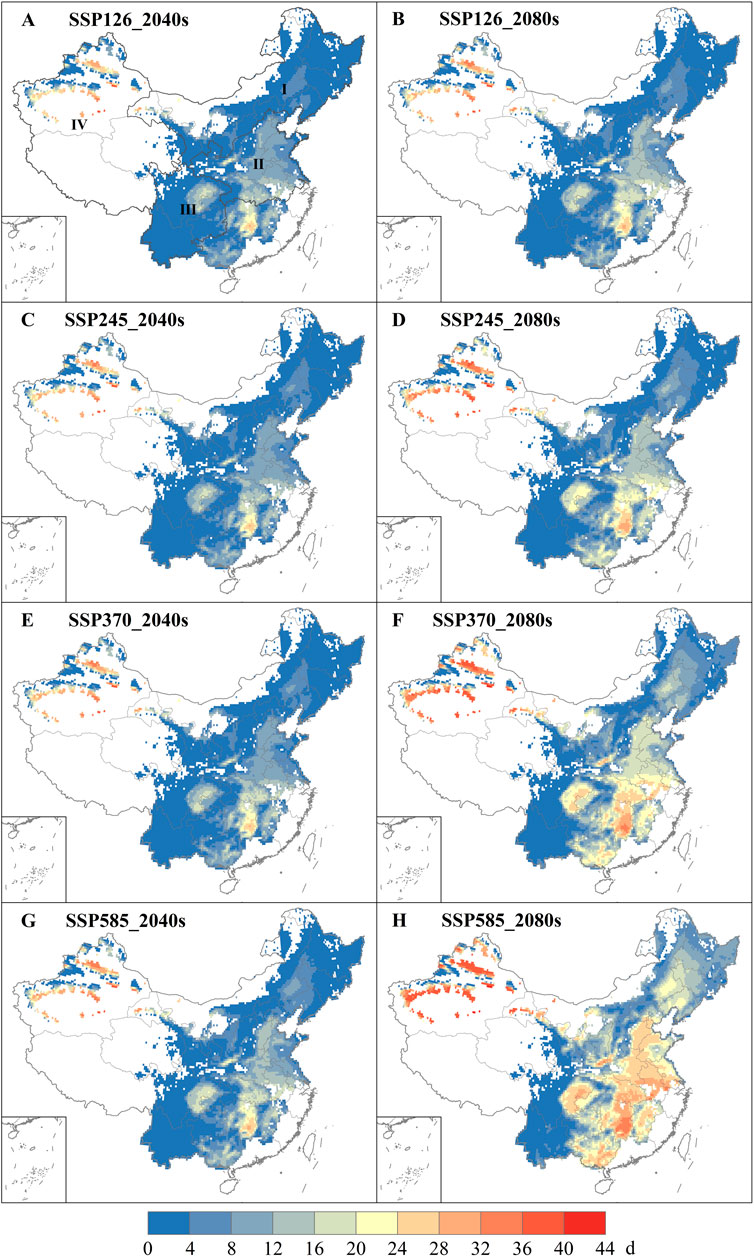
Figure 6. Spatial distribution of HD during 2040s (2031–2060) (A, C, E and G) and 2080s (2071–2100) (B, D, F, H) under SSP126 (A, B), SSP245 (C, D), SSP370 (E, F) and SSP585 (G, H).
The three extreme precipitation indices showed consistent change trends in both future periods (2040s and 2080s), but have different spatial characteristic in sub-zones (Supplementary Figures S6–8). Both R20 and CWD showed decreasing trends under future climate scenarios, and there had obvious spatial difference. For R20, the decrease in the future concentrated in southern of China, especially in the central and eastern part of Zone Ⅲ, while CWD had no significant decreasing region. The results showed that the heavy precipitation stress of maize in southern China would be reduced, which was conducive to the increase of maize yield. There had a more obvious difference of intensity between R20 and CWD, the intensity of CWD showed greater decreasing than that of R20. In contrast, there had increase trends for CDD in 2040s and 2080s, with a significant spatial difference. Both Zone Ⅱ and Zone Ⅳ of CDD showed a significant increasing trend, while there had no obvious differences between 2040s and 2080s. The maize yield in Zone II may be damaged by the increase of continuous precipitation, and more measures are needed to avoid the impact on maize production. Generally, different maize growing regions need to adapt to possible changes in precipitation patterns to maintain stable yields and food security.
Heat stress showed consistent increase trends under four scenarios in the 21st century (Figures 7A–C). The intensity and frequency of the three extreme temperature indices in 2080s were significantly higher than those in 2040s, and that in the high emission scenario was significantly higher than in the low emission scenario. The three extreme precipitation indices changed slightly in the two future periods, but the spatial changes are relatively prominent, such as R20 and CWD in Zone Ⅲ in 2080s, and CDD in Zone Ⅳ in 2080s (Figures 7D–F). Overall, the trend temporal and spatial changes of extreme temperature indices were consistent, and the spatial heterogeneity of extreme precipitation indices was more obvious, with not in temporal changes.
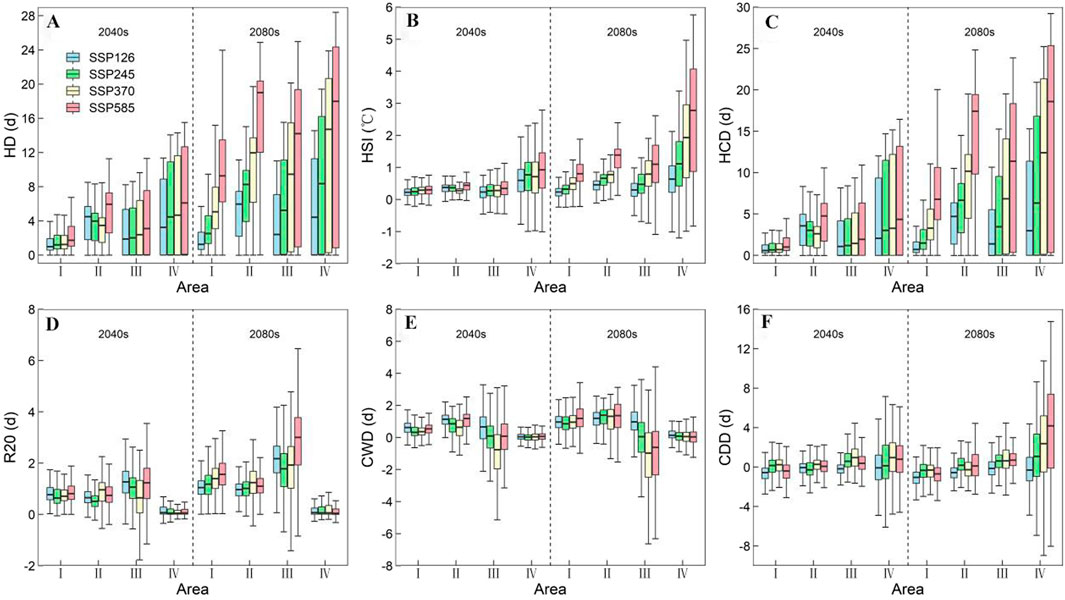
Figure 7. The changes in the 6 extreme climate indices (ECIs) (A–F) during 2031–2060 (2040s) and 2071–2,100 (2080s) compared to the baseline period of 1981–2010 under four future climate scenarios.
4 Discussion
4.1 Performance of CMIP6 models
Related studies used GCMs from CMIP6 to assess changes in extreme climate events as the world warming (Pan et al., 2022; Shiru et al., 2022; Zamani et al., 2020). To explore the applicability of the CMIP6 models, the evaluation was conducted to assess the ability of multi-model ensemble to project ECIs defined for maize production in China. Overall, the application of multi-model ensemble approach effectively decreases the uncertainty of single GCM simulation. In detail, there was better effects and small RMSEs between the multi-model ensemble simulation and the historical observed ECIs. From the evaluation of RMSE and CC, the results from both IWM and AM methods were significantly better than those from individual GCM, and IWM method had best performance in this study. Therefore, we found that the IWM ensemble results calculated by multiple GCMs with bias correction could better reproduce each ECI related maize production.
4.2 Spatiotemporal variation of ECIs for maize
For agriculture, which is heavily affected by extreme climate events, it is necessary to carry out extreme event hazard assessment to the impact on crops (Guo et al., 2023). Generally, the response of crop growth and development process to extreme climate is more sensitive than that of climate change (Lobell et al., 2013). Most studies indicated that extreme climate events exerted negative impacts on maize production, especially at the reproductive growth stage (Zhou et al., 2016; Marijn et al., 2012). The severity of extreme climate disasters is related to their intensity and exposure during maize growth period (Olivera and Heard, 2019). This study used six ECIs related maize production to assess the agroclimatic extremes faced by maize under future climate scenarios, which would be helpful in understanding the impact climate change on maize production and taking targeted measures in the future.
There are many climate factors that have impacts on maize production, but temperature and precipitation are the main factors that have a large impact because of the large variability. In detail, extreme temperature can have detrimental effects on maize, including reduced grain filling and photosynthesis, potentially resulting in crop failure (Zhou et al., 2016). Drought caused by water scarcity can reduce maize yields by negatively affecting root and seed development, flowering and reproductive development (Bi et al., 2020). In this study, the results indicated that the heat stress during maize growing period showed significant increase trends under the all future climate scenarios. Related studies had similar results, and found that the occurrence of HD for maize was becoming more frequent in most areas of China (Zhang et al., 2021; Wei et al., 2020), resulting in significant impacts and economic losses on maize in terms of yield, harvested area and planting boundaries. In detail, we found that the intensity of heat stress was significantly stronger in the south and northwest of China than that in other regions. Therefore, corresponding management measures should be taken in the future to cope with high temperature stress in these areas. Furthermore, to some extent, extreme high temperature can exacerbate drought stress, resulting in more severe drought impacts in maize production. Precipitation is also important for growth and yield of maize, too much can flood maize, while less can lead to drought and destroy maize. Overall, this study found that R20 mainly showed significantly increasing trend in most study area under the future climate scenarios. Related study also noted that the precipitation would increase in the Yangtze River Basin under the two future climate scenarios (RCP4.5 and 8.5) during 2006–2050 (Chen et al., 2020). However, CWD showed a significant growth trend only in the northern region (Zone I), with slight change in other areas. Due to the increase of precipitation, CDD decreased significantly in the northern region (Zone I), while the change in other regions was not obvious. Drought sensitive phase occurs throughout the growing season of maize, and we focused on the period from V3 to maturity. In northern China, maize is often subject to drought stress due to low precipitation. Therefore, future reductions in CDD will benefit maize production in this region.
This study projected and assessed the spatio-temporal changes of ECIs across the maize growing areas of China under various SSP scenarios from 2015 to 2,100, which contains extreme heat, heavy precipitation and continuous precipitation and drought. Overall, due to global warming, maize is more frequently exposed to heat stress during key phenological periods, which could further destabilize China’s crop yields and have an impact on the global market (Lobell and Tebaldi, 2014). We found that agroclimatic extremes occurred widely in maize producing areas of China, and had large spatial differences. Therefore, it is crucial to assess the extent to which maize is exposed to extreme climate environments on a regional scale. Although this study only considered the spatio-temporal characteristics of extreme climate events and did not explore the specific impacts of extreme climate events on maize yield, it is still valuable for the maize management.
4.3 Strategies to adapt to future extreme climate change
The higher risk of extreme climate on maize growth in the future needs to be mitigated by corresponding adaptation strategies. Generally, warming climate could accelerate crop growth and thereby advance crop phenological stages (Xiao et al., 2015; Hu et al., 2017). Field management measures can mitigate the influence of extreme climate on maize growth, especially adjusting sowing date can effectively change the growth period to adapt to climate change. Due to adjustment of sowing date can avoid extreme climate stress during the critical reproductive stage, the damage to crops can be mitigated (Zhou et al., 2017). Furthermore, optimizing crop varieties according to long-term climate change is an important measure to deal with climate change, especially extreme climate change. We calculated the ECIs based on the characteristics of the current maize varieties, and develop more resistant maize varieties can enhance the ability to resist extreme climate stress in the future. Previous studies showed that the optimization of maize varieties under future climate conditions should have a longer reproductive growth period, a faster filling rate, a larger maximum grain number and a higher radiation utilization efficiency (Xiao et al., 2020). Overall, proper adjustment of sowing date and adoption of resistant cultivars can mitigate extreme climate stress during the key growth stages.
4.4 Limits and uncertainties
Considering the extreme climate risk characteristics of maize growth period, people planted maize in relatively warm periods, and cold damage only exists in the late growth and harvest period of maize in Northeast China, and the overall impact was not obvious. Therefore, this study mainly considers the extreme heat indices. In terms of the extreme precipitation indices, we considered the continuous dry and wet effects of maize during the key growth period (from V3 to maturity), and mainly considered the influence of heavy precipitation during this period. Radiation is also a key factor in crop growth, and generally there are no extreme changes. Therefore, this study did not pay attention to the changes of radiation during the growth period of maize. In addition, given the diversity of future climate change, we have selected four scenarios (i.e., SSP126, SSP245, SSP370, SSP585) that cover possible extreme climate scenarios. Moreover, maize yield was not predicted in future scenarios, which is also the direction and content of future research. In order to further investigate the response of simulated maize phenology to climate warming and agronomic measures, more work is needed based on 1.5°C and 2°C.
5 Conclusion
This study preliminarily investigated the future changes of extreme climate stress related to maize production in China based on 18 GCMs from CMIP6. This study found that extreme temperature events, especially heat stress caused by climate warming, will have an increasingly significant impact on maize in the future. R20 mainly showed significantly increasing trend in most study area under the future climate scenarios. However, CWD showed a significant growth trend only in the northern region, with slight change in other areas. CDD decreased significantly in the northern region and will benefit maize production in this region. In order to actively address the impact of extreme weather on maize production, we recommend that developing varieties of maize that can tolerate higher temperatures and adjusting the maize planting calendar to an earlier date could mitigate the impact of extreme climate on maize production. However, due to the uncertainty of climate change and the differences of climate characteristics in different regions, the optimization of specific management measures should be considered in combination with the specific conditions of future local climate change.
Data availability statement
The original contributions presented in the study are included in the article/Supplementary Material, further inquiries can be directed to the corresponding author.
Author contributions
XC: Formal Analysis, Investigation, Writing–original draft, Writing–review and editing. ZS: Software, Writing–review and editing. DX: Conceptualization, Data curation, Funding acquisition, Investigation, Methodology, Project administration, Resources, Supervision, Visualization, Writing–original draft, Writing–review and editing. YL: Data curation, Investigation, Writing–review and editing. HB: Data curation, Validation, Writing–review and editing. MZ: Formal Analysis, Writing–review and editing. DR: Investigation, Writing–review and editing. YQ: Investigation, Writing–review and editing. SS: Investigation, Writing–review and editing.
Funding
The author(s) declare that no financial support was received for the research, authorship, and/or publication of this article. This work was supported by the Hebei Provincial Science Foundation for Distinguished Young Scholars (D2022205010), the Natural Science Foundation of China (42377483, 42207551), the Natural Science Foundation of Hebei Province (D2022503010, D2023302001, D2020205008, D2021205013), the Science and Technology Project of Hebei Education Department (QN2019145), and the Science Foundation of Hebei Normal University (L2023B30).
Conflict of interest
The authors declare that the research was conducted in the absence of any commercial or financial relationships that could be construed as a potential conflict of interest.
Generative AI statement
The author(s) declare that no Generative AI was used in the creation of this manuscript.
Publisher’s note
All claims expressed in this article are solely those of the authors and do not necessarily represent those of their affiliated organizations, or those of the publisher, the editors and the reviewers. Any product that may be evaluated in this article, or claim that may be made by its manufacturer, is not guaranteed or endorsed by the publisher.
Supplementary material
The Supplementary Material for this article can be found online at: https://www.frontiersin.org/articles/10.3389/fenvs.2024.1503141/full#supplementary-material
References
Asseng, S., Ewert, F., Martre, P., Rötter, R. P., Lobell, D. B., Cammarano, D., et al. (2015). Rising temperatures reduce global wheat production. Nat. Clim. Change 5, 143–147. doi:10.1038/nclimate2470
Bai, H., Xiao, D., Wang, B., Liu, D., and Tang, J. (2022). Simulation of wheat response to future climate change based on coupled model inter-comparison project phase 6 multi-model ensemble projections in the north China plain. Front. Plant Sci. 13, 829580. doi:10.3389/fpls.2022.829580
Bai, H., Xiao, D., Wang, B., Liu, D. L., Feng, P., and Tang, J. (2021). Multi-model ensemble of CMIP6 projections for future extreme climate stress on wheat in the North China plain. Int. J. Climatol. 41, E171–E186. doi:10.1002/joc.6674
Beyer, R., Krapp, M., and Manica, A. (2020). An empirical evaluation of bias correction methods for palaeoclimate simulations. Clim. Past 16, 1493–1508. doi:10.5194/cp-16-1493-2020
Bi, W., Wang, M., Weng, B., Yan, D., Yang, Y., and Wang, J. (2020). Effects of drought-flood abrupt alternation on the growth of summer maize. Atmosphere 11, 21. doi:10.3390/atmos11010021
Bishop, C. H., and Abramowitz, G. (2013). Climate model dependence and the replicate Earth paradigm. Clim. Dyn. 41, 885–900. doi:10.1007/s00382-012-1610-y
Bradshaw, C. D., Pope, E., Kay, G., Davie, J. C. S., Cottrell, A., Bacon, J., et al. (2022). Unprecedented climate extremes in South Africa and implications for maize production. Environ. Res. Lett. 17, 084028. doi:10.1088/1748-9326/ac816d
Butler, E. E., and Huybers, P. (2015). Variations in the sensitivity of US maize yield to extreme temperatures by region and growth phase. Environ. Res. Lett. 10, 034009. doi:10.1088/1748-9326/10/3/034009
Chen, X., Wang, L., Niu, Z., Zhang, M., Li, C., and Li, J. (2020). The effects of projected climate change and extreme climate on maize and rice in the yangtze river basin, China. Agric. For. Meteorology 282–283, 107867. doi:10.1016/j.agrformet.2019.107867
Cicchino, M., Edreira, J. I. R., and Otegui, M. e. (2010). Heat stress during late vegetative growth of maize: effects on phenology and assessment of optimum temperature. Crop Sci. 50, 1431–1437. doi:10.2135/cropsci2009.07.0400
Dong, X., Guan, L., Zhang, P., Liu, X., Li, S., Fu, Z., et al. (2021). Responses of maize with different growth periods to heat stress around flowering and early grain filling. Agric. For. Meteorology 303, 108378. doi:10.1016/j.agrformet.2021.108378
dos Santos, C. A. C., Neale, C. M. U., Mekonnen, M. M., Gonçalves, I. Z., de Oliveira, G., Ruiz-Alvarez, O., et al. (2022). Trends of extreme air temperature and precipitation and their impact on corn and soybean yields in Nebraska, USA. Theor. Appl. Climatol. 147, 1379–1399. doi:10.1007/s00704-021-03903-7
Eyring, V., Bony, S., Meehl, G. A., Senior, C. A., Stevens, B., Stouffer, R. J., et al. (2016). Overview of the coupled model intercomparison project phase 6 (CMIP6) experimental design and organization. Geosci. Model Dev. 9, 1937–1958. doi:10.5194/gmd-9-1937-2016
Fu, J., Jian, Y., Wang, X., Li, L., Ciais, P., Zscheischler, J., et al. (2023). Extreme rainfall reduces one-twelfth of China’s rice yield over the last two decades. Nat. Food 4, 416–426. doi:10.1038/s43016-023-00753-6
Guo, Y., Zhang, J., Li, K., Aru, H., Feng, Z., Liu, X., et al. (2023). Quantifying hazard of drought and heat compound extreme events during maize (zea mays L.) growing season using magnitude index and copula. Weather Clim. Extrem. 40, 100566. doi:10.1016/j.wace.2023.100566
Hatfield, J. L., and Dold, C. (2018). Agroclimatology and wheat production: coping with climate change. Front. Plant Sci. 9, 224. doi:10.3389/fpls.2018.00224
Hiruta, Y., Ishizaki, N. N., Ashina, S., and Takahashi, K. (2022). Hourly future climate scenario datasets for impact assessment of climate change considering simultaneous interactions among multiple meteorological factors. Data Brief 42, 108047. doi:10.1016/j.dib.2022.108047
Hu, X., Huang, Y., Sun, W., and Yu, L. (2017). Shifts in cultivar and planting date have regulated rice growth duration under climate warming in China since the early 1980s. Agr. For. Meteorol. 247, 34–41. doi:10.1016/j.agrformet.2017.07.014
Huo, Z., Zhang, H., Li, C., Kong, R., and Jiang, M. (2023). Review on high temperature heat damage of maize in China. J. Appl. Meteor Sci. 34, 1–14. doi:10.11898/1001-7313.20230101
Jin, Z., Zhuang, Q., Wang, J., Archontoulis, S. V., Zobel, Z., and Kotamarthi, V. R. (2017). The combined and separate impacts of climate extremes on the current and future US rainfed maize and soybean production under elevated CO2. Glob. Change Biol. 23, 2687–2704. doi:10.1111/gcb.13617
Lesk, C., Anderson, W., Rigden, A., Coast, O., Jägermeyr, J., McDermid, S., et al. (2022). Compound heat and moisture extreme impacts on global crop yields under climate change. Nat. Rev. Earth Environ. 3, 872–889. doi:10.1038/s43017-022-00368-8
Lesk, C., Rowhani, P., and Ramankutty, N. (2016). Influence of extreme weather disasters on global crop production. Nature 529, 84–87. doi:10.1038/nature16467
Li, F., Zhang, M., and Liu, Y. (2022). Quantitative research on drought loss sensitivity of summer maize based on AquaCrop model. Nat. Hazards 112, 1065–1084. doi:10.1007/s11069-022-05218-w
Li, G., Zhang, X., Cannon, A. J., Murdock, T., Sobie, S., Zwiers, F., et al. (2018). Indices of Canada’s future climate for general and agricultural adaptation applications. Clim. Change 148, 249–263. doi:10.1007/s10584-018-2199-x
Li, Y., Guan, K., Schnitkey, G. D., DeLucia, E., and Peng, B. (2019). Excessive rainfall leads to maize yield loss of a comparable magnitude to extreme drought in the United States. Glob. Change Biol. 25, 2325–2337. doi:10.1111/gcb.14628
Li, Z., Liu, W., Ye, T., Chen, S., and Shan, H. (2022). Observed and CMIP6 simulated occurrence and intensity of compound agroclimatic extremes over maize harvested areas in China. Weather Clim. Extrem. 38, 100503. doi:10.1016/j.wace.2022.100503
Li, Z., Zhang, Z., Zhang, J., Luo, Y., and Zhang, L. (2021). A new framework to quantify maize production risk from chilling injury in northeast China. Clim. Risk Manag. 32, 100299. doi:10.1016/j.crm.2021.100299
Liu, S., Xiao, L., Sun, J., Yang, P., Yang, X., and Wu, W. (2022). Probability of maize yield failure increases with drought occurrence but partially depends on local conditions in China. Eur. J. Agron. 139, 126552. doi:10.1016/j.eja.2022.126552
Lobell, D. B., Hammer, G. L., McLean, G., Messina, C., Roberts, M. J., and Schlenker, W. (2013). The critical role of extreme heat for maize production in the United States. Nat. Clim. Change 3, 497–501. doi:10.1038/nclimate1832
Lobell, D. B., Schlenker, W., and Costa-Roberts, J. (2011). Climate trends and global crop production since 1980. Science 333, 616–620. doi:10.1126/science.1204531
Lobell, D. B., and Tebaldi, C. (2014). Getting caught with our plants down: the risks of a global crop yield slowdown from climate trends in the next two decades. Environ. Res. Lett. 9, 074003. doi:10.1088/1748-9326/9/7/074003
Luo, N., Meng, Q., Feng, P., Qu, Z., Yu, Y., Liu, D. L., et al. (2023). China can be self-sufficient in maize production by 2030 with optimal crop management. Nat. Commun. 14, 2637. doi:10.1038/s41467-023-38355-2
Luo, Y., Zhang, Z., Chen, Y., Li, Z., and Tao, F. (2020). ChinaCropPhen1km: a high-resolution crop phenological dataset for three staple crops in China during 2000–2015 based on leaf area index (LAI) products. Earth Syst. Sci. Data 12, 197–214. doi:10.5194/essd-12-197-2020
Mangani, R., Tesfamariam, E., Bellocchi, G., and Hassen, A. (2018). Modelled impacts of extreme heat and drought on maize yield in South Africa. Crop Pasture Sci. 69, 703–716. doi:10.1071/CP18117
Marijn, V., Tubiello, F. N., Vrieling, A., and Bouraoui, F. (2012). Impacts of extreme weather on wheat and maize in France: evaluating regional crop simulations against observed data. Clim. Change 113, 751–765. doi:10.1007/s10584-011-0368-2
Meinshausen, M., Smith, S. J., Calvin, K., Daniel, J. S., Kainuma, M. L. T., Lamarque, J.-F., et al. (2011). The RCP greenhouse gas concentrations and their extensions from 1765 to 2300. Clim. Change 109, 213–241. doi:10.1007/s10584-011-0156-z
Olivera, S., and Heard, C. (2019). Increases in the extreme rainfall events: using the weibull distribution. Environmetrics 30, e2532. doi:10.1002/env.2532
O’Neill, B. C., Tebaldi, C., van Vuuren, D. P., Eyring, V., Friedlingstein, P., Hurtt, G., et al. (2016). The scenario model intercomparison project (ScenarioMIP) for CMIP6. Geosci. Model Dev. 9, 3461–3482. doi:10.5194/gmd-9-3461-2016
Pan, H., Jin, Y., and Zhu, X. (2022). Comparison of projections of precipitation over Yangtze River Basin of China by different climate models. Water 14, 1888. doi:10.3390/w14121888
Pörtner, H.-O., Roberts, D., Tignor, M., Poloczanska, E., Mintenbeck, K., Alegría, A., et al. (2022). Climate change 2022: impacts, adaptation and vulnerability working group II contribution to the sixth assessment report of the intergovernmental panel on climate change. Cambridge University Press. doi:10.1017/9781009325844
Rizzo, G., Monzon, J. P., Tenorio, F. A., Howard, R., Cassman, K. G., and Grassini, P. (2022). Climate and agronomy, not genetics, underpin recent maize yield gains in favorable environments. Proc. Natl. Acad. Sci. U. S. A. 119, e2113629119. doi:10.1073/pnas.2113629119
Shi, W., Wang, B., and Tian, Y. (2014). Accuracy analysis of digital elevation model relating to spatial resolution and terrain slope by bilinear interpolation. Math. Geosci. 46, 445–481. doi:10.1007/s11004-013-9508-8
Shi, W., Wang, M., and Liu, Y. (2021). Crop yield and production responses to climate disasters in China. Sci. Total Environ. 750, 141147. doi:10.1016/j.scitotenv.2020.141147
Shiru, M. S., Shahid, S., Chae, S.-T., and Chung, E.-S. (2022). Replicability of annual and seasonal precipitation by CMIP5 and CMIP6 GCMs over east asia. KSCE J. Civ. Eng. 26, 1978–1989. doi:10.1007/s12205-022-0992-6
Taylor, K. E. (2001). Summarizing multiple aspects of model performance in a single diagram. J. Geophys. Res. Atmos. 106, 7183–7192. doi:10.1029/2000JD900719
Tebaldi, C., and Knutti, R. (2007). The use of the multi-model ensemble in probabilistic climate projections. Philosophical Trans. R. Soc. A Math. Phys. Eng. Sci. 365, 2053–2075. doi:10.1098/rsta.2007.2076
Tingem, M., Rivington, M., and Colls, J. (2008). Climate variability and maize production in Cameroon: simulating the effects of extreme dry and wet years. Singap. J. Trop. Geogr. 29, 357–370. doi:10.1111/j.1467-9493.2008.00344.x
Villoria, N. B., and Chen, B. (2018). Yield risks in global maize markets: historical evidence and projections in key regions of the world. Weather Clim. Extrem. 19, 42–48. doi:10.1016/j.wace.2018.01.003
Wang, C., Guo, E., Wang, Y., Jirigala, B., Kang, Y., and Zhang, Y. (2023). Spatiotemporal variations in drought and waterlogging and their effects on maize yields at different growth stages in jilin province, China. Nat. Hazards 118, 155–180. doi:10.1007/s11069-023-05996-x
Wang, X., Zhao, C., Müller, C., Wang, C., Ciais, P., Janssens, I., et al. (2020). Emergent constraint on crop yield response to warmer temperature from field experiments. Nat. Sustain 3, 908–916. doi:10.1038/s41893-020-0569-7
Wei, S., Liu, J., Li, T., Wang, X., Peng, A., and Chen, C. (2020). Effect of high-temperature events when heading into the maturity period on summer maize (zea mays L.) yield in the huang-huai-hai region, China. Atmosphere 11, 1291. doi:10.3390/atmos11121291
Wu, J., Zhang, J., Ge, Z., Xing, L., Han, S., Shen, C., et al. (2021). Impact of climate change on maize yield in China from 1979 to 2016. J. Integr. Agric. 20, 289–299. doi:10.1016/S2095-3119(20)63244-0
Xia, L., and Yan, X. (2023). How to feed the world while reducing nitrogen pollution. Nature 613, 34–35. doi:10.1038/d41586-022-04490-x
Xiao, D., Bai, H., Liu, D. L., Tang, J., Wang, B., Shen, Y., et al. (2022). Projecting future changes in extreme climate for maize production in the north China plain and the role of adjusting the sowing date. Mitig. Adapt Strateg. Glob. Change 27, 21. doi:10.1007/s11027-022-09995-4
Xiao, D., Liu, D., Wang, B., Feng, P., and Waters, C. (2020). Designing high-yielding maize ideotypes to adapt changing climate in the North China Plain. Agric. Syst. 181, 102805. doi:10.1016/j.agsy.2020.102805
Xiao, D., Moiwo, J. P., Tao, F., Yang, Y., Shen, Y., Xu, Q., et al. (2015). Spatiotemporal variability of winter wheat phenology in response to weather and climate variability in China. Mitig. Adapt Strat. Gl. 20, 1191–1202. doi:10.1007/s11027-013-9531-6
Xiao, D., and Tao, F. (2016). Contributions of cultivar shift, management practice and climate change to maize yield in north China plain in 1981–2009. Int. J. Biometeorol. 60, 1111–1122. doi:10.1007/s00484-015-1104-9
Xiao, D., Zhang, Y., Bai, H., and Tang, J. (2021). Trends and climate response in the phenology of crops in northeast China. Front. Earth Sci. 9. doi:10.3389/feart.2021.811621
Xie, W., Zhu, A., Ali, T., Zhang, Z., Chen, X., Wu, F., et al. (2023). Crop switching can enhance environmental sustainability and farmer incomes in China. Nature 616, 300–305. doi:10.1038/s41586-023-05799-x
Zamani, Y., Hashemi Monfared, S. A., Azhdari moghaddam, M., and Hamidianpour, M. (2020). A comparison of CMIP6 and CMIP5 projections for precipitation to observational data: the case of northeastern Iran. Theor. Appl. Climatol. 142, 1613–1623. doi:10.1007/s00704-020-03406-x
Zampieri, M., Ceglar, A., Dentener, F., Dosio, A., Naumann, G., van den Berg, M., et al. (2019). When will current climate extremes affecting maize production become the norm? Earth’s Future 7, 113–122. doi:10.1029/2018EF000995
Zhang, F., Yang, X., Sun, S., Gao, J., Liu, Z., Zhang, Z., et al. (2021). A spatiotemporal analysis of extreme agrometeorological events during selected growth stages of maize (zea mays L.) from 1960 to 2017 in northeast China. Theor. Appl. Climatol. 143, 943–955. doi:10.1007/s00704-020-03465-0
Zhang, L., Huo, Z., Amou, M., Xiao, J., Cao, Y., Gou, P., et al. (2023). Optimized rice adaptations in response to heat and cold stress under climate change in southern China. Reg. Environ. Change 23, 25. doi:10.1007/s10113-022-02010-1
Zhang, L., Zhang, Z., Chen, Y., Wei, X., and Song, X. (2018). Exposure, vulnerability, and adaptation of major maize-growing areas to extreme temperature. Nat. Hazards 91, 1257–1272. doi:10.1007/s11069-018-3181-7
Zhang, Z., Chen, Y., Wang, P., Zhang, S., Tao, F., and Liu, X. (2014). Spatial and temporal changes of agro-meteorological disasters affecting maize production in China since 1990. Nat. Hazards 71, 2087–2100. doi:10.1007/s11069-013-0998-y
Zhang, Z., Yang, X., Liu, Z., Bai, F., Sun, S., Nie, J., et al. (2020). Spatio-temporal characteristics of agro-climatic indices and extreme weather events during the growing season for summer maize (zea mays L.) in huanghuaihai region, China. Int. J. Biometeorol. 64, 827–839. doi:10.1007/s00484-020-01872-6
Zhao, Y., Xiao, D., Bai, H., Tang, J., Liu, D. L., and Luo, J. (2022). Future projection for climate extremes in the north China plain using multi-model ensemble of CMIP5. Meteorol. Atmos. Phys. 134, 90. doi:10.1007/s00703-022-00929-y
Zhou, B., Yue, Y., Sun, X., Wang, X., Wang, Z., Ma, W., et al. (2016). Maize grain yield and dry matter production responses to variations in weather conditions. Agron. J. 108, 196–204. doi:10.2134/agronj2015.0196
Zhou, M., Wang, H., and Huo, Z. (2017). The influence of heat stress on maize yield and its association with atmospheric general circulation and sea surface temperature. Clim. Environ. Res. 22, 134–148. doi:10.3878/j.issn.1006-9585.2016.16119
Keywords: extreme climate, global climate model, multi-model ensemble, maize, CMIP6
Citation: Chen X, Shi Z, Xiao D, Lu Y, Bai H, Zhang M, Ren D, Qi Y and Song S (2024) Assessment of extreme climate stress across China’s maize harvest region in CMIP6 simulations. Front. Environ. Sci. 12:1503141. doi: 10.3389/fenvs.2024.1503141
Received: 28 September 2024; Accepted: 18 November 2024;
Published: 03 December 2024.
Edited by:
Prakash Kumar Jha, University of California Agriculture and Natural Resources, United StatesReviewed by:
Ning Yao, Northwest A&F University, ChinaSaswata Nandi, University of California, Merced, United States
Copyright © 2024 Chen, Shi, Xiao, Lu, Bai, Zhang, Ren, Qi and Song. This is an open-access article distributed under the terms of the Creative Commons Attribution License (CC BY). The use, distribution or reproduction in other forums is permitted, provided the original author(s) and the copyright owner(s) are credited and that the original publication in this journal is cited, in accordance with accepted academic practice. No use, distribution or reproduction is permitted which does not comply with these terms.
*Correspondence: Dengpan Xiao, eGlhb2RwQHNqemlhbS5hYy5jbg==
†ORCID: Dengpan Xiao, orcid.org/0000-0001-6900-1237
 Xinmin Chen
 Zexu Shi1
 Dengpan Xiao
 Huizi Bai
 Dandan Ren
 Yongqing Qi