- 1College of Resources and Environmental Engineering, Anshun University, Anshun, China
- 2Rural Revitalization Research Center of Guizhou Universities, Anshun, Guizhou, China
- 3School of Architecture and Urban Planning, Tongji University, Shanghai, China
Evaluating resource and environmental carrying capacity (RECC) within the framework of ecological civilization is essential for reconciling development with ecological preservation and optimizing land-use patterns. This evaluation through the lens of ecological civilization is crucial for effective resource allocation. This article introduces a technical framework specifically designed for analyzing and evaluating resource and environmental carrying capacity in karst regions, focusing on Anshun City in Guizhou Province as a case study. The framework follows a structured approach, i.e., “problem identification, problem decomposition, and decision-making assessment,” which proves effective for these evaluations. Furthermore, the integrated evaluation index system incorporating resources, environment, and socioeconomic factors under the principles of ecological civilization aligns with contemporary developmental requirements while reflecting the distinctive characteristics of the resources and environment in karst regions. This alignment enhances the specificity and relevance of the evaluation methodology. The application of the obstacle degree model strengthened the utility and depth of the evaluation results. Additionally, Pearson’s correlation analysis clarified the complex interrelationships among various index factors, highlighting the significant role of unique local resources in the carrying capacity of karst regions. Additionally, the article reveals a delay in the socioeconomic development of karst regions, which adversely impacts their carrying capacity. Thus, promoting regional economic growth is crucial for enhancing the overall carrying capacity. In light of these findings, the article proposes practical strategies to enhance resource and environmental carrying capacity. These include establishing technical standards for evaluation, accelerating industrial transfers focused on technological innovation, and enhancing market mechanisms for resource allocation.
1 Introduction
Resource and environmental carrying capacity (RECC) is essential for advancing regional ecological civilization; conversely, the establishment of ecological civilization is crucial for enhancing this carrying capacity. The concept of ecological civilization represents a key path toward sustainable socioeconomic development in China, tackling challenges such as resource depletion, environmental pollution, and ecological imbalance stemming from rapid industrialization and urbanization. Promoting green development and fostering harmonious coexistence between humans and nature are pivotal strategies for China’s socioeconomic progress in the contemporary era. Major initiatives include deepening ecological civilization, aiming for carbon neutrality and carbon peaking emissions, and refining the market allocation system for resource and environmental management. These initiatives serve as fundamental principles for national planning and sustainable development. Evaluating resource and environmental carrying capacity in the context of ecological civilization is essential for achieving sustainable and high-quality socioeconomic transformation in regions. This approach ensures the alignment of economic and social development with ecological protection and optimizes regional resource allocation while safeguarding natural and cultural heritage. In recent years, the evaluation of resource and environmental carrying capacity has increasingly become a fundamental consideration in regional development strategies (Huang and Song, 2019). The outcomes of these evaluations have been utilized in land planning, urban development, and regional economic strategies (Huang, 2017; Fan, 2007), providing valuable theoretical frameworks for optimizing regional land use and resource management.
The concept of RECC has significantly evolved since its inception. Initially, carrying capacity referred to biological populations, defined by Park and Burgess (1921) as the population size an environment can support under specific conditions. Malthus (1978) expanded this idea, proposing that unchecked population growth would outpace food production, causing famines. However, the RECC concept has since been expanded to include ecological, resource, and environmental capacities, referring to the sustainable population or activity level that an ecosystem can support while maintaining ecological balance (Sun et al., 2020). Recent studies have divided RECC into several subdomains: (1) resource carrying capacity (RCC), which focuses on land, water, and mineral resources. The RCC assesses resource availability to support human activity without degradation (Liu et al., 2023). (2) Environmental carrying capacity, which is the environment’s capacity to absorb pollutants and waste while sustaining ecosystem health (Gao et al., 2020). (3) Ecological carrying capacity relates specifically to ecological system resilience and biodiversity maintenance capacity (Niu et al., 2020). These definitions underscore RECC as a multi-dimensional concept that integrates physical resource limitations with ecological resilience and environmental quality (Liu et al., 2020; Niu et al., 2020). Evaluating RECC necessitates moving from single-factor to multi-factor assessment models, incorporating land, water, climate, and ecological health metrics. Resource and environmental carrying capacity synthesizes these concepts (Sun et al., 2020) and indicates the maximum population that a region can support while preserving optimal natural conditions and ecological balance (Niu et al., 2018). Research in developing evaluation systems has shifted from single-factor to multi-factor assessments (Shen et al., 2022). Scholars have deepened the principles, content, and perspectives of indicators, resulting in studies focused on various factors such as land, water, and ecological conditions (Liu et al., 2023; Gao et al., 2020). Research has encompassed both single-factor (Yang and Wang, 2022) and comprehensive assessments of carrying capacity (Shao et al., 2013; Yang et al., 2016). Additionally, studies have also varied in spatial scale, addressing evaluations at national, provincial, and urban levels (Wang J. et al., 2023; Luo et al., 2022), contributing to the development of assessment systems that incorporate factors such as water, climate, and land (Feng et al., 2021; Zhang et al., 2018; Yang et al., 2015; Liu and Borthwick, 2011).
Various methodological approaches are key to evaluating RECC, each suited to specific ecological complexities, data availability, and geographic requirements. These methods offer unique advantages in understanding RECC, particularly in ecologically sensitive, resource-limited karst regions. Comprehensive assessments integrate resource, environmental, and ecological data into composite RECC scores, providing policymakers with a holistic view of carrying capacity (Wang and Wang, 2022). System dynamics models analyze interactions between ecological, economic, and social factors and are effective for long-term, predictive assessments (Wang M. et al., 2023; Ge et al., 2021). These models are suitable where complex feedback loops and time-dependent changes are vital for understanding sustainability trends in karst landscapes. The ecological footprint method quantifies natural resource demand relative to regional supply and is particularly valuable in high-stress areas like karst regions (Liu et al., 2022; Jia et al., 2020). This method allows researchers to determine whether a region’s resource consumption aligns with its regenerative capacity, making it highly applicable for comparative studies in stressed environments. Fuzzy evaluation models incorporate qualitative data and account for uncertainties, making them suitable for RECC evaluation in ecologically complex regions with limited data (Min et al., 2022; Tan et al., 2021). Fuzzy models’ adaptability is advantageous in karst areas, where data precision is often challenging and uncertainty requires effective management. Advances in remote sensing and GIS now provide high-precision spatial data, enabling the detailed mapping of resource distributions and environmental impact zones (Peng et al., 2020). The barrier degree model critically identifies and assesses primary factors limiting regional RECC. This model quantifies obstacle factors, pinpointing issues that hinder sustainable resource management and environmental protection, particularly under ecological civilization constraints (Zhang et al., 2018; Lin et al., 2023). The model uses a structured approach, using indicators like urbanization rate, wastewater discharge, and resource use efficiency to calculate an “obstacle degree.” A high barrier degree suggests major challenges to sustainable RECC, while a low degree indicates fewer obstacles (Chen et al., 2023). By identifying these barriers, the model aids policymakers in targeted interventions to strengthen resource and environmental resilience in karst and other fragile regions. Pearson’s correlation analysis determines linear relationships between key RECC indicators, providing insights into dependencies among resource, environmental, and socioeconomic factors. In karst regions, Pearson’s analysis reveals associations between land-use intensity and water resource availability, aiding in identifying leverage points for enhancing RECC (Wu and Hu, 2020). However, its linearity assumption limits it, potentially missing complex, non-linear relationships in ecological systems, suggesting a need for complementary analyses (Wei et al., 2019). These methodologies enable adaptive, region-specific RECC assessments, addressing unique geographic, ecological, and resource constraints. This variety of approaches supports sustainable policy formulation, allowing researchers to select the most suitable tools based on study requirements and regional ecological characteristics.
Scholars have delineated various terms such as resource carrying capacity, environmental carrying capacity, ecological carrying capacity, and land and water resource carrying capacities (Liu et al., 2020; Niu et al., 2020; Niu et al., 2018). The concept of carrying capacity was first articulated by Park in 1921, who defined it as the maximum number of biological individuals that an environment can sustain under specific conditions (Park and Burgess, 1921), laying the groundwork for further exploration. Malthus (1978) later proposed a population growth model that indicated that famines and poverty would arise when the population exceeded the limits of food supply. Resource and environmental carrying capacity is a comprehensive synthesis of these concepts (Sun et al., 2020) and indicates the maximum population that can be supported in a region while maintaining an optimal natural environment and ecological balance (Niu et al., 2018). Research in developing evaluation systems has shifted from single-factor to multi-factor assessments (Shen et al., 2022). Scholars have deepened the principles, content, and perspectives of indicators, resulting in studies focused on various factors such as land, water, and ecological conditions (Liu et al., 2023; Gao et al., 2020). Research has encompassed both single-factor (Yang and Wang, 2022) and comprehensive assessments of carrying capacity (Shao et al., 2013; Yang et al., 2016). Additionally, studies have also varied in spatial scale, addressing evaluations at national, provincial, and urban levels (Wang J. et al., 2023; Luo et al., 2022), contributing to the development of assessment systems that incorporate factors such as water, climate, and land (Feng et al., 2021; Zhang et al., 2018; Yang et al., 2015; Liu and Borthwick, 2011). Researchers have also adopted diverse evaluation methods and models to meet different objectives, including comprehensive assessments (Wang J. et al., 2023; Wang and Wang, 2022), system dynamics (Wang M. et al., 2023; Ge et al., 2021; Yang et al., 2015), ecological footprints (Liu et al., 2022; Jia et al., 2020), fuzzy evaluations (Min et al., 2022; Tan et al., 2021), and energy value analysis. Recent studies, including those by Peng et al. (2020), have utilized remote sensing and GIS technology to conduct comprehensive evaluations in the karst regions of Southwest China.
Existing research in the field encompasses a wide range of aspects, including concepts, frameworks, indicator systems, evaluation methods, and models, yet several challenges persist. Existing assessment indicator systems often lack specificity, especially for karst regions, where limited studies fail to sufficiently highlight the region’s unique characteristics. Moreover, the presentation of evaluation results is often insufficient, and a deeper analysis of factors influencing the regional carrying capacity and their interrelationships requires further exploration. Additionally, there is also a disconnection between current analyses and the realities of modern societal development. This highlights the necessity for a comprehensive evaluation framework specifically tailored to the distinct attributes of karst regions as this is crucial for enhancing the theoretical and methodological foundations of resource and environmental carrying capacity evaluations. In summary, although a relatively comprehensive theoretical framework for resource and environmental carrying capacity has been established (Li et al., 2022), karst regions encounter distinct challenges in this evaluation due to their unique geological and ecological conditions. Future studies should further integrate the concept of ecological civilization and deepen theoretical and empirical investigations of resource and environmental carrying capacity in karst regions, with the aim of providing more scientifically grounded guidance for sustainable development in these regions.
Karst regions are characterized by expansive landscapes, unique geological environments, ecological sensitivity, and constrained resource endowments. Although industrialization, urbanization, transportation, and tourism contribute to regional economic growth, they also result in significant land-use disruptions, severe ecological degradation, and escalating resource constraints. The growing conflicts between ecological preservation, development needs, and the conservation of natural and cultural heritage expose the limitations of current human activities. Consequently, it is essential to establish an analytical framework that accurately captures the distinctive characteristics of karst regions. This article focuses on this important area, specifically examining Anshun City in Guizhou, which exemplifies a karst region. Utilizing 2019 as the evaluation timeframe and county units as the fundamental evaluation units, the article uses qualitative methods such as surveys and expert consultations to construct an evaluation framework for resource and environmental carrying capacity based on the principles of ecological civilization. This framework not only enhances the theoretical foundation and analytical methodologies of resource and environmental assessments but also provides practical guidelines for policymaking related to ecological civilization development, land-use planning, and sustainable resource management in karst regions.
2 Research area
The research area is located in the central–western part of Guizhou, China, at the watershed between the North Panjiang and Wujiang river systems. This accessible region is geographically defined between longitudes 105°15′ to 106°35′ E and latitudes 25°21′ to 26°37′ N. It experiences an average annual temperature of 14.8°C, receives an annual precipitation of 1,222 mm, and benefits from 1,238.80 h of sunshine each year. Rich in mineral and water resources, this region is also recognized for its biodiversity, making it a focal point for national initiatives in natural forest protection and ecological development. Notably, over 12% of the region consists of scenic areas, significantly higher than the national average of 1% and Guizhou’s average of 4.2%. Despite these advantages, the region faces challenges, including significant land degradation and soil erosion, characterized by high elevations in the central region and lower terrain in the north and south, as well as higher elevations in the northwest and lower elevations in the southeast. This spatial differentiation showcases it as a quintessential region of concentrated karst topography (Figure 1).
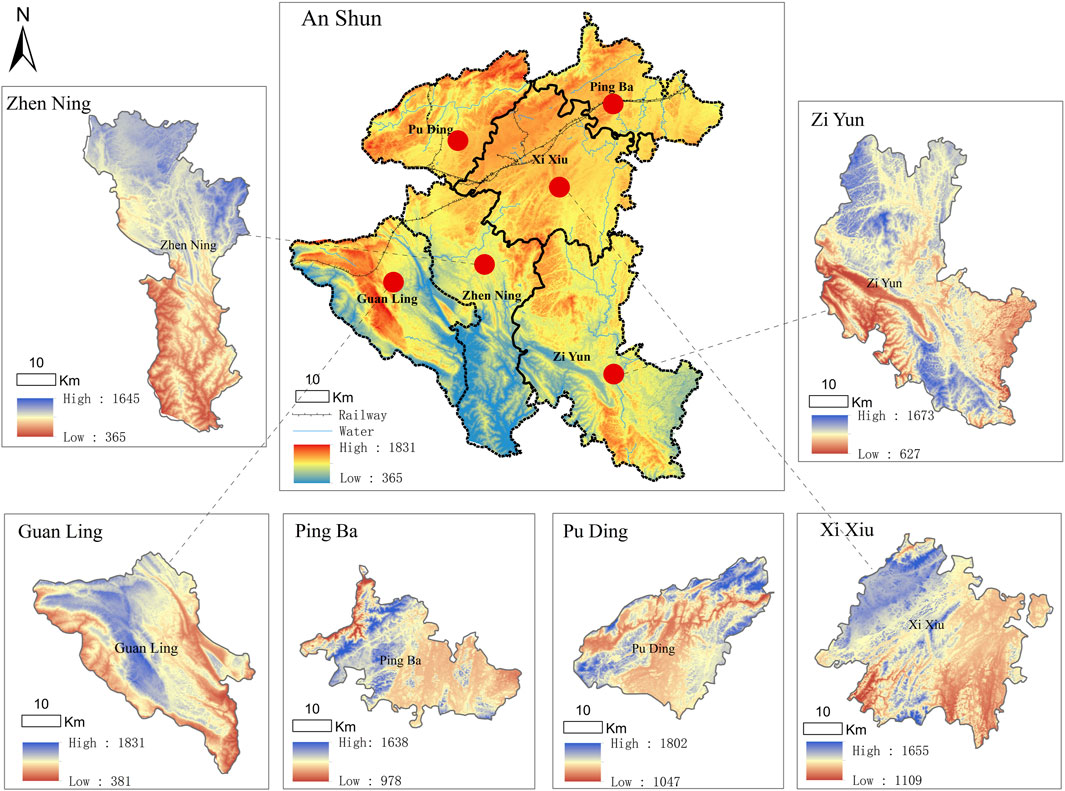
Figure 1. Overview of the research area [Approval Qian S (2023) No. 009], with simplified elements on the base map but no changes to the scope.
In 2019, the total land area amounted to 9,267 km2, with arable land covering 4.39 million acres. The forested cover reached 7.6194 million acres, resulting in a forest coverage rate of 59.03%. The region experienced an average annual runoff of 6.217 billion m³, with a technical potential for hydropower generation estimated at 1.5929 million kilowatts, of which 1.5429 million kilowatts are economically viable. The resident population is approximately 2.3636 million, contributing to a regional gross domestic product (GDP) of 92.394 billion yuan with an annual growth rate of 8.1%. The industrial structure is divided into three sectors at a ratio of 17.0:31.7:51.3. The research area encompasses six districts and counties, Xi Xiu, Ping Ba, Pu Ding, Guanyin, Zi Yun, and Zhen Ning (Figure 1), supported by 2,003 healthcare institutions. Known as the “Mountain Park Province,” Guizhou is characterized by striking landscapes, abundant water resources, beautiful valleys, impressive rock formations, and a wealth of natural resources, which contribute to its reputation as a “natural air conditioner,” “green oxygen bar,” and “summer resort.” Under the province’s expansive ecological strategy, the research area has actively pursued ecological civilization initiatives, including rocky desertification control, river management, and pollution reduction. These efforts, strongly supported by national policies, have resulted in gradual enhancements in resource and environmental endowments, as well as improvements in carrying capacity.
3 Research design
3.1 Data sources
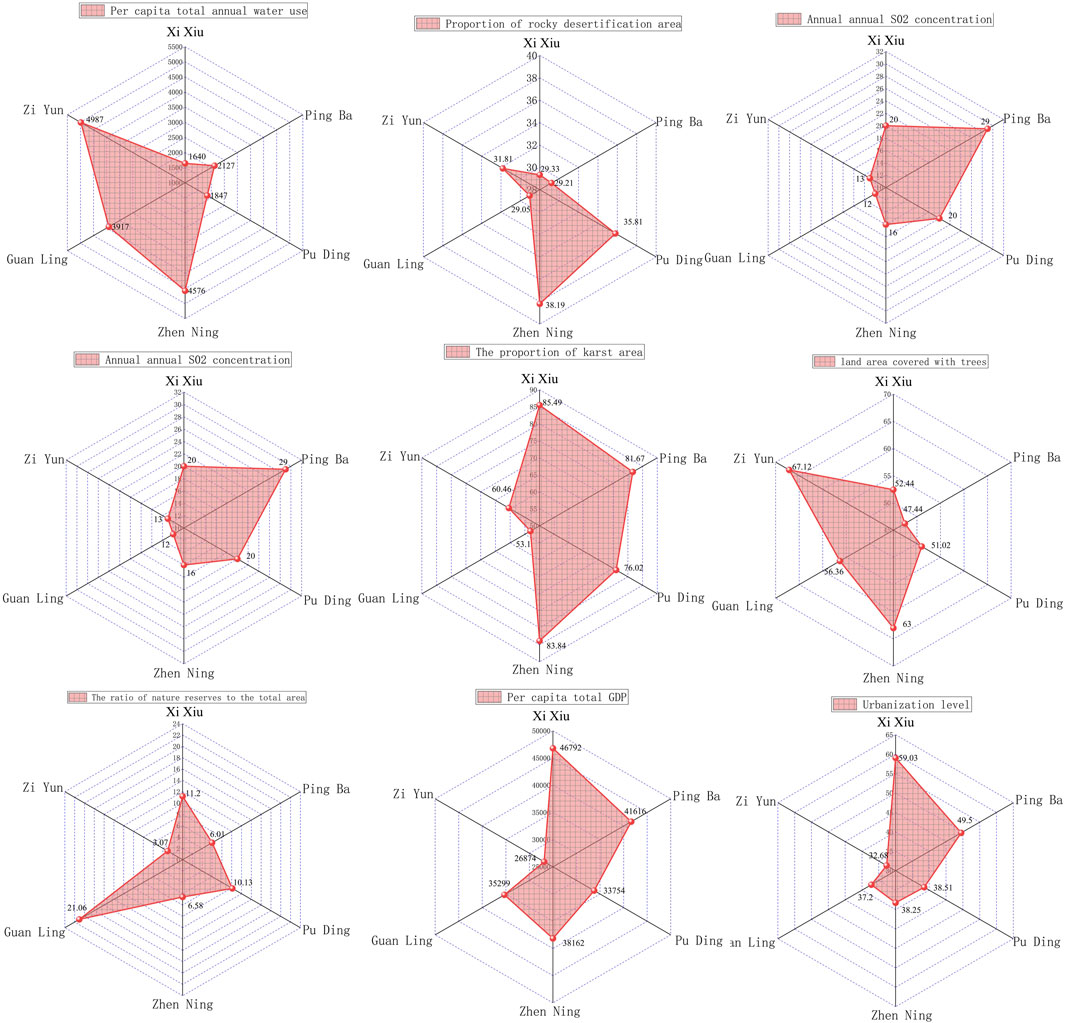
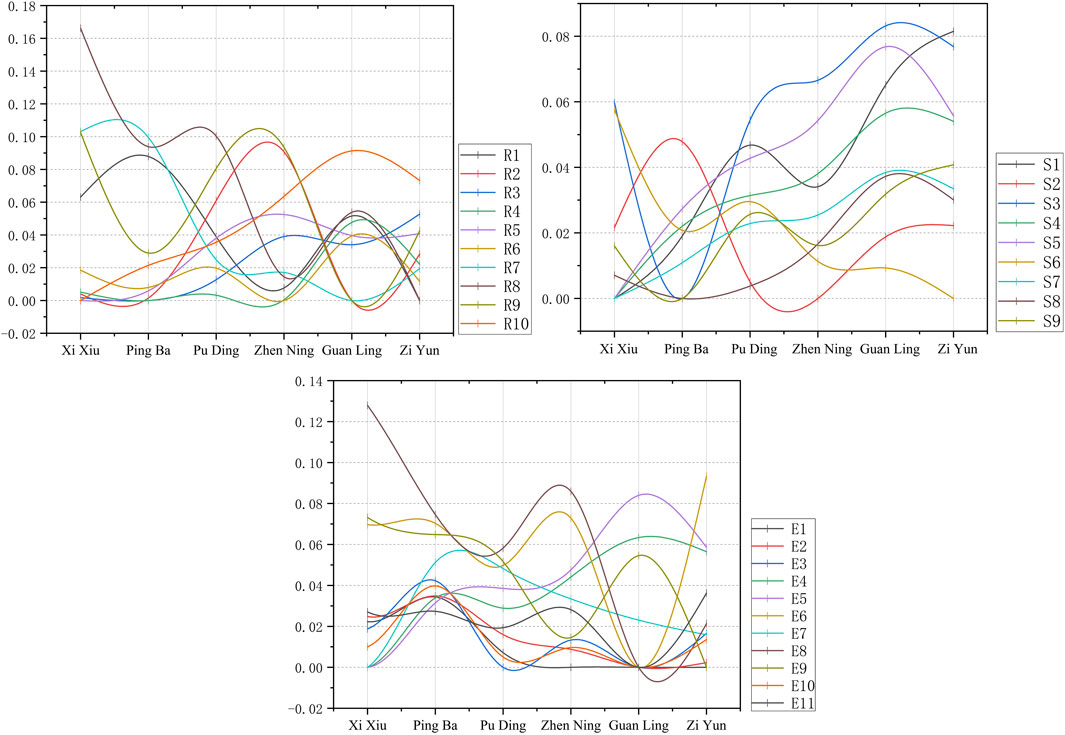
This article derives data from various authoritative sources, encompassing land use, climate, water resources, socioeconomic factors, and ecological conditions. These sources include the results of the third national land resource survey, comprehensive land-use planning for the region from 2006 to 2020, and statistical yearbooks and public reports from 2015 to 2019. Additional data sources consist of environmental condition reports, plans for addressing stoniness in the region (2008–2015), water ecological civilization construction (2016–2030), soil and water conservation (2016–2030), government work reports, and various development plans related to industrial growth, transportation during the 13th Five-Year Plan, energy development, and wetland conservation. The evaluation indicators for land, water, and air quality are illustrated by a single, representative baseline indicator for each category (Figure 2).
3.2 Research methods
3.2.1 Establishing the analysis framework for resource and environmental carrying capacity
This research addresses the distinct resource and environmental characteristics of karst regions, along with the characteristics of socioeconomic development. Through interviews, expert consultations, and empirical validation, we developed an analytical framework for evaluating resource and environmental carrying capacity, guided by the concept of ecological civilization (Figure 3). The framework consists of three logical phases: problem identification, analysis, and decision-making. When evaluating carrying capacity in karst regions, these phases are applied as follow:
(1) Problem identification: In this initial phase, we recognize critical issues such as widespread rocky desertification, severe soil erosion, ecological vulnerability, significant disturbances in land use, increasing resource constraints, and conflicts between development and conservation. The analysis is contextualized within national and regional commitments to green development, low-carbon initiatives, ecological protection, and high-quality growth, leading to the formulation of relevant research questions addressing the carrying capacity of resources and the environment in karst regions.
(2) Problem analysis: Due to the distinct natural environment and resource endowments in karst regions, achieving sustainable development requires compliance with natural laws and customized approaches for local conditions. This phase constructs a comprehensive evaluation index system reflecting the region’s unique features while examining resources, the environment, and socioeconomic dimensions. A mixed-method approach integrates interviews, expert consultations, comprehensive evaluation models, obstacle degree models, and Pearson’s correlation analysis. It is used to assess the carrying capacity level, identify hindering factors, and explore the interrelations among these factors, with the results illustrated through spatial visualization.
(3) Decision-making: Utilizing the evaluation results as a foundation, this phase addresses current national macroeconomic strategies and urgent regional development needs. The focus is on identifying and mitigating obstacles to enhance resource and environmental carrying capacity, thereby promoting a harmonious human–environment relationship and achieving long-term sustainable development goals for the karst region. This process includes proposing scientifically grounded strategies and recommendations for improvements.
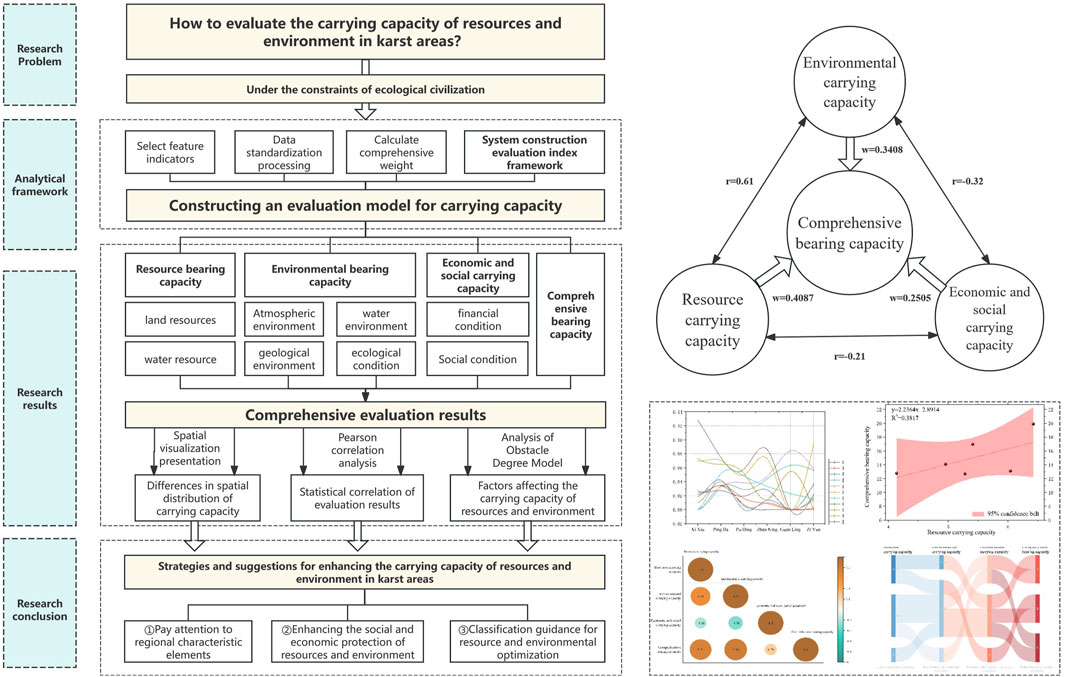
Figure 3. Research framework diagram for analyzing resource and environmental carrying capacity based on “problem design–problem deconstruction–decision evaluation.”
3.2.2 Technical process for evaluating resource and environmental carrying capacity
3.2.2.1 Development of an evaluation index system
Index selection principles: Adhering to the concept of ecological civilization, index selection emphasizes a systematic and locally relevant approach. Indicators must reflect the conditions of the research area, be easily interpretable, align with the basic theoretical framework for carrying capacity evaluation and national technical standards, and appropriately represent the carrying capacity status.
Selection of evaluation indexes: The research area, as a typical karst region, is abundant in mineral and tourism resources but also faces significant ecological challenges, including extensive rocky desertification, severe soil erosion, and inadequate vegetation cover. Although the economy is growing, its overall level remains relatively low. Drawing from existing research, technical standards, and expert consultations, we established an evaluation index system comprising three main criteria: resource, environmental, and socioeconomic carrying capacity. This system incorporates eight evaluation indexes, such as land resources and air quality, leading to a total of 30 specific indicators, including per capita arable land and per capita water usage (Table 1).
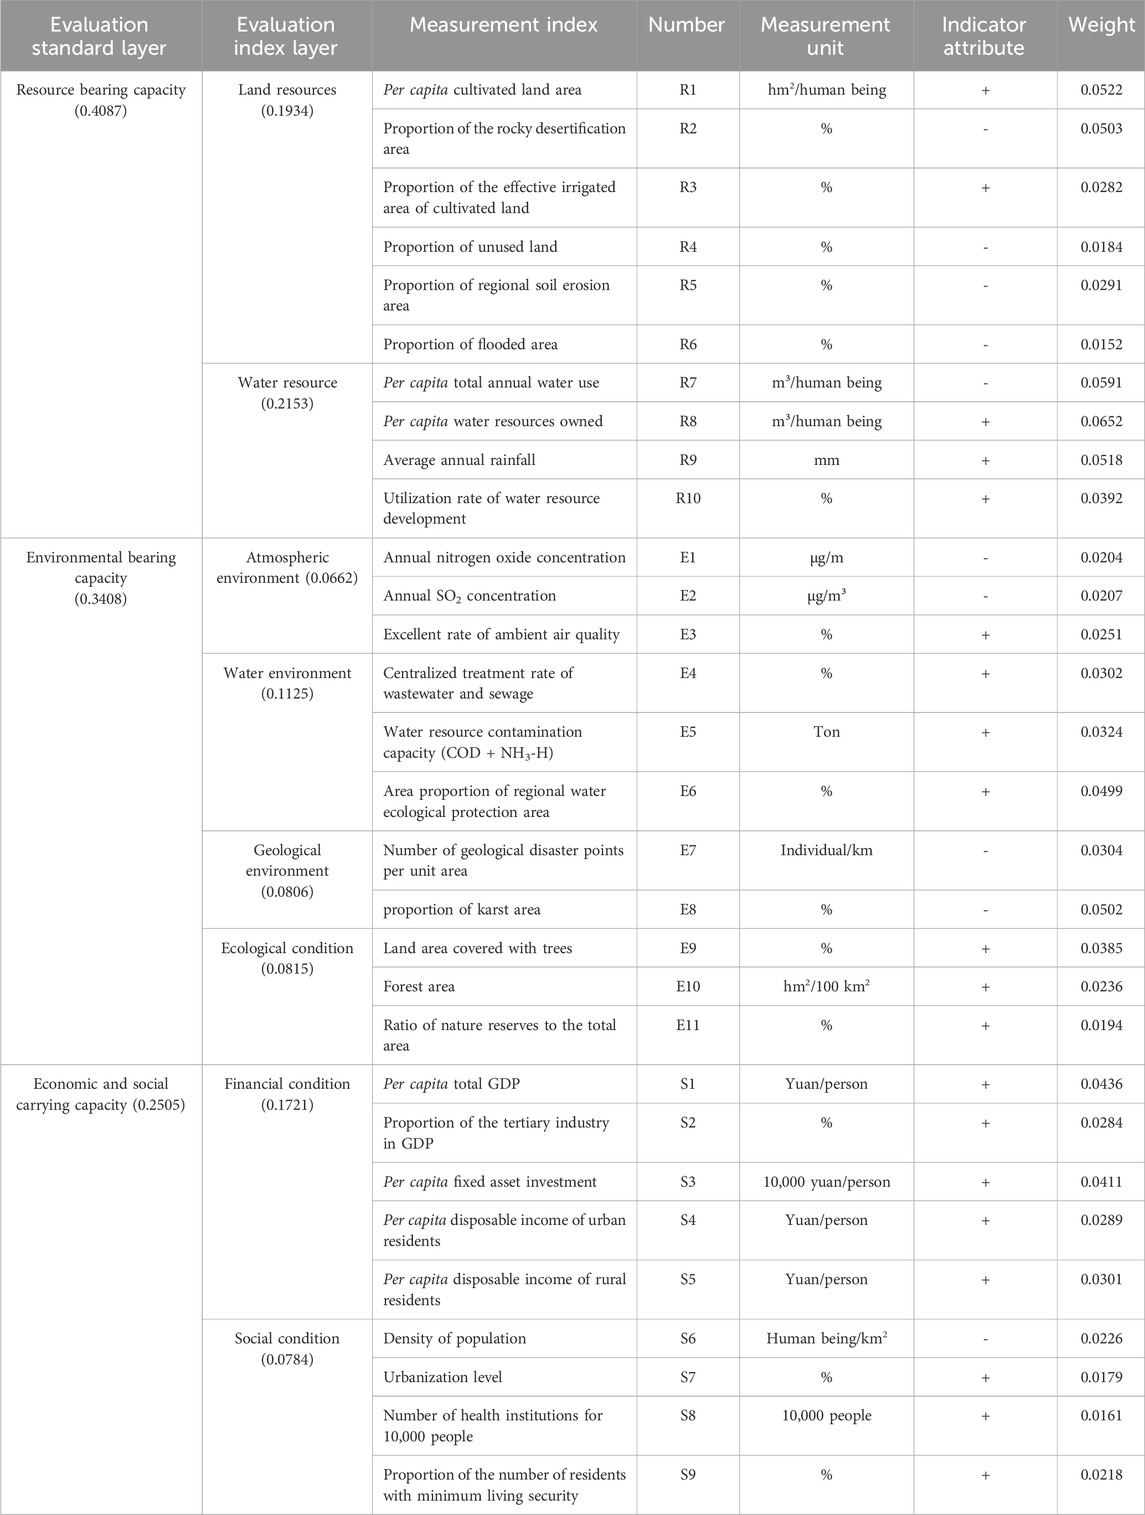
Table 1. Construction of the evaluation indicator system and weight setting (Equations 1–3).
Setting weights for evaluation indexes: We applied a combination of the variance and Delphi methods to assign weights to the evaluation indexes. This process involved engaging experts from various fields, such as land planning, resource management, and ecological development, encompassing administrative officials, technical personnel, educators, and community representatives, to account for obstacles to regional ecological construction.
Variance-based weighting approach: The variance weighting method involves calculating the average values and variances of evaluation indicators, followed by normalizing the variance coefficients to derive the indicator weight values. The main steps are as follows:
① The average of each evaluation indicator is calculated:
where
② The variance of the evaluation indicators is computed:
where
③ The variance coefficients are normalized to derive the weight coefficients:
where
Various indicators have diverse focuses and attributes, influencing the carrying capacity of the resources and environment differently. In the evaluation, the weight coefficients obtained through both the variance and Delphi methods are used to comprehensively determine the weight values of the indicators. The weights are assigned based on the significance of resource carrying capacity, environmental carrying capacity, and socioeconomic carrying capacity, as shown in Table 1.
Data standardization of evaluation indicators: This article encompasses a comprehensive system of indicators, featuring 3 criterion levels, 8 indicator levels, and 30 specific indicators. Indicators are categorized into positive and negative attributes to highlight their roles in evaluating resource and environmental capacities (Table 1). To eliminate dimensional disparities, we used the extreme value method for the standardization of the original data using the following formulas:
where
Results and analysis of standardized indicators: In this article, we applied the extreme value method to standardize the indicators. The resource, environmental, and socioeconomic capacities of the research region include both positive and negative attributes. For positive indicators, the optimal value is the maximum observed in each district. Conversely, for negative indicators, the minimum value serves as the optimal baseline. The standardized values were computed using corresponding formulas, resulting in transformed indicator values ranging from 0 to 1, with 1 being the maximum and 0 being the minimum.
3.2.2.2 Selection of the evaluation model
After standardizing the indicators, we used a comprehensive evaluation model to calculate the index values for each criterion level pertaining to the resource and environmental carrying capacity in the research region. The model is expressed as follows:
where
3.2.2.3 Introduction of the barrier model
The barrier degree model can be utilized to analyze the key factors contributing to disparities in the regional resource and environmental carrying capacity (Li et al., 2024; Ding et al., 2024). This model serves as a guiding tool to promote the efficient utilization of resources (Jia et al., 2017), such as land, within the research region by identifying and mitigating potential obstacles. By utilizing this model, we can effectively identify the primary barriers that impede the resource and environmental carrying capacity in the region. A higher barrier degree indicates a greater hindrance to achieving the region’s overall resource and environmental capacity goals, while a barrier degree of 0 suggests no hindrances to these objectives. The barrier degree model incorporates several important variables, including factor contribution
In this model, the indicator deviation
3.2.2.4 Pearson’s correlation analysis
Pearson’s correlation analysis is utilized to evaluate the linear relationship between two sets of indicators. A higher correlation coefficient indicates a stronger relationship. This method calculates the correlation coefficient between two variables and determines its statistical significance. The introduction of Pearson’s correlation analysis in this article aims to explore the linear associations among various evaluation indicators related to the resource and environmental carrying capacity in the research region. By examining these relationships, we can identify the critical factors that influence and determine the levels of resource and environmental carrying capacity in karst regions, as well as the primary obstacles. This comprehension enables targeted interventions to improve the area’s resource and environmental carrying capacity, fostering high-quality and sustainable socioeconomic development in the region.
where
4 Empirical analysis and result interpretation
4.1 Evaluation results of resource and environmental carrying capacity and spatial disparities
4.1.1 Evaluation result analysis
The comprehensive evaluation of standardized indicator data (Equations 4, 5) generated an index for resource and environmental carrying capacity across different regions within the research region, as shown in Tables 2, 3 (Equation 6).
4.1.1.1 Analysis of resource carrying capacity results
The findings correspond well with the regional resource endowments; regions with higher water resource indexes demonstrate greater resource carrying capacities. The sequence of resource carrying capacity, from highest to lowest, is as follows: Guanling, Ziyun, Xixiu, Pingba, Zhenning, and Puding. Regions like Xi Xiu and Ping Ba, located near Gui’an New District, exhibit high land resource scores but low water resource scores, while Guan Ling and Zi Yun present high water resource scores and moderate land resource scores. Notably, Guan Ling has the lowest region of stoneland desertification and the least annual per capita water usage, coupled with high average annual rainfall, resulting in the highest resource carrying capacity. Conversely, Pu Ding consistently shows low values, and it ranks second-highest in stoneland desertification, soil erosion, and flooded land area, while its per capita water resources and average annual rainfall are fifth in the region, culminating in the lowest resource carrying capacity evaluation and reflecting the existing disparities in resource distribution.
4.1.1.2 Analysis of environmental carrying capacity results
The evaluation of the environmental carrying capacity effectively illustrates the ecological heterogeneity of the research region. There is a strong correlation between the evaluation indexes and actual conditions. The comprehensive evaluation ranks the regions from highest to lowest as follows: Guan Ling, Xi Xiu, Zi Yun, Pu Ding, Zhen Ning, and Ping Ba. A disparity of more than 6-fold exists between the highest and lowest values. In terms of the 11 measured indicators, Guan Ling excels in 7 indexes, including average annual SO2 and NO2 concentrations and the proportion of karst land region, although it scores lower in water pollution capacity and wastewater treatment rates. Conversely, Ping Ba ranks the lowest across six indicators, reflecting overall poor environmental quality.
4.1.1.3 Analysis of economic and social carrying capacity results
The evaluation results reveal significant disparities in local economic and social development. The research region displays markedly higher scores for economic conditions than for social conditions, with high and low values typically present in the same regions. The ranking from high to low is as follows: Xi Xiu, Ping Ba, Zhen Ning, Pu Ding, Guan Ling, and Zi Yun. A 4-fold difference exists between the highest and lowest values. Among nine measured indicators, Xi Xiu and Ping Ba showed the highest values for per capita GDP and fixed asset investment, whereas Zi Yun ranks lowest in six indicators for per capita GDP and investment. The regions of Pu Ding, Zhen Ning, and Guan Ling fall in the moderate range. Geographically adjacent Xi Xiu and Ping Ba present high economic and social carrying capacities, while Zi Yun demonstrates the lowest value, indicating a strong correlation with the current state of economic and social development.
4.1.1.4 Comprehensive evaluation of the resource and environmental carrying capacity
The cumulative results, representing the collective evaluation of resource, environmental, and socioeconomic carrying capacities, are ranked from high to low as follows: Guan Ling, Xi Xiu, Zi Yun, Zhen Ning, Ping Ba, and Pu Ding. Guan Ling boasts the highest overall scores, particularly in resource and environmental capacities, reflecting abundant availability and favorable conditions of land and water resources, albeit with weaker socioeconomic conditions. Conversely, Xi Xiu shows high resource and environmental carrying capacities, along with the highest socioeconomic capacity, attributed to advantageous spatial characteristics. Conversely, Pu Ding is characterized by its lowest resource carrying capacity and intermediate environmental and socioeconomic development capacities, culminating in the lowest comprehensive carrying capacity, highlighting the region’s inadequate ecological and socioeconomic conditions.
4.1.2 Analysis of spatial disparities at the county level
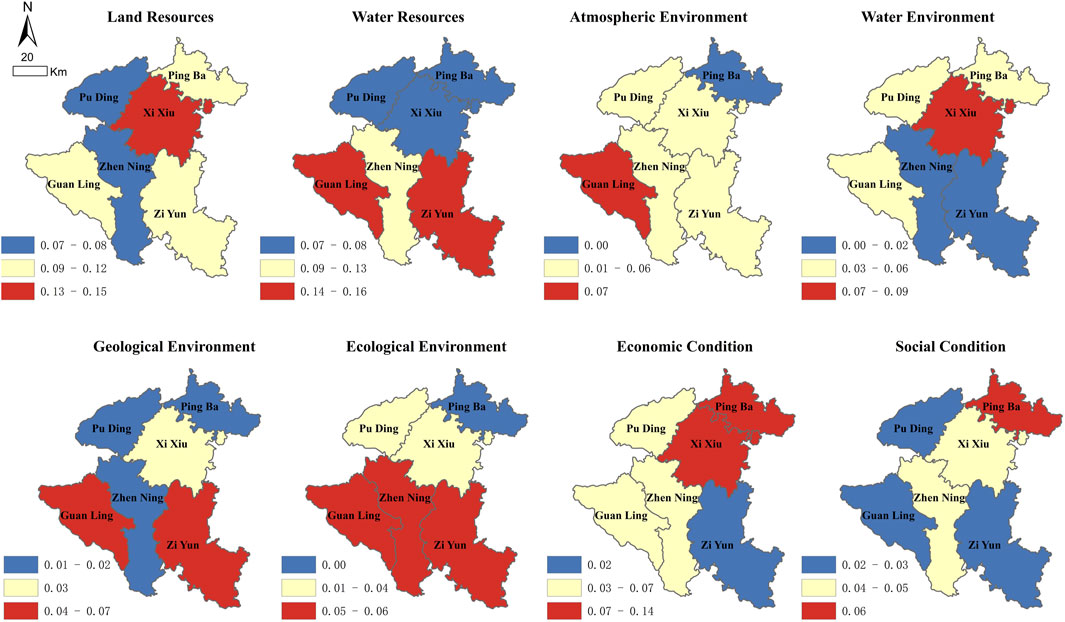
Utilizing the spatial analysis capabilities of ArcGIS 10.8, we conducted a comprehensive evaluation of the resource and environmental carrying capacity in the research region. The results are visually represented at the county level (Figure 4), illustrating the diverse spatial heterogeneity of these capacities. To categorize these results effectively, we applied the natural breaks method, which focuses on minimal intra-group variation and maximal inter-group variation, dividing the groups into three defined categories: “high,” “medium,” and “low.” Figures 4, 5 show that
(1) The overall evaluation of resource carrying capacity reveals a pronounced spatial distribution of “high in the south and low in the north,” which closely correlates with the region’s topographical features. Notably, high values are found in Zi Yun and Guan Ling, while Pu Ding reveals lower values. The spatial distribution of water and land resources demonstrates distinct disparities. Land resources generally follow a pattern of “low in the center, high at both ends,” with Xi Xiu standing out as a high-value region. Conversely, water resources display a distribution pattern of “high in the south, low in the north,” with significant values also shown in Zi Yun and Guan Ling.
(2) The comprehensive assessment scores for environmental carrying capacity exhibit a similar “high in the south, low in the north” distribution, closely linked to the region’s topography. Guan Ling receives high scores, while Ping Ba presents lower and intermediate values. The differences between high and low scores highlight notable gaps in environmental capacity evaluations. Patterns in atmospheric, geological, and ecological environment scores are comparable, with mid–high values clustered in the southwestern regions, particularly in Guan Ling and Zhen Ning, as well as in southeastern Zi Yun. In contrast, water environment scores indicate a “high in the north, low in the south” trend, with Xi Xiu presenting a noteworthy high score across four evaluation indicators, emphasizing the substantial disparity between high and low values. Additionally, Ping Ba shows some indicators with a minimum score of 0, emphasizing the spatial heterogeneity in environmental capacity evaluations.
(3) The social and economic carrying capacity scores reveal a spatial pattern of “high in the northeast, low in the southeast, and mid-values in the central and western regions.” Regions such as Xi Xiu and Ping Ba, which are adjacent to the Guian New District, exhibit higher values, whereas Zi Yun shows a lower score. Significant differences in economic and social conditions are evident in towns like Guan Ling and Pu Ding, reflecting a similar spatial distribution of high and low values, indicating a spatial homogeneity in socioeconomic carrying capacity assessments.
(4) Finally, the overall evaluation scores for carrying capacity consistently exhibit a “high in the south, low in the north” distribution. This pattern is significantly influenced by environmental and resource carrying capacities rather than socioeconomic factors. The northern areas, particularly Ping Ba and Pu Ding, present lower values, while Xi Xiu and Guan Ling display higher scores, reinforcing the identified spatial disparities in the carrying capacity within the region.
4.2 Statistical correlation analysis
This section presents a statistical analysis of the relationships among the resource carrying capacity, environmental carrying capacity, socioeconomic carrying capacity, and overall carrying capacity in the research region. Utilizing univariate linear regression to fit the data and assessing the linear correlation coefficients (Figure 6), we find a strong linear relationship among the resource carrying capacity, environmental carrying capacity, and overall carrying capacity. To further elucidate the interdependencies among these indicators, we applied Pearson’s correlation coefficient method for correlation analysis (Figures 7, 8) (Equations 10, 11).

Figure 6. Linear fitting chart of resource carrying capacity, environmental carrying capacity, socioeconomic carrying capacity, and comprehensive carrying capacity (95% confidence interval).
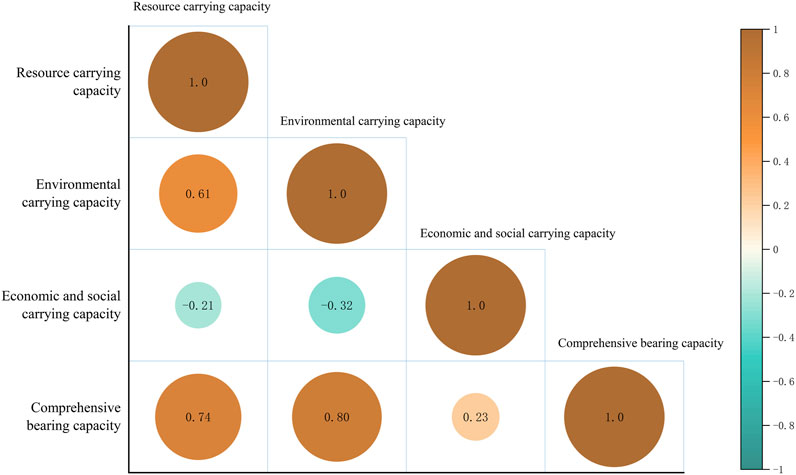
Figure 7. Pearson’s correlation coefficient chart of comprehensive evaluation scores at the criterion level.
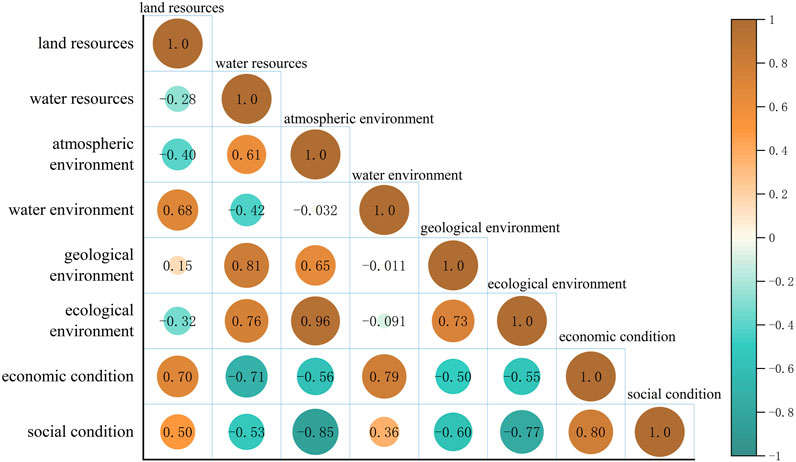
Figure 8. Pearson’s correlation coefficient chart of comprehensive evaluation scores at the indicator level.
The analysis of the standard layers (Figure 7) reveals significant medium-to-high positive correlations and resource carrying capacity, with environmental capacity (0.61) and overall capacity (0.74). The environmental capacity correlates with the overall capacity (0.80). Conversely, the socioeconomic carrying capacity shows no significant correlations with the resource carrying capacity (−0.21), environmental capacity (−0.32), or overall capacity (0.23). These results indicate that resource and environmental capacities have a significantly greater influence on the overall carrying capacity than socioeconomic indicators. A detailed statistical analysis of the indicator levels (Figure 8) reveals several key relationships:
(1) Land and water resources show differentiated correlations with other indicators, highlighting a strong connection between land resources and socioeconomic factors, as well as a robust relationship between water resources and environmental elements. Specifically, land resources show medium-to-high positive correlations with the water environment (0.68), economic status (0.70), and social status (0.50). Water resources also show strong positive correlations with the atmospheric environment (0.61), ecological environment (0.81), and ecological environment (0.76). However, there are significant negative correlations between water resources and economic status (−0.71) and social status (−0.53).
(2) Within the environmental dimension, complex interdependencies exist among the indicators. Except for the water environment, there are notable negative correlations between environmental indicators and socioeconomic indicators. Significant positive correlations are evident between the atmospheric and geological environments (0.65), atmospheric and ecological environments (0.96), and geological and ecological environments (0.73). Other correlations within this dimension tend to be weaker, while the water environment positively correlates with economic status (0.79) and social status (0.36).
(3) The intricate relationships between resource carrying capacity and both environmental and socioeconomic capacities reveal that socioeconomic indicators significantly correlate with land resources, while environmental indicators strongly associate with water resources. Socioeconomic indicators show negative correlations with environmental indicators, despite having a high positive correlation (0.80) within their own dimension.
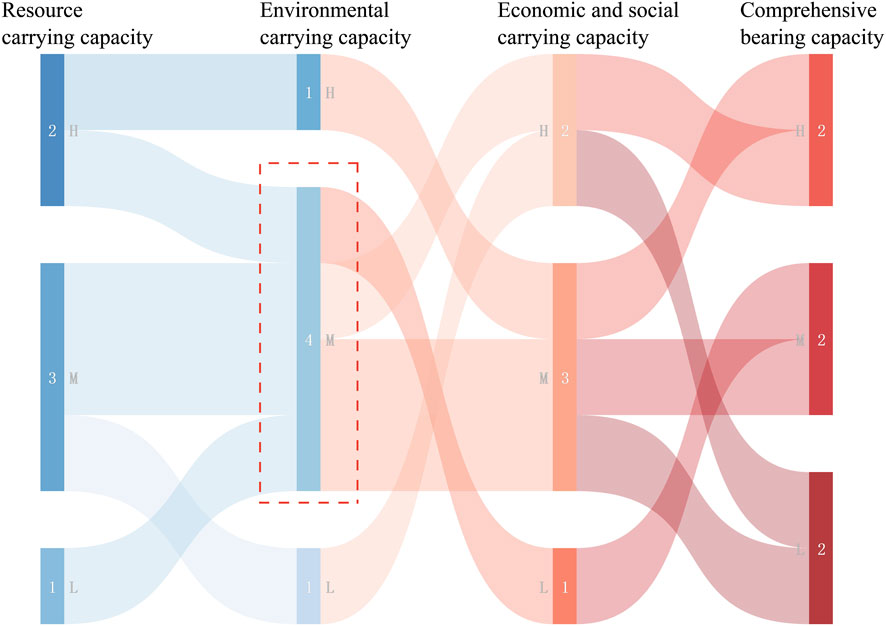
In addition, we categorized the comprehensive scores of the standard layers into “high, medium, and low” using the natural-breaks method. This classification is visualized through alluvial diagrams (Figure 9), illustrating the flow of scores among the different capacities. The diagrams reveal complex interrelations driven by the region’s diverse resources, environments, and socioeconomic characteristics within the karst region. Notably, resource carrying capacity nodes primarily consolidate into an “M” category of environmental capacity, which then subsequently disperses into “H,” “M,” and “L” nodes for socioeconomic capacity. In turn, these socioeconomic nodes flow into overall capacity nodes. Notably, no cross-layer transitions occur between the resource and environmental capacities at an “H-L” level, indicating a stable relationship. However, socioeconomic capacity nodes exhibit cross-layer transitions, highlighting the intricate socioeconomic dynamics and their minor impact on the overall carrying capacity.
4.3 Analysis of obstacle factors
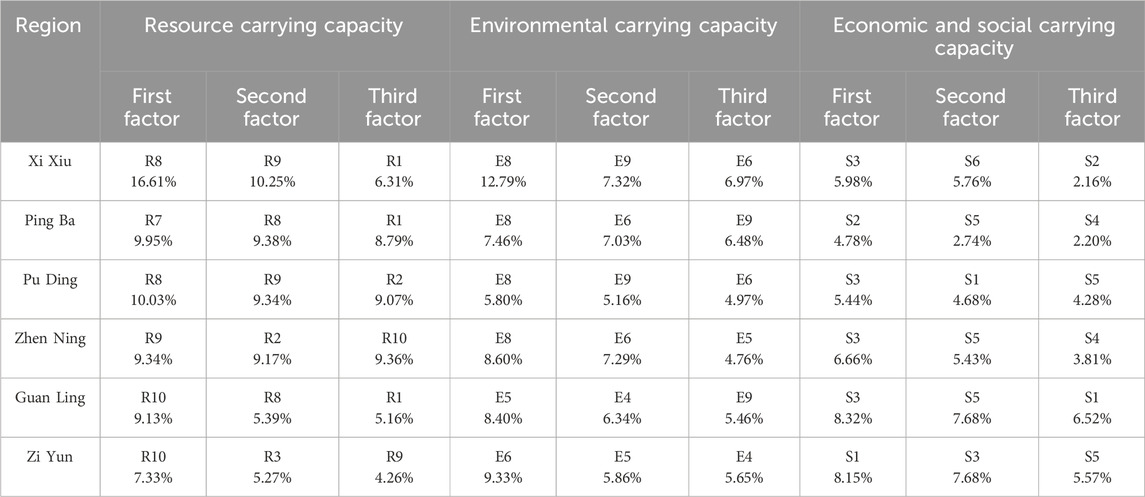
Given the extensive number of indicators, this article focuses on Equations 7–9 the top three obstacle factors ranked by their severity (Table 4).
4.3.1 Obstacle factors impacting the resource carrying capacity
Water resources pose a greater challenge than land resources regarding the overall carrying capacity (Figure 10). Notable spatial disparities exist between water and land resources. Important factors influencing the resource carrying capacity include per capita water availability (R8), average annual precipitation (R9), per capita arable land area (R1), water resource utilization rate (R10), and proportion of rocky desertification region (R2). Notably, R8, R9, and R10, which pertain to water resources, often rank as primary or secondary factors. This indicates that water scarcity is the primary impediment to resource carrying capacity in karst regions. The findings reveal a discrepancy between water availability and the overall resource carrying capacity, highlighting the need for improved coordinated management of water resources. Additionally, the abundance of per capita arable land area (R1) and the proportion of rocky desertification area (R2) further impede resource capacity. This contributes to significant regional disparities, with regions like Xi Xiu exhibiting strong land resource support, while regions such as Pu Ding and Zhen Ning show comparatively weak support. In terms of water resources, Zi Yun and Guan Ling have considerable support, whereas Pu Ding, Xi Xiu, and Ping Ba are notably weaker.
4.3.2 Obstacle factors impacting the environmental carrying capacity
The obstacle factors affecting environmental carrying capacity are more complex. Notably, key barriers include forest coverage and the proportion of karst areas, which are more significant than other elements (Figure 10). Factors such as the area proportion of ecological protection zones (E6), proportion of the karst area (E8), forest coverage (E9), water pollutant absorption capacity (E5), and centralized sewage treatment rate (E4) frequently emerge as key obstacles. The karst region proportion (E8) is particularly impactful, frequently ranking as a primary obstacle, thereby indicating its substantial restriction on enhancing environmental carrying capacity. The variables E6, E5, and E4 emphasize the strong influence of water environment factors on environmental capacity. Furthermore, forest coverage (E9), classified within the ecological environment dimension, significantly hinders the overall environmental carrying capacity.
4.3.3 Obstacle factors affecting the economic and social carrying capacity
The primary obstacle factors impacting the economic and social carrying capacity are predominantly economic in nature. The industrial development across the six counties lags behind population and social development (Figure 10). This disparity highlights the need for coordinated efforts to elevate economic levels and promote the mutual reinforcement of population dynamics and industrial growth. Key factors influencing economic and social carrying capacity include per capita fixed asset investment (S3), disposable income of rural residents (S5), per capita GDP (S1), the contribution of the tertiary sector to the GDP (S2), and disposable income of urban residents (S4). The indicators S3 and S5 illustrate how these economic factors constrain the development of the overall economic carrying capacity in the region. There is significant economic disparity among the regions, with Ping Ba and Xi Xiu performing better, while Zi Yun ranks lowest. This economic inequality closely correlates with resource and environmental factors, revealing a disconnection between industrial and social development in karst regions.
5 Discussion and conclusion
5.1 Discussion
In Southwest China, karst topography presents several challenges, including poor soil quality, rock desertification, and water scarcity, which profoundly affect the region’s sustainable socioeconomic development. Therefore, constructing a technical framework and indicator system for analyzing resource and environmental carrying capacity aligned with ecological civilization principles is essential. The proposed evaluation index system for assessing resource and environmental carrying capacity is well-suited to challenges specific to karst regions, such as rocky desertification, water scarcity, and soil erosion. However, its applicability across regions with varied ecological types and developmental stages may be limited. Although the focus on karst-specific environmental factors enhances precision, broadening this framework’s application would require integrating flexible, region-specific indicators to capture diverse ecological and developmental characteristics.
(1) This technical framework is developed based on existing research to provide insights for specific regions’ carrying capacity evaluation. The proposed framework entails a process of “problem design–problem decomposition–decision assessment,” beginning with the identification of conflicts among resource, environmental, and socioeconomic factors. This framework aims to clearly define primary issues to ensure targeted decision-making. Moreover, its value extends beyond its theoretical application, offering practical guidance for spatial planning in karst regions through the integration of regional realities and optimization of resource, production, and ecological spaces while facilitating viable technical solutions.
(2) The comprehensive evaluation indicator system emphasizes regional characteristic elements.1 The interplay of these factors demonstrates a system of mutual causality and interaction, reflecting the area’s resource endowments and socioeconomic realities. Many current studies on carrying capacity indicator systems tend to overlook the significance of regional characteristics in indicator design and weight settings, often neglecting the ecological constraints on development initiatives. This article addresses this gap by proposing a comprehensive evaluation indicator system that combines the resource carrying capacity, environmental carrying capacity, and socioeconomic carrying capacity, aimed at effectively analyzing key issues and obstacles in the research area. The evaluation results reveal that the comprehensive carrying capacity is relatively high in the central region, especially in Xi Xiu and the southern area of Guan Ling, while the northern regions, like Ping Ba and Pu Ding, display lower capacities. The resource carrying capacity is highest in the southern counties, such as Guan Ling and Zi Yun, diminishing northward toward Ping Ba. Regarding the environmental carrying capacity, Guan Ling represents a high-value area compared to the lower-value zone in northeastern Ping Ba. Economic and social capacities show a more favorable profile in the central and northern regions, whereas the middle and southwest regions have lower ratings. Notably, these empirical findings correspond with the geographical economic realities of the research area. Furthermore, the analysis also highlights that critical resource and environmental deficiencies have not received adequate attention, underscoring the necessity for strengthened monitoring and assessment of these dynamic changes to effectively guide regional development in the future.
(3) This article thoroughly analyzes the key factors influencing resource and environmental carrying capacity through the integration of multiple data sources. It shifts the focus from a localized perspective to a holistic view, emphasizing the balance between resource utilization and conservation. By introducing an obstacle degree model, this article identifies primary constraints, such as water resources and rock desertification, assessing their significance in order to inform subsequent improvement measures. Challenges in karst regions are interconnected issues arising from a complex interplay of multi-dimensional factors. Future research should aim to distill the insights obtained from the model’s results into practical regional development policies.
(4) The application of Pearson’s correlation analysis provides a robust methodological tool for understanding the inherent relationships among various obstacle factors in karst regions, facilitating region-specific optimization strategies. Current research frequently fails to analyze these internal correlations adequately, which undermines the effectiveness of resource and environmental policy implementation. This article visually illustrates the associations among factors through Pearson’s correlation coefficient diagrams and scatter plots, highlighting the importance of integrating quantitative analysis with systematic thinking. This approach will enhance the theoretical, methodological, and technical aspects of carrying capacity analysis and evaluation. Future research should concentrate on the diversity of factor characteristics and their dynamic interconnections, analyzing the intricate relationships underlying carrying capacity and reconsidering the networks of interaction between humans and nature, as well as between humans and society.
This article systematically constructs a technical framework and an indicator system for analyzing the resource and environmental carrying capacity in karst regions within the constraints of ecological civilization. It highlights the dialectical relationship among various environmental and social factors. Future research should prioritize the integration between qualitative and quantitative analyses, utilizing multi-dimensional, multi-method, and multi-spatial scale approaches to deeply examine the current characteristics and relational dynamics of resources, environment, ecology, and social development in karst regions. This approach will enable the implementation of targeted measures to improve resource and environmental quality while respecting natural systems.
5.2 Conclusion and policy implementation
5.2.1 Conclusion
This article provides a comprehensive analysis of the resource and environmental carrying capacity of Anshun City, a typical karst region in Guizhou Province, China, within the context of ecological civilization. It establishes a three-dimensional integrated evaluation framework that encompasses resource, environmental, and socioeconomic capacities, using quantitative research methods to better facilitate regional socioeconomic development. This article contributes a robust technical framework and case studies to support the advancement of ecological civilization while introducing new methodologies and theoretical insights.
The principal findings are summarized as follows: ① the novel technical framework for comprehensive evaluation effectively addresses current research limitations by systematically examining regional resources, environmental factors, and socioeconomic characteristics within the framework of ecological civilization, which enables empirical assessments of karst regions. Subsequently, it provides practical policy recommendations to improve the resource and environmental carrying capacity in these regions, contributing to a deeper theoretical and technical foundation for conducting carrying capacity analyses in karst environments. ② The integrated index system, which combines resource, environmental, and socioeconomic factors, demonstrates strong adaptability to contemporary regional challenges and research demands. Unique indicators, such as the proportion of rock desertification and karst regions, effectively reflect the distinctive ecological characteristics of these regions. By systematically adjusting weights to reflect the diverse impacts of each indicator on the carrying capacity, the evaluations ensure objectivity and reliability. Higher weights are allocated to indicators representing the specific features and limitations of karst regions, while varied values are allocated to guiding indicators pertaining to the environmental carrying capacity, effectively integrating regional resource characteristics and development stages. This article enhances the relevance and practicality of the evaluation system, fostering a nuanced response to the specific conditions of karst regions. ③ The article also identifies critical factors that impede the resource and environmental carrying capacity in karst regions, providing a solid foundation for regional policy development. The implementation of an obstacle degree model enriches the analysis, providing increased usability and depth in assessing the carrying capacity related to resources, the environment, and socioeconomics. This model highlights significant obstacle factors that affect evaluations, granting insights that can improve regional resource and environmental carrying capacities. ④ Additionally, the intricate interrelations among various indicator factors were clarified, emphasizing the significant influence of characteristic resources on the carrying capacities in karst regions. Pearson’s correlation analysis has elucidated these complex interactions, revealing that the impact of resource and environmental carrying capacities on the overall carrying capacity surpasses that of socioeconomic factors. The assessment portrays a distinctive environmental carrying capacity focused on water resources while indicating a strong correlation between land resources and socioeconomic capacities. Here, water resources reflect resource disparities, while land resources reveal variations in socioeconomic development. ⑤ Lastly, the delay in economic and social development notably restricts the advancement of comprehensive carrying capacities in the karst region. The region’s inadequate resource endowment and low levels of economic development impede overall enhancements in carrying capacity. Socioeconomic factors play a notable obstructive role in bolstering socioeconomic capacities, as reflected in the underdevelopment of industrial sectors across the six counties compared to their population and social growth. Therefore, it is imperative to promote economic development indicators holistically across the region while tailoring support strategies to address the diverse developmental stages of different regions.
5.2.2 Policy implications
The main policy recommendations for enhancing the overall resource and environmental carrying capacity are as follows: ① lead by the natural resource management authorities to draft technical standards for assessing the carrying capacity in karst regions. This approach will ensure that evaluations are scientifically robust and tailored to the unique challenges of these regions. ② Focus on improving resource and environmental carrying capacity in the northern regions to promote high-quality and coordinated economic growth. The existing advantages of the southern counties should be utilized to support the northern regions’ shift toward greener, low-carbon production through technological innovation. ③ Strengthen market-oriented resource allocation and environmental protection efforts by rigorously controlling pollution emissions from industrial and daily activities while reducing disparities between different regions. ④ Establish targeted regional initiatives for optimizing water resource management to improve the ecological status in karst regions. This approach should consider the distinct resource and environmental attributes of the region, guiding ecological civilization construction and development in a targeted manner. ⑤ Enhance the capacity for resource and environmental carrying, as well as high-quality development within the research area, by accelerating green technology innovations. The advantages of northern counties in funding, technology, and talent should be leveraged to implement energy-saving and emission-reduction initiatives and foster collaboration with the southern and southwestern counties.
Data availability statement
The original contributions presented in the study are included in the article/supplementary material; further inquiries can be directed to the corresponding author.
Author contributions
WY: conceptualization, data curation, formal analysis, funding acquisition, methodology, project administration, resources, software, supervision, validation, writing–original draft, and writing–review and editing. XL: data curation, formal analysis, investigation, methodology, resources, software, validation, and writing–original draft. YY: conceptualization, data curation, formal analysis, investigation, methodology, resources, software, validation, visualization, writing–original draft, and writing–review and editing.
Funding
The author(s) declare that financial support was received for the research, authorship, and/or publication of this article. This work was supported the Guizhou Province 2022 Philosophy and Social Sciences Planning Project (grant number 22GZYB54).
Conflict of interest
The authors declare that the research was conducted in the absence of any commercial or financial relationships that could be construed as a potential conflict of interest.
Publisher’s note
All claims expressed in this article are solely those of the authors and do not necessarily represent those of their affiliated organizations, or those of the publisher, the editors, and the reviewers. Any product that may be evaluated in this article, or claim that may be made by its manufacturer, is not guaranteed or endorsed by the publisher.
Footnotes
1Pay special attention to the regional characteristic elements such as rocky desertification, water and soil loss, water resources, economic level, and social development in the karst region.
References
Chen, Y., Liu, S., Ma, W., and Zhou, Q. (2023). Assessment of the carrying capacity and suitability of spatial resources and the environment and diagnosis of obstacle factors in the yellow river basin. Int. J. Environ. Res. Public Health 20, 3496. doi:10.3390/ijerph20043496
Ding, Y. L., Li, X. L., Liu, J., Song, J., and He, H. (2024). Sustainable development process and mechanism of urbanization in border cities in Northeast China: a case study of Dongning and Hunchun. Sci. Geogr. Sin. 44 (3), 474–482. doi:10.13249/j.cnki.sgs.20230573
Fan, J. (2007). Scientific basis for the zoning of principal functional areas in China. Geogr. J. 62 (4), 339–350. doi:10.11821/xb.2007.04.001
Feng, Z., You, Z., Yang, Y., and Shi, H. (2021). Comprehensive evaluation of resource and environment carrying capacity of Tibet based on a three-dimensional tetrahedron model. Geogr. J. 76 (3), 645–662. doi:10.11821/dlxb202103011
Gao, W., Chen, Y., Yan, C. A., and Li, J. C. (2020). Water environmental carrying capacity assessment based on ecosystem purification and human regulation coupling effect. Acta Ecol. Sin. 40 (14), 4803–4812. doi:10.5846/stxb201904190794
Ge, W., Chang, L., Qi, Z., Meng, F., and Liang, X. (2021). Development tendency analysis for the water resource carrying capacity based on system dynamics model and the improved fuzzy comprehensive evaluation method in the changchun city, China. Ecol. Indic. 122, 107232. doi:10.1016/j.ecolind.2020.107232
Huang, X. (2017). Strategic space construction of the yangtze river economic belt based on resources and environment carrying capacity. Environ. Prot. (15), 25–26. doi:10.14026/j.cnki.0253-9705.2017.15.004
Huang, X., and Song, Y. (2019). Evaluation model of regional resource and environment comprehensive carrying capacity based on the conjugation-wrestling mechanism. J. Nat. Resour. 34 (10), 2103–2112. doi:10.31497/zrzyxb.20191007
Jia, K. J., Zhang, H., Xu, X. L., 徐小黎, , 祁帆, , Hui, Z., et al. (2017). Evaluation techniques of land resources carrying capacity catering to land development and utilization. Prog. Geogr. 36 (3), 335–341. doi:10.18306/dlkxjz.2017.03.009
Jia, W., Xia, J., Gong, Z., and Cao, K. (2020). Dynamic assessment of tourism carrying capacity and its impacts on tourism economic growth in urban tourism destinations in China. J. Destination Mark. and Manag. 15, 100383. doi:10.1016/j.jdmm.2019.100383
Li, J. L., Pan, J. R., Feng, F., Peng, X., and Liu, C. (2024). Coupling coordination development of PWEE system and obstacle factors in nine provinces/regions of the Yellow River Basin. J. Water Resour. and Water Eng. 35 (01), 47–56. doi:10.11705/j.issn.1672-643X.2024.01.06
Li, Q., Wu, J., Su, Y., Zhang, C., Wu, X., Wen, X., et al. (2022). Estimating ecological sustainability in the guangdong-Hong Kong-Macao greater bay area, China: retrospective analysis and prospective trajectories. J. Environ. Manag. 303, 114167. doi:10.1016/j.jenvman.2021.114167
Lin, A., Liu, Y., Zhou, S., Zhang, Y., Wang, C., and Ding, H. (2023). Data-driven analysis and evaluation of regional resources and the environmental carrying capacity. Sustainability 15, 8372. doi:10.3390/su15108372
Liu, M. H., Xi, J. C., and Chen, S. H. (2020). Ecological carrying capacity accounting model and application in multi-type protected areas.Acta. Ecol. Sin. 40 (14), 4794–4802. doi:10.5846/stxb201905181028
Liu, R. Z., and Borthwick, A. G. L. (2011). Measurement and assessment of carrying capacity of the environment in Ningbo, China. J. Environ. Manag. 92 (8), 2047–2053. doi:10.1016/j.jenvman.2011.03.033
Liu, X., Tang, L., Sun, D., Li, Y., Xu, M., Kang, X., et al. (2023). Comprehensive evaluation of resources and environmental carrying capacity in guangdong coastal zone. Trop. Geogr. 43 (3), 459–473. doi:10.13284/j.cnki.rddl.003644
Liu, Y., Qu, Y., Cang, Y., and Ding, X. (2022). Ecological security assessment for megacities in the yangtze river basin: applying improved emergy-ecological footprint and dea-sbm model. Ecol. Indic. 134, 108481. doi:10.1016/j.ecolind.2021.108481
Luo, W., Shen, L., Zhang, L., Liao, X., Meng, C., and Jin, C. A. (2022). A load-carrier perspective method for evaluating land resources carrying capacity. Int. J. Environ. Res. Public Health 19, 5503. doi:10.3390/ijerph19095503
Min, X., Wang, Y., and Chen, J. (2022). Resource carrying capacity evaluation based on fuzzy evaluation: validation using karst landscape region in southwest China. Sustainability 14, 16548. doi:10.3390/su142416548
Niu, F., Yang, X., and Sun, D. (2020). Water and soil carrying capacity and adjustment of industrial structure in hainan province tropical geography, 40(6), 1109–1116. doi:10.13284/j.cnki.rddl.003281
Niu, F. Q., Feng, Z. M., and Liu, H. (2018). A review on evaluating methods of regional resources and environment carrying capacity. Resour. Sci. 40 (4), 655–663. doi:10.18402/resci.2018.04.01
Park, R. E., and Burgess, E. W. (1921). Introduction to the science of sociology. Chicago: The University of Chicago Press.
Peng, T., Deng, H., Lin, Y., and Jin, Z. (2020). Assessment on water resources carrying capacity in karst areas by using an innovative DPESBRM concept model and cloud model. Sci. total Environ. 767, 144353. doi:10.1016/j.scitotenv.2020.144353
Shao, Y. S., Wang, H. F., and Yin, C. Y. (2013). Evaluation method of urban land population carrying capacity based on GIS-A case of Shanghai, China. Comput. Environ. and Urban Syst. 39, 27–38. doi:10.1016/j.compenvurbsys.2013.02.002
Shen, L., Cheng, G., Du, X., Meng, C., Ren, Y., and Wang, J. (2022). Can urban agglomeration bring “1 + 1 > 2Effect”? A perspective of land resource carrying capacity. Land Use Policy 117, 106094. doi:10.1016/j.landusepol.2022.106094
Sun, M., Wang, J., and He, K. (2020). Analysis on the urban land resources carrying capacity during urbanization:A case study of Chinese YRD. Appl. Geogr. 116 (2), 102170. doi:10.1016/j.apgeog.2020.102170
Tan, K., Yan, Z., Zhao, Z., Pu, J., Li, S., Miao, P., et al. (2020). Evaluation of resource and environmental carrying capacity of wenshan city in karst area based on fuzzy model. Soil Water Conservation Res. 28 (1), 218–227. doi:10.13869/j.cnki.rswc.2021.01.028
Wang, B., and Wang, X. (2022). Comprehensive evaluation of resources and environment carrying capacity in karst areas: take Guizhou as an example. J. Hunan Univ. Sci. Technol. Nat. Sci. Ed. 37 (1), 118–124. doi:10.13582/j.cnki.1672-9102.2022.01.016
Wang, J., Huang, Y., Wu, L., Jing, P., Li, J., Ouyang, S., et al. (2023a). Review on resource and environmental carrying capacity of mining areas in China. Environ. Rev. 31(2):218–228. doi:10.1139/er-2022-0093
Wang, M., Liu, M., Zhang, D., Qi, J., Fu, W., Zhang, Y., et al. (2023b). “Assessing and optimizing the hydrological performance of Grey-Green infrastructure systems in response to climate change and non-stationary time series,” in Water research. United Kingdom: A journal of the international water association.
Wei, L., Jin, C., and Lu, Y. (2019). Exploring resources and environmental carrying capacities at the county level: a case study of China’s Fengxian County. PLoS ONE 14, e0225683. doi:10.1371/journal.pone.0225683
Wu, X., and Hu, F. (2020). Analysis of ecological carrying capacity using a fuzzy comprehensive evaluation method. Ecol. Indic. 113, 106243. doi:10.1016/j.ecolind.2020.106243
Yang, J., Lei, K., Khu, S., and Meng, W. (2015). Assessment of water resources carrying capacity for sustainable development based on a system dynamics model:A case study of tieling city, China. Water Resour. Manag. 29 (3), 885–899. doi:10.1007/s11269-014-0849-y
Yang, L., and Wang, L. (2022). Comprehensive assessment of urban water resources carrying capacity based on basin unit: a case study of Qingdao, China. Water supply 22 (2), 1347–1359. doi:10.2166/ws.2021.351
Yang, Q., Zhang, F., Jiang, Z., Yuan, D., and Jiang, Y. (2016). Assessment of water resource carrying capacity in karst area of Southwest China. Environ. earth Sci. 75, 37. doi:10.1007/s12665-015-4816-6
Keywords: resource and environmental carrying capacity evaluation, ecological civilization, analytical framework, index system, karst regions, obstacle degree model, Pearson’s correlation analysis
Citation: Yang W, Li X and Yang Y (2024) Technical framework and empirical analysis of resource and environmental carrying capacity evaluation in karst regions under the constraint of ecological civilization. Front. Environ. Sci. 12:1499757. doi: 10.3389/fenvs.2024.1499757
Received: 21 September 2024; Accepted: 13 November 2024;
Published: 27 November 2024.
Edited by:
Celso Santos, Federal University of Paraíba, BrazilReviewed by:
Ying Zhu, Xi’an University of Architecture and Technology, ChinaShanzhong Qi, Shandong Normal University, China
Copyright © 2024 Yang, Li and Yang. This is an open-access article distributed under the terms of the Creative Commons Attribution License (CC BY). The use, distribution or reproduction in other forums is permitted, provided the original author(s) and the copyright owner(s) are credited and that the original publication in this journal is cited, in accordance with accepted academic practice. No use, distribution or reproduction is permitted which does not comply with these terms.
*Correspondence: Yuchi Yang, eWFuZ3l1Y2hpcGxhbkBvdXRsb29rLmNvbQ==
 Wei Yang
 Xiaohua Li
 Yuchi Yang