- 1School of Economics and Management, Civil Aviation Flight University of China, Guanghan, China
- 2School of Economics, Sichuan University, Chengdu, China
- 3Chengdu Low altitude Economy High quality Development Research Center, Chengdu, China
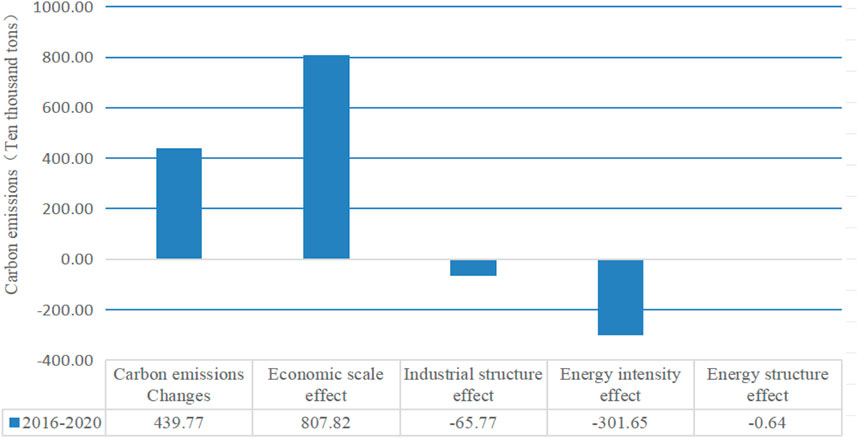
As the proportion of carbon emissions from urban areas rises, cities like Chengdu have become critical frontiers for emission reduction in China. Consequently, constructing low-carbon cities has emerged as the primary strategy for mitigating carbon emissions. According to the LMDI additive decomposition analysis, Chengdu’s carbon emissions increased by 4,397,700 tons during the 13th Five-Year Plan, primarily due to economic expansion, which alone accounted for an increase of 8,078,200 tons. Meanwhile, shifts in industrial structure and reductions in energy intensity contributed to declines of 657,700 tons and 3,016,500 tons, respectively, while changes in energy structure resulted in a marginal decrease of 640 tons. The LMDI multiplicative decomposition indicates a 10.3% growth in carbon emissions, with economic size amplifying emissions by 1.197 times, while enhanced energy intensity mitigated growth, reducing emissions to 0.935 times 2016 levels. Adjustments in industrial and energy structures exerted minimal impact on emission reductions. By developing a decomposition model for carbon emission influencing factors across various industries, this study identifies challenges to economic growth within the context of carbon reduction constraints and proposes pathways for low-carbon city development, including industrial restructuring, urban optimization, green building initiatives, and comprehensive transportation systems, thereby offering valuable insights for national low-carbon city initiatives.
1 Introduction
“Establishing a comprehensive green, low-carbon, and circular economic system” is a critical strategy endorsed by the Chinese Government to ensure sustainable economic growth. The Western region, characterized by ecological vulnerability and uneven development, must transition from traditional, inefficient growth models to high-quality development through low-carbon transformation. Cities, responsible for 75% of global energy consumption and 80% of carbon emissions (IPCC, 2014), are pivotal in this shift. As urbanization intensifies, so do carbon emissions, making low-carbon urban development a priority for emission reduction in China.
Chengdu is proactively addressing climate change by promoting the deindustrialization of traditional sectors and the adoption of ecological practices, striving to become a carbon-neutral “pioneer city.” In the long term, these efforts will drive sustainable economic growth. However, in the short term, stringent carbon reduction measures may increase resource consumption, require significant investment in emission reduction technologies, and challenge regional economic growth by affecting high-energy industries. Thus, Chengdu faces the pressing challenge of developing an urban strategy that balances economic growth with low-carbon transformation.
Since the reform and opening-up, Chengdu’s economy has grown significantly, primarily by leveraging low labor, land, and environmental costs to attract foreign investment and industrial transfers. However, rising costs, capital and technology shortages, and the diminishing appeal of low-cost factors have led to an industrial shift to cheaper regions and abroad. Moreover, Chengdu’s environmental capacity is nearing its limit, and the city relies heavily on external energy sources. The current low-cost, inefficient growth model is unsustainable, necessitating a shift towards energy conservation, emission reduction, and high-quality industrial development.
In 2020, the COVID-19 pandemic posed a significant threat, compounded by an unpredictable global landscape, declining international trade, and adjustments in real estate and manufacturing investments. Many low-end production capacities failed to meet the demands of an evolving domestic consumption structure, leaving much of the production unmarketable. To address these challenges, Chengdu must lead in achieving carbon peaking and promoting high-quality industrial development. This can be accomplished by increasing the share of advanced manufacturing, strategic emerging industries, and high-tech sectors while transforming traditional industries like light industry, food, and building materials (Wang, 2016).
The Ninth Plenary Session of the Thirteenth CPC Committee of Chengdu adopted two key decisions: one on constructing a Park City Demonstration Zone that embodies the New Development Concept, and another on promoting the development of a Scientific and Technological Innovation Center to create a high-quality modern industrial system. These decisions mark a firm commitment to Chengdu’s trajectory as a low-carbon city (Zhu et al., 2021).
This study aims to explore how Chengdu can effectively implement low-carbon city construction under the relationship between carbon emission growth and economic development. Therefore, the Logarithmic Mean Divisia Index (LMDI) method was used to analyze the carbon emission dynamics of Chengdu during the 13th Five Year Plan period through addition and multiplication decomposition. The research data mainly comes from carbon emission statistics and economic indicators in Chengdu, covering multiple dimensions such as economic scale, industrial structure, energy intensity, and energy structure. The results showed that Chengdu’s carbon emissions increased by 4.3977 million tons during this period, with the expansion of economic scale being the main driving factor, while the increase in energy intensity was the key to suppressing the growth rate of carbon emissions. In addition, the study also identified the problems faced by economic growth under carbon emission reduction constraints and proposed a series of low-carbon urban development paths such as adjusting industrial structure, optimizing urban layout, developing green buildings, and building comprehensive transportation systems.
The remainder of this paper is structured as follows. Section 2 reviews the relevant literature. Section 3 presents the methodologies and data. Section 4 provides empirical results and discussion analysis. Section 5 concludes the paper.
This study makes the following contributions:
(1) Application of quantitative analysis methods: By adopting LMDI additive and multiplicative decomposition methods, the growth of carbon emissions in Chengdu and its influencing factors are systematically quantitatively analyzed, providing an effective tool and framework for studying the dynamics of urban carbon emissions.
(2) Comprehensive assessment of carbon emission influencing factors: The impacts of economic scale, industrial structure, energy intensity, and energy structure on carbon emissions are thoroughly explored, the contributions of each factor are quantified, and the complex relationship between economic growth and carbon emission reduction is revealed.
(3) Problem Identification and Path Suggestion: By constructing a decomposition model of carbon emission influencing factors of different industries, the problems faced by Chengdu’s economic growth under the constraints of carbon emission reduction are identified, and paths for low-carbon city development from adjusting the industrial structure, optimizing the urban layout, developing green buildings and constructing an integrated transportation system are proposed.
(4) A reference value for national dissemination: It provides valuable experience and reference for other cities and the construction of low-carbon cities nationwide, and promotes the popularization and practice of the concept of low-carbon development.
(5) These contributions provide theoretical support and practical guidance for Chengdu and similar cities in tackling the challenge of carbon emissions and realizing sustainable development.
2 Literature review
2.1 The relationship between carbon emissions and economic growth
2.1.1 Granger causality test of carbon emissions and economic growth
Dinda and Coondoo (2006) analyzed carbon emissions and economic growth data from 88 countries between 1960 and 1990 using a panel data model. Their findings revealed a one-way causality from economic growth to carbon emissions in American countries, from carbon emissions to economic growth in European countries, and a bidirectional causality in African countries (Dinda and Coondoo, 2006). Lean and Smyth (2010) conducted a Granger causality analysis on five Southeast Asian countries, discovering a unidirectional causality from carbon emissions to economic growth. Soytas and Sari (2009) examined Turkey’s carbon emissions and economic growth using the VAR model, generalized impulse response function, and Granger causality test, finding no causal relationship in either direction. Yang (2010) employed a nonlinear Granger causality test to analyze developing countries like China and India, identifying a nonlinear causality from carbon emissions to economic growth. Aiwen and Dong (2011), analyzing China’s data from 1953 to 2008, used cointegration and Granger causality tests, uncovering a bidirectional causal relationship.
2.1.2 EKC test for carbon emissions and economic growth
Sengupta et al. (1996) identified an “N-shaped” relationship between per capita carbon emissions and GDP, suggesting that the decoupling of carbon emissions from economic growth may only be temporary (Aiwen, 2012). In contrast, Lantz and Feng (2006) found no correlation between these variables. Fang et al. (2008) predicted the turning point from rising to falling emissions by fitting the Environmental Kuznets Curve (EKC), emphasizing the need for China to reform its growth model and establish effective carbon reduction incentives for sustainable development (Fang et al., 2008). Li et al. (2010), using panel unit root and cointegration tests, found that carbon emissions in Eastern and Central China follow the EKC, while the Western region does not (Guangyue and Song, 2010). Liu et al. (2011) used time series and inter-provincial panel data to estimate China’s EKC for CO2, revealing a monotonically increasing relationship between total emissions, per capita emissions, and income. However, the relationship between carbon emissions per unit of GDP and income supports an inverted “U”-shaped EKC (Liu et al., 2011).
2.1.3 Decoupling relationship test between carbon emissions and economic growth
Decoupling theory, introduced by the OECD, describes the divergence between greenhouse gas emissions and economic growth. An ideal decoupling occurs when economic growth is accompanied by stable or declining carbon emissions (Cao et al., 2015). This theory is increasingly used by the OECD to analyze the relationship between economic growth and environmental impact across its member countries, with specific indicators developed to monitor these trends (OECD, 2002).
Building on this, Tapio (2005) created a decoupling model that classifies the relationship between economic growth and carbon emissions into three types: decoupling, connectivity, and negative decoupling. Strong decoupling, the most favorable scenario, occurs when economic growth is sustained while carbon emissions decrease. Conversely, strong negative decoupling is the least desirable, marked by rising emissions and declining economic growth (Tapio, 2005). This model is widely applied in studies examining the environmental impacts of economic growth.
2.1.4 Summary of the relationship between carbon emissions and economic growth
The literature review suggests that rapid economic growth does not necessarily result in increased carbon emissions. The potential for decoupling emissions from growth hinges on reducing energy intensity, adjusting the energy mix, and optimizing industrial structures. The key to balancing carbon reduction with economic expansion lies in the strategic approach to urban industrial development.
2.2 Economic theoretical basis of low-carbon cities
Cities are major carbon emitters. Balancing economic growth with emission reduction requires focused research on energy conservation strategies tailored to urban areas. Thus, developing low-carbon cities has become a core area of carbon emission research. Scholars worldwide have extensively studied low-carbon cities, including their defining traits, emission sources, spatial planning, industrial structures, and relevant regulations. Countries like the United States and Japan have made significant progress, and China, a rapidly growing economy with high emissions, is also exploring strategies for low-carbon urban development.
2.2.1 Research on the development of low-carbon cities abroad
The UK Industry and Trade Organization first proposed the concept of a “low-carbon economy” in the UK Energy White Paper (2003), and subsequently, this concept began to be widely used by countries in their pursuit of sustainable development (Department of Trade and Industry DTI, 2003). Urban areas, responsible for over 70% of carbon emissions, are pivotal in transitioning to a low-carbon economy, linking closely with the development of low-carbon cities.
Factors influencing urban carbon emissions include urban sprawl, which alters city structures and functions, affecting emissions timing, quantity, and distribution patterns (Lebel et al., 2007). Siong and Kean (2007) highlights that urban carbon emissions primarily arise from industrial activities, transportation, and household consumption. Glaeser and Kahn (2010) found that approximately 40% of urban emissions in U.S. cities are linked to automobiles and buildings. W.K. Fong’s study in Malaysia demonstrated that a compact urban structure improves public services, reduces household energy use, and lowers car usage, thereby decreasing transportation-related emissions (Fong, 2007).
Aoki (2001) emphasize that the development of low-carbon cities requires a policy system deeply rooted in the region’s economic, cultural, institutional, and historical contexts, addressing current challenges. Strachan et al. (2009) highlight the importance of low-carbon technologies, such as energy utilization, emission reduction, and carbon sequestration. The effectiveness and maturity of these technologies significantly influence urban carbon emissions (Strachan et al., 2009). Kocabas (2012) argues that reducing carbon emissions from urban buildings is critical for combating global warming. Key measures include improving energy efficiency, advancing renewable energy research, and optimizing waste and water management to elevate building design standards (Kocabas, 2012). Nakamura and Nakamura and Hayashi (2013) underscore the importance of reducing transportation-related emissions through a well-designed urban transportation system. Their recommendations include minimizing private car use, effective land use management, and enhancing public transport (Nakamura and Hayashi, 2013). Scholars like Steven and Sijm (2003), Dhakal and Betsill (2007), and While et al. (2009) advocate for combining market-oriented approaches, such as carbon trading and taxation, with government planning to achieve urban low-carbon goals.
2.2.2 Research on the development of low-carbon cities in China
Domestic research on low-carbon cities often draws on successful international models. Chen (2011), Sun et al. (2010), and Liu (2011) highlighted Denmark’s approach, focusing on wind and biomass energy for construction, transport, and waste management, alongside the development of zero-emission communities. Chen (2011) also emphasized the UK’s integration of key public sectors to internalize environmental issues, particularly through energy-saving measures in urban buildings. Cui and Niu (2010) noted Japan’s emphasis on transforming urban areas intensively, supported by comprehensive strategies in transportation, energy, and environmental protection, alongside strong government financial backing.
Domestic research on low-carbon cities in China has employed econometric methods to analyze the relationship between carbon emissions, industrialization, urbanization, and economic growth. Guoquan et al. (2006) used the logarithmic mean weight Divisia decomposition method to develop a model for per capita carbon emissions, revealing that economic development exponentially increases emissions, while the roles of energy efficiency and structure in reducing emissions follow an inverted “U” shape. This suggests diminishing effects of energy efficiency and the persistence of a coal-dominated energy structure (Guoquan et al., 2006). Lin and Jiang (2009) used LMDI and STIRPAT models, indicating that the CO2 Kuznets curve’s inflection point in China aligns with a per capita income of 37,170 yuan (around 2020), with industrial energy intensity being the most significant factor. Chen (2009) found that China’s industrial sectors need enhanced energy-saving and emission-reduction technologies to achieve sustainable growth (Lin and Jiang, 2009).
Research on low-carbon cities has advanced through key contributions. Research Group of the Development Research Center of the State Council (2009) proposed a theoretical framework for emission rights, suggesting post-Kyoto solutions for global emission reductions. Li et al. (2010) emphasized the need for rational urban planning, sustainable transportation systems, and a comprehensive planning index system to develop low-carbon cities. While these studies provide a robust theoretical foundation, there is a notable gap in research on region-specific development strategies for low-carbon cities in China, considering the unique external environments and historical contexts of different areas. This study seeks to address these regional differences.
2.3 The impact of low-carbon city construction on the environment
China in early 2008 Shanghai and Baoding City, Hebei Province, jointly launched a pilot “low-carbon cities” (Huimin et al., 2024), and since then in 2010, 2012, and 2017 in three batches of 81 cities (districts, counties) to carry out low-carbon pilot construction, and put forward the 2020 gradual promotion of low-carbon pilot areas in the country. The successful experience of low-carbon pilot areas is proposed to be gradually promoted nationwide in 2020.
With the continuous improvement of the global urbanization level, cities have become the main contributors to carbon emissions (He et al., 2024) (Wang et al., 2021). Globally, 3% of the land area is urbanized, and more than half of the population lives in urbanized areas. These areas are responsible for 70% of CO2 emissions (Mucha-Ku´s et al., 2021). Therefore, transitioning to sustainable and low-carbon cities is one of the important measures to address climate change.
Current research mainly focuses on the impact of low-carbon city construction on the environment. For example, Hong et al. (2019) evaluated the environmental effects of low-carbon city construction from the perspective of air pollution control and found that pilot policies can effectively reduce urban air pollution. Han and Guo (2022) further considered the external effects of the pilot policy, and the results showed that the low-carbon city pilot significantly reduced the carbon emissions of neighboring nonpilot cities. In addition, the research of Wang and Wang (2024) explored the impact and mechanism of low-carbon transformation on regional coordinated development, indicating that low-carbon transformation can help achieve the “win-win” goal of “carbon neutrality” and regional coordinated development.
3 Methodologies and data
3.1 Construction of LMDI decomposition model
This paper selects the effect of carbon emission reduction during the 13th Five-Year Plan period (2016–2020), due to the impact of the COVID-19 pandemic, a lot of data for the 2020–2023 years have not been published, so it is not possible to carry out the relevant statistical accounting. This study chooses the Logarithmic Mean Divisia Index (LMDI) model to decompose the influencing factors of carbon emissions in China’s province. Given that this study focuses on the low-carbon development orientation of industries, we pay attention to the influence of economic scale (total economic output), industrial structure, energy intensity (energy utilization efficiency), and energy consumption structure on carbon emissions. These factors are considered the primary determinants of carbon emissions.
The model is shown in Equation 1.
Where i represents the industry, j represents the type of energy consumption, C represents the total carbon emissions, Cij represents the carbon emissions generated by j energy consumption in industry i, Eij represents the j energy consumption in industry i, Ei represents the total energy consumption in industry i, Gi represents the size of industry i (expressed in terms of the industry’s Gross Domestic Product, also known as GDP), and G represents the gross GDP. rij represents the carbon dioxide consumption of the j type of energy consumption in industry i (the carbon emission intensity); Mij represents the proportion of j type of energy consumption in industry i (the energy structure); Ii represents the energy consumption per unit of GDP in industry i (the energy intensity); Si represents the proportion of the GDP of industry i to the total domestic GDP (the industrial structure); and G represents the total GDP (the size of the economy) (Zhou, 2018). In this paper, according to the LMDI factor decomposition method, carbon emission differences can be decomposed into additive and multiplicative modes.
According to the additive mode, the carbon emission change
Given that the carbon emission coefficients of various energy sources have remained relatively stable for a long time,
The changes in carbon emissions can be decomposed as shown in Equation 3.
The effects are as follows:
Energy structure effect:
Energy intensity effect:
Industrial structure effect:
Economic scale effect:
The weights are:
According to the multiplication mode, the carbon emission change rate
Given that the carbon emission coefficients of various energy sources have remained relatively stable for a long time,
The changes in carbon emissions can be decomposed as shown in Equation 5.
The effects are as follows:
Energy structure effect:
Energy intensity effect:
Industrial structure effect:
Economic scale effect:
The weights are:
3.2 Data description
This paper utilizes the Logarithmic Mean Divisia Index (LMDI) method to empirically decompose the factors influencing carbon emissions in Chengdu City. The study uses GDP and sub-industry value-added data from the “Chengdu City Statistical Yearbook (2016–2020),” adjusted to constant 2016 prices using the GDP deflator. Following China’s Standard Classification of Industries by the National Bureau of Statistics, data is categorized into six sectors: agriculture, industry, construction, transportation, commerce, and others. Energy consumption data is obtained from the Energy Statistical Yearbook (2016–2020). Since China has not officially published carbon emission data, this study calculates emissions based on the 2006 IPCC Guidelines for National Greenhouse Gas Inventories, using country-specific data to determine energy carbon emission factors according to the calorific values provided by the IPCC.
4 Empirical results and discussion analysis
4.1 Analysis of carbon emissions status in Chengdu
Urban areas are hubs of daily life, industry, and energy consumption. As industrialization and urbanization progress alongside rapid economic growth, urban energy use and carbon emissions continue to rise. Achieving the “dual carbon” goals requires comprehensive policies that transform industrial layouts, adjust energy structures, improve energy efficiency, and optimize urban spatial planning.
4.1.1 Analysis of economic growth and industrial structure changes
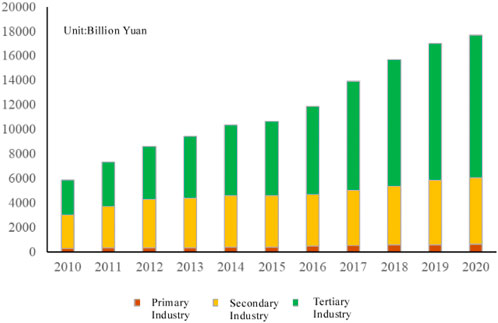
The industrial structure in Chengdu in 2020 was 3.7:30.6:65.7, with the primary, secondary, and tertiary sectors contributing 2.7%, 45.1%, and 52.2% to economic growth, respectively.
From 2010 to 2020, Chengdu was in a stage of rapid economic growth, with continuous optimization of its industrial structure, as shown in Figure 1.
Chengdu’s GDP surged from 588.95 billion yuan in 2010 to 1,771.67 billion yuan in 2020, marking an average annual growth rate of 12.95%. The city’s industrial structure also improved significantly. In 2020, the primary industry’s added value reached 65.52 billion yuan, contributing 3.7% to total output, with a 3.3% year-on-year increase. The secondary industry’s added value was 541.85 billion yuan, making up 30.58% of the total, with a 4.8% increase. The tertiary industry, with an added value of 1,164.3 billion yuan, saw a 3.6% increase, contributing 65.84% to the total output, well above the national average of 54.5%.
4.1.2 Analysis of energy consumption structure and carbon emission trends in Chengdu
Chengdu, an energy-importing city, relies mainly on electricity, natural gas, and other clean sources. In 2020, Chengdu’s emissions totaled 515.594 million tons, with fuel oil at 54%, natural gas at 29%, and coal products contributing 17%. Despite rising emissions due to economic growth and increased oil and gas use, improvements in energy cleanliness have kept overall carbon emissions stable, supporting future goals for carbon neutrality and peak emissions.
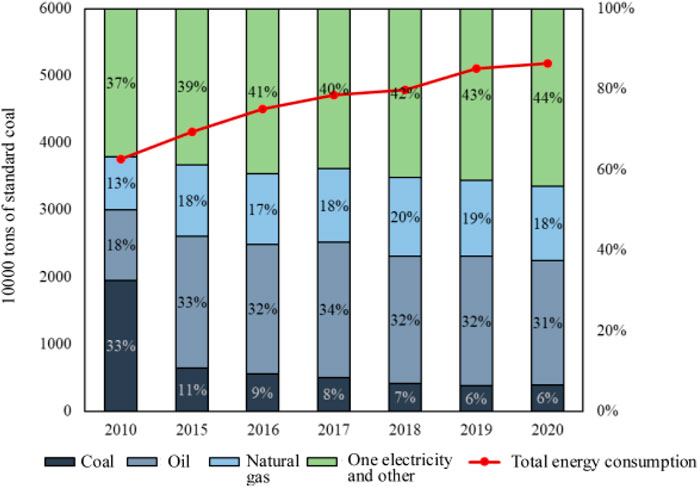
Despite the continuous optimization of the economic structure, the high-speed growth of the economy inevitably leads to an increase in total energy consumption, as shown in Figure 2.
From the end of the 11th Five-Year Plan to the end of the 13th Five-Year Plan, Chengdu’s total energy consumption surged from 37.5333 million tons of standard coal to 51.8472 million tons, marking a 38.14% increase. The energy structure has shifted notably: coal’s share dropped from 32.50% to 6.42%, while oil’s share rose from 17.58% to 30.98%. Natural gas increased from 13.15% to 18.45%, and primary electricity’s share grew from 36.77% to 44.15%. Clean energy consumption has risen to 61.5%. By the end of the 12th Five-Year Plan, oil consumption reached 13.5122 million tons, surpassing coal as the largest fossil energy source. The city is also enhancing its clean energy use by expanding liquefied natural gas storage and distribution.
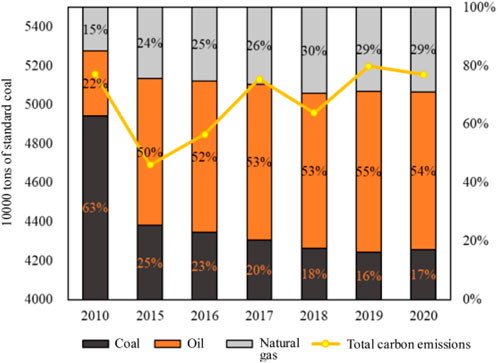
According to the latest national greenhouse gas inventory data adopted in the “Guidelines for the Preparation of the Provincial Action Plan for CO2 Emission Peak” issued by the Ministry of Ecology and Environment in 2021, the carbon emissions of energy consumption in Chengdu over the years are calculated, as shown in Figure 3.
The changes in Chengdu’s carbon emissions from energy consumption can be categorized into two phases:
The first stage (2010–2015): Carbon emissions decreased from 51.5623 million tons in 2010 to 46.922 million tons in 2015, a reduction of 9%, mainly due to a significant decrease in the proportion of carbon emissions from coal consumption, from 63% to 17%.
Second stage (2015–2020): Emissions increased from 46.922 million tons in 2015 to 51.3147 million tons in 2017, then decreased to 49.5909 million tons in 2018, and increased again to 51.5594 million tons in 2020. The overall trend was relatively stable, with fluctuations primarily due to increased carbon emissions from oil and natural gas consumption.
Although Chengdu’s energy consumption has stabilized with a shift towards cleaner energy, overall carbon emissions remain steady. To meet the dual goals of carbon reduction and sustainable economic growth, Chengdu must accelerate its transition to clean and zero-carbon energy.
4.1.3 Analysis of carbon emissions from different departments in Chengdu
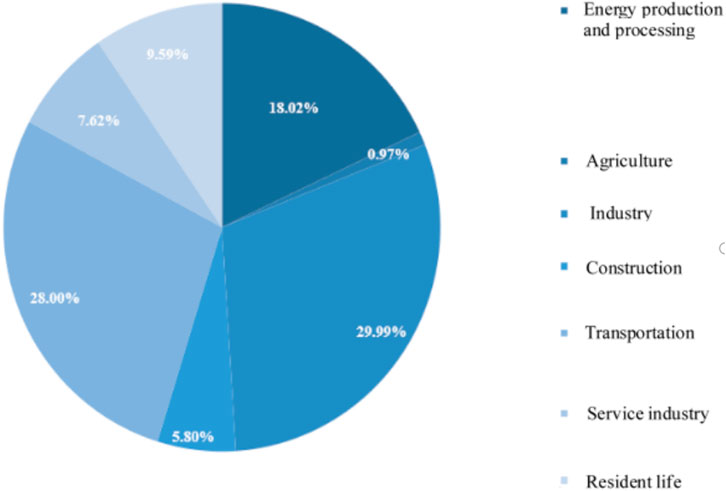
Based on the research objectives and data availability, this study takes 2019 as an example to analyze the carbon emissions of different sectors in Chengdu. The carbon emissions of Chengdu’s sub-sectors are shown in Figure 4.
Analysis reveals that Chengdu’s major sources of CO2 are the industrial, transportation, energy production and processing, and residential sectors. Notably, the industrial and transportation sectors are the largest contributors, accounting for 29.99% and 28.00% of emissions, respectively.
Within the industrial sector, four high-energy-consuming industries represent about 75% of total sector energy consumption. Despite this, oil products still play a significant role in Chengdu’s energy structure, indicating a pressing need for improved energy efficiency and energy-saving technologies.
In the transportation sector, emissions are also substantial, making up 28.00% of the total. By the end of 2020, Chengdu had 5.457 million cars, second only to Beijing. With increasing internationalization, air transportation volumes are expected to rise. Given this growth, limiting transportation volume is impractical. Therefore, Chengdu must advance the electrification of its transportation sector, promote new energy sources, and adjust the sector’s energy demand structure.
To manage oil-related carbon emissions, Chengdu should accelerate the comprehensive electrification of transportation, develop zero-carbon materials to replace oil products and enhance technological advancements and equipment upgrades in refining, energy production, and processing sectors.
4.2 Decomposition analysis of factors influencing carbon emissions from different industries in Chengdu
This study analyzes the role of the energy structure in different industries in Chengdu’s carbon emissions growth during the 13th Five-Year Plan period (2016–2020). The results are shown in Figure 5.
According to the LMDI addition decomposition method, carbon emissions increased by 4,397,700 tons during the 13th Five-Year Plan period. This increase is largely due to economic expansion. Changes in industrial structure had a modest impact, reducing emissions by 657,700 tons. Improvements in energy intensity led to a significant reduction of 3,016,500 tons, reflecting advancements in energy-saving and production technologies. Although the shift in energy structure also reduced emissions, its effect was minimal, decreasing emissions by only 6,400 tons.
Chengdu’s economy continues to grow steadily, with rapid economic growth being the primary driver of increased carbon emissions. The main contributors to emission reductions are changes in industrial structure, energy intensity, and energy structure, with energy intensity having the most significant impact. This indicates that national and regional policies have successfully promoted energy-saving and production innovations, although further transformation and upgrading of the industrial structure are still needed.
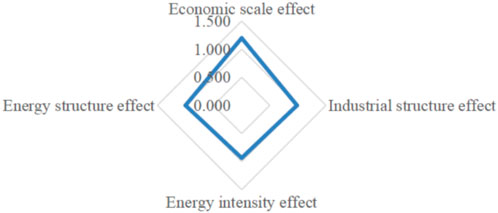
According to the LMDI multiplication decomposition method, this is shown in Figure 6. Chengdu's carbon emissions increased by 10.3% during the 13th Five-Year Plan period. The expansion of the economic scale has resulted in a 119.7% increase in emissions. However, improvements in energy intensity, reflecting enhanced energy efficiency, were the main factor in offsetting this growth, reducing emissions to 0.935 times the 2016 level. Changes in industrial and energy structures contributed to further reductions, lowering emissions to 0.9854 and 0.9998 times the 2016 levels, respectively. Despite these contributions, the impact of structural changes was relatively modest.
4.3 Analysis of problems in economic growth under carbon emission reduction constraints in Chengdu
In recent years, Chengdu’s economic scale has steadily expanded, with notable improvements in industrial structure, development efficiency, industrial openness, and foreign trade. Additionally, the city has strengthened its innovation platforms. However, despite these advancements, Chengdu’s current economic growth model still has considerable room for improvement.
4.3.1 The proportion of energy consumption in high-energy-consuming industries is excessively high
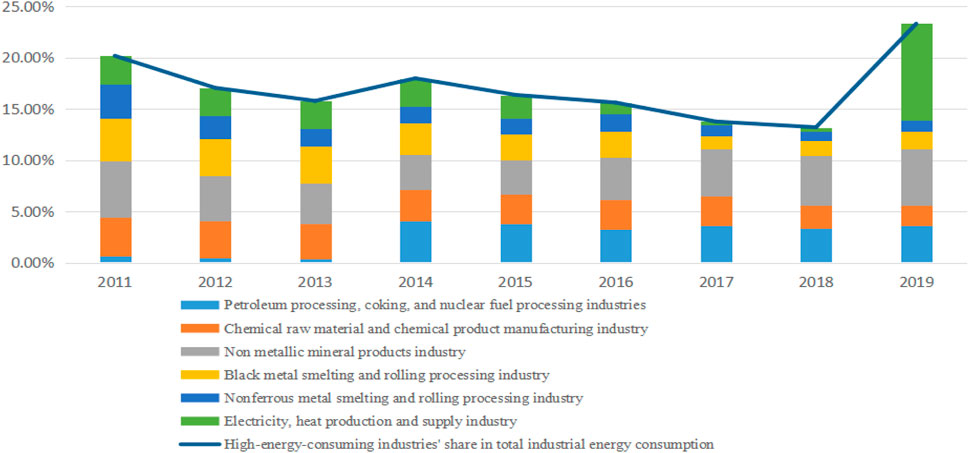
In 2019, the industrial sector was the largest source of CO2 in Chengdu, accounting for 29.99% of the city’s total emissions. Figure 7 illustrates the energy consumption of high-energy-consuming industries from 2011 to 2019.
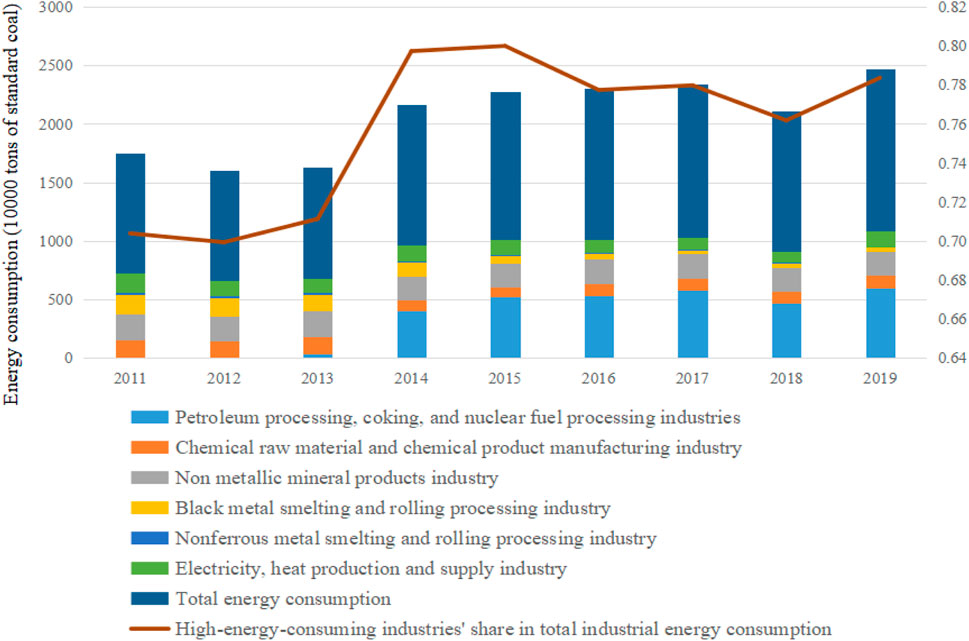
Figure 7. Energy consumption of high-energy-consuming industries in Chengdu from 2011 to 2019 and their proportion to the total industrial energy consumption.
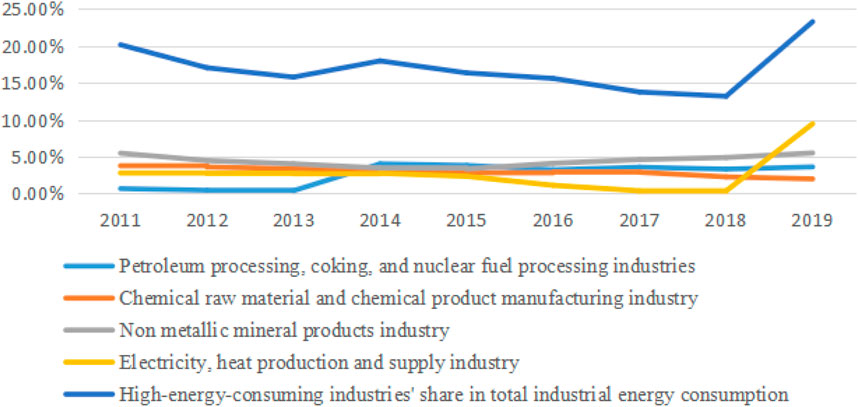
From 2011 to 2019, energy consumption in Chengdu’s high-energy-consuming industries rose from 10.249 million tons to 13.8607 million tons of standard coal, increasing from 70% to 78% of total industrial energy use. Since 2014, the petroleum processing industry’s energy demand surged, reaching 12.59 times the 2013 level and remaining high. Despite this growth, the output value of these industries remains a small fraction of the total industrial output. Changes in this proportion are depicted in Figure 8.
From 2011 to 2019, the share of Chengdu’s six high-energy-consuming industries in industrial GDP declined from 20.17% to 13.2%. Despite this, the electricity production and supply industry grew rapidly in 2019, representing 9.46% of the industrial output, thus increasing the overall share of high-energy-consuming industries. Achieving the “dual carbon” goal requires optimizing the industrial structure and advancing green technology in these high-energy-consuming sectors.
4.3.2 High-energy-consuming industries exhibit higher energy consumption compared to the average across industrial output
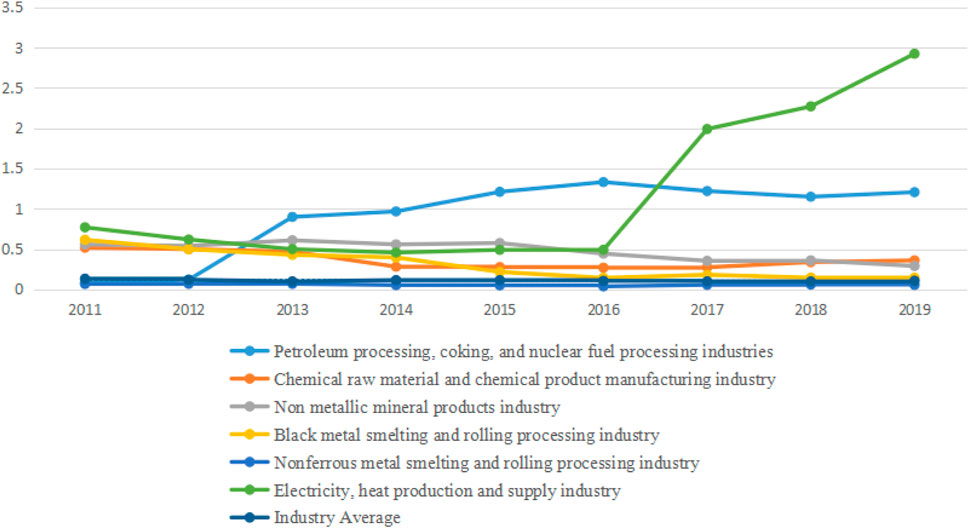
From 2011 to 2019, the comprehensive energy consumption of large-scale high-energy-consuming enterprises in Chengdu exceeded the average energy consumption of industrial output value, as depicted in Figure 9.
The average energy consumption of industrial enterprises has remained at 0.1 tons of standard coal per 10,000 yuan for an extended period. While sectors like chemical manufacturing, non-metallic minerals, black metal smelting, and non-ferrous metal smelting have seen gradual declines in energy use, petroleum processing, and electric and thermal production have experienced significant increases. This rise is due to outdated technologies and poor management, with companies failing to modernize despite strong market demand. To address these issues, industries must overcome technological barriers, enhance energy and environmental management, and drive improvements in efficiency and emissions reduction through advanced materials, technologies, and equipment.
4.3.3 Excessive dependence on oil and fuel in energy consumption structure
Optimizing the industrial energy consumption structure is essential for achieving the dual carbon goals by reducing fossil fuel reliance and increasing the use of cleaner energy sources like electricity and natural gas. Although oil products remain prominent in Chengdu’s energy mix, supporting high production levels in sectors like petroleum processing and coking, the share of coal has steadily decreased and offers limited further reduction potential. There is significant potential to boost the proportion of electricity and natural gas. However, scaling up new energy sources such as wind and solar power faces challenges due to geographical constraints.
The changes in energy consumption composition in Chengdu from 2015 to 2019 are shown in Figure 10.
Coal, the most carbon-intensive energy source, has seen a steady decrease in Chengdu, dropping from 13.71% in 2015 to 8.39% in 2019. In 2019, industrial sectors consumed 99% of the coal, with 97.8% used by non-metallic mineral products and power production industries, the latter consuming 56.2% alone. Given the rising electricity demand and regional hydropower supply-demand imbalances, further coal reduction in power production faces limitations. Future reductions will depend on transforming non-metallic mineral production and advancing new energy sources and energy-saving technologies for thermal power generation.
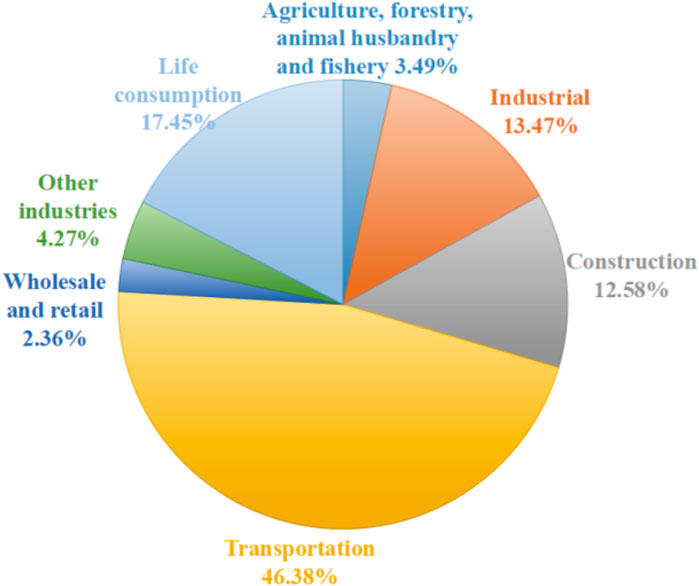
Oil and fuel consumption in Chengdu increased from 41.6% in 2015 to 43.44% in 2019. Reducing oil and fuel demand remains crucial for curbing carbon emissions. The consumption of oil and fuel in different industries in Chengdu in 2019 is shown in Figure 11.
In 2019, the transportation industry in Chengdu was the largest consumer of oil and fuel, driven by the growing use of high-energy transportation modes. The rapid increase in small cars in cities led to a rise in fuel consumption, with the transportation sector contributing over 50% of the city’s carbon emissions. Chengdu had nearly 5.7724 million vehicles by 2019, including 4.3883 million private cars, a 33.6% increase from 2015. Goods turnover reached 40,682.46 million kilometers, up 25.6% from 2015, while passenger turnover totaled 1.931581 trillion person-kilometers, a 50.9% increase. The sector relies heavily on oil, with new energy vehicles comprising less than 4% of the fleet. To reduce carbon emissions, Chengdu should increase the adoption of new energy vehicles, accelerate the development of charging and swapping infrastructure, expand rail transit, enhance bus services, and promote shared bicycle systems.
4.3.4 The standardization of low-carbon building policies remains incomplete
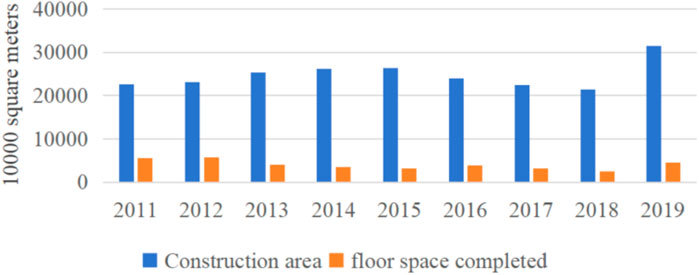
With the acceleration of urbanization, the scale of Chengdu’s construction industry continues to expand, as shown in Figure 12.
From 2011 to 2019, Chengdu experienced significant growth in construction and real estate development, with the construction area expanding by 47% in 2019 alone, contributing 5.8% to the city’s total carbon emissions. Considering the entire lifecycle of construction, including energy used in material production and construction processes, these emissions constitute over 50% of Chengdu’s total carbon output.
To accelerate the development of green buildings and advance the transformation of the construction industry’s development model, the General Office of the State Council forwarded the “Green Building Action Plan” (Architectural Technology Editorial Department, 2016) issued by the National Development and Reform Commission and the Ministry of Housing and Urban-Rural Development on 1 January 2013. Chengdu has implemented policies such as the “Chengdu Green Building Action Work Plan” and the “Notice on Issuing the Chengdu Green Building Creation Action Implementation Plan” to enhance the quality of green building development. These initiatives play a crucial role in advancing carbon peak and carbon neutrality within the construction sector, promoting overall green development and industrial transformation in the city. Despite these efforts, these policies still exhibit deficiencies in normative regulations, lacking a fully integrated system. Establishing a comprehensive green building evaluation system and ensuring the effective implementation of the Green Building Action Plan are pressing priorities.
4.4 Research on the development path of low carbon city in Chengdu
The results show that there is a close relationship between industrial structure and carbon emissions. Relevant studies show that the degree of influence of the primary, secondary and tertiary industries on carbon emissions decreases gradually (Liu and Chen, 2010), and the increase in the output value of high-energy-consuming industries in the traditional industrial structure as well as outdated production and management equipment leads to a decrease in the utilization rate of energy, which is not conducive to the low-carbon transformation of the energy structure (Xia and Wang, 2020); and et al. believe that the knowledge-intensive and technology-intensive industries belong to the low-carbon industry,. For example, the information industry and IT industry are the industries with the most development potential in the low-carbon economy, and the modern service industry is also a low-carbon industry with low energy consumption, low pollution and large employment capacity (Jianqiang et al., 2008). There is consistency between the research of this paper and the conclusions of related literature, so Chengdu city should transform the traditional manufacturing industry and build a low-carbon industrial system based on advanced manufacturing and high-tech industries, and at the same time, utilize Chengdu’s unique tourism resources and well-developed catering industry to broaden the channels of development of the modern service industry, and to increase the proportion of the service industry in the tertiary industry.
With regard to energy restructuring, the full adoption and utilization of non-fossil energy sources is crucial to the realization of the energy revolution and the goal of carbon neutrality. Since Chengdu City belongs to Sichuan Province, which is extremely rich in hydropower resources, the direction of energy consumption structure adjustment and optimization is slightly different from the direction of adjustment in the relevant literature, with hydropower as the main source of clean energy in Chengdu City, and the promotion of electric energy substitution, forming the overall idea of “reducing coal, controlling oil, increasing electricity, stabilizing gas, and promoting new energy sources” in the energy structure (Pan and Yao, 2021).
Based on the above analysis, Chengdu’s path to achieving low-carbon urban development should focus on industry, transportation, and construction as the main areas. Emphasis should be placed on optimizing the internal industrial structure, improving technological innovation, increasing the proportion of clean energy use, and enhancing the city’s carbon sequestration capacity through the construction of park cities.
4.4.1 Optimize the industrial structure layout and prioritize the development of key service industries
Chengdu’s industrial development should adhere to the principles of service intelligence, industrial greening, and agricultural modernization while balancing the dual goals of carbon reduction and economic growth, and steering the transformation and upgrading of the industrial structure towards low-carbon industries. This includes exploring the creative transformation of green technology innovation industries, building a green technology innovation system, cultivating and strengthening green technology innovation entities, and reinforcing green innovation guidance mechanisms. Following ecological principles and economic laws, efforts should be made to reduce energy consumption, control pollution, and promote circular utilization.
The proportion of the service industry within the tertiary sector should be increased by fully utilizing Chengdu’s unique tourism resources and developed catering industry, broadening the development channels of modern service industries, improving public service supporting facilities, and showcasing Chengdu’s charm. Transform the traditional manufacturing industry and build a low-carbon industrial system dominated by advanced manufacturing, high-tech industries, and high-end service industries. Promote market-driven mechanisms for green manufacturing and develop a green supply chain management system. Expand the scope of intensive development enterprises and enhance the low-carbon impact of central state-owned enterprises and large corporations. Accelerate the construction of a high-end and high-quality industrial system, targeting key industry segments in the “5 + 5+1″strategy. By adjusting and optimizing the planning and layout of 66 industrial functional zones and 14 industrial ecosystems, the city’s five advanced manufacturing industries—electronic information, equipment manufacturing, medicine and health, new materials, and green food—have achieved a revenue exceeding 2 trillion yuan (Zhang, H., 2022). In the primary industry of agriculture, urban agriculture accounts for a relatively low proportion and is mainly used to meet the needs of urban residents while reducing long-distance transportation costs. Farmers should be guided to transfer land and consolidate idle land into new rural management entities. Innovate agricultural production methods and implement the concept of circular and low-carbon development. Promote modern agricultural projects such as photovoltaic intelligent greenhouses and solar ecological parks. Effectively utilize the limited land resources in and around the city by developing ecological leisure and landscape edible agriculture, actively opening up and continuously expanding channels for the mutual transformation of ecological value and economic value.
4.4.2 Build a modern industrial system and reduce the proportion of high-energy-consuming industries
Achieving the carbon peak in Chengdu’s industrial sector requires a strategic focus on industrial revolution, transformation, and upgrading. The goal is to reduce energy demand while still supporting industrial growth, thereby facilitating an earlier carbon peak. Strong regulations on the total energy consumption of high-energy industries, coupled with seizing opportunities for industrial advancement, are essential. This includes accelerating the development of high-quality industrial zones, optimizing the city’s industrial layout, and improving industrial quality.
Efforts should be concentrated on the “5 + 5+1″modern open industrial system, where traditional industries are upgraded and emerging strategic industries are fostered. This includes advancing new energy and carbon-neutral industries, creating a sustainable industrial ecosystem, and paving the way for the green transformation of high-energy sectors.
A key strategy is to elevate the core competitiveness of Chengdu’s manufacturing industry by establishing a modern system centered on the “Five Advanced Manufacturing Industries + New Economy,” thereby boosting the overall industrial level. The focus will be on building high-quality industrial clusters in sectors such as electronic information, high-end manufacturing, pharmaceuticals, new materials, and green food, with targets of reaching scales of 200 billion to 300 billion yuan (Chengdu’s).
Another strategy involves constructing a new framework for the high-quality development of Chengdu’s service industry. This includes optimizing the “5 + 5″service supply structure, accelerating modern service industries, and prioritizing areas such as exhibition economy, financial services, modern logistics, cultural tourism, and life services. Additionally, efforts will be made to strengthen emerging fields like technology services, business services, information services, intellectual property services, and human resources services (Zhang, 2020).
Finally, the strategy to cultivate the new economy and new growth drivers emphasizes the development of six major economic forms: digital, green, creative, flow, intelligent, and sharing economies. It also focuses on seven major application scenarios, including real economy services, smart city construction, technological innovation and entrepreneurship, human capital synergy, consumption upgrading, green and low-carbon development, and modern supply chain innovation (Han and Li, 2018).
4.4.3 Build industrial ecosystems and innovation ecosystems to reduce industrial energy consumption levels
To drive the transformation and upgrading of Chengdu’s manufacturing industry, it is essential to enhance the industrial ecosystem and innovation framework. The focus should be on boosting quality, efficiency, and competitiveness, strengthening the industrial chain’s resilience, and fostering a dynamic and innovative ecosystem. The “four beams and eight pillars” will form the foundation for high-quality development in Chengdu’s manufacturing sector.
Leveraging the construction of the Western (Chengdu) Science City, Chengdu aims to consolidate strategic and advanced technological resources in carbon neutrality. This includes accelerating the development of the Carbon Neutrality Tianfu Laboratory and advancing carbon-neutral technology innovation. The city will strategically develop green industries, establish carbon-neutral industrial clusters, and attract talent, technology, and information to promote industrial optimization and green transformation. By creating innovative carbon sequestration scenarios and fostering market opportunities for carbon-neutral technologies, Chengdu can engage more social capital in the low-carbon transformation of production and consumption processes.
4.4.4 Coordinate planning with market mechanisms to promote low-carbon economic development
Establishing a green tax system is crucial for creating a comprehensive and flexible carbon reduction mechanism that includes more industries and small to medium-sized enterprises. However, introducing a carbon tax could impose significant burdens on businesses and potentially affect urban economic growth. While Chengdu has yet to implement a carbon tax, doing so is essential to achieving the “dual carbon” goals.
Increase financial subsidies for low-carbon development. In terms of the low-carbon industry, investment subsidies and financial incentives will be provided for the top ten key energy-saving and technological transformation projects. The tax incentives for energy conservation and emission reduction will adopt the three exemptions and three reductions method. For energy-saving service companies engaged in contract energy management, there will be not only operational cost savings but also tax reductions or refunds. In promoting low-carbon buildings, the development of photovoltaic buildings should be prioritized, with increased subsidies for green building materials and special funds for energy-efficient residential construction and renovations.
The carbon emissions trading, initiated by Sichuan United Environmental Exchange in 2016 and expanded nationally in 2021, will facilitate the optimal allocation of carbon reduction resources through market-driven price signals, offering greater efficiency than traditional regulatory measures and supporting Chengdu’s long-term low-carbon economic growth.
5 Conclusion
Research results indicate that the comprehensive adoption and utilization of non-fossil energy sources are crucial for achieving energy revolution and carbon neutrality goals. Chengdu, leveraging the hydropower resources of Sichuan Province, has seen its proportion of non-fossil energy consumption reach up to 30%. However, there remains significant potential for low-carbon development in future urban settings.
To ensure urban economic growth while reducing carbon emissions and building a low-carbon city centered on high-quality industrial development, Chengdu must adopt specific strategies and approaches. The city should seize the opportunities presented by China’s strategic goals for carbon neutrality by adjusting industrial structures, optimizing urban layouts, developing green buildings, constructing a comprehensive urban transportation system, and implementing effective planning and market mechanisms.
Chengdu’s goals include gradually increasing the share of renewable energy consumption across various sectors such as electricity, transportation, residential, commercial, and public buildings. The city aims to achieve zero carbon emissions in industrial enterprises and ensure full integration of renewable energy across all economic and social fields.
By practicing energy conservation and emission reduction across various sectors such as industry, construction, and transportation, Chengdu can cultivate new growth areas for high-quality development. This will support the formation of a circular economy dominated by renewable energy, facilitating the low-carbon transformation of production methods and residential lifestyles. Ultimately, this approach aims to reduce CO2 from human activities and achieve a harmonious balance between economic growth and environmental protection.
Data availability statement
The data analyzed in this study is subject to the following licenses/restrictions: Data will be made available on request. Requests to access these datasets should be directed to eXVqaUBjYWZ1Yy5lZHUuY24=.
Author contributions
JY: Data curation, Conceptualization, Validation, Writing–original draft. LY: Data curation, Formal Analysis, Investigation, Writing–review and editing. YL: Formal Analysis, Supervision, Writing–original draft. PZ: Conceptualization, Validation, Writing–review and editing.
Funding
The author(s) declare that financial support was received for the research, authorship, and/or publication of this article. This work was supported by 2023 Chengdu Philosophy and Social Sciences Planning Project (Project number: 2023BS114); the Fundamental Research Funds for Center Universities of China (grant numbers: 24CAFUC04021); Key project of Chengdu Green and Low Carbon Development Research Base in 2024: Research on the low-carbon development path of Chengdu's industries under the dual constraints of carbon reduction and economic growth (Project number: LD2024Z02).
Conflict of interest
The authors declare that the research was conducted in the absence of any commercial or financial relationships that could be construed as a potential conflict of interest.
Publisher’s note
All claims expressed in this article are solely those of the authors and do not necessarily represent those of their affiliated organizations, or those of the publisher, the editors and the reviewers. Any product that may be evaluated in this article, or claim that may be made by its manufacturer, is not guaranteed or endorsed by the publisher.
References
Aiwen, Z. (2012). “Research on the relationship between carbon emissions,” in Energy consumption, and economic growth in China. Nanjing: Nanjing University of Aeronautics and Astronautics.
Aiwen, Z., and Dong, Li (2011). Cointegration and causal analysis of carbon emissions and economic growth in China. Resour. Environ. Yangtze River Basin (11), 1297–1213.
Aoki, M. (2001). Comparative institutional analysis [M]. Shanghai: Shanghai Far East Publishing House.
Architectural Technology Editorial Department (2016). New data of Green Label in the past decade. Build. Technol. (10), 1.
Cao, G., Li, Y., and Yang, Z. (2015). Research on decoupling of carbon emissions from manufacturing industry in the Yangtze River Delta region. Yuejiang Journal 7 (2), 37–44.
Chen, J. (2011a). Low carbon city construction - international experience reference and China's policy options. Modern Property.
Chen, L. (2011b). Foreign practice of low carbon city development. Environ. Prot. Circular Econ. (1). doi:10.3969/j.issn.1674-1021.2011.01.006
Chen, S. (2009). Energy consumption, CO2 emissions, and sustainable development of China's industry. Econ. Res. (4).
Cui, C., and Niu, J. (2010). Experience and enlightenment of low carbon city construction in Japan. China Sci. Technol. Invest. (11). doi:10.3969/j.issn.1673-5811.2010.11.025
Department of Trade and Industry (DTI) (2003). UK energy white paper: our energy future-creating A low carbon economy. London; TSO, 1–142.
Dhakal, S., and Betsill, M. (2007). Challenges of urban and regional carbon management and the scientific response. Local Environ. 12 (5), 549–555. doi:10.1080/13549830701656929
Dinda, S., and Coondoo, D. (2006). Income and emission: a panel-data based Co-integration analysis. Ecol. Econ. 57 (57), 167–181. doi:10.1016/j.ecolecon.2005.03.028
Fang, C., Yang, Du, and Wang, M. (2008). The transformation of economic development mode and the intrinsic driving force of energy conservation and emission reduction. Econ. Res. (6).
Fong, W. K. (2007). Energy consumption and CO2 considerations in the urban planning process. Energy Policy (11), 3665–3667. doi:10.21837/pm.v6i1.68
Glaeser, E. L., and Kahn, M. E. (2010). The greenness of cities: carbon dioxide emissions and urban development. J. Urban Econ. 67 (67), 404–418. doi:10.1016/j.jue.2009.11.006
Guangyue, Xu, and Song, D. (2010). Empirical study on the Kuznets curve of China's carbon emissions environment. China Ind. Econ. (5), 37–47. doi:10.19581/j.cnki.ciejournal.2010.05.005
Guoquan, Xu, Liu, Z., and Jiang, Z. (2006). Factor decomposition model and empirical analysis of China's carbon emissions: 1995-2004. China's Popul. Resour. Environ. (6).
Han, Q., and Li, Z. (2018). Chengdu: High quality construction fully embodies the new development concept. Beijing: China Economic Times.
Han, Z., and Guo, L. (2022). External effects of pilot low carbon cities on carbon emissions of neighboring non-pilot cities. China Population-Resources Environ. (07), 71–80.
He, B., Du, X., Lu, Y., Chen, Q., and Lan, R. (2024). An improved approach for measuring the coupling relationship between new type urbanization and low carbon development in China. Ecol. Indic. 158, 111383. doi:10.1016/j.ecolind.2023.111383
Hong, S., Sun, Y. J., and Chen, D. (2019). Evaluation of the effect of government air pollution control--an empirical study on the construction of “low-carbon cities” in China. Manag. World 35.6, 95–108 + 195.
Huimin, L. I., Yu, Z., Feng, L. I., and Yongchao, C. (2024). Bibliometric analysis of low-carbon city research based on CiteSpace. People's Pearl River 45 (01), 85–94. doi:10.3969/j.issn.1001-9235.2024.01.008
IPCC (2014). AR5 climate change 2014: mitigation of climate change: contribution of working group III to the fifth assessment report of the Intergovernmental Panel on Climate Change. Cambridge: Cambridge University Press.
Jianqiang, B., Yang, M., and Feng, C. (2008). Low-carbon economy: a new change in the way of human economic development. China Ind. Econ. (4), 153–160.
Kocabas, A. (2012). The transition to low carbon urbanization in Turkey: emerging policies and initial action. Habitat Int., 1–8. doi:10.1016/j.habitatint.2011.12.016
Lantz, V., and Feng, Q. (2006). Assessing income, population and technology impacts on CO2 emissions in Canada, where’s the EKC. Ecol. Econ. 57, 229–238. doi:10.1016/j.ecolecon.2005.04.006
Lean, H. H., and Smyth, R. (2010). CO2 emissions, electricity consumption and output in ASEAN. Appl. Energy 87 (8), 1858–1864. doi:10.1016/j.apenergy.2010.02.003
Lebel, L., Garden, P., Banaticla, M. R. N., Lasco, R. D., Contreras, A., Mitra, A. P., et al. (2007). Management into the development strategies of urbanizing regions in asia: implications of urban function, form, and role. J. Industrial Ecol. 11 (2), 61–81. doi:10.1162/jie.2007.1185
Li, X., Cao, G., Xu, W., Yang, C., Song, F., and Zhao, P. (2010). Development strategy of low carbon ecological cities in China. Urban Dev. Res. 17 (1), 32–39. doi:10.3969/j.issn.1006-3862.2010.01.006
Lin, B., and Jiang, Z. (2009). Environmental Kuznets curve prediction and influencing factors analysis of CO2 in China. Manag. World (4).
Liu, C. (2011). International low carbon city construction experience in the construction of low-carbon cities. Beijing Observer (1), 18–19. doi:10.3969/j.issn.1008-1208.2011.01.007
Liu, H., Yan, Q., and Sun, Y. (2011). Environmental Kuznets curve of CO2 in China: empirical estimation based on time series and panel data. China Sci. Technol. Forum (4).
Liu, Z., and Chen, C. (2010). Research on low carbon economy and industrial structure adjustment. Foreign Soc. Sci. (3), 21–27.
Mucha-Ku´s, K., Sołtysik, M., Zamasz, K., and Szczepa´nska-Woszczyna, K. (2021). Coopetitive nature of energy communities—the energy transition context. Energies 14, 931. doi:10.3390/en14040931
Nakamura, K., and Hayashi, Y. (2013). Strategies and instruments for low-carbon urban transport: an international review on trends and effects. Transp. Policy 29 (29), 264–274. doi:10.1016/j.tranpol.2012.07.003
OECD (2002). Indicators to measure decoupling of environmental pressure from economic growth[R]. OECD. Available at: http://www.olis.oecd.org/olis/2002doc.nsf/LinkTo/sg-sd.
Panayotou, T. (1993). Empirical tests and policy analysis of environmental degradation at different stages of economic development, ILO technology and employment program working paper, WP238. Geneva.
Pan, J., and Yao, K. (2021). Park city development report. Beijing, China: Social Sciences Academic Press.
Research Group of the Development Research Center of the State Council (2009). Global greenhouse gas emission reduction: theoretical framework and solutions. Econ. Res. (3).
Shafik, N., and Bandyopadhyay, S. (1992). Economic growth and environmental quality: time-series and cross-country evidence, world bank. World Development Report.
Siong, H. C., and Kean, F. W. (2007). Planning for low carbon cities: the case of iskandar development region[R]. Toward Establishing Sustain. Plan. Gov. Seoul (11), 11–15.
Soytas, U., and Sari, R. (2009). Energy consumption, economic growth, and carbon emissions: challenges faced by an EU candidate member. Ecol. Econ. 68 (6), 1667–1675. doi:10.1016/j.ecolecon.2007.06.014
Steven, S., and Sijm, J. (2003). Carbon trading in the policy mix. Oxf. Rev. Econ. Policy 19 (3), 420–437. doi:10.1093/oxrep/19.3.420
Strachan, N., Pye, S., and Kannan, R. (2009). The iterative contribution and relevance of modelling to UK energy policy. Energy Policy 37 (3), 850–860. doi:10.1016/j.enpol.2008.09.096
Sun, C., Liu, J., and Zhang, G. (2010). Development model and construction path of low carbon cities. Innovation Technol. (12).
Tapio, P. (2005). Towards a theory of decoupling: degrees of decoupling in the EU and the case of road traffic in Finland between 1970 and 2001. J. Transp. Policy 12 (12), 137–151. doi:10.1016/j.tranpol.2005.01.001
Wang, J., and Wang, H. (2024). Can low-carbon transition promote coordinated regional development? --Empirical evidence from the construction of “low-carbon cities”. Econ. Manag. Rev. (3), 31–44.
Wang, W.-Z., Liu, L.-C., Liao, H., and Wei, Y.-M. (2021). Impacts of urbanization on carbon emissions: an empirical analysis from OECD countries. Energy Pol. 151, 112171. doi:10.1016/j.enpol.2021.112171
While, A., Jonas, A. E. G., and Gibbs, D. (2009). From sustainable development to carbon control: eco-state restructuring and the politics of urban and regional development. Trans. Inst. Br. Geogr. 35 (1), 76–93. doi:10.1111/j.1475-5661.2009.00362.x
Xia, C., and Wang, Z. (2020). Drivers analysis and empirical mode decomposition based forecasting of energy consumption structure. J. Clean. Prod. 254, 120107. doi:10.1016/j.jclepro.2020.120107
Yang, Z. (2010). Nonlinear study on the relationship between “economic growth” and “CO2”: a nonlinear granger causal test based on developing countries. World Econ. (10), 139–161.
Zhang, H. (2022). Research on the basic layout of smart city industry in China. Explor. China 274 (2). doi:10.3969/j.issn.1003-8744.2022.02.014
Zhang, Y. (2020). Chengdu exploration of promoting new economic development with “scenario” thinking [OB/DL]. People's Daily Online.
Zhou, L. (2018). Low carbon economic development path in western China under the background of green “the belt and road” construction - experience from xinjiang. Econ. Issues Explor.(07), 184–190.
Keywords: carbon emission, economic growth, LMDI method, Chengdu low-carbon city, development path
Citation: Yu J, Yu L, Luo Y and Zhang P (2024) Research on the development path of Chengdu as a low-carbon city under the dual constraints of carbon emission and economic growth. Front. Environ. Sci. 12:1494848. doi: 10.3389/fenvs.2024.1494848
Received: 11 September 2024; Accepted: 11 November 2024;
Published: 06 December 2024.
Edited by:
Le Wen, University of Auckland, New ZealandReviewed by:
Harold Lyonel Feukam Nzudie, Shandong University, ChinaKai Zhang, Shandong University of Finance and Economics, China
Olimpia Neagu, Vasile Goldiș Western University of Arad, Romania
Copyright © 2024 Yu, Yu, Luo and Zhang. This is an open-access article distributed under the terms of the Creative Commons Attribution License (CC BY). The use, distribution or reproduction in other forums is permitted, provided the original author(s) and the copyright owner(s) are credited and that the original publication in this journal is cited, in accordance with accepted academic practice. No use, distribution or reproduction is permitted which does not comply with these terms.
*Correspondence: Lu Yu, eXVsdUBzY3UuZWR1LmNu
 Ji Yu1
 Lu Yu
Lu Yu Peiwen Zhang