 Hongtao Zhu
 Yue Zhu1
 Luxia Liu
94% of researchers rate our articles as excellent or good
Learn more about the work of our research integrity team to safeguard the quality of each article we publish.
Find out more
ORIGINAL RESEARCH article
Front. Environ. Sci. , 13 January 2025
Sec. Environmental Economics and Management
Volume 12 - 2024 | https://doi.org/10.3389/fenvs.2024.1494691
This article is part of the Research Topic Environmental degradation, health, and socioeconomic impacts View all 5 articles
The sustainable development of Inner Mongolia, particularly the coordinated development of energy, economy, and environment, plays a crucial role in shaping energy strategies and environmental protection policies for both Inner Mongolia and China. Based on this, the study focuses on the energy-economy-environment coupling in Inner Mongolia, employing system dynamics for multi-scenario simulations. The findings reveal: (1) the overall coupling coordination degree is improving, with the energy-environment friendly scenario yielding the best results; (2) industrial pollution and energy consumption are significant factors influencing coupling coordination; (3) addressing energy consumption and achieving carbon neutrality are long-term challenges for Inner Mongolia’s sustainable development. Therefore, Inner Mongolia should optimize its industrial structure, promote high-tech and low-carbon industries, improve energy efficiency, develop renewable energy, and strengthen pollution control and carbon emission management to achieve sustainable development across its economy, energy, and environment.
The Inner Mongolia Autonomous Region plays a pivotal role in China’s energy sector due to its vast natural resources, including coal, natural gas, and renewable energy sources such as wind and solar power (Wu et al., 2023). As one of the nation’s leading coal producers, Inner Mongolia has also made significant strides in expanding its renewable energy capacity, particularly in wind and solar energy (Wang et al., 2023; Zhang et al., 2023). However, despite these advancements, the region faces considerable challenges, including low energy efficiency, an over-reliance on coal, and severe environmental pollution (Elkhatat and Al-Muhtaseb, 2024; Yu and Liu 2022). This heavy dependence on coal as the dominant energy source has led to extensive air and water pollution, soil degradation, and accelerated desertification of grasslands (Zhang, 2020). Although Inner Mongolia’s economy has grown rapidly, driven by resource-intensive industries, its economic structure remains overly dependent on energy production, limiting its long-term resilience and sustainability (Wu et al., 2024; Zhiyuan et al., 2024). Recent efforts to diversify the economy have fostered growth in the tertiary sector, especially in services, but environmental challenges continue to hinder the region’s progress toward sustainable development (Hariram et al., 2023; Jiang et al., 2024). To address these issues, it is essential to further optimize the industrial structure, enhance energy efficiency, and implement more robust environmental protection measures (Yang et al., 2023; Zhu and Zhang 2021).
Research on the interconnections between energy, the economy, and the environment has garnered increasing attention due to its critical role in achieving sustainable development. Scholars have highlighted the complex interdependencies among these systems, where economic growth is typically accompanied by rising energy consumption and greater environmental pressures (Irfan et al., 2022; Liu et al., 2022). Regional studies reveal significant variations in the degree of coupling and coordination between these systems, which are influenced by local policies and development models. Research on the Yellow River Basins demonstrates notable spatial differences in coupling coordination (Li et al., 2024; Chen et al., 2023). Studies of other regions, such as Hebei Province and resource-dependent areas of China, further support the view that while overall coupling trends are improving (Cao et al., 2020; Wu et al., 2018), significant regional heterogeneity remains, and policy interventions are crucial for promoting coordinated development (Yan et al., 2019;Liu et al., 2021).
The application of system dynamics has proven to be an effective approach for studying the coupling and coordination between energy, the economy, and the environment (Mohammad et al., 2021). System dynamics modeling enables researchers to simulate the dynamic evolution of these systems, uncovering feedback loops and nonlinear interactions. Numerous studies have employed system dynamics to assess the impact of various development policies on regional sustainability (Wang Y. et al., 2023). Studies of Kunming and the Three Gorges Reservoir Area illustrate how balanced economic and environmental strategies can enhance the coordination between these systems (Cui et al., 2019; Cheng et al., 2024). Similarly, research in Northeast China and other resource-dependent regions has utilized system dynamics to predict trends in resource consumption and environmental impacts, underscoring the urgent need for effective resource management and environmental protection (Cao et al., 2023; Jiang et al., 2022; Ouyang et al., 2021).
This study uses system dynamics to examine coupling relationships and dynamic interactions among these systems, providing a scientific foundation for sustainable development. The research focuses on analyzing trends and influencing factors of the coupling coordination degree, investigating direct and indirect mechanisms by which indicators impact coordination, identifying key obstacles, and evaluating the effects of different policies on sustainability. The study’s contribution lies in its system dynamics modeling, offering a comprehensive understanding of the coupling evolution in Inner Mongolia’s energy-economy-environment systems, and providing insights into challenges and solutions for policy optimization. Through scenario analysis, this research supports the development of effective strategies to promote regional sustainable development.
The research area of this study is Inner Mongolia Autonomous Region, China, with data spanning from 2000 to 2021. The panel data are sourced from the China Statistical Yearbook, China Energy Statistical Yearbook, and Inner Mongolia Statistical Yearbook. Missing data were completed using interpolation methods. The carbon sequestration coefficient for each vegetation type refers to the “Accounting Standards for Total Ecological Product Value.” Energy consumption and carbon emissions are converted based on the IPCC National Greenhouse Gas Inventory Guidelines, National Bureau of Statistics Standards of China, and the General Rules for Comprehensive Energy Consumption Calculation.
System Dynamics, developed by Professor Forrester in the 1950s, is a widely used methodology for analyzing the behavior of complex systems over time. Leveraging a systems-thinking approach, system dynamics models dynamic feedback loops and interdependencies, using differential equations to describe the evolution of system variables. This allows researchers to identify patterns, delays, and non-linear behaviors within interconnected systems. A key advantage of system dynamics is its ability to reveal the internal structure and feedback mechanisms that drive system behavior, enabling hypothesis testing and scenario analysis through simulations. This makes system dynamics particularly valuable in fields like energy, economics, and environmental management, where understanding long-term dynamics and interactions is crucial. However, the methodology requires substantial domain knowledge and high-quality data for model calibration, as the accuracy of results depends heavily on input parameters and structural validity.
In this study, system dynamics is applied to analyze the complex interplay within the energy-economy-environment system of Inner Mongolia. By modeling the dynamic coupling of these subsystems, the study investigates feedback loops, trade-offs, and synergies, providing critical insights into their coordination. This approach enables scenario-based simulations to evaluate policy interventions, offering a scientific foundation for sustainable development planning. For Inner Mongolia, a region facing rapid economic transformation alongside significant environmental and energy challenges, the findings provide practical guidance for balancing economic growth with environmental protection and resource efficiency.
The energy-economy-environment system represents one of the most significant and complex subsystems within society. In this study, key variables were selected for each subsystem as the primary focus of analysis, with additional related variables incorporated to enhance the model’s comprehensiveness. Population, GDP, and total energy consumption were designated as stock variables, while all other variables were treated as flow variables. The economic activities of the region were categorized into three sectors: primary, secondary, and tertiary industries. For each sector, the model calculated metrics including proportion of GDP, output value, energy consumption, carbon emissions, and carbon intensity. Given the specific characteristics of Inner Mongolia, carbon sequestration by vegetation was estimated with a focus on farmland, forests, grasslands, and wetlands. For the environmental subsystem, the analysis prioritized indicators closely linked to the energy and economic systems, such as metrics related to residential and industrial activities and key targets for carbon neutrality. The system dynamics model constructed for this study is depicted in Figure 1.
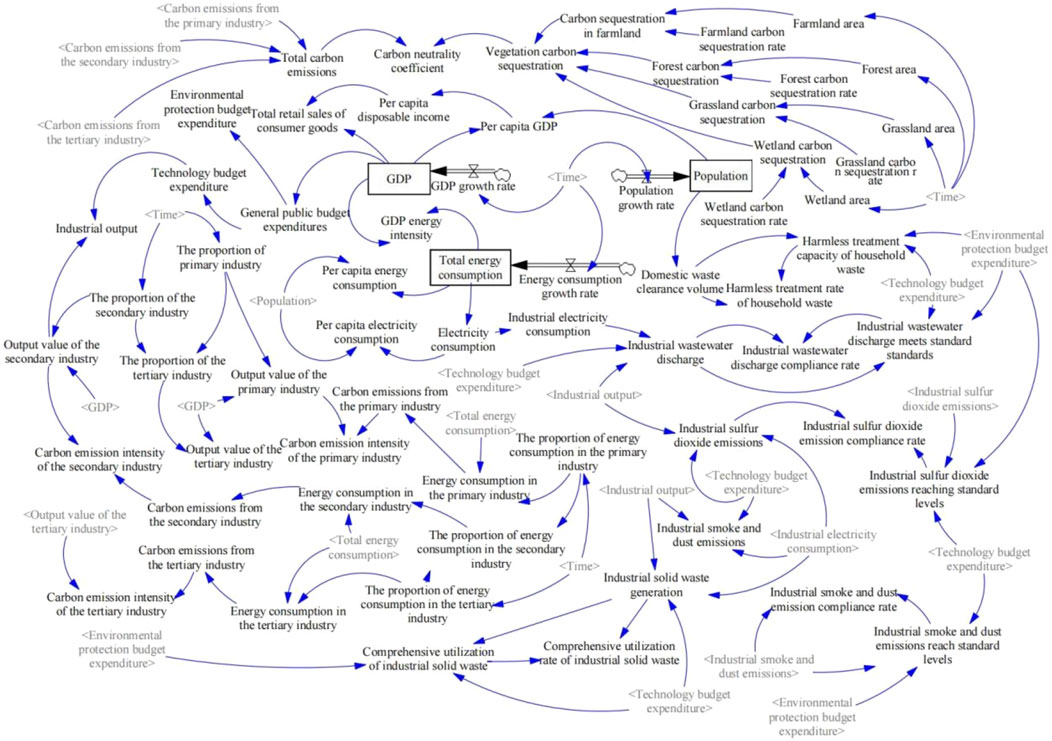
Figure 1. System dynamics model structure diagram.
In this study, the system dynamics model spans from the year 2000–2030, using annual time steps for simulation. Population, GDP, and total energy consumption, as key macroeconomic variables within the social system, are defined as stock variables, with their initial values set based on 2000 cross-sectional data. Growth rates for population, GDP, and energy consumption, as well as the output value proportions and energy consumption shares of the three main industrial sectors, are determined based on actual calculations and implemented using table functions. Other variables are influenced by their related variables, and a fitting equation is constructed through panel data to express them. Detailed parameter settings are presented in Table 1.
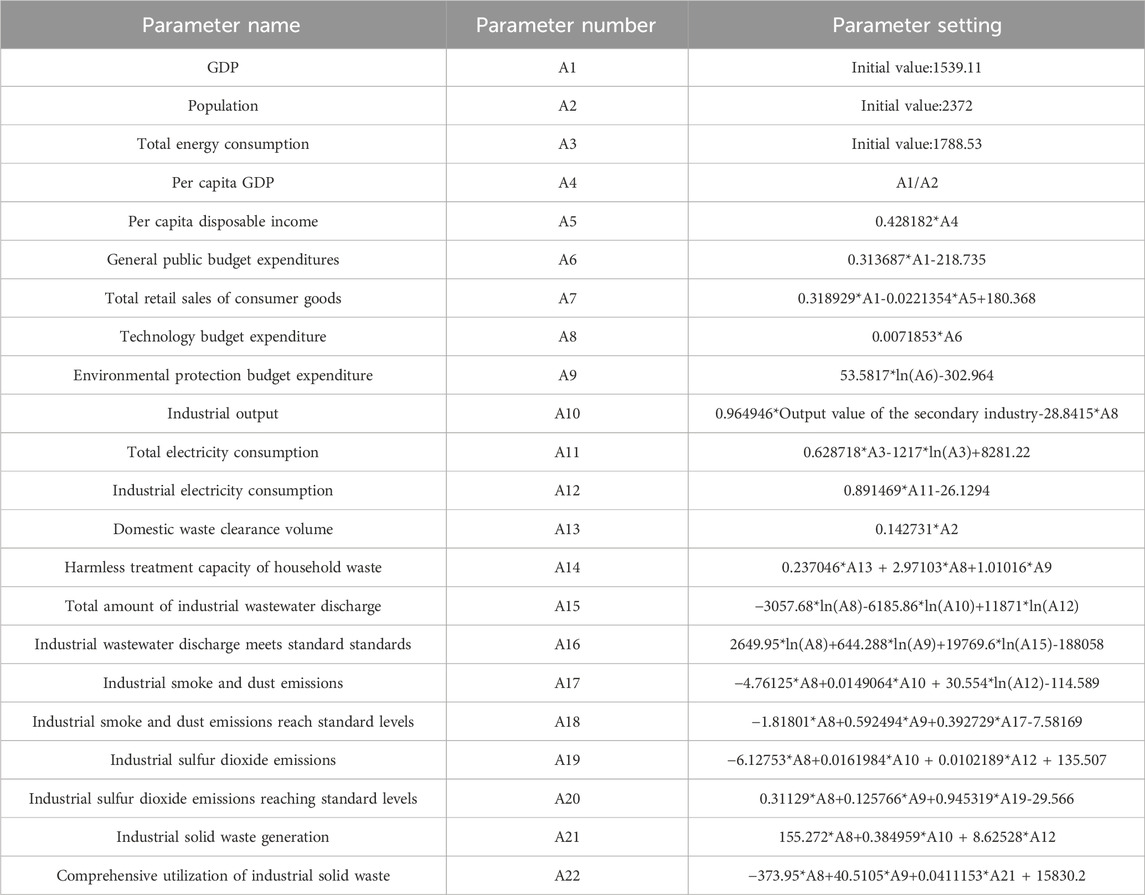
Table 1. Parameter settings table.
Before applying the system dynamics model, a validity test was conducted by comparing the simulation results with historical data from 2000 to 2021. The model is considered reliable if the average absolute error of the variables is below 20%. The validity test results showed that the average absolute error for all tested variables was below the 20% threshold, indicating that the model passed the validity test and can be regarded as relatively reliable. Detailed results are provided in Table 2.
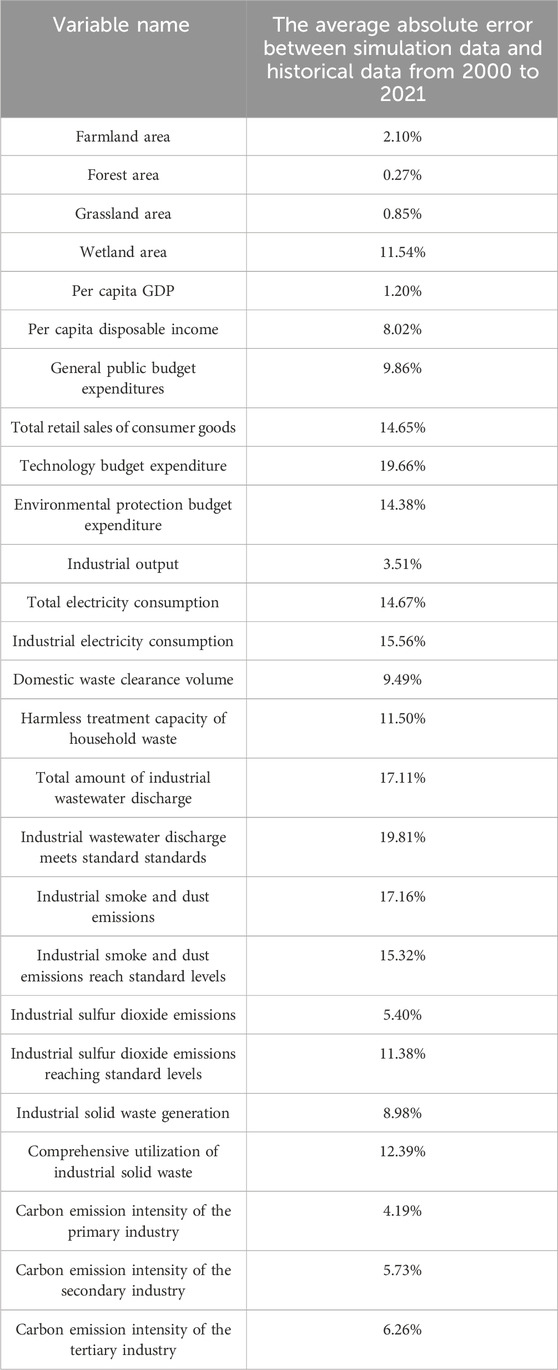
Table 2. Results of system dynamics validity test.
In applying the system dynamics approach, multiple scenarios are distinguished by assigning different parameter values to key variables. By conducting multi-scenario simulations, the model reveals the system’s evolutionary trajectory under varying conditions, enabling comparative analysis of development patterns across scenarios. This approach also provides a basis for forecasting optimal system development and offering practical guidance aligned with real-world conditions. In this study, three scenarios are defined: the current baseline scenario, the high economic development scenario, and the energy-environment-friendly scenario. These scenarios aim to identify a development model best suited to the unique conditions of Inner Mongolia.
In the most recent 5 years within the study period, Inner Mongolia has experienced an average GDP growth rate of approximately 7%, a population growth rate of around −1%, and an energy consumption growth rate of about 4%. Based on these trends, the current baseline scenario extends these values for simulation purposes. In the high economic development scenario, greater emphasis is placed on economic development. The GDP growth rate is increased by about half and set at 10%. This rapid economic growth is expected to attract population inflows and drive higher energy consumption (Yang et al., 2022). Accordingly, the population growth rate is set at 0.5%, and the energy consumption growth rate at 7.5%. The energy-environment-friendly scenario, in contrast, prioritizes the impact of energy consumption and environmental sustainability over accelerated growth. While maintaining the GDP growth rate at 7% to ensure steady economic development, this scenario reduces energy consumption growth to 2.0% and assumes a moderate population growth rate of 0.2%. This scenario seeks to balance economic development with sustainable energy use and environmental preservation. Detailed parameter settings for these scenarios are provided in Table 3.

Table 3. Multi scenario parameter setting table.
This study adopts a multi system coupling coordination model to comprehensively analyze the coupling coordination scheduling of Inner Mongolia’s energy-economy-environment system. The construction indicators and weights are shown in Table 4. The model construction process is as follows. To avoid numerical bias from subjective assignment, this study uses the entropy method for objective weight calculation. Due to inconsistencies in data units and dimensions, standardization is first performed. An offset of 0.01 is added to avoid zero values in the data. Positive and negative indicators are distinguished and processed as follows:
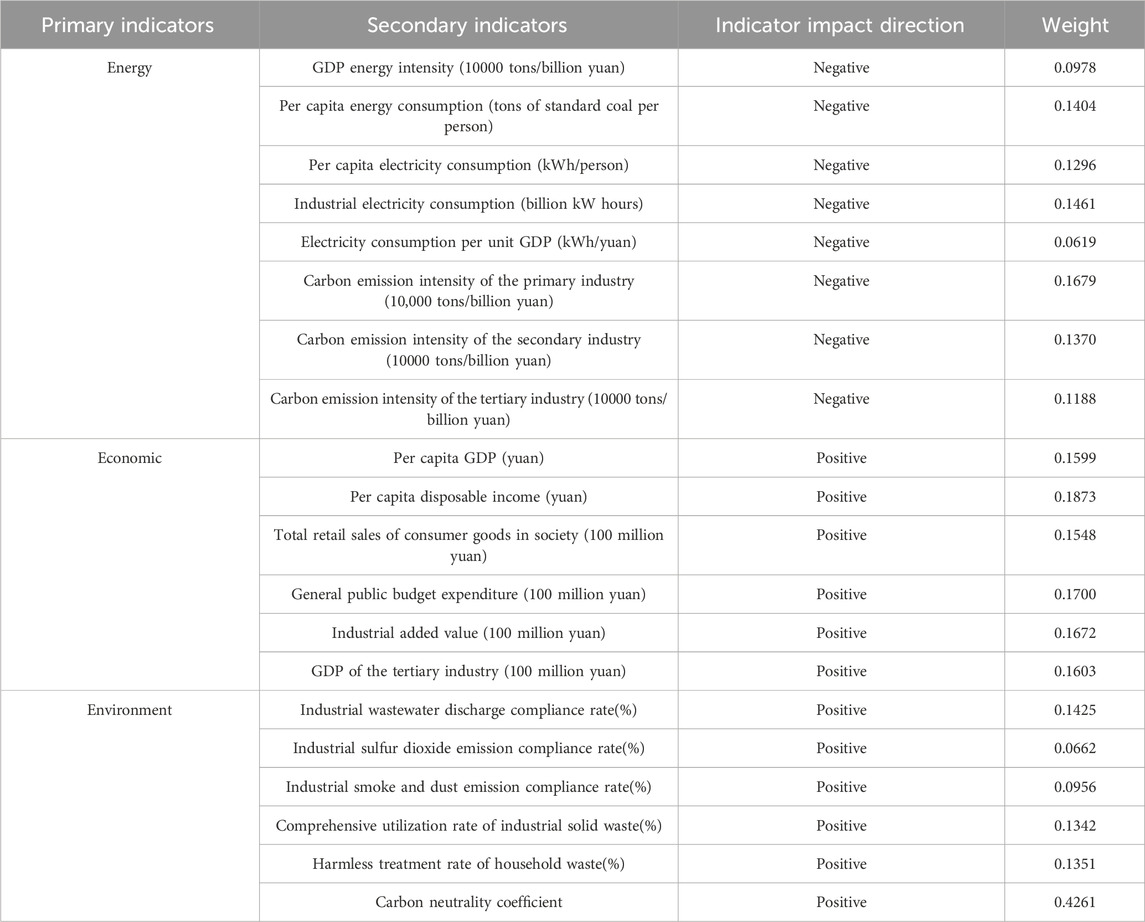
Table 4. Evaluation index system and weights of energy-economy-environment composite system.
Where
Secondly, use the entropy method to calculate the proportion of the j-th indicator value in the i-th year:
Calculate the entropy of indicator information again:
Let
Calculation of information entropy redundancy:
Determination of indicator weights:
Calculate the comprehensive value using standardized data and weights:
Finally, calculate the coupling degree and coupling coordination degree:
Where C is the coupling degree, and,

Table 5. Coupling coordination evaluation form.
To further explore the factors influencing the coupling coordination degree between energy, economy, and environment, this study uses a grey correlation model to analyze the impact of each driving factor. The grey correlation model is a quantitative analysis method that assesses the degree of correlation between sequences based on the geometric similarity between the parent and child data sequence curves. The steps to construct the correlation model are as follows:
Firstly, based on selecting the corresponding sequence, set the coupling coordination degree of the three systems as the characteristic sequence, denoted as
where
Finally, calculate its grey correlation degree:
where
To identify the obstacles that affect the coordinated development level of the energy economy environment system coupling in Inner Mongolia, this article uses an obstacle degree model to calculate various indicators, and constructs a model as follows:
where
As shown in Section 2.2.4, our model has small simulation errors on individual variables, and we also focus on the performance of the model in overall coupling coordination. Therefore, the historical real data and simulation data from 2000 to 2021 were processed in the same dimension to obtain their coupling coordination for each year, and their absolute errors were compared and calculated. The results are shown in Figure 2.
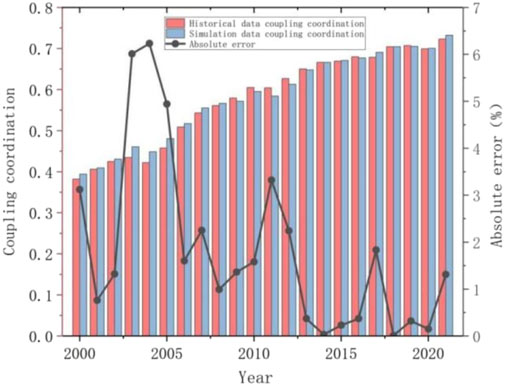
Figure 2. Coupling coordination degree and error verification from 2000 to 2021.
Figure 2 demonstrates that the annual absolute error remains below 7%, indicating a high level of accuracy in the model’s simulation. Between 2000 and 2021, the overall coupling coordination degree of Inner Mongolia’s energy-economy-environment system shows a clear upward trend. In 2000, the system was moderately imbalanced; from 2001 to 2010, it progressed to a basic coordinated state; and by 2011, it achieved moderate coordination. This suggests that, since the early 21st century, Inner Mongolia’s economic development has increasingly aligned with local energy and environmental conditions.
Based on the good robustness of the system, the system dynamics model was applied to simulate multiple scenarios in Inner Mongolia Autonomous Region from 2022 to 2030. The coupling coordination degree of each scenario is shown in Figure 3.
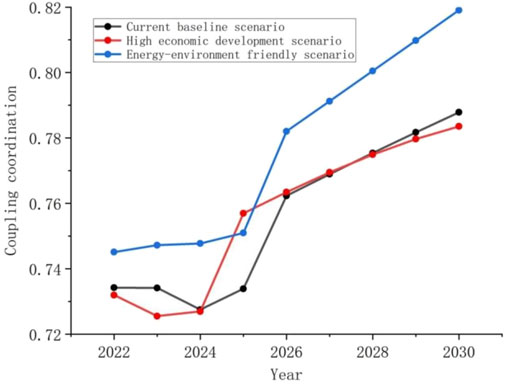
Figure 3. Coupled coordination of the three systems for 2022–2030 under three scenario simulations.
Figure 3 illustrates that the overall coupling coordination degree across the three simulated scenarios shows a consistent upward trend, with the energy-environment-friendly scenario outperforming both the current baseline and high economic development scenarios. Between 2022 and 2024, no significant optimization is observed in the coupling coordination degree across all scenarios, as adjustments in the energy structure and environmental governance policies typically require time to produce measurable effects. Consequently, no substantial short-term improvements are noted (Zhang and Chen, 2018). The high economic development scenario, while maintaining moderate coordination, brings considerable energy consumption and environmental pressures, posing potential risks and challenges. From 2024 to 2026, the coupling coordination degree rises sharply, driven by stable economic growth, as the GDP growth rate helps the economic system converge towards the levels of the energy and environmental systems. This results in a significant improvement in the coupling degree of the economic system across all scenarios. Between 2026 and 2030, all scenarios exhibit stable growth, with the energy-environment-friendly scenario reaching high quality coordination state, attaining a coupling coordination degree of 0.8191.
The coupling degree can indicate the comprehensive level of each subsystem, and the specific coupling degree of each subsystem is shown in Figure 4.
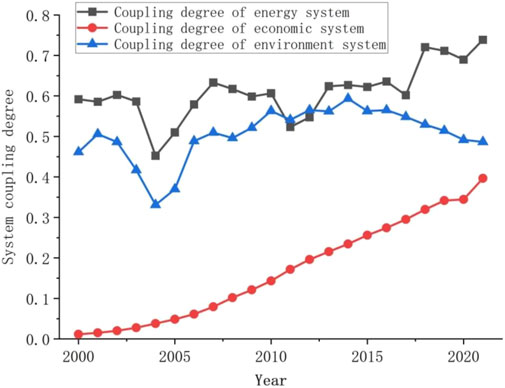
Figure 4. Coupling degree of three systems from 2000 to 2021.
As shown in Figure 4, between 2000 and 2021, the energy system exhibited the highest coupling degree, followed by the environmental system, while the economic system, despite an overall upward trend, remained relatively low. The overall trend of the coupling degree between the energy system and the environmental system is relatively stable, but reached its minimum value in 2004. The main reason for this phenomenon is the rapid development of Inner Mongolia’s economy, which has a strong dependence on resources, resulting in a significant increase in energy consumption and significant pressure on the energy and environmental systems. Therefore, the coupling degree was relatively low at that time.
To further investigate the dynamics of different subsystems under varying scenarios, this chapter will compare and analyze the coupling degrees of the economic, energy, and environmental subsystems across three scenarios: the current baseline, high economic development, and energy-environment-friendly scenarios. The result is shown in Figure 5.
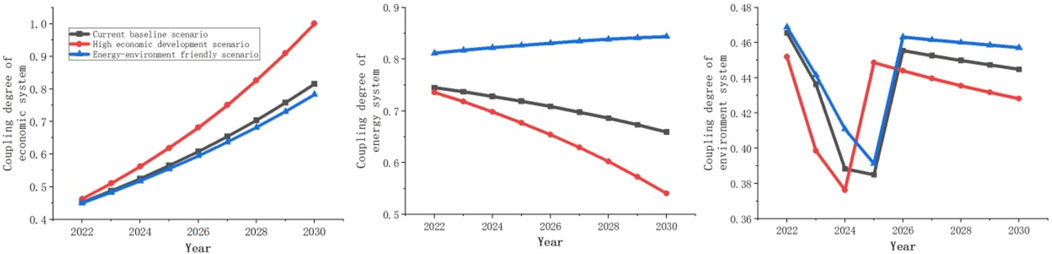
Figure 5. Coupling degree of each s. ubsystem under three scenario simulations from 2022 to 2030.
For the economic subsystem, the coupling degree under the baseline scenario consistently rises from 0.4521 in 2022 to 0.8155 in 2030, indicating stable economic growth driven by existing policies. In the high economic development scenario, the increase is even more pronounced, with the coupling degree reaching 1, signifying the powerful effect of policies focused on accelerating economic expansion. However, this rapid growth may lead to greater resource consumption and environmental strain. In contrast, under the energy-environment-friendly scenario, the coupling degree increases more modestly from 0.4500 to 0.7829, reflecting slower yet more sustainable economic growth. To achieve long-term coordinated development, policies must strike a balance by simultaneously promoting economic growth and enhancing resource management and environmental protection.
The coupling degree of energy subsystems varies significantly across different scenarios. The current baseline scenario shows a year-on-year decline, suggesting that existing policies do not sufficiently prioritize energy management and efficiency. In the high economic development scenario, the coupling degree decreases more sharply, indicating the strain rapid economic growth places on energy resources. In contrast, the energy-environment-friendly scenario shows a steady increase in the coupling degree, highlighting the effectiveness of policies aimed at enhancing energy efficiency. This variation reflects the differing levels of emphasis on energy conservation and environmental protection across the scenarios. It is recommended that, while pursuing economic growth, the government should establish stricter energy efficiency standards, promote clean energy technologies, and strengthen environmental protection measures to ensure the long-term coordination and sustainability of the energy subsystem.
The performance of the environmental subsystem’s coupling degree is particularly notable across scenarios. Although the overall trend involves a brief period of decline followed by recovery and slight fluctuation, the changes are relatively moderate. The energy-environment-friendly scenario consistently maintains a higher level, suggesting that well-designed policies can effectively mitigate the environmental pressures associated with economic development. However, even in this scenario, the coupling degree of the environmental subsystem experiences a minor downward trend, reflecting the ongoing environmental impacts of economic growth. Factors such as rising energy consumption, overuse of natural resources, and increased pollution continue to exacerbate environmental pressures, negatively affecting ecosystems, air and water quality, and biodiversity.
To ensure sustainable and balanced development, a comprehensive set of policy measures is essential. These should include strengthening environmental protection and resource management, promoting the use of clean and renewable energy, improving energy efficiency, enhancing environmental monitoring and governance, and fostering innovation in green technologies. Collaboration among government, businesses, and society is crucial to creating a synergistic approach that achieves both economic growth and environmental preservation, ultimately aligning with long-term sustainability goals.
Calculate the correlation degree between the secondary indicators and the coupling coordination of the three systems under each scenario using the grey correlation model, and rank them. The results are shown in Table 6.
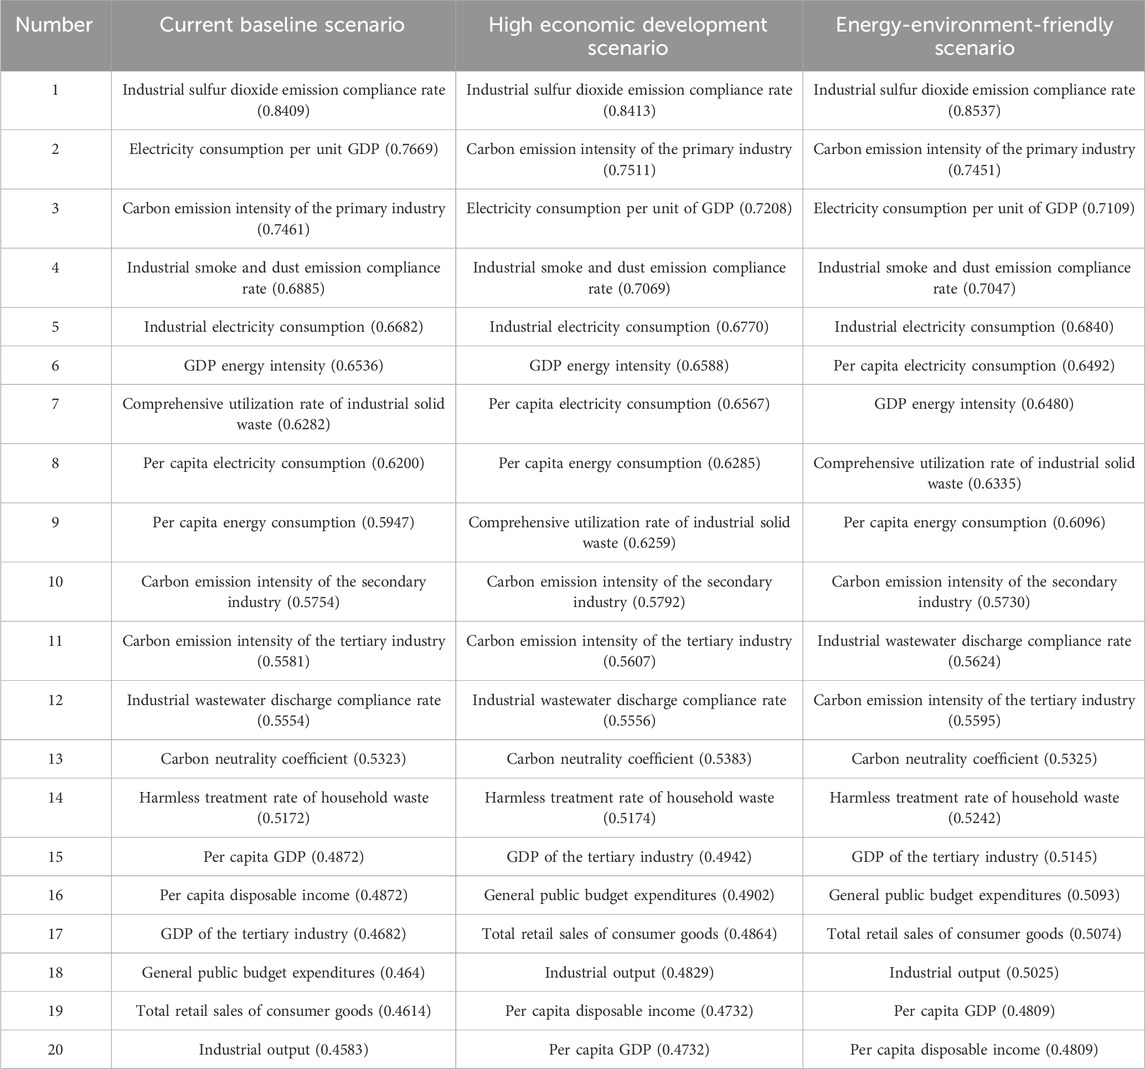
Table 6. Grey correlation ranking of various indicators under three scenario simulations.
Table 6 demonstrates that the strongest correlations are observed between the compliance rate of industrial sulfur dioxide emissions, carbon emission intensity in the primary industry, electricity consumption per unit of GDP, compliance rate of industrial smoke and dust emissions, and industrial electricity consumption. In contrast, the correlations among the six economic system indicators are relatively weaker. This is because environmental and energy system indicators directly impact environmental quality and resource efficiency, playing a critical role in influencing coupling coordination. In comparison, economic indicators have a more indirect effect, primarily mediating the relationship through variables such as energy consumption and environmental pollution, leading to a lower correlation. Nonetheless, these economic indicators were chosen for their capacity to reflect the broader level and quality of economic development, which has potential long-term effects on coupling coordination. Their inclusion allows for a more comprehensive evaluation of the interactions among the economic, energy, and environmental systems, thus offering valuable insights for policy formulation.
Notably, the compliance rate of industrial sulfur dioxide emissions consistently emerges as the most influential factor affecting the coupling coordination among the three systems, underscoring the critical importance of controlling these emissions. Likewise, the compliance rate of industrial smoke and dust emissions, along with industrial electricity consumption, are key factors, emphasizing the need to mitigate industrial pollution and manage energy consumption to enhance system coordination (Liu et al., 2016). Furthermore, the high correlation between electricity consumption per unit of GDP and carbon emission intensity in the primary industry across various scenarios highlights the essential role of improving energy efficiency and reducing carbon emissions in fostering the coordinated development of the energy, economy, and environmental systems (Wang et al., 2022). Therefore, strategies centered on controlling industrial pollution, optimizing energy efficiency, and reducing carbon emissions are pivotal for achieving the sustainable coupling and coordination of these three systems.
This study calculated the obstacle level of secondary indicators from 2000 to 2030 across various scenarios using the obstacle level model. Corresponding years were selected at 5-year intervals, and indicators with higher obstacle levels were identified. The results are shown in Table 7.
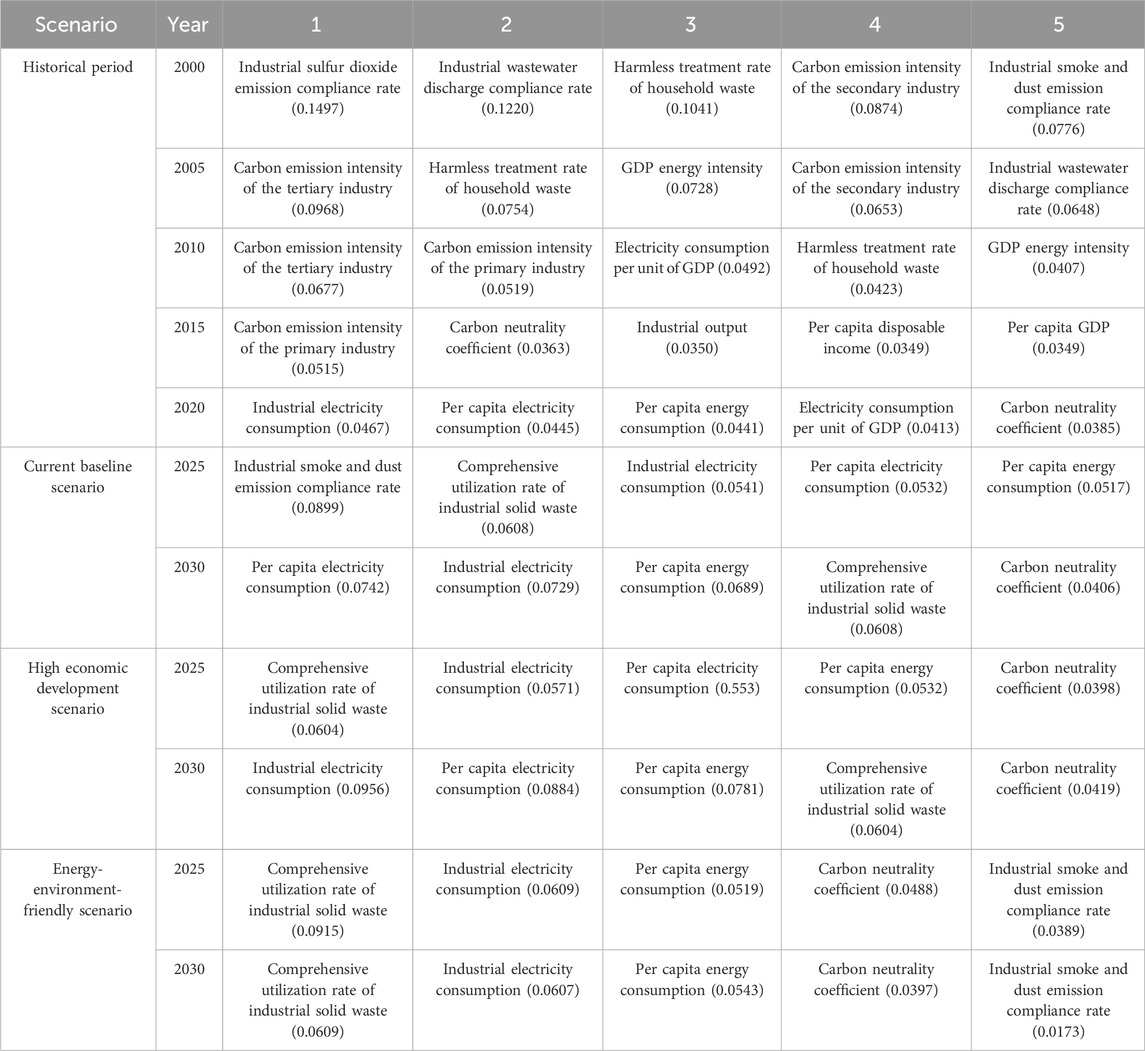
Table 7. Obstacle factors and obstacle degree ranking in three scenarios.
The data in Table 7 indicate that the primary factors affecting the coupling coordination of Inner Mongolia’s energy-economy-environment system vary by year and scenario but are consistently centered around industrial pollution, energy consumption, and carbon emissions. In 2000 and 2005, key obstacles included the compliance rate of industrial sulfur dioxide emissions, industrial wastewater discharge, the harmless treatment rate of household waste, the carbon emission intensity of the secondary industry, and GDP energy intensity. These indicators reflect significant challenges in managing industrial pollution and waste disposal during Inner Mongolia’s rapid industrialization. For instance, in 2000, low compliance rates for sulfur dioxide and wastewater emissions highlighted the need for stricter pollution controls. By 2005, increasing carbon emissions in the tertiary sector and waste management became prominent issues, reflecting new environmental pressures. From 2010 to 2020, the focus of obstacles shifted toward carbon emissions and energy consumption. In 2010, the carbon emission intensity of the primary and tertiary sectors became significant, reflecting rising environmental impacts. By 2020, industrial and per capita electricity consumption, as well as per capita energy consumption, became major obstacles, highlighting challenges in managing energy demand. During this period, Inner Mongolia’s GDP growth stabilized, but carbon emissions and energy consumption surged, with carbon emissions rising by 42% and electricity consumption increasing by 94%. Looking ahead to 2025 and 2030, industrial pollution and energy consumption remain major obstacles. In 2025, across different scenarios, factors like the compliance rate of industrial smoke and dust emissions, the utilization rate of industrial solid waste, industrial electricity consumption, and per capita energy consumption stand out as key challenges. For instance, in the baseline scenario, smoke and dust emissions and solid waste utilization reflect ongoing pollution control issues, while in the rapid economic growth scenario, energy consumption is the primary concern. Even under the energy-environment-friendly scenario, industrial pollution and energy use persist as obstacles. By 2030, indicators such as industrial electricity consumption, per capita energy use, the utilization rate of industrial solid waste, and the carbon neutrality coefficient remain critical obstacles. These issues persist under both the baseline and high economic growth scenarios, emphasizing the ongoing challenge of managing energy demand. Even under the energy-environment friendly scenario, energy efficiency and industrial waste management continue to pose challenges.
In the short term, Inner Mongolia must focus on reducing industrial energy consumption and controlling pollutants. In the long term, addressing broader energy consumption issues and progressing toward carbon neutrality will be key priorities, especially as the region aims to become an ecological demonstration province.
This study employs a system dynamics model to simulate the energy-economy-environment system in Inner Mongolia. The research results indicate that from 2000 to 2021, the overall coupling and coordination degree of the energy economy environment system in Inner Mongolia has increased, demonstrating the enhancement of the adaptability between economic development and energy environment. In the three scenario simulations, the coupling coordination degree of the energy environment friendly scenario is always better than other scenarios, especially reaching a high-quality coordination state by 2030, reflecting the significant effect of sustainable development policies.
For the coupling degree of each subsystem, from 2000 to 2021, the coupling degree between the energy system and the environmental system was relatively high, while the coupling degree of the economic system, although increasing, was relatively low. In different scenario simulations, the coupling degree of the economic subsystem increases the fastest under the high-speed economic development scenario, but it puts significant pressure on energy and the environment. The significant improvement of energy systems in energy and environmentally friendly scenarios reflects the positive role of energy-saving and environmental protection policies. The coupling degree of environmental systems is relatively stable in different scenarios, but the impact of economic growth on the environment persists.
The results of the grey relational analysis model show that the compliance rate of industrial sulfur dioxide emissions, industrial smoke emissions, and industrial electricity consumption are key factors affecting the coupling and coordination of the economic, energy, and environmental systems. In contrast, the correlation of economic system indicators is relatively weak, mainly through the coupling and coordination of energy consumption and environmental pollution, but their long-term potential impact cannot be ignored.
The results of the system obstacle degree model show that the coupling coordination of Inner Mongolia’s energy economy and environment system is mainly affected by industrial pollution, energy consumption, and carbon emissions, and over time, it shifts from industrial pollution to energy consumption and carbon emissions issues. From 2000 to 2020, Inner Mongolia faced challenges in pollution control, energy consumption, and carbon emissions during its rapid industrialization process, particularly in terms of industrial sulfur dioxide emissions, wastewater discharge, and energy use. In the future, industrial pollution control and energy management will remain major issues, and even in energy and environmentally friendly scenarios, energy efficiency and industrial waste management will face certain pressures.
Although the results of this study demonstrate the process and related influencing factors of the coordinated development of energy economy environment coupling in Inner Mongolia Autonomous Region, there are also some shortcomings. In the model construction, the included variables and data volume are not comprehensive enough, which may lead to the omission of some important factors. At the same time, the dynamic complexity of the model is insufficient, ignoring nonlinear effects and lag effects, and cannot fully reflect the real situation. However, the key obstacle revealed in the study is to ensure the core of coordinated development under the guidance of sustainable development goals. Based on this, this study proposes the following policy recommendations:
Inner Mongolia should focus on upgrading its industrial structure by prioritizing high-tech industries and modern service sectors (You and Zhang, 2022). Establishing funds to support high-tech enterprises and creating innovation platforms will facilitate the transformation of traditional industries. Investment in scientific research and technological innovation should be increased, and industry-academia collaboration encouraged to strengthen the region’s innovation capacity. Additionally, improving infrastructure and optimizing the investment environment are crucial for fostering sustainable economic growth (Dong et al., 2018).
Energy consumption is a key constraint on Inner Mongolia’s development (Chen et al., 2021; Sun et al., 2018). Optimizing the energy structure and enhancing energy efficiency is critical. The region should reduce its reliance on energy-intensive industries, promote the development of low-carbon sectors, and adopt stricter energy efficiency standards. Encouraging the adoption of energy-saving technologies and expanding the use of renewable energy sources, such as wind and solar, will help optimize the power supply structure. Implementing a renewable energy quota system and electricity trading market will increase the share of renewable energy in overall consumption, thereby reducing both per capita energy consumption and the environmental impact.
Industrial emissions remain a significant issue for Inner Mongolia’s environmental quality (Guo et al., 2022; Zhang and Fan, 2022). The development of a circular economy should be promoted through legislation and financial support, encouraging enterprises to adopt cleaner production technologies. Stronger law enforcement, stricter emission standards, and enhanced pollution control measures are essential for improving the compliance rates for sulfur dioxide and dust emissions. Support for upgrading industrial waste management technologies and dust control systems will further reduce the environmental burden and contribute to green development.
Under China’s dual carbon targets, reducing carbon emissions is a priority for Inner Mongolia. The region should accelerate its transition away from high-carbon energy sources like coal and expand the development of renewable and clean energy, including wind, solar, and hydrogen (Li et al., 2023). Strengthening carbon market mechanisms and emission regulations will incentivize enterprises to lower their carbon footprints. Establishing a robust carbon trading market, setting emission quotas, and encouraging technological innovation in carbon management are critical steps toward achieving carbon neutrality.
By implementing comprehensive policy recommendations, Inner Mongolia can establish a coordinated and sustainable development model, achieving a balance between economic growth, environmental protection, and resource efficiency. Future research should further enrich the model variables and data dimensions, incorporate key factors such as society, technological innovation, and policy implementation, and enhance the analysis of nonlinear relationships and dynamic feedback mechanisms in the system. At the same time, research on regional heterogeneity should be refined to explore the coupling characteristics of different regions, and combined with scenario simulations over a longer time span, to comprehensively evaluate the effectiveness of policy implementation and provide more scientific guidance for the sustainable development of Inner Mongolia’s energy economy environment system.
Publicly available datasets were analyzed in this study. This data can be found here: Data will be made available in request.
HZ: Conceptualization, Data curation, Formal Analysis, Investigation, Project administration, Visualization, Writing–original draft. YZ: Conceptualization, Data curation, Formal Analysis, Methodology, Writing–original draft. BH: Formal Analysis, Funding acquisition, Writing–original draft. YQ: Data curation, Funding acquisition, Project administration, Visualization, Writing–review and editing. LL: Formal Analysis, Funding acquisition, Writing–review and editing.
The author(s) declare that financial support was received for the research, authorship, and/or publication of this article. The financial support by the National Natural Science Foundation of China (No. 41801330) and Natural Science Foundation of Shandong Province, China (No. ZR2020QC173) is appreciated.
Firstly, we would like to express our gratitude to editor Azlina Karim and reviewers for their suggestions and assistance in improving the quality of the paper. Thanks to the editorial board of China Energy Statistical Yearbook and China Statistical Yearbook for providing us with publicly available data. Meanwhile, we would like to express our gratitude to the experts who have provided us with assistance during the software usage process.
The authors declare that the research was conducted in the absence of any commercial or financial relationships that could be construed as a potential conflict of interest.
All claims expressed in this article are solely those of the authors and do not necessarily represent those of their affiliated organizations, or those of the publisher, the editors and the reviewers. Any product that may be evaluated in this article, or claim that may be made by its manufacturer, is not guaranteed or endorsed by the publisher.
The Supplementary Material for this article can be found online at: https://www.frontiersin.org/articles/10.3389/fenvs.2024.1494691/full#supplementary-material
Cao, Y., Guo, K., Zhang, Q., and Li, X. (2020). The evolutionary characteristics of the coupling relationship of energy, economy and environment in Hebei province, China. IOP Conf. Ser. Earth Environ. Sci. 558, 042021. doi:10.1088/1755-1315/558/4/042021
Cao, Y., Li, J., Xie, L., Yao, J., Li, K., Zhang, N., et al. (2023). Coupling coordination of the water‒energy‒carbon system in three provinces of Northeastern China. Front. Environ. Sci. 11. doi:10.3389/fenvs.2023.1261339
Chen, L., Li, X., Zhao, J., Kang, X., Liu, L., Wang, M., et al. (2023). Coupling and coordinated evolution characteristics of regional economy-energy-carbon emission multiple systems: a case study of main China's Basin. J. Environ. Sci. 140, 204–218. doi:10.1016/j.jes.2023.07.007
Chen, Y., Wong, C. W. Y., Yang, R., and Miao, X. (2021). Optimal structure adjustment strategy, emission reduction potential and utilization efficiency of fossil energies in China. Energy 237, 121623. doi:10.1016/j.energy.2021.121623
Cheng, G., Li, G., Pu, X., Chen, C., and He, Y. (2024). Advancing coupling coordination simulation in the social-human-ecological system of the Three Gorges Reservoir Area: a multi-scenario system dynamics approach. Ecol. Indic. 158, 111504. doi:10.1016/j.ecolind.2023.111504
Cui, D., Chen, X., Xue, Y., Li, R., and Zeng, W. (2019). An integrated approach to investigate the relationship of coupling coordination between social economy and water environment on urban scale - a case study of Kunming. J. Environ. Manag. 234, 189–199. doi:10.1016/j.jenvman.2018.12.091
Dong, S., Yang, Y., Li, F., Cheng, H., Li, J., Bilgaev, A., et al. (2018). An evaluation of the economic, social, and ecological risks of China-Mongolia-Russia high-speed railway construction and policy suggestions. J. Geogr. Sci. 28, 900–918. doi:10.1007/s11442-018-1512-y
Elkhatat, A., and Al-Muhtaseb, S. (2024). Climate change and energy security: a comparative analysis of the role of energy policies in advancing environmental sustainability. Energies 17, 3179. doi:10.3390/en17133179
Guo, K., Cao, Y., Wang, Z., and Li, Z. (2022). Urban and industrial environmental pollution control in China: an analysis of capital input, efficiency and influencing factors. J. Environ. Manag. 316, 115198. doi:10.1016/j.jenvman.2022.115198
Hariram, N. P., Mekha, K. B., Suganthan, V., and Sudhakar, K. (2023). Sustainalism: an integrated socio-economic-environmental model to address sustainable development and sustainability. Sustainability 15, 10682. doi:10.3390/su151310682
Irfan, K., Fujun, H., Abdulrasheed, Z., Muhammad, I., and Munir, A. (2022). Links among energy intensity, non-linear financial development, and environmental sustainability: new evidence from Asia Pacific Economic Cooperation countries. J. Clean. Prod. 330, 129747. doi:10.1016/j.jclepro.2021.129747
Jiang, L., Lai, Y., Guo, R., Li, X., Hong, W., and Tang, X. (2024). Measuring the impact of government intervention on the spatial variation of market-oriented urban redevelopment activities in Shenzhen, China. Cities 147, 104834. doi:10.1016/j.cities.2024.104834
Jiang, L., Wu, Y., He, X., Fu, Q., Wang, Z., and Jiang, Q. (2022). Dynamic simulation and coupling coordination evaluation of water footprint sustainability system in Heilongjiang province, China: a combined system dynamics and coupled coordination degree model. J. Clean. Prod. 380, 135044. doi:10.1016/j.jclepro.2022.135044
Li, D., Liang, D., Li, T., and Chen, S. (2024). Ecological-economic coordination in the Yellow River basin: spatial and temporal evolution and driving mechanisms. Environ. Dev. Sustain 26, 3819–3848. doi:10.1007/s10668-022-02859-6
Li, X., Pan, L., and Zhang, J. (2023). Development status evaluation and path analysis of regional clean energy power generation in China. Energy Strategy Rev. 49, 101139. doi:10.1016/j.esr.2023.101139
Liu, G., Yang, Z., Chen, B., Zhang, Y., Su, M., and Ulgiati, S. (2016). Prevention and control policy analysis for energy-related regional pollution management in China. Appl. Energy 166, 292–300. doi:10.1016/j.apenergy.2015.06.032
Liu, H., Khan, I., Zakari, A., and Alharthi, M. (2022). Roles of trilemma in the world energy sector and transition towards sustainable energy: a study of economic growth and the environment. Energy policy 170, 113238. doi:10.1016/j.enpol.2022.113238
Liu, J., Tian, Y., Huang, K., and Yi, T. (2021). Spatial-temporal differentiation of the coupling coordinated development of regional energy-economy-ecology system: a case study of the Yangtze River Economic Belt. Ecol. Indic. 124, 107394. doi:10.1016/j.ecolind.2021.107394
Mohammad, M. N., Ali, M., Ali Reza, M. B., et al. (2021). System dynamics simulation of regional water supply and demand using a food-energy-water nexus approach: application to Qazvin Plain, Iran. J. Environ. Manag. 280. doi:10.1016/j.jenvman.2020.111843
Ouyang, Y., Cai, Y., Xie, Y., Yue, W., and Guo, H. (2021). Multi-scale simulation and dynamic coordination evaluation of water-energy-food and economy for the Pearl River Delta city cluster in China. Ecol. Indic. 130, 108155. doi:10.1016/j.ecolind.2021.108155
Sun, J., Li, G., and Wang, Z. (2018). Optimizing China’s energy consumption structure under energy and carbon constraints. Struct. Change Econ. Dyn. 47, 57–72. doi:10.1016/j.strueco.2018.07.007
Wang, B., Zhao, J., Dong, K., and Jiang, Q. (2022). High-quality energy development in China: comprehensive assessment and its impact on CO2 emissions. Energy Econ. 110, 106027. doi:10.1016/j.eneco.2022.106027
Wang, X., Lu, Z., Li, T., et al. (2023). Carbon-neutral power system transition pathways for coal-dominant and renewable Resource-abundant regions: Inner Mongolia as a case study. Energy Convers. Manag. 285, 117013. doi:10.1016/j.enconman.2023.117013
Wang, Y., Song, C., Cheng, C., Wang, H., Wang, X., and Gao, P. (2023b). Modelling and evaluating the economy-resource-ecological environment system of a third-polar city using system dynamics and ranked weights-based coupling coordination degree model. Cities 133, 104151. doi:10.1016/j.cities.2022.104151
Wu, J., Xiao, J., Hou, J., and Lyu, X. (2023). Development potential assessment for wind and photovoltaic power energy resources in the main desert–gobi–wilderness areas of China. Energies 16, 4559. doi:10.3390/en16124559
Wu, S., Cheng, P., and Yang, F. (2024). Study on the impact of digital transformation on green competitive advantage: the role of green innovation and government regulation. PLoS ONE 19 (8), e0306603. doi:10.1371/journal.pone.0306603
Wu, S., Li, L., and Li, S. (2018). Natural resource abundance, natural resource-oriented industry dependence, and economic growth: evidence from the provincial level in China. Resour. Conservation Recycl. 139, 163–171. doi:10.1016/j.resconrec.2018.08.012
Yan, X., Chen, M., and Chen, M.-Y. (2019). Coupling and coordination development of Australian energy, economy, and ecological environment systems from 2007 to 2016. Sustainability 11, 6568. doi:10.3390/su11236568
Yang, J., Wu, W., and lin, Y. (2022). The impact of rapid urbanization on residential energy consumption in China. Plos One 17, e0270226. doi:10.1371/journal.pone.0270226
Yang, J., Xu, W., Ma, K., and Li, C. (2023). A three-stage multi-energy trading strategy based on P2P trading mode. IEEE Trans. Sustain. Energy 14 (1), 233–241. doi:10.1109/TSTE.2022.3208369
You, J., and Zhang, W. (2022). How heterogeneous technological progress promotes industrial structure upgrading and industrial carbon efficiency? Evidence from China's industries. Energy 247, 123386. doi:10.1016/j.energy.2022.123386
Yu, Y., and Liu, Z. (2022). Article citation contribution indicator: application in energy and environment. Ecofeminism Clim. Change 3 (2), 81–84. doi:10.26480/efcc.02.2022.81.84
Zhang, J. (2020). “Soil environmental deterioration and ecological rehabilitation,” in Study of ecological engineering of human settlements (Singapore: Springer). doi:10.1007/978-981-15-1373-2_2
Zhang, T., and Chen, C. (2018). The effect of public participation on environmental governance in China–based on the analysis of pollutants emissions employing a provincial quantification. Sustainability 10, 2302. doi:10.3390/su10072302
Zhang, X., and Fan, D. (2022). Carbon emission quota allocation of high energy consumption industries in undeveloped areas – a case study of Inner Mongolia Autonomous Region. Heliyon 8, e11241. doi:10.1016/j.heliyon.2022.e11241
Zhang, Z., Bu, Y., Wu, H., Wu, L., and Cui, L. (2023). Parametric study of the effects of clump weights on the performance of a novel wind-wave hybrid system. Renew. Energy 219, 119464. doi:10.1016/j.renene.2023.119464
Zhiyuan, G., Lianqing, L., and Yu, H. (2024). Resource industry dependence and high-quality economic development of Chinese style: reexamining the effect of the “Resource Curse”. Struct. Change Econ. Dyn., 681. doi:10.1016/j.strueco.2023.09.013
Keywords: inner Mongolia autonomous region, system dynamics, energy, economy, environment, coupling coordination, Inner Mongolia
Citation: Zhu H, Zhu Y, Hu B, Qiao Y and Liu L (2025) Study on the coupling role and forecasting of energy-economy-environment triple system based on system dynamics approach, taking Inner Mongolia autonomous region as an example. Front. Environ. Sci. 12:1494691. doi: 10.3389/fenvs.2024.1494691
Received: 11 September 2024; Accepted: 23 December 2024;
Published: 13 January 2025.
Edited by:
Florian Nuță, Danubius International University, RomaniaReviewed by:
Mohamed R. Abonazel, Cairo University, EgyptCopyright © 2025 Zhu, Zhu, Hu, Qiao and Liu. This is an open-access article distributed under the terms of the Creative Commons Attribution License (CC BY). The use, distribution or reproduction in other forums is permitted, provided the original author(s) and the copyright owner(s) are credited and that the original publication in this journal is cited, in accordance with accepted academic practice. No use, distribution or reproduction is permitted which does not comply with these terms.
*Correspondence: Luxia Liu, c3R1X2xpdWx4QHVqbi5lZHUuY24=
Disclaimer: All claims expressed in this article are solely those of the authors and do not necessarily represent those of their affiliated organizations, or those of the publisher, the editors and the reviewers. Any product that may be evaluated in this article or claim that may be made by its manufacturer is not guaranteed or endorsed by the publisher.
Research integrity at Frontiers
Learn more about the work of our research integrity team to safeguard the quality of each article we publish.