- 1Langfang Integrated Natural Resources Survey Center, China Geological Survey, Langfang, China
- 2Innovation Base for Natural Resources Monitoring Technology of Yongding River Downstream Areas, Geological Society of China, Langfang, China
- 3School of Geographic Sciences, Xinyang Normal University, Xinyang, China
- 4KQ GEO Technologies Co., Ltd., Wuhan, China
The ecological environmental quality (EEQ) of the Yongding-Luan River Basin (YLRB) is pivotal to the ecological security of the Beijing-Tianjin-Hebei (JJJ) region's core area. Evaluating the EEQ and analyzing its changes are essential for regional ecological management. However, long-term ecological changes in the YLRB remain uncovered. In this study, we constructed a seamless Remote Sensing Ecological Index (RSEI) for the YLRB from 1986 to 2022 using time-series Landsat imagery on the Google Earth Engine (GEE) platform. The Sen + Mann-Kendall method was employed to analyze the spatiotemporal trends of EEQ, and the Geodetector was used to quantitatively assess the driving factors and their interactions. The results show that: 1) The mean RSEI of the YLRB increased from 0.486 in 1986 to 0.532 in 2022, marking a 9.5% rise and indicating a fluctuating upward trend. 2) The EEQ of the YLRB experienced three distinct phases: improvement, deterioration, and re-improvement. Improvements were predominantly in the western YLRB, while deterioration was mainly in the northern Xilinguole region and the southern urban expansion areas of Beijing, Langfang, Tianjin, and Tangshan. 3) The driving factor detection indicates that land use type and annual average precipitation are the primary driving factors of RSEI change in the YLRB. Furthermore, their interaction results in a significant effect on RSEI, with a maximum of 0.691. These findings align with the historical urban expansion in the YLRB and the environmental policies implemented by the Chinese government. The ecological evolution and driving factors identified in this study offer a scientific basis for regional ecological decision-making and management.
1 Introduction
The ecological environment is defined as the aggregate of ecological factors that influence human production and life, as well as the evolution of ecosystems (Western, 2001). Environmental quality indicates the ability of a region to harmonize the relationship between social production and the living environment, and it is a crucial material foundation for human survival and development (WEI et al., 2024). However, as a result of economic growth and social advancement, the impact of human activities on the environment is intensifying. Irrational human activities have posed a significant threat to the ecological equilibrium of the region, and the contradiction between ecological conservation and economic development is becoming increasingly pronounced (Hurrell, 1994; Xie, 2020; Yurui et al., 2021; Yang L. et al., 2023).
The timely evaluation of ecological environmental quality (EEQ) and the detection of problems in EEQ have become an important issue for ecosystem protection. A substantial body of research has been conducted on the connotation theory, index system, methodological model, and other issues pertaining to EEQ. Additionally, a range of sophisticated technologies and methodologies have been extensively employed in the domain of EEQ research (Gan et al., 2017). For instance, the U.S. Environmental Protection Agency introduced the Environmental Quality Index (EQI), which covers air, water, land, built environment and sociodemographic environment, to help researchers better understand the relationship between health outcomes and cumulative environmental exposures that are frequently considered in isolation (Agency USEP, 2024). In China, China’s Ministry of Environmental Protection (MEP) has released an ecological index (EI) that combines several environmental factors, including biological richness, vegetation cover, water network density, land stress, pollution load, and an environmental limitation index. The EI has been widely used to assess regional EEQ in China. However, the aforementioned methods require significant investigative work, are costly, and make it challenging to obtain evaluation results in a timely manner. The emergence of remote sensing technology has led to significant advancements in the field of ecological environment monitoring. This technology offers a number of advantages, including a wide monitoring range, rapid imaging speed, a short revisit cycle, and low data costs. As a result, the remote sensing-based indexes and methods of EEQ evaluation have been proposed and continuously improved. Indices such as the Enhanced Vegetation Index (EVI), Normalized Difference Vegetation Index (NDVI), and Land Surface Temperature (LST) can assess the quality of individual elements within terrestrial ecosystems. However, the interactions between each environmental component within an ecosystem can impact the entire system. Thus, evaluating the EEQ requires a more comprehensive index that integrates these various aspects (Xu, 2013). Xu et al. proposed the Remote Sensing Ecological Index (RSEI), which is composed of four indices: greenness, moisture, heat, and dryness. These indices can be obtained directly from remote sensing imagery (Xu, 2013; Xu et al., 2019). In comparison to the EQI and the EI, the RSEI is more concise, requires significantly less computational volume, and allows for a more rapid assessment of ecological status. Consequently, it is a widely used index (Zheng et al., 2022). For instance, the EEQ of the Association of Southeast Asian Nations (ASEAN) from 2000 to 2021 was assessed by Liao, (2022) using the RSEI. Yuan et al. (2021) employed the RSEI to analyze the spatial and temporal changes of the EEQ of the Dongting Lake Basin from 2001 to 2019 and identified its potential relevant driving factors. Liu et al. (2023a) incorporated three-dimensional greenness into the RSEI, thereby enhancing the accuracy of EEQ assessment in forests. However, the backwardness of traditional tools in image storage and batch processing capabilities has become an important factor restricting the application of RSEI in the ecological evaluation and ecological change monitoring with large scale and long time series (Velastegui-Montoya et al., 2023; Tamiminia et al., 2020; Safanelli et al., 2020). The Google Earth Engine (GEE) cloud platform, widely adopted globally, serves as a premier cloud processing platform. It excels in harmonizing temporal and spatial resolutions, providing distinct advantages, particularly for long time series remote sensing monitoring (WEI et al., 2024). Yang et al. (2021) calculated a long time series of RSEI using GEE, analyzed its long-term trend, and investigated the contributions of environmental, human, and topography to RSEI changes. Liu et al. (Liu et al., 2023b) analyzed the EEQ in Nepal from 2014 to 2018, focusing on the impact and recovery of the 2015 earthquake, using GEE and RSEI, and identified altitude and precipitation as key factors in post-disaster recovery, providing insights for local ecological protection and disaster risk management. Compared with the traditional tools, the GEE platform is suitable for RSEI construction and EEQ assessment at a large scale (Xiong et al., 2021).
The Yongding River originates from the Loess Plateau and flows into the Bohai Sea in Tianjin. It passes through the provinces of Shanxi, Inner Mongolia and Hebei, which is of great importance to Beijing as a source of water and as an ecological corridor. However, there are significant issues with the over-exploitation of water resources and river desiccation (Ran et al., 2021). The Luan River originates from Fengning County, enters the Bohai Sea in Leting County, flows through Hebei, Liaoning and Inner Mongolia provinces, and plays an important role in ecological support and water conservation in the Beijing-Tianjin-Hebei (JJJ) region. Due to the ecological importance of the Yongding-Luan River Basin (YLRB), many studies on ecological monitoring and assessment have been implemented. Wang et al. (2019) investigated the changes in the water surface area of reservoirs in the Yongding River basin and their driving factors from 1985 to 2016. Wang et al. (2016) analyzed the effects of climate change and human activity on the annual and seasonal flow patterns of the Luan River. Zhai et al. (2022) used remote sensing to evaluate the effects of ecological restoration projects in the Yongding River basin. However, previous studies have focused on single issues in individual basins, which has led to a lack of research on monitoring the EEQ over a long time series. In addition, the EEQ of the Yongding River and Luan River basins collectively influence the water security and ecological balance of the core region of the JJJ, which is characterized by frequent human activities. To help develop scientific ecological and environmental policies in the core region of the JJJ, research on the assessment and monitoring of EEQ in the Yongding River Basin and the Luan River Basin as a whole would be important.
In view of the above problems, it is of great practical significance to conduct a long-time series EEQ assessment and identification of driving factors in the YLRB to construct harmonious development of the natural environment economy and society. On this basis, the objectives of this study are: 1) To efficiently construct a long-time series RSEI dataset based on the GEE platform by integrating multiple sensors including Landsat TM, ETM+, OLI, and OLI2. 2) To monitor the spatiotemporal changes of EEQ in the YLRB during 1986-2022.3) To explore the driving factors of EEQ in the YLRB. This study will provide a scientific basis for the effective formulation of ecological protection policies and the development of ecological assessment methods in the region.
2 Study area
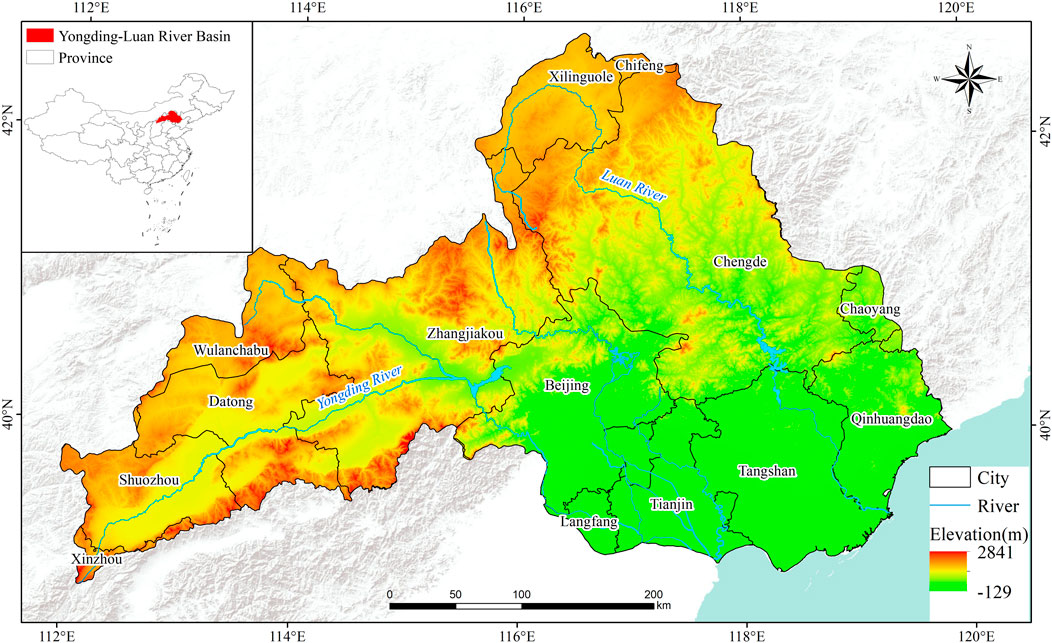
The study area is the YLRB (111°57′4.5″-119°50′21.6″E, 38°52′25.10″-42°43′30″N), which is located in the northern part of the Hai River System and comprises several key water systems including the Yongding River, North Canal, Chaobai River, Jijiang Canal and Luan River. These span across six administrative regions: Beijing, Tianjin, Hebei, Shanxi, Liaoning, and the Inner Mongolia Autonomous Region, covering a total area of 137,900 km2 (Figure 1). The study area is characterized by a warm temperate semi-humid and semi-arid continental monsoon climate, with an annual average temperature of 3.6°C–14°C and an annual average precipitation of 200–900 mm. The study area is bounded by the Taihang Mountains in the southwest. The terrain is generally elevated in the northwest and low in the southeast, exhibiting a rich variety of landforms (including plateaus, mountains, plains, and hills) in the region. The northwestern part of the area is the Damshang Plateau in Inner Mongolia, which is the source of the Yang River (a tributary of the Yongding River), the Chaobai River, and the Luan River. The western and northern parts of the area are the Hengshan Mountains and the Yanshan Mountains, which encompass mountainous areas with long gorges, ravines and many valleys and basins, these areas are sparsely populated. The northeastern part of the area is the Yanshan Low Mountain Range, and the southern and southeastern parts of the area are the North China Plain, which was formed by river flooding.
The YLRB serves as a vital water source for the JJJ region. The study area is characterized by high population density and rapid economic development, as evidenced by statistical data from 1985 to 2022. This data reveals a 161.8-fold surge in GDP, growing from 25.71 billion yuan to 416.11 billion yuan. Concurrently, the population expanded by a factor of 2.2, rising from 9.81 million to 21.84 million (Beijing Statistical Yearbook of 2023, 2023). The rapid social and economic development inevitably puts pressure on natural resources and the environment in this region (Zhang et al., 2023). It is therefore evident that an investigation into the spatial and temporal alterations in the EEQ of the aforementioned area, coupled with an exploration of the underlying driving forces, will prove to be a highly meaningful and topical endeavor.
3 Data and method
3.1 Data collection
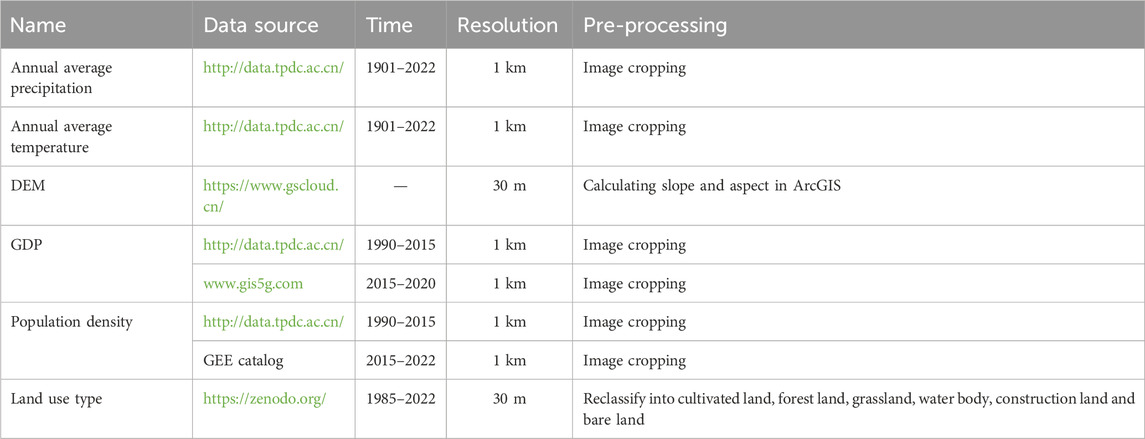
Huang et al. manipulated RSEI to monitor seasonal variations in EEQ in the JJJ region from 2001 to 2020 and found that summer is the best season to construct RSEI (Huang et al., 2024). A total of 5,312 Landsat surface reflectance images, including 3537 Landsat-5, 446 Landsat-7, 972 Landsat-8 and 357 Landsat-9 images, captured between May and September over the period spanning 1985 to 2023, were selected for the construction of RSEI in this study. The QA band of Landsat imagery was used to remove clouds from each image. The JRC Global Surface Water dataset was used to mask water from each image to prevent the RSEI from being influenced by the water body. Besides, to avoid the effects of clouds, shadows and other anomalies that result in missing summers, this study used 3 years as the time period and performed median image composites. The acquisition, cloud removal, water masking, and median compositing of these remote sensing images were performed on the GEE platform. In addition, to explore the natural and anthropogenic driving factors on EEQ change in the YLRB, we collected annual average precipitation (Shouzhang, 2024a), annual average temperature (Shouzhang, 2024b), DEM (NASA. ASTER GDEM 30M, 2024), GDP (Wang and National Tibetan Plateau Data, 2022a; Zhao et al., 2017), population density (Sims et al., 2023; Wang and National Tibetan Plateau Data, 2022b) and land use cover (Zhang et al., 2021) of the study area from the publicly available dataset. The data source and spatiotemporal information are presented in Table 1.
3.2 Methods
The method used in this study consisted of three main steps as shown in Figure 2. 1) The time series RSEI from 1985 to 2023 was calculated from Landsat images on the GEE platform. 2) The spatiotemporal changes of RSEI in the study area were analyzed using the Sen + Mann-Kendall trend analysis approach. 3) The driving factors leading to the spatial changes of RSEI in the study area were detected by Geodetector and their interactions were also explored.
3.2.1 Construction of the RSEI
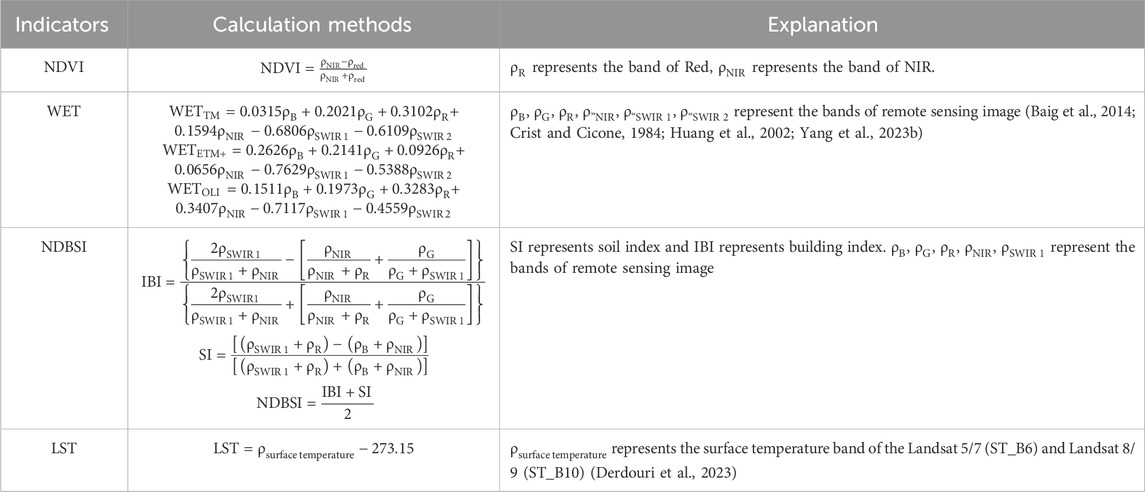
RSEI can well integrate the information of greenness, moisture, heat and dryness, and comprehensively and quantitatively reflect the EEQ and its changes. In this study, the RSEI was used to monitor the spatial and temporal changes of the EEQ of the YLRB from 1986 to 2022. The greenness index was represented by the normalized vegetation index (NDVI), which can characterize the vegetation growth. The moisture index was represented by the modified tasseled hat transformed moisture component (WET), which can characterize the vegetation and soil moisture content. The heat index was represented by the surface temperature (LST). The dryness index (NDBSI) was obtained by averaging the bare soil index (SI) and the building index (IBI), which can characterize urban expansion and land drying. The calculation method of each indicator is shown in Table 2.
It is important to note that due to the non-uniformity of the scale of the four indicators, in order to reduce the impact of the different extremes and scales of the indicators, it is necessary to normalize them, and the normalization formula for each indicator is shown in the equation below.
Where
To obtain a single indicator that represents the four indicators above, the four indicators after normalization can be used for principal component analysis (PCA) to obtain the first component of PCA (PC1). Large values of PC1 represent good ecological conditions. The
To facilitate the measurement and comparison of indicators,
3.2.2 Trend analysis
The Sen + Mann-Kendall method is a widely used non-parametric test for testing the trend of time series data. It does not require the samples to follow a normal distribution and is not disturbed by outliers. Furthermore, it has good noise immunity and is undemanding in terms of the distribution of data (Shahid et al., 2017; Alashan, 2020). Therefore, this method is applied in this paper to investigate the temporal trend of EEQ in the study area. The Sen’s slope is calculated as the equation below.
Where
The formula for the test statistic is shown as the equations below.
The selection of the significance test statistic is contingent upon the magnitude of the n value pertaining to the time series length. When the sample size n is equal to or greater than 10, the test statistic S approximates a normal distribution. Consequently, the Mann-Kendall trend test may be inapplicable when n is less than 10. In this study, the Mann-Kendall trend test is performed using the statistic Z. When the absolute value of Z is greater than 1.65, 1.96, and 2.58, it means that the trend has passed the significance test with 90%, 95%, and 99% confidence, respectively. The formula is illustrated in the equation below.
Where VAR denotes the variance. Using significance level α = 0.05 for the significance test, the series changes significantly when |Z| ≥1.96 and insignificantly when |Z| <1.96.
3.2.3 Driving factors detection
Geodetector is a set of statistical methods for the detection of spatial dissimilarity and the revelation of the driving forces behind it. The fundamental premise idea is predicated on the assumption that if an independent variable exerts a substantial influence on a dependent variable, then the spatial distributions of the independent and dependent variables should exhibit a high degree of similarity (Jinfeng, 2017). The Geodetector is comprised of four main components: the factor detector, the interaction detector, the risk zone detector, and the ecological detector. In this study, the factor detector and the interaction detector were used.
The factor detector was used to detect the ability of the independent variable X to explain the dependent variable Y, measured by the q-value. The formula is shown in the equation below.
The value range of q is [0, 1], the closer the value of q is to 1, the greater the explanatory power of the independent variable X on the dependent variable Y, and vice versa. Where: h = 1., L is the stratification of the variable Y or the factor X,
The interaction detector was used to detect whether different factors X interact with each other or whether the factors are independent of each other. The types of interactions are classified into the following five types, as shown in Table 3.
The analysis of driving factor detections is limited to years with complete data, due to the presence of varying degrees of missing economic, demographic, and land use data in some years and a lack of reliable data sources. The RSEI for the period 1989 to 2019 was selected as the dependent variable. The independent variables selected for subsequent analysis were annual average precipitation (X1), annual average temperature (X2), GDP (X3), population density (X4), elevation (X5), slope (X6), aspect (X7) and land use type (X8). The natural environmental factors of precipitation, temperature, elevation, slope and aspect have been identified as influencing the growth of vegetation. In contrast, the impact of human activities on the natural environment is represented by GDP, population density and land use type. All layers were resampled to a spatial resolution of 1 km. Moreover, this study employed the natural breakpoint method to categorize dependent variables in ArcGIS, constructed a 1 km × 1 km grid within the study area, and obtained the grid center points as sample points, resulting in a total of 136,271.
4 Results and discussion
4.1 Overview change of EEQ
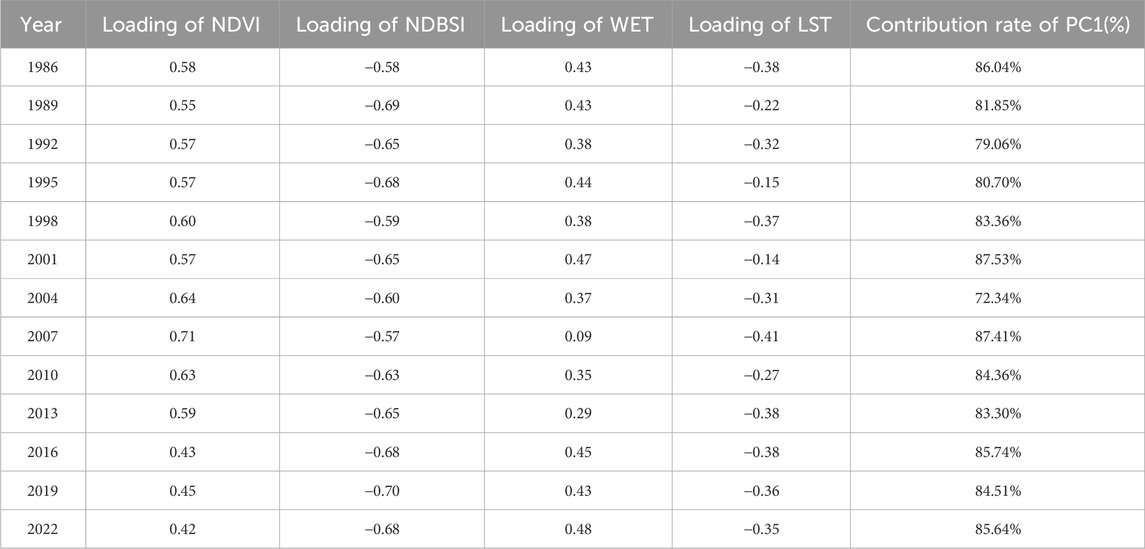
The average contribution of PC1 from 1986 to 2022 was 83.22%, indicating that PC1 integrated the majority of the characteristic information of the four indicators (as shown in Table 4). The NDVI, representing greenness, and WET, representing moisture, had positive values, indicating that they contribute positively to the EEQ. In contrast, the negative values of LST and NDBSI, representing heat and dryness, indicate that they have a negative impact on the EEQ. This aligns with the observed reality.
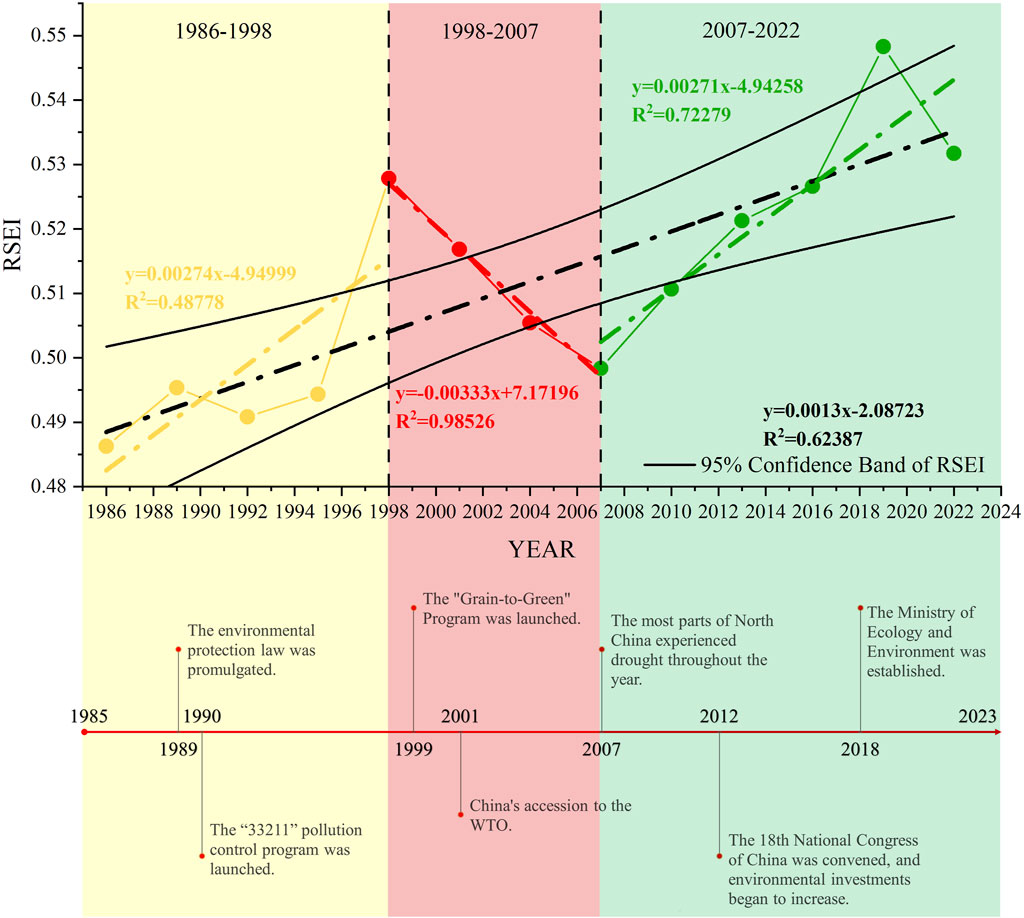
Figure 3 illustrates the changes in the mean RSEI value in the YLRB from 1986 to 2022. There had been a significant enhancement in the EEQ (R2 = 0.62). The mean RSEI value showed an “improvement-deterioration-improvement” trend across different time periods. From 1986 to 1998, the mean RSEI value increased from 0.486 to 0.527, with an increase of 8.4%. From 1998 to 2007, the mean RSEI value decreased to 0.498, with a decrease of 5.5%. From 2007 to 2022, the mean RSEI value exhibited fluctuations but ultimately increased to 0.532. The mean RSEI value reached its highest point in 2019 (0.548) and its lowest point in 1986 (0.486).
The trend of RSEI mean value in the study area is in line with the historical stage of China’s economic development in the past 40 years. For purposes of clarity, we constructed a timeline of influential events, which is presented in Figure 3. With the economic development and industrialization of China in the 1980s, the environmental problems became more and more serious, which attracted the attention of the national authorities. To solve these problems, the Standing Committee of the National People’s Congress accelerated the legislative process of ecological environmental protection (Xie, 2020). In December 1989, the revision of the environmental protection law was officially promulgated, and the “33,211″pollution control program was subsequently launched (Xu et al., 2022). This was the first large-scale pollution control effort in China’s history. The EEQ improved dramatically during this period, as reflected in the rapid increase in the mean RSEI in the study area between 1986 and 1998. With China’s accession to the WTO in 2001, China’s socio-economic development has been rapid. The share of heavy industry and chemicals in the energy, iron and steel, chemical and other industrial sectors continued to increase, as of 2010, Shanxi Province had developed from the early to the middle stage of industrialization, and Hebei Province had developed from the middle to the late stage of industrialization (Huang, 2018). While at the same time, this period saw consecutive years of drought in northern China (MWR, 2006; MWR, 2007; MWR, 2008), as shown in Table 5. This corresponds to a rapid downward trend in the RSEI mean value from 1998 to 2007. Since the 18th National Congress of China, a cumulative total of more than 100 billion yuan of investment within the central budget has been arranged to support the construction of environmental infrastructure, and a cumulative total of 877.9 billion yuan of transfer funds related to ecological protection and restoration has been arranged between 2016 and 2020 (Online, 2020). Accompanied by a large amount of investment, the EEQ has rapidly improved during this period, which is consistent with the trend of the RSEI mean value in Figure 3.
4.1.1 Spatial characteristics of EEQ
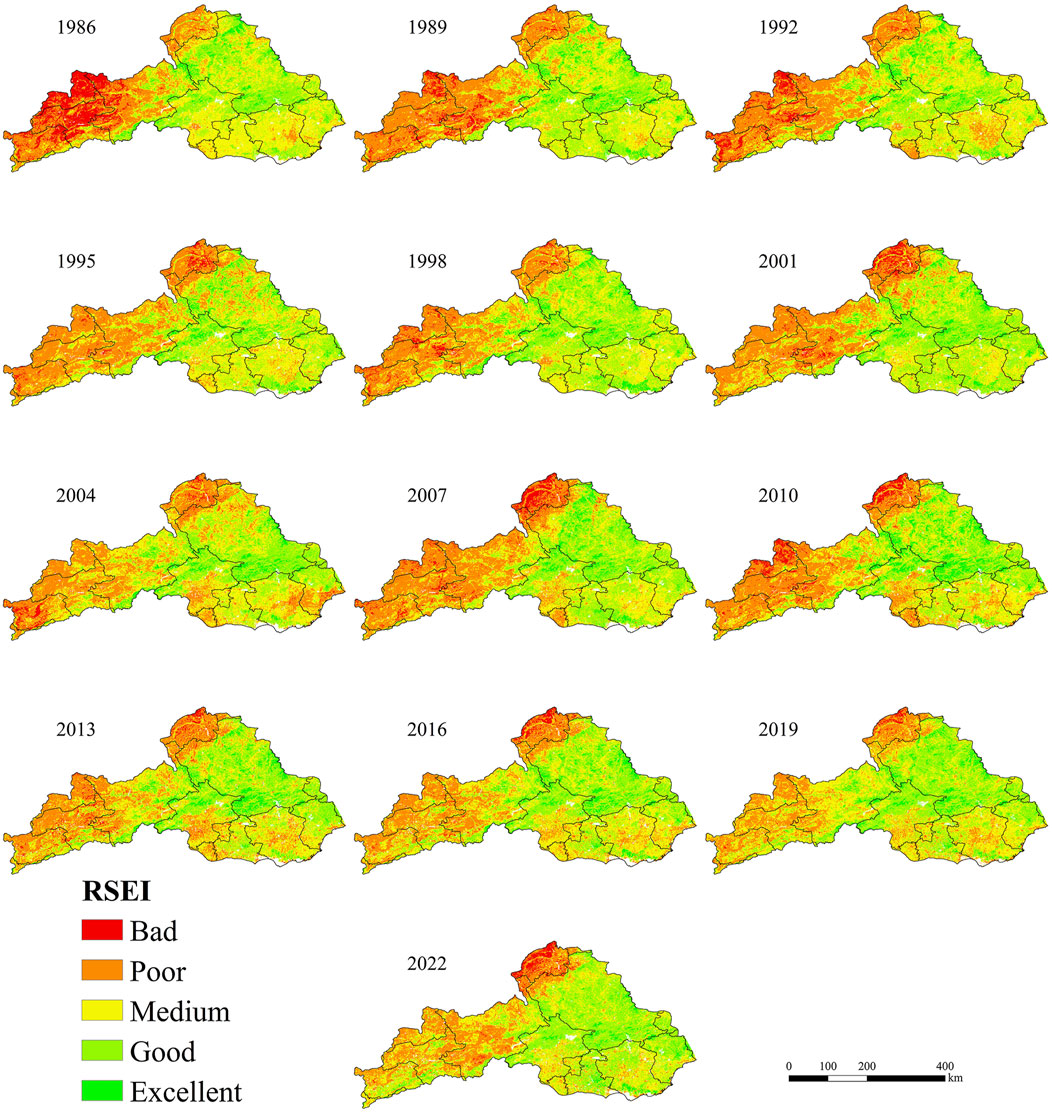
Figure 4 reflects the spatiotemporal distribution of RSEI in the YLRB from 1986 to 2022. From the spatial distribution, it can be seen that the overall EEQ of the YLRB, the southeast part is better than the northwest part. The areas with good and excellent EEQ are mainly distributed in the eastern part of Zhangjiakou, Chengde, and the northwest part of Beijing, especially in the mountainous areas of Zhangjiakou and Chengde, where the terrain is relatively elevated, the vegetation types are mainly forest and pasture, and there is less human activity. The areas with poor and bad EEQ are mainly distributed in the western part of Datong, Shuozhou, Xinzhou, Wulanchabu and the northern part of Xilinguole, which is mainly located on the Loess Plateau and the Inner Mongolia Damshang Plateau, with sparse vegetation, especially in Datong, Shuozhou and Xinzhou, where the mining industry is well developed (Tang et al., 2022), causing considerable pressure on the EEQ. Moreover, there are some areas with poor EEQ in the south of the study area in southeast Beijing, Tianjin, Langfang, Tangshan and Qinhuangdao, where the land-use types are mainly construction land and cropland, and where the regional economy is well developed, human activities are intensive, and the EEQ is vulnerable to human activities.
4.1.2 Temporal characteristics of EEQ
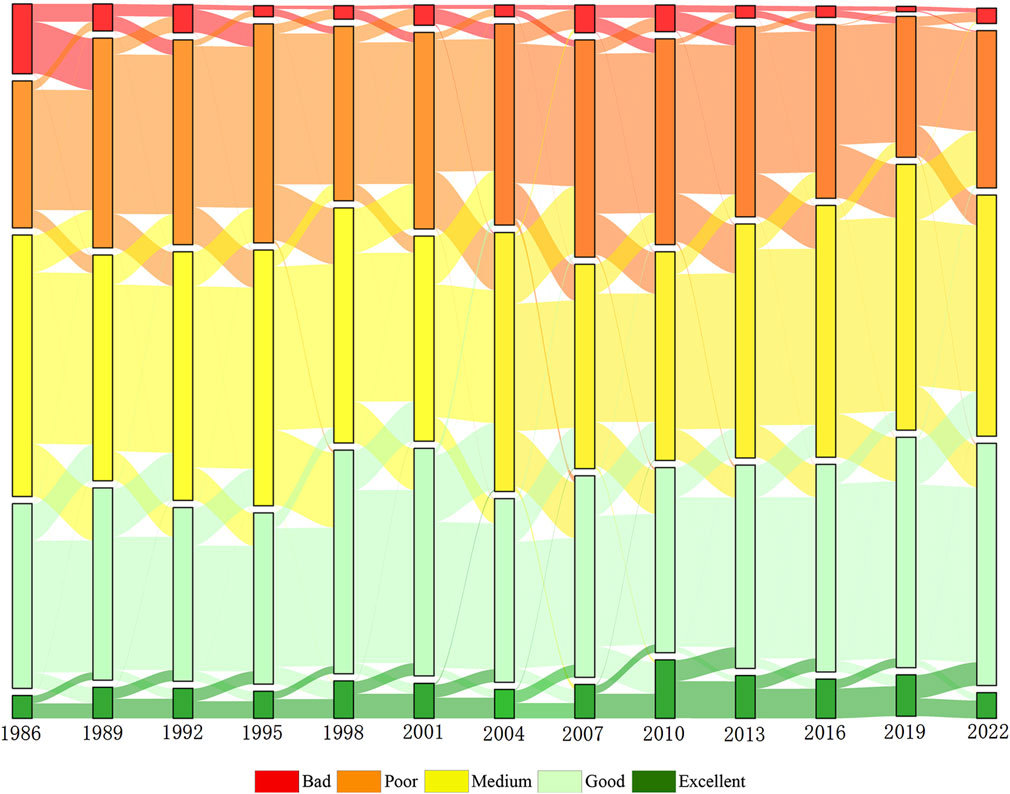
These areas of EEQ changes in the YLRB from 1986 to 2022 were counted (as shown in Figures 4, 5). From 1986 to 1998, in terms of area change, the percentage of area with good and excellent EEQ increased from 30.26% to 38.13%, the percentage of area with poor and bad EEQ decreased from 31.58% to 27.49%, and the percentage of area with medium EEQ decreased from 38.16% to 34.38%. From the trajectory of change, the degree of change of EEQ is mainly in one level, in which the type of improvement is mainly “bad-poor”, “poor-medium” and “medium-good”. This indicates that the EEQ in the study area shows an overall improving trend during this period. From 1998 to 2007, the percentage of good and excellent EEQ decreased from 38.13% to 34.36%, the percentage of poor and bad EEQ increased from 24.49% to 35.75%, and the percentage of medium EEQ decreased from 34.38% to 29.89%, and the degree of change of EEQ was mainly in one level, in which the type of deterioration was dominated by “good-medium” and “medium-poor”. This indicates that the EEQ of the study area deteriorated at all levels during this period. From 2007 to 2022, the percentage of good and excellent EEQ increased from 34.36% to 39.29%, the percentage of poor and bad EEQ decreased from 35.75% to 25.31%, and the percentage of medium EEQ increased from 29.89% to 35.40%, and the change of EEQ was mainly in one level, where the improvement type was mainly “poor-medium” and “medium-good”. It indicates that the EEQ in the study area shows an improving trend. In 2022, the percentage of good and excellent EEQ is 39.29%, poor and bad EEQ is 25.31%, and moderate EEQ is 35.40%.
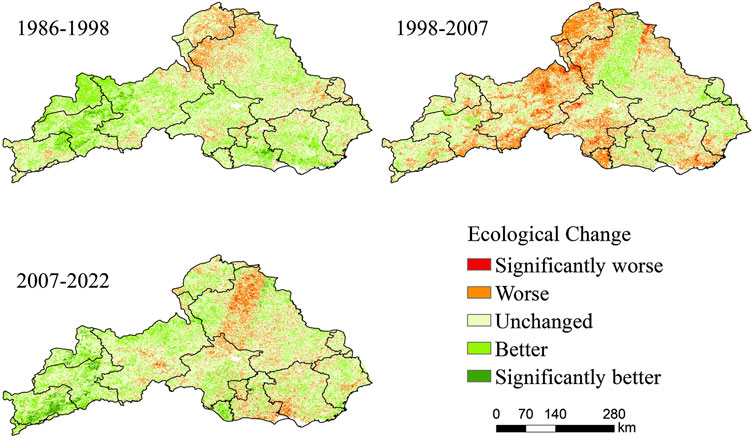
This study classified the EEQ change types into five categories based on the degree of increase or decrease in the RSEI levels. The categories were: significantly worse (−2, −3, −4), worse (−1), unchanged (0), better (+1), and significantly better (+2, +3, +4). The percentage of each category’s area was then calculated (as shown in Figure 6). With regard to the different change periods, from 1986 to 1998, the EEQ, except the northern part of Chengde and the Xilinguole area, was characterized by a dominant trend of improvement. This was evidenced by the percentage of change for the worse and significantly worse was 8.25%, while the percentage of change for the better and significantly better was 29.48%. The percentage of change for the unchanged was 62.27%. The areas of change for the better were located in the western part of the study area in Datong, Zhangjiakou, and Wulanchabu. Additionally, some degree of change for the better has been observed in parts of Tianjin, Tangshan, and Qinhuangdao. From 1998 to 2007, the percentage of better and significantly better was 11.33%, the percentage of worse and significantly was 24.65%, and the percentage of unchanged was 64.03%. The EEQ of the study area showed a trend of deterioration overall. The most significant deterioration was observed in Zhangjiakou, Xilinguole, northern Chengde, the periphery of the Beijing metropolitan area, and Langfang, in comparison to other areas. From 2007 to 2022, the EEQ of the study area showed an overall improvement trend, with 25.88% of the percentage of better and significantly better, 11.62% of the percentage of worse and significantly worse, and 62.49% of the percentage unchanged. The improvement is particularly notable in the Datong, Shuozhou, and Wulanchabu areas, which have exhibited a significant positive change. Conversely, the deterioration was primarily concentrated in Tianjin and Tangshan in the southeast and Chengde and Xilinguole in the north. The EEQ of Xilinguole and northern Chengde showed different degrees of deterioration in the three change periods, which may be related to the grazing activities in the Damshang Plateau of Inner Mongolia.
4.2 Trend analysis of EEQ
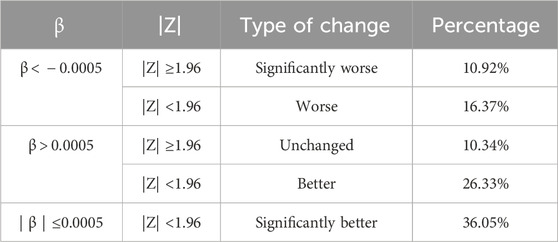
The results of the trend of change in EEQ are shown in Table 6. Overall, 62.38% of the changes were for the better or significantly better, while 27.29% were for the worse or significantly worse. The remaining 10.34% were unchanged.
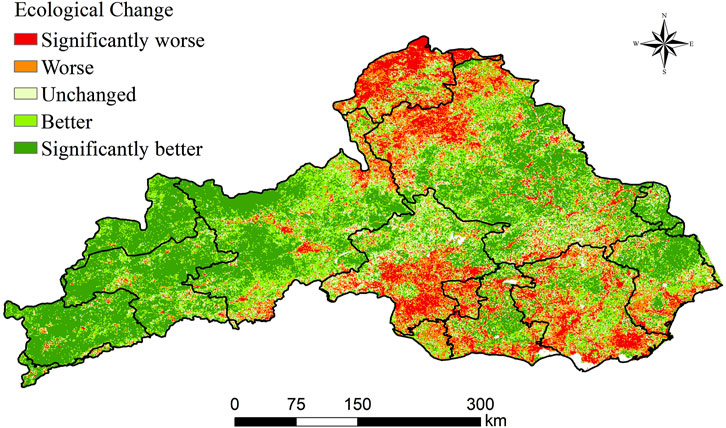
Figure 7 illustrates the spatial distribution characteristics of EEQ trends. The EEQ of the study area in 2022 had shown a marked improvement compared to the 1986 level. The areas of improvement in EEQ are primarily concentrated in Wulanchabu, Datong, Shuozhou, Xinzhou, Zhangjiakou, Qinhuangdao, and southeastern Chengde. Notably, Wulanchabu, Datong, Shuozhou, and Xinzhou, situated within the Loess Plateau, exhibited the most pronounced improvement. This may be attributed to the “Grain-to-Green Program” which was consistently implemented in this region towards the end of the 20th century (Gong et al., 2023), and the substantial investment in numerous ecological restoration initiatives, which has contributed to the sustained enhancement of the region’s EEQ.
The areas with deteriorated EEQ are mainly concentrated in Xilinguole, northern Chengde, the periphery of the Beijing metropolitan area, Langfang, Tianjin and parts of Tangshan. Among them, the deterioration of the EEQ in the northern areas of Xilinguole and Chengde may be related to the vegetation cover and frequent agricultural and livestock activities in the area. The periphery of the Beijing metropolitan area, Langfang, Tianjin and Tangshan areas are the core areas of the economic development of the JJJ region, and the urbanization process and the economic activities of the area in the last 40 years may be the reason for the deterioration of the EEQ in the area.
4.3 Driving factors of EEQ
4.3.1 Single factor detection analysis
To gain further insight into the underlying factors driving EEQ changes in the study area, this study employed the factor detector to assess the explanatory power of each factor related to the RSEI (as shown in Table 7). The results show that 1) With all p-values below 0.001, the analysis confirms a significant impact of these factors on the spatial distribution of RSEI. 2) RSEI in the study area is affected by both natural and anthropogenic factors, with the explanatory power of the factors varying from year to year. The most significant factors are land use type, annual average precipitation, elevation and slope. Furthermore, the explanatory power of land use type and annual average precipitation has been particularly high, exceeding that of other factors. The maximum q-value for land use type is 0.405, while the maximum for annual average precipitation is 0.531. These two factors are identified as the primary driving forces behind RSEI in the study area. 3) With regard to the ranking, the q-value rankings of land use type, annual average precipitation, and elevation are relatively stable, the rankings of slope and population density demonstrate an upward trend, the rankings of temperature and GDP exhibit a downward trend, and the rankings of aspect remain consistently low. The results demonstrated that among the natural factors, annual average precipitation, elevation, and slope exhibited the greatest explanatory power for changes in RSEI. This was evidenced by the observation that the EEQ in the region with high precipitation and complex topography was generally superior to that in the region with low precipitation and flat topography. Among the anthropogenic factors, land use type and population density have the greatest explanatory power for changes in RSEI. The rapid growth of the urbanization level and population density in the study area has an important impact on changes in regional land use types (kullo et al., 2021), which in turn affects the EEQ of the study area. A comparison of the results of the spatio-temporal analysis with the aforementioned factors reveals that the impact is both positive and negative. The continuous implementation of the “Grain-to-Green Program” is an example of a positive impact, as it has transformed a significant amount of cropland into forests. This has led to an improvement in the EEQ of the cities in the western region. However, human activities have also had a negative impact in some regions. The expansion of urban areas in the southern region and the reduction of vegetation cover in the northern region resulting from agricultural and pastoral activities, have led to a continuous deterioration of the EEQ.
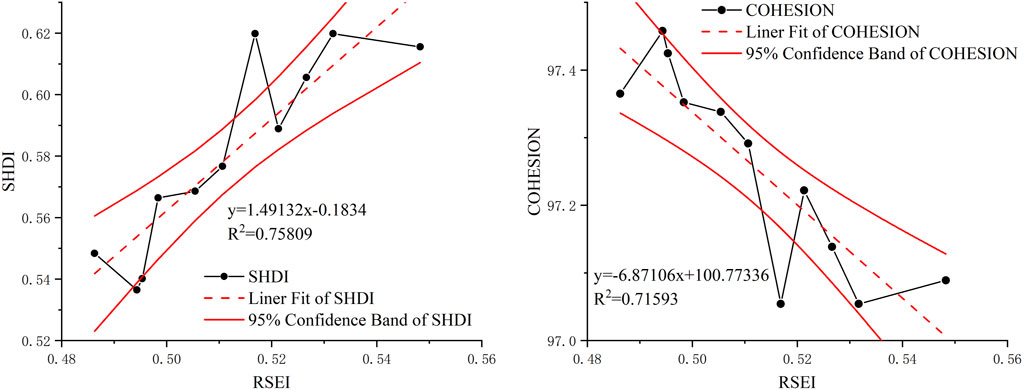
Land use type, as the top-ranked driving factor, its changes encompass a wealth of information on human activities and directly affect EEQ by altering landscape patterns and the structure, function, and ecological processes of ecosystems (Nelson et al., 2010; Polasky et al., 2011). To explore the impact of land use changes on EEQ, we utilized Shannon’s Diversity Index (SHDI) and Patch Cohesion Index (COHESION) to reveal how changes in land use lead to changes in landscape patterns, thereby affecting EEQ. The SHDI and COHESION were calculated based on the land use data using the Fragstats software. We analyzed their relationship with RSEI in the study area, as shown in Figure 8. SHDI shows a significant increasing trend with the growth of RSEI, indicating that SHDI may have a positive impact on EEQ (R2 = 0.76). Conversely, COHESION shows a significant decreasing trend with the increase of RSEI (R2 = 0.72), suggesting that COHESION may have a negative impact on EEQ. Overall, in the study area, the richer the landscape diversity, the more likely it is to have a positive effect on EEQ. Based on this finding, the decision-makers can enhance regional EEQ by altering certain landscape patterns.
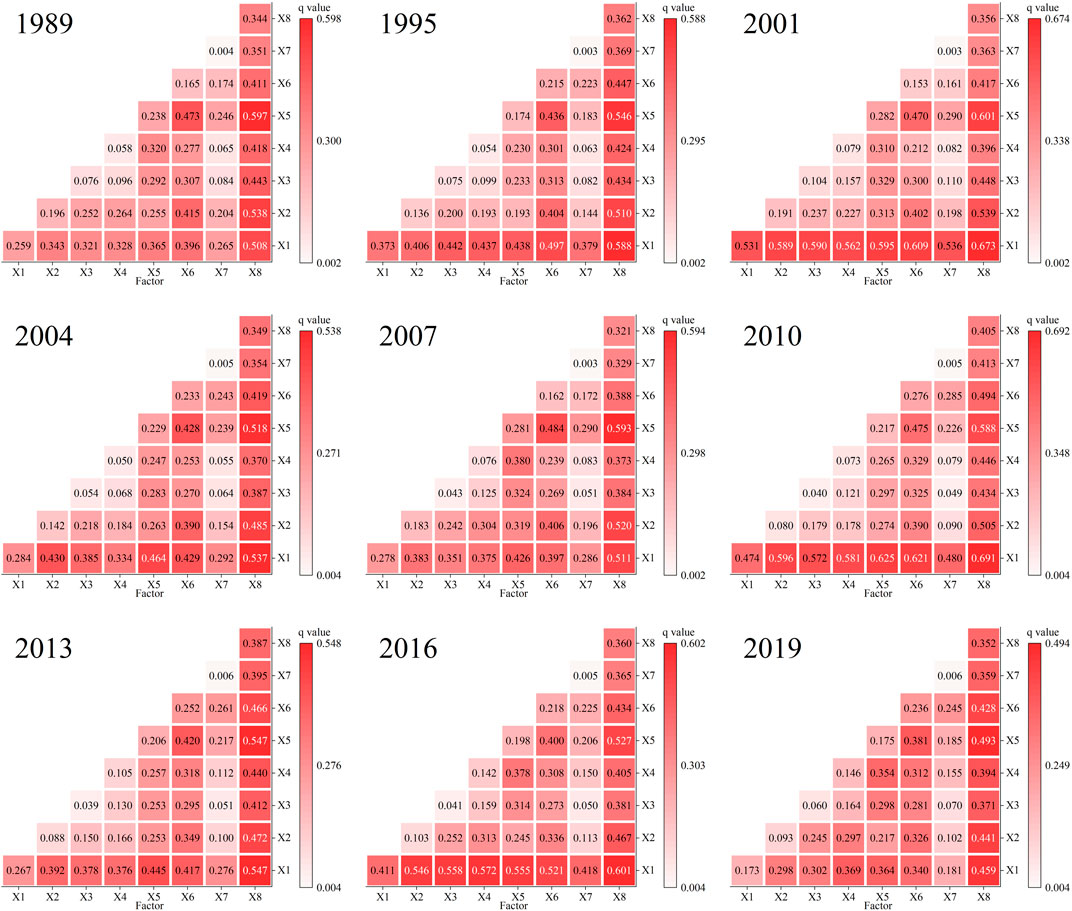
4.3.2 Interaction detection analysis
In this study, the interaction detector was used to investigate the interaction between the factors. The findings indicate that 1) the interactions of the factors were two factors enhancement or nonlinear enhancement (as shown in Figure 9). This suggests that the cumulative impact of multiple factors exerts a more substantial influence on the RSEI of the study area than any single factor. 2) The strongest explanatory power for RSEI in each year is X1∩X8, with a maximum of 0.691, indicating that the interaction between land use type and annual average precipitation has a strong influence on RSEI, and the sharp decline of RSEI in 2007 due to the consecutive droughts in North China in 2006-2008 also side by side confirms this result. Land use type reflects the intensity of human activities to a certain extent (kullo et al., 2021), and the development of land resources by human activities will cause a large amount of water consumption, and the EEQ in areas with low intensity of human activities and high precipitation is better than that in areas with high intensity of human activities and low precipitation. 3) The interaction between slope, aspect and other elements mostly shows non-linear enhancement, slope and aspect reflect the complexity of the terrain to a certain extent, and the development difficulty of the complex terrain area is greater than that of the flat area, and relatively less human activities. This is reflected in the spatial distribution of RSEI that the EEQ of mountainous areas is better than that of flat plains and plateaus, and this confirms that the EEQ of the central part of the study area is better than that of the southern part.
4.4 Limitations and future perspectives
This study provided a scientific basis for the rapid assessment of EEQ in the YLRB and explored its spatiotemporal changes and driving factors. However, there are still some limitations in this study. 1) The complexity and diversity of factors affecting EEQ, along with limited data availability, prevented us from including a broader set of independent variables in our analysis, which limited the comprehensiveness of our analyses. In order to obtain a long time series of data, we selected Landsat imagery rather than higher spatial resolution imagery data, such as Sentinel-2, which limited the precision of our results. In future studies, we plan to collect as much data as possible to enhance the accuracy and reliability of our results. 2) The RSEI model evaluation method mainly revolves around four evaluation indicators: greenness, moisture, heat and dryness, which are difficult to cover the comprehensive content of EEQ. With the development of RSEI, different scholars have improved RSEI for its incompleteness and proposed new RSEI models. For example, Bai et al. (Zongfan et al., 2023) incorporated desertification monitoring index (DMI) and salinity monitoring index (SMI) to RSEI and developed the modified remote sensing ecological index (MRSEI) for arid regions. However, the new RSEIs have not been rigorously validated on a larger scale, and therefore have not been used in this study, but could be used as a direction for improving the accuracy of the RSEI model in future research. 3) Geodetector is a powerful tool for measuring, mining, and utilizing spatial heterogeneity. Its theoretical core is to detect the consistency of spatial distribution patterns between the dependent variable and independent variables through spatial heterogeneity, thereby measuring the influence of independent variables on the dependent variable. However, it cannot simultaneously assess the joint impact of multiple variables on changes in EEQ (Yao et al., 2023). Therefore, in future work, we plan to explore the nonlinear driving mechanisms of multiple factors on EEQ.
5 Conclusion
This study, based on Landsat data and the GEE platform, constructed a time series dataset of RSEI for YLRB from 1986 to 2022, assessing the EEQ of the region. Utilizing the Sen + Mann-Kendall trend analysis method, the overall trend of EEQ was detected, and the spatiotemporal characteristics of the changes were analyzed. Employing the Geodetector tool, the main driving factors affecting the EEQ of the YLRB were explored. The findings can be concluded as follows:
1) From 1986 to 2022, the mean value of RSEI in the YLRB shows a fluctuating upward trend, with the mean value of RSEI increasing from 0.486 in 1986 to 0.532 in 2022, with an overall increase of 9.5%, indicating that the EEQ of the study area is improving. In terms of spatial distribution, the EEQ of the eastern cities in the study area is generally better than that of the western cities. In terms of phases, from 1986 to 1998, the government’s pollution control measures were effective, and the EEQ improved. From 1998 to 2007, with China’s accession to the WTO, the economy developed rapidly, urban expansion accelerated, and the EEQ deteriorated sharply. From 2007 to 2022, the EEQ improved again accompanied by large-scale investment in ecological restoration (Yang L. et al., 2023).
2) The analysis of temporal and spatial changes shows that the EEQ of the YLRB has an overall improvement trend from 1986 to 2022, with 62.38% of the areas better and significantly better, and 27.29% of the areas worse and significantly worse. Datong, Shuozhou, Xinzhou and Wulanchabu areas show the most obvious improvement in EEQ, indicating that the Grain-to-Green Program, which has been continuously implemented in this area since the end of the 20th century, has been effective. The deterioration of EEQ in the northern parts of Xilinguole and Chengde may be related to local agricultural and livestock activities. In the periphery of the Beijing metropolitan area, Langfang, Tianjin, and parts of Tangshan, the EEQ has deteriorated, and the spatial distribution of degraded areas closely resembles the extent of urban expansion.
3) The results of factor detection showed that land use type and annual average precipitation had the greatest influence on RSEI, with the highest q-value ranking for land use type. The q-value ranking of slope increased the most, from 5th to 2nd place, and the q-value ranking of population density increased the second, from 7th to 5th place, indicating that topography and human activities have had a remarkable influence on RSEI in recent years. The results of interaction detection showed that the effects of each factor on RSEI were enhanced to different degrees, among which the interaction between land use type and annual average precipitation had the most significant effect on RSEI, up to 0.691. Building on these findings, this study further explored the changes in landscape patterns caused by land use changes and their subsequent impact on EEQ. It was revealed that in the YLRB, the SHDI has a positive impact on EEQ, while the COHESION has a negative impact on EEQ.
This study, for the first time, conducted a comprehensive monitoring of EEQ across the Yongding and Luan River basins as a whole, covering a nearly 40-year period that encompassed the rapid economic development of the region. The results revealed the spatiotemporal changes in EEQ in response to regional economic growth and environmental protection investment, explored the main drivers of EEQ, and discovered the positive impact of landscape diversity on the EEQ of the study area. It will provide a basis for scientific decision-making in ecological environment construction and sustainable development for the region.
Data availability statement
The original contributions presented in the study are included in the article/supplementary material, further inquiries can be directed to the corresponding author.
Author contributions
YL: Conceptualization, Data curation, Writing–original draft, Writing–review and editing. WX: Conceptualization, Methodology, Writing–review and editing. JZ: Formal Analysis, Methodology, Writing–review and editing. DZ: Funding acquisition, Writing–review and editing.
Funding
The authors declare that financial support was received for the research, authorship, and publication of this article. The authors disclosed receipt of the following financial support for the research, authorship, and publication of this article: This study was supported by grants from the geological survey projects of the China Geological Survey Bureau (DD20242329,DD20243170).
Conflict of interest
Author JZ was employed by KQ GEO Technologies Co., Ltd.
The remaining authors declare that the research was conducted in the absence of any commercial or financial relationships that could be construed as a potential conflict of interest.
Publisher’s note
All claims expressed in this article are solely those of the authors and do not necessarily represent those of their affiliated organizations, or those of the publisher, the editors and the reviewers. Any product that may be evaluated in this article, or claim that may be made by its manufacturer, is not guaranteed or endorsed by the publisher.
References
Agency USEP (2024). An official website of the United States government. Environ. Qual. Index (EQI). Available at: https://www.epa.gov/healthresearch/environmental-quality-index-eqi.
Alashan, S. (2020). Combination of modified Mann-Kendall method and Şen innovative trend analysis. Eng. Rep. 2 (3). doi:10.1002/eng2.12131
An, M., Xie, P., He, W., Wang, B., Huang, J., and Khanal, R. (2022). Spatiotemporal change of ecologic environment quality and human interaction factors in three gorges ecologic economic corridor, based on RSEI. Ecol. Indic. 141, 109090. doi:10.1016/j.ecolind.2022.109090
Baig, M. H. A., Zhang, L., Shuai, T., and Tong, Q. (2014). Derivation of a tasselled cap transformation based on Landsat 8 at-satellite reflectance. Remote Sens. Lett. 5 (5), 423–431. doi:10.1080/2150704x.2014.915434
Crist, E. P., and Cicone, R. C. (1984). A physically-based transformation of thematic mapper data---the TM tasseled cap. IEEE Trans. Geoscience Remote Sens. (3), 256–263. doi:10.1109/tgrs.1984.350619
Derdouri, A., Murayama, Y., and Morimoto, T. (2023). Spatiotemporal thermal variations in Moroccan cities: a comparative analysis. Sensors (Basel) 23 (13), 6229. doi:10.3390/s23136229
Gan, X., Fernandez, I. C., Guo, J., Wilson, M., Zhao, Y., Zhou, B., et al. (2017). When to use what: methods for weighting and aggregating sustainability indicators. Ecol. Indic. 81, 491–502. doi:10.1016/j.ecolind.2017.05.068
Gong, C., Lyu, F., and Wang, Y. (2023). Spatiotemporal change and drivers of ecosystem quality in the Loess Plateau based on RSEI: a case study of Shanxi, China. Ecol. Indic. 155, 111060. doi:10.1016/j.ecolind.2023.111060
Huang, C., Wylie, B., Yang, L., Homer, C., and Zylstra, G. (2002). Derivation of a tasselled cap transformation based on Landsat 7 at-satellite reflectance. Int. J. remote Sens. 23 (8), 1741–1748. doi:10.1080/01431160110106113
Huang, S., Li, Y., Hu, H., Xue, P., and Wang, J. (2024). Assessment of optimal seasonal selection for RSEI construction: a case study of ecological environment quality assessment in the Beijing-Tianjin-Hebei region from 2001 to 2020. Geocarto Int. 39 (1), 2311224. doi:10.1080/10106049.2024.2311224
Hurrell, A. (1994). A crisis of ecological viability? Global environmental change and the nation state. Polit. Stud. 42 (1_Suppl. l), 146–165. doi:10.1111/j.1467-9248.1994.tb00010.x
Jinfeng, WANG C. X. (2017). Geodetector: principle and prospective (in Chinese). Acta Geogr. Sin. 72 (1), 116–134. doi:10.11821/dlxb201701010
kullo, E. D., Forkuo, E. K., Biney, E., Harris, E., and Quaye-Ballard, J. A. (2021). The impact of land use and land cover changes on socioeconomic factors and livelihood in the Atwima Nwabiagya district of the Ashanti region, Ghana. Environ. Challenges 5, 100226. doi:10.1016/j.envc.2021.100226
Liao, W. (2022). Temporal and spatial variations of eco-environment in Association of Southeast Asian Nations from 2000 to 2021 based on information granulation. J. Clean. Prod. 373, 133890. doi:10.1016/j.jclepro.2022.133890
Liu, Y., Lin, Y., Wang, F., Xu, N., and Zhou, J. (2023b). Post-earthquake recovery and its driving forces of ecological environment quality using remote sensing and GIScience, a case study of 2015 Ms8.1 Nepal earthquake. Geomatics, Nat. Hazards Risk 14 (1). doi:10.1080/19475705.2023.2279496
Liu, Y., Xu, W., Hong, Z., Wang, L., Ou, G., Lu, N., et al. (2023a). Integrating three-dimensional greenness into RSEI improved the scientificity of ecological environment quality assessment for forest. Ecol. Indic. 156, 111092. doi:10.1016/j.ecolind.2023.111092
MWR (2006). Bulletin of flood and drought disasters in China. China Ministry Water Resour. Available at: http://www.mwr.gov.cn/sj/tjgb/zgshzhgb/201612/t20161222_776084.html.
MWR (2007). Bulletin of flood and drought disasters in China. China Ministry Water Resour. Available at: http://www.mwr.gov.cn/sj/tjgb/zgshzhgb/201612/t20161222_776085.html.
MWR (2008). Bulletin of flood and drought disasters in China. China Ministry Water Resour. Available at: http://www.mwr.gov.cn/sj/tjgb/zgshzhgb/201612/t20161222_776086.html.
Nelson, E., Sander, H., Hawthorne, P., Conte, M., Ennaanay, D., Wolny, S., et al. (2010). Projecting global land-use change and its effect on ecosystem service provision and biodiversity with simple models. PloS one 5 (12), e14327. doi:10.1371/journal.pone.0014327
Online, P. D. (2020). Ministry of finance: during the 13th five-year plan period. central Gov. invested 877.9 billion yuan support Ecol. Prot. Restor. Available at: http://finance.people.com.cn/n1/2020/1217/c1004-31970139.html.
Polasky, S., Nelson, E., Pennington, D., and Johnson, K. A. (2011). The impact of land-use change on ecosystem services, biodiversity and returns to landowners: a case study in the state of Minnesota. Environ. Resour. Econ. 48, 219–242. doi:10.1007/s10640-010-9407-0
Ran, S., Pan, X.-y., Wang, J.-w., Yu, R., Peng, D., Yao, M., et al. (2021). An analysis and evaluation of ecological water replenishment benefit of Yongding River (Beijing section). China Rural Water Hydropower (6), 19–24. Available at: https://irrigate.whu.edu.cn/EN/Y2021/V0/I6/19
Safanelli, J. L., Poppiel, R. R., Ruiz, L. F. C., Bonfatti, B. R., Mello, F. A. O., Rizzo, R., et al. (2020). Terrain analysis in google earth engine: a method adapted for high-performance global-scale analysis. ISPRS Int. J. Geo-Information 9 (6), 400. doi:10.3390/ijgi9060400
Shahid, M., Cong, Z., and Zhang, D. (2017). Understanding the impacts of climate change and human activities on streamflow: a case study of the Soan River basin, Pakistan. Theor. Appl. Climatol. 134 (1-2), 205–219. doi:10.1007/s00704-017-2269-4
Shouzhang, P. (2024a). “1-km monthly precipitation dataset for China (1901-2023). Natl. Tibet. Plateau Data Cent. doi:10.5281/zenodo.3114194
Shouzhang, P. (2024b). “1-km monthly mean temperature dataset for China (1901-2023). Natl. Tibet. Plateau Data Cent. doi:10.11888/Meteoro.tpdc.270961
Sims, K., Reith, A., Bright, E., Kaufman, J., Pyle, J., Epting, J., et al. (2023). LandScan global 2022. 2022 ed. Oak Ridge, TN: Oak Ridge National Laboratory.
Tamiminia, H., Salehi, B., Mahdianpari, M., Quackenbush, L., Adeli, S., and Brisco, B. (2020). Google Earth Engine for geo-big data applications: a meta-analysis and systematic review. ISPRS J. photogrammetry remote Sens. 164, 152–170. doi:10.1016/j.isprsjprs.2020.04.001
Tang, H., Fang, J., Xie, R., Ji, X., Li, D., and Yuan, J. (2022). Impact of land cover change on a typical mining region and its ecological environment quality evaluation using remote sensing based ecological index (RSEI). Sustainability 14 (19), 12694. doi:10.3390/su141912694
Velastegui-Montoya, A., Montalván-Burbano, N., Carrión-Mero, P., Rivera-Torres, H., Sadeck, L., and Adami, M. (2023). Google Earth Engine: a global analysis and future trends. Remote Sens. 15 (14), 3675. doi:10.3390/rs15143675
Wang, C. W. J. (2022a). in Kilometer grid dataset of China's historical GDP spatial distribution (1990-2015). Editor C. National Tibetan Plateau Data (National Tibetan Plateau Data Center). doi:10.12078/2017121102
Wang, C. W. J. (2022b). in Kilometer grid dataset of China's historical population spatial distribution (1990-2015). Editor C. National Tibetan Plateau Data (National Tibetan Plateau Data Center). doi:10.12078/2017121101
Wang, H., Chen, L., and Yu, X. (2016). Distinguishing human and climate influences on streamflow changes in Luan River basin in China. Catena 136, 182–188. doi:10.1016/j.catena.2015.02.013
Wang, M., Du, L., Ke, Y., Huang, M., Zhang, J., Zhao, Y., et al. (2019). Impact of climate variabilities and human activities on surface water extents in reservoirs of yongding River Basin, China, from 1985 to 2016 based on Landsat observations and time series analysis. Remote Sens. 11 (5), 560. doi:10.3390/rs11050560
Wei, X. Y. D. Z., Cai, X. W., Shao, Y., and Tang, X. L. (2024). Ecological environmental quality evaluation and driving factor analysis of the Lijiang River Basin, based on Google Earth Engine. Chin. J. Eco-Agriculture. doi:10.12357/cjea.202300633
Western, D. (2001). Human-modified ecosystems and future evolution. Proc. Natl. Acad. Sci. 98 (10), 5458–5465. doi:10.1073/pnas.101093598
Xie, Z. (2020). China’s historical evolution of environmental protection along with the forty years’ reform and opening-up. Environ. Sci. Ecotechnology 1, 100001. doi:10.1016/j.ese.2019.100001
Xiong, Y., Xu, W., Lu, N., Huang, S., Wu, C., Wang, L., et al. (2021). Assessment of spatial–temporal changes of ecological environment quality based on RSEI and GEE: a case study in Erhai Lake Basin, Yunnan province, China. Ecol. Indic. 125, 107518. doi:10.1016/j.ecolind.2021.107518
Xu, H. (2013). A remote sensing urban ecological index and its application. Acta Ecol. Sin. 33 (24), 7853–7862. doi:10.5846/stxb201208301223
Xu, H., Wang, Y., Guan, H., Shi, T., and Hu, X. (2019). Detecting ecological changes with a remote sensing based ecological index (RSEI) produced time series and change vector analysis. Remote Sens. 11 (20), 2345. doi:10.3390/rs11202345
Xu, Z., Dai, Y., and Liu, W. (2022). Does environmental audit help to improve water quality? Evidence from the China National Environmental Monitoring Centre. Sci. Total Environ. 823, 153485. doi:10.1016/j.scitotenv.2022.153485
Yang, H., Yu, J., Xu, W., Wu, Y., Lei, X., Ye, J., et al. (2023b). Long-time series ecological environment quality monitoring and cause analysis in the Dianchi Lake Basin, China. Ecol. Indic. 148, 110084. doi:10.1016/j.ecolind.2023.110084
Yang, L., Liu, Y., and Deng, H. (2023a). Environmental governance, local government competition and industrial green transformation: evidence from China's sustainable development practice. Sustain. Dev. 31 (2), 1054–1068. doi:10.1002/sd.2440
Yang, X., Meng, F., Fu, P., Zhang, Y., and Liu, Y. (2021). Spatiotemporal change and driving factors of the eco-environment quality in the yangtze River Basin from 2001 to 2019. Ecol. Indic. 131, 108214. doi:10.1016/j.ecolind.2021.108214
Yao, B., Ma, L., Si, H., Li, S., Gong, X., and Wang, X. (2023). Spatial pattern of changing vegetation dynamics and its driving factors across the yangtze River Basin in chongqing: a geodetector-based study. Land 12 (2), 269. Cited in: Pubmed; PMID. doi:10.3390/land12020269
Yuan, B., Fu, L., Zou, Y., Zhang, S., Chen, X., Li, F., et al. (2021). Spatiotemporal change detection of ecological quality and the associated affecting factors in Dongting Lake Basin, based on RSEI. J. Clean. Prod. 302, 126995. doi:10.1016/j.jclepro.2021.126995
Yurui, L., Xuanchang, Z., Zhi, C., Zhengjia, L., Zhi, L., and Yansui, L. (2021). Towards the progress of ecological restoration and economic development in China's Loess Plateau and strategy for more sustainable development. Sci. Total Environ. 756, 143676. doi:10.1016/j.scitotenv.2020.143676
Zhai, L., Cheng, S., Sang, H., Xie, W., Gan, L., and Wang, T. (2022). Remote sensing evaluation of ecological restoration engineering effect: a case study of the Yongding River Watershed, China. Ecol. Eng. 182, 106724. doi:10.1016/j.ecoleng.2022.106724
Zhang, X., Liu, L., Chen, X., Gao, Y., Xie, S., and Mi, J. (2021). GLC_FCS30: global land-cover product with fine classification system at 30 m using time-series Landsat imagery. Earth Syst. Sci. Data 13 (6), 2753–2776. doi:10.5194/essd-13-2753-2021
Zhang, Y., Zhu, T., Guo, H., and Yang, X. (2023). Analysis of the coupling coordination degree of the Society-Economy-Resource-Environment system in urban areas: case study of the Jingjinji urban agglomeration, China. Ecol. Indic. 146, 109851. doi:10.1016/j.ecolind.2022.109851
Zhao, N., Liu, Y., Cao, G., Samson, E. L., and Zhang, J. (2017). Forecasting China’s GDP at the pixel level using nighttime lights time series and population images. GIScience and Remote Sens. 54 (3), 407–425. doi:10.1080/15481603.2016.1276705
Zheng, Z., Wu, Z., Chen, Y., Guo, C., and Marinello, F. (2022). Instability of remote sensing based ecological index (RSEI) and its improvement for time series analysis. Sci. Total Environ. 814, 152595. doi:10.1016/j.scitotenv.2021.152595
Keywords: remote sensing ecologic index, spatiotemporal changes, geodetector, Yongding-Luan River Basin, google earth engine
Citation: Li Y, Xie W, Zhang J and Zhang D (2024) Spatiotemporal changes and driving factors of ecological environmental quality in the Yongding-Luan River Basin based on RSEI. Front. Environ. Sci. 12:1494098. doi: 10.3389/fenvs.2024.1494098
Received: 10 September 2024; Accepted: 04 November 2024;
Published: 15 November 2024.
Edited by:
Changchun Huang, Nanjing Normal University, ChinaReviewed by:
Muhammad Shahid, Brunel University London, United KingdomYaohui Liu, Shandong Jianzhu University, China
Copyright © 2024 Li, Xie, Zhang and Zhang. This is an open-access article distributed under the terms of the Creative Commons Attribution License (CC BY). The use, distribution or reproduction in other forums is permitted, provided the original author(s) and the copyright owner(s) are credited and that the original publication in this journal is cited, in accordance with accepted academic practice. No use, distribution or reproduction is permitted which does not comply with these terms.
*Correspondence: Dongming Zhang, bGl5YW5nODcxMjEwQGdtYWlsLmNvbQ==
 Yang Li
 Wenquan Xie
 Jiangdong Zhang4