 Weihua Pang
 Yanli Zhang
 Jianqiang Zeng
 Xiao Tian1
 Xinming Wang
94% of researchers rate our articles as excellent or good
Learn more about the work of our research integrity team to safeguard the quality of each article we publish.
Find out more
ORIGINAL RESEARCH article
Front. Environ. Sci. , 02 October 2024
Sec. Biogeochemical Dynamics
Volume 12 - 2024 | https://doi.org/10.3389/fenvs.2024.1490552
Terrestrial vegetation emits substantial amounts of highly reactive isoprene, significantly impacting atmospheric chemistry and climate change. Both atmospheric carbon dioxide (CO2) concentration and temperature can influence plant isoprene emissions; however, whether these factors have a synergistic effect remains unclear, particularly for tropical/subtropical plants. In this study, we conducted in-situ controlled experiments on Eucalyptus urophylla, a representative tropical/subtropical species, to investigate the seasonal variation in the response of isoprene emissions to CO2 concentrations (ISOP-CO2 response) and to identify potential controlling factors. The results showed that high CO2 exerts a nearly linear inhibitory effect on isoprene emissions, as indicated by the slope of the ISOP-CO2 response curve. This inhibitory effect exhibited evident seasonal changes, with stronger suppression during cooler seasons and weaker suppression during warmer seasons. This finding contrasts with the default ISOP-CO2 response in the MEGAN model, which ignored seasonal variation. Further analysis showed a significant correlation between the slope of the ISOP-CO2 response curve and growth temperature from the past 10 days, indicating that these metrics are effective indicators for predicting seasonal changes. Our findings reveal a synergistic mechanism between temperature and CO2 concentration effects on isoprene emissions. By coupling the effects of growth temperature with the ISOP-CO2 response, this mechanism can be integrated into models to provide more accurate predictions of future isoprene emissions, reducing prediction biases, especially during cooler seasons.
The global total emissions of biogenic volatile organic compounds (BVOCs) from terrestrial vegetation exceed 1 Pg yr⁻1, which is nearly ten times the amount of anthropogenic VOC emissions (Guenther et al., 1995), with isoprene accounting for nearly half of total BVOC emissions (Guenther et al., 2012; Sindelarova et al., 2014; Messina et al., 2016). Due to its huge emissions and high reactivity, isoprene plays a crucial role in influencing the atmospheric hydroxyl radical budget and contributes significantly to the formation of regional ozone (O₃) and secondary organic aerosols (Pierce et al., 1998; Claeys et al., 2004; Mentel et al., 2013; Harper and Unger, 2018), further impacting global climate (Goldstein et al., 2009; Ehn et al., 2014). Thus, accurate estimation of isoprene emissions is essential for assessing its impact on atmospheric chemical processes and climate change.
Isoprene emissions are influenced by several environmental factors, including temperature, light, and CO2 concentration (Loreto and Schnitzler, 2010; Peñuelas and Staudt, 2010; Monson et al., 2013; Lantz et al., 2019a; Sharkey et al., 2020). Numerous studies have extensively explored the effects of temperature and light on isoprene emissions, leading to the development of the light-temperature emission mechanism, which is widely used to estimate isoprene emissions at both regional and global scales (Monson and Fall, 1989; Loreto and Sharkey, 1990; Guenther et al., 1995; 2006; 2012; Monson et al., 2007; Mutanda et al., 2016; Higa et al., 2018; Sharkey et al., 2020). In contrast, research on the impact of CO2 on isoprene emissions is relatively sparse, despite a general consensus that high CO2 concentrations inhibit isoprene emissions (Wilkinson et al., 2009; Possell and Hewitt, 2011; Lantz et al., 2019b; Yang et al., 2021). However, the mechanism behind this inhibition is not fully understood and remains at the hypothesis stage (Rosenstiel et al., 2003; Rasulov et al., 2009; 2018; Lantz et al., 2019b).
Despite the uncertainties, previous studies have developed an algorithmic relationship between isoprene emissions and CO2 concentrations based on limited experimental data from temperate plants (Possell et al., 2005; Heald et al., 2009; Wilkinson et al., 2009; Sun et al., 2012), and this algorithm has been incorporated into widely used models such as the Model of Emissions of Gases and Aerosols from Nature (MEGAN) (Guenther et al., 2012). However, the ISOP-CO2 response relationship varies significantly among different plant species, as shown by the inconsistent suppression of isoprene emissions under high CO2 concentrations (Lantz et al., 2019b; Niinemets et al., 2021). This suggests that using constant algorithm parameters in global isoprene emission models may introduce significant uncertainties. Relative to temperate plants, numerous studies have demonstrated differences in the light-temperature mechanism of isoprene emission in tropical plants (Kuhn et al., 2004; Guenther et al., 2006; Bracho-Nunez et al., 2013; Higa et al., 2018; Mu et al., 2022; Zeng et al., 2023). However, there is a significant lack of understanding of the ISOP-CO2 response in tropical plants. It remains unclear whether the CO2 response mechanism in tropical species differs from that of temperate species and whether modeling algorithms based on temperate plants are applicable to tropical plants. Further research is necessary to verify these relationships.
Numerous studies have demonstrated not only species-specific differences but also seasonal variations in the ISOP-CO2 response (Loreto and Sharkey, 1990; Affek and Yakir, 2002; Monson et al., 2016; Niinemets et al., 2021). Typically, the suppression of isoprene emissions by high CO2 concentrations is weaker during warmer seasons and stronger during cooler seasons (Monson et al., 2016). Laboratory studies have further found that elevated temperatures can partially counteract the inhibitory effect of high CO2 concentrations on isoprene emissions (Potosnak et al., 2014; Lantz et al., 2019b; Sahu et al., 2023). These findings suggest that growth temperature may be the primary driver of the seasonality observed in the ISOP-CO2 response, and establishing a relationship between ISOP-CO2 response and growth temperature could effectively account for these seasonal variations. However, in the current MEGAN model, the ISOP-CO2 response parameters are fixed, and the default response relationship does not adjust for seasonal changes (Wilkinson et al., 2009; Guenther et al., 2012). Therefore, it is essential to incorporate the seasonality of the ISOP-CO2 response into the model to improve its accuracy. It is essential to note that tropical and subtropical regions experience higher temperatures and less pronounced annual variations than temperate regions. As a result, it remains unclear whether tropical plants exhibit any seasonality in their ISOP-CO2 response. Further research is needed to accurately reflect the seasonality of the ISOP-CO2 response in these regions within the model.
Tropical and subtropical regions are major hotspots for isoprene emissions, contributing approximately 80% of global emissions (Guenther et al., 2012). Eucalyptus urophylla (E. urophylla) is a representative tree species in these regions and is widely distributed across the globe (Wang et al., 2013; Carignato et al., 2020). In South China, E. urophylla is a dominant species, comprising over 15% of the forest composition in Guangdong, Guangxi, and Hainan (Zhang and Wang, 2021; Chen et al., 2022; Ouyang et al., 2022). Previous research has identified E. urophylla as one of the tree species with the highest potential for isoprene emissions in South China (Zeng et al., 2022a). In light of this, our study conducted an in-situ controlled experiment on E. urophylla to investigate its ISOP-CO2 response and the seasonality of this relationship. We also aimed to identify the main factors driving seasonal variations in this response. The findings of this study, which can provide a scientific foundation for understanding the relationship between isoprene emissions and CO2 response in tropical and subtropical plants and help to improve the ISOP-CO2 response mechanism in the model, will inspire and motivate future research in this field.
The field measurement site is located in Heshan, Guangdong Province, southern China, near the Heshan National Field Research Station (Heshan-NFRS) of Forest Ecosystems (22.683°N, 112.900°E). The E. urophylla forests selected for this study covered an area of more than 25 hm2, and were planted and completely natural growth. All individuals in the forests were similar in overall growth, with an age of about 2 years and an average height of about 12–15 m. In-situ measurements were carried out in September 2022 (Sep. 2022), March 2023 (Mar. 2023), and October 2023 (Oct. 2023), and more detailed information on sampling sites can be found in the previous study (Zeng et al., 2024).
The CO2 response curves for isoprene emissions from E. urophylla were measured using a portable photosynthesis system (LI-6800, Li-Cor Biosciences, Lincoln, NE, United States). Three trees were randomly selected for each experiment, and one healthy, sunlit and mature leaf per tree was randomly selected for the control experiments, all leaves being 2–2.5 m above the ground. The CO2 concentration gradients were set at 50, 100, 200, 300, 400, 500, 600, 800, 1,000 ppm, with other environmental factors such as temperature, light (Photosynthetic active radiation, PAR), and relative humidity carefully maintained at 30°C, 1,000 μmol m−2 s−1, and 55%, respectively. We used a standard leaf chamber with an area of 6 cm2 and the circulating air inlet flow rate was set at 500 μmol s−1 (∼735 mL min−1). The recycle gas passed through an active charcoal VOCs-scrubber and Na2S2O3 (Sodium thiosulfate) column to remove BVOCs and O3 before entering the instrument. The gas from the leaf chamber was divided into two paths, one of which (flow rate is 200 μmol m−2s−1) passed through an infrared gas analyzer (IRGA), and the other (flow rate is 300 μmol m−2s−1) flowed out of the sampling port, and thus could be sampled from the outlet of the chamber. Sampling was initiated 5 min after leaf photosynthesis had fully stabilized, and BVOCs samples were collected using an adsorbent cartridge bedded with Tenax TA and Carbograph 5TD (C2-AAXX-5149, Marks International Ltd., United Kingdom) combined with a portable dual-channel sampler (ZC-QL, Zhejiang Hengda Instrumentation Ltd., China). The sampling flow rate is 200 mL min-1 with duration of 5 min, resulting in a sampling volume of 1 L. The collected adsorbent cartridge samples were meticulously stored and analyzed within 1 week, ensuring the thoroughness of our data collection process.
Adsorbent cartridge samples were analyzed using an automated thermal desorption-gas chromatography/mass spectrometry system (TD-GC/MS, Markes TD-100/Agilent 5975/Agilent 7890). The TD-100 thermally desorbed the adsorbent tubes at 280°C for 10 min, and then the desorbed analytes were transferred by high-purity helium through a transfer line at 180°C to a cryogenic cold trap at −10 °C (U-T11PGC-2S, Markes International Ltd., United Kingdom). The cold trap was then rapidly heated to 320°C, and the high-temperature desorbed analytes were carried by helium at a flow rate of 1 mL min−1 into an HP-5MS capillary column (30 m × 0.25 mm × 0.25 μm, Agilent Technologies, Inc., CA, United States) for separation and then analyzed by mass selective detector (MSD, model 5975, Agilent Technologies, Inc., CA, United States). The initial gas chromatography (GC, model 7890, Agilent Technologies, Inc., CA, United States) oven temperature was 35°C (3 min hold), then increased to 100°C at 5°C min−1 and hold for 1 min, then to 120°C at 10°C min−1 and hold for 12 min, and then to 260°C at 20°C min−1 with a final hold for 2 min. The MSD was operated in both scan mode with electron impacting ionization at 70 eV. Target compounds were identified by their retention times and mass spectra and quantified with the standard calibration curves. More details on the identification and quantification methods were described in the previous articles of our group (Zeng et al., 2022a; 2022b; 2024).
The isoprene emission rate (E, nmol m−2 s−1) can be calculated as (Equation 1):
Where F (μmol s−1) is the flow rate of circulating air, here F = 500 μmol s-1; Cout (nmol mol−1) and Cin (nmol mol−1) are the isoprene volume mixing ratio at the outlet and inlet air, respectively; S (cm2) is the area of the leaf chamber, which was 6 cm2; 10−6 is the conversion factor from μmol to mol; 10−4 is the conversion factor from cm2 to m2.
In order to fit the ISOP-CO2 response curves using the model algorithm, the emission rates measured at different concentration conditions need to be normalized to 400 ppm measurements (Equation 2), respectively, to obtain normalized isoprene-CO2 response curves:
Where ECO2 is the actual emission rate at different CO2 concentrations and E400 is the actual emission rate at 400 ppm CO2 concentration; γ is the activity factor. The normalized response curves were fitted using the CO2 response algorithm (Equation 3) in MEGAN v2.1:
Where Is,max is the maximum standardized isoprene emission rate predicted by the algorithm and is unitless; γc,i is the activity factor of isoprene emission; Ca is the CO2 concentration (ppm); h and Cq are unitless empirical parameters, and the initial values of the fit are the default values of the MEGAN model, specifically, Is,max = 1.072; h = 1.7; Cq = 1,218 (Wilkinson et al., 2009).
The ISOP-CO2 response curves for E. urophylla were obtained through in situ control experiments on subtropical Eucalyptus across different seasons. Figure 1 shows the ISOP-CO2 response curves for three different months, along with the parameter fits derived from the data. The variations in these parameters explain the differences in the peak points and subsequent downward trends of the curves. Although the E. urophylla individuals measured each month were randomly selected, the isoprene emission trends in response to CO2 concentration were consistent among different individuals within the same month. This suggests that the ISOP-CO2 response pattern is consistent among individuals of the same species during the same month. As illustrated in Figure 1, isoprene emissions peaked as CO2 concentrations increased from 50 ppm to approximately 200–300 ppm and then decreased, indicating that isoprene emissions from tropical/subtropical E. urophylla are suppressed by high levels of CO2 concentration. The similar suppress phenomenon were also observed for temperate plants (Rosenstiel et al., 2003; Heald et al., 2009; Potosnak et al., 2014; Sharkey and Monson, 2014). While this suppression is common among tree species, there are significant differences in the degree of suppression reported in different studies, indicating species-specific differences in the ISOP-CO2 response curves (Niinemets et al., 2021).
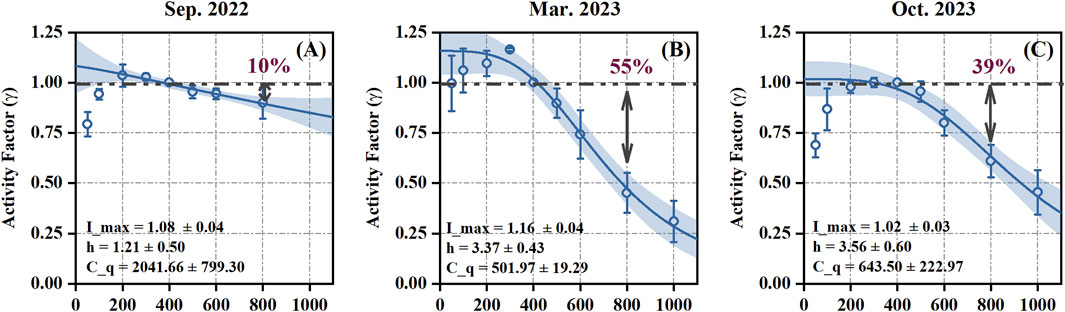
Figure 1. The ISOP-CO2 response curves for different months (Sep. 2022 (A) , Mar. 2023 (B), and Oct. 2023 (C)). Horizontal coordinate is CO2 concentration (ppm). The solid blue line is the generalized fitted curve and the shading is the 95% confidence interval; purple numbers represent the degree of suppression at a CO2 concentration of 800 ppm relative to 400 ppm.
Although the extent of isoprene emission suppression by high CO2 concentrations varied significantly between months, the overall pattern of the ISOP-CO2 response curve remained relatively consistent within each month. The seasonal variations of ISOP-CO2 responses showed that relatively stronger suppression in cooler seasons and weaker suppression in warmer seasons. Similar seasonal variations were also found from temperate trees (Monson et al., 2016), and the growth temperature were supposed to contribute to the observed seasonal changes in ISOP-CO2 response (Potosnak et al., 2014; Lantz et al., 2019b; Sahu et al., 2023). Laboratory experiments on poplar have similarly found that elevated temperatures may counteract this inhibitory effect (Potosnak et al., 2014; McClain and Sharkey, 2019; Sahu et al., 2023). Similarly, from our field experiments conducted in Sep. 2022, Mar. 2023, and Oct. 2023, activity factor of isoprene emission (devoted as γ in Figure 1) decreased by 10%, 55%, and 39% on average in Sep. 2022, Mar. 2023, and Oct. 2023, respectively, at 800 ppm CO2 when compared to the emissions at 400 ppm CO2, with daytime mean temperatures of 32.1°C, 22.9°C, and 28.7°C, respectively. These findings align with other studies suggesting that growth temperature is a potential factor driving the seasonal changes in the ISOP-CO2 response and demonstrating a synergistic effect of temperature and CO2 on isoprene emissions. However, the effects of temperature and CO2 on isoprene emissions are currently treated as independent modules in the MEGAN model (Guenther et al., 2012). As global temperatures and CO2 concentrations increase together, incorporating the synergistic effects of temperature and CO2 into the model will be crucial for accurately simulating and understanding the future impacts of climate change on isoprene emissions.
To further investigate the coupling between temperature and ISOP-CO2 response, we linearly fitted the ISOP-CO2 response curves within this CO2 concentration range (e.g., 400–1,000 ppm), using the slope (k value) to characterize the degree of suppression, and explored the seasonal variations of the k value in relation to different temperature. The study on subtropical Eucalyptus demonstrates that the seasonality of the ISOP-CO2 response curve is correlated with growth temperature. The linear fitting results revealed that the k values of the ISOP-CO2 response curves for Sep. 2022, Mar. 2023, and Oct. 2023 were −2.4 × 10⁻⁴, −11.0 × 10⁻⁴, and −8.0 × 10⁻⁴, respectively (Supplementary Figure S1). This correlation may arise from changes in the sensitivity of isoprene emissions to CO2 as a result of plant adaptation to growth temperature or modifications in isoprene emissions (Niinemets and Sun, 2015; Lantz et al., 2019a; 2019b; Sahu et al., 2023).
Previous studies have shown that isoprene emission factors are influenced by the average temperature over the past 1–10 days, indicating an adaptive mechanism of isoprene emission to growth temperature (Sharkey et al., 1999; Rapparini et al., 2004; Guenther et al., 2012). We selected the average daily mean temperature (TEMPmean) and the average daily maximum temperature (TEMPmax) for the past 1-, 5-, and 10-day, respectively, as indicators of growth temperature. The temperature data were obtained from the Heshan National Field Research Station of Forest Ecosystems (http://hsf.cern.ac.cn/). As shown in Figure 2, a significant correlation (p < 0.05) between the k values and temperature with correlation coefficient (r2) values ranging from 0.85 to 0.96 were obtained. The overall correlation between the k value and the TEMPmax was slightly higher than with the TEMPmean. Additionally, the correlation between k values and the temperature over the past 10-day was generally higher than in the past 5- and 1-day. Moreover, the r2 values between the k value and the TEMPmean and TEMPmax over the past 10-days exceeded 0.90 (0.93 and 0.96, respectively), suggesting that the past 10 days temperature can be used as indicators for predicting the seasonal pattern of the ISOP-CO2 response.
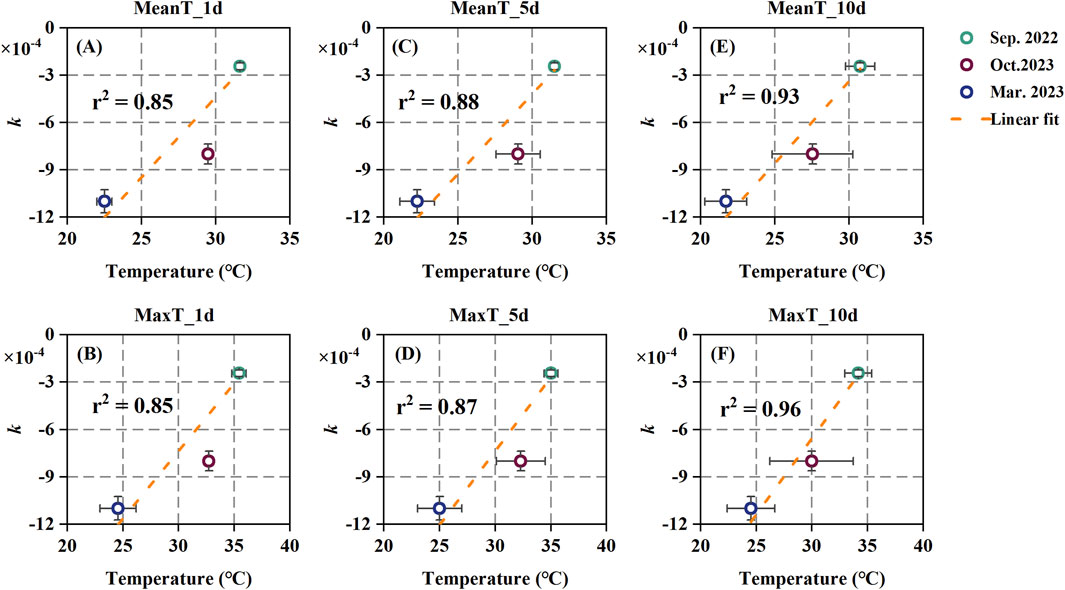
Figure 2. The relationships of ISOP-CO2 response curve k values with temperature; (A, C, E) are linear relationships of k values with average daily mean temperatures, and (B, D, F) are linear relationships of k values with average daily maximum temperatures.
Besides the environment factors, the variation in plant physiological parameters, such as photosynthesis (Pn), stomatal conductance (gs), and electron transfer rate (ETR), that could influence the ISOP-CO2 response curve were also investigated. As shown in Figure 3, these parameters were expressed as relative changes. The Pn-CO2 curves for Sep. 2022, Mar. 2023, and Oct. 2023 displayed consistent trends. Photosynthetic activity increased rapidly with CO2 concentration from a negative value to approximately 1.2 when CO2 reached 600 ppm, after which it plateaued, indicating a saturation point under high CO2 conditions (Figure 3A). The gs showed considerable variation at low CO2 concentrations (<300 ppm), but the gs-CO2 curves exhibited high consistency as CO2 concentration increased (Figure 3B). However, the ETR-CO2 curves followed a similar trend to the Pn-CO2 curves but with noticeable seasonal changes. Specifically, the ETR-CO2 curves were consistent across months at lower CO2 concentrations (<400 ppm), but diverged significantly at higher CO2 concentrations, stabilizing in the high-temperature month (Sep. 2022) and decreasing in cooler months (Mar. 2023 and Oct. 2023). The ETR-CO2 curves for Mar. 2023 and Oct. 2023 decreased by 12.4% and 5.0%, respectively, at 800 ppm compared to 400 ppm CO2 (Figure 3C).
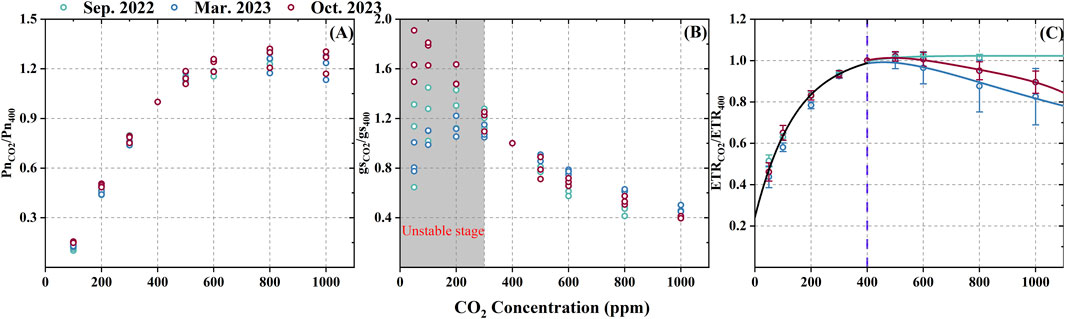
Figure 3. The relative changes of Pn-CO2 (A), gs-CO2 (B), and ETR-CO2 (C) curves. Pn, gs and ETR are expressed using relative change values (e.g., PnCO2/Pn400 is the relative change value for Pn), which are calculated in the same way as for the CO2 activity factor (see Equation 2).
Plant physiological states can be influenced by factors such as PAR, temperature, CO2 concentration, or biotic stressors (e.g., viruses, pests) (Mu et al., 2022). However, since we chose healthy and sunlight leaves during our experiments, the effects of factors like PAR, viruses, and pests can be disregarded. The consistent Pn-CO2 curves across the three experiments suggest that photosynthetic activity remained stable despite seasonal variations (Figure 3), likely due to isoprene synthesis utilizing only 1%–2% of the carbon fixed by photosynthesis (Niinemets et al., 2021). The gs also showed consistent trends at high CO2 concentrations across months, while variations at low CO2 concentrations were likely due to unstable stress responses affecting stomatal behavior (Monson et al., 2013; Oikawa and Lerdau, 2013; De Souza et al., 2018). These findings align with other studies showing that gs does not significantly impact isoprene emissions (Sahu et al., 2023), implying that gs is not a major factor in the seasonal variation of ISOP-CO2 curves.
A prevailing hypothesis suggested that the suppression of the ISOP-CO2 response curve is due to limitations in the availability of key substances such as adenosine triphosphate (ATP) and nicotinamide adenine dinucleotide phosphate (NADPH) (Niinemets et al., 1999; Rosenstiel et al., 2003; Rasulov et al., 2009; 2016; 2018; Morfopoulos et al., 2014). Based on this, the triose phosphate utilization (TPU) limitation hypothesis was proposed, which posits that under high CO2 concentrations, the rate of increase in photosynthesis outpaces the rate at which glyceraldehyde 3-phosphate (GAP) is utilized by the methylerythritol 4-phosphate (MEP) pathway. This leads to inorganic phosphate (Pi) accumulation in chloroplasts, which is then incorporated into phosphorus-containing sugars, thereby inhibiting ATP synthesis (McClain and Sharkey, 2019). Although Lantz et al. (2019b) argued that TPU limitation is not essential for suppressing isoprene emissions under high CO2 concentrations, its presence can still influence the degree of suppression. Furthermore, TPU limitation may be alleviated at higher temperatures, as increased respiration rates and upregulated enzyme activity in the MEP pathway facilitate the release of accumulated Pi, thereby removing the TPU limitation (Monson et al., 2016). Evidence for this was observed in our experimental results, where the ETR-CO2 curves did not exhibit suppression at high CO2 concentrations during the warm month (Sep. 2022). In contrast, such suppression was evident in cooler months (March and October 2023) (Figure 3C). The more significant decrease in Mar. 2023 compared to Oct. 2023 is likely attributable to the lower average daytime mean temperatures in March (22.9°C vs. 28.7°C, respectively).
The reduction in the ETR-CO2 curve at high concentrations is considered characteristic of TPU limitation (McClain and Sharkey, 2019). It can be used to infer whether leaves are experiencing this limitation, which rarely occurs at temperatures above 30°C. This suggests that temperature is likely a key factor controlling the seasonality of the ISOP-CO2 response, as other major influences did not significantly alter the plant’s physiological state. Our study further supports this, showing that this acclimatization mechanism is reflected in the ISOP-CO2 response curve.
Over time, the correlation between temperature indicators and the k value of the ISOP-CO2 response curve was higher over the past 10 days compared to the past 5 and 1 days, suggesting that this acclimation mechanism has a delayed effect. This delay may be related to physiological adjustments made by plants in response to temperature changes, such as alterations in membrane permeability, the expression of specific functional genes, and the synthesis of secondary metabolites like isoprenoid compounds (Jagadish et al., 2021; Wang et al., 2024). The slightly higher overall correlation between the k value and TEMPmax compared to TEMPmean suggests that heat stress may also affect the ISOP-CO2 response, likely due to the plant’s stress response to sudden temperature changes, which could involve regulating isoprene emission, stomatal conductance, and respiration rate (Li and Sharkey, 2013; Li et al., 2020). Given the strong correlation between the k value with the TEMPmean and the TEMPmax over the past 10 days (with correlation coefficients larger than 0.90), it is possible to model the relationship between temperature and the ISOP-CO2 response by further incorporating the effects of temperature on the k value (Figure 2).
The comparison of the ISOP-CO2 response curves for each month with the model default response curves and found that the model (MEGAN default k = −3.7 × 10⁻⁴) predicts stronger suppression of isoprene emissions at high CO2 concentrations than what was observed in Sep. 2022, but weaker suppression compared to Mar. 2023 and Oct. 2023 (Supplementary Figure S2). This leads to an underestimation of isoprene emissions during the high-temperature months and an overestimation during the low-temperature months. For example, at a CO2 concentration of 800 ppm, the model underestimates emissions by 5% in Sep. 2022 but overestimates the emisions by 38% in Mar. 2023 and 21% in Oct. 2023, respectively. Therefore, to lower the uncertainties of isoprene emission simulation, it is important to account for seasonal variations in the ISOP-CO2 response, such as by incorporating the effect of the TEMPmax over the past 10 days, as suggested above.
Even though the strong suppression of isoprene emissions only occurred under high CO2 concentrations, not the current state. Under climate change, wildfires’ extent, frequency, intensity, and duration have increased recently, leading to significant spikes in atmospheric CO2 concentrations and regional temperatures in localized areas. For example, during the Australian wildfires of 2019–2020, CO2 concentrations in smoke-covered regions increased by 5- to 80-fold (Van Der Velde et al., 2021; Hong et al., 2023). Under such conditions, isoprene emissions from vegetation surrounding the wildfire perimeter may be severely suppressed by high CO2 concentrations. However, the accompanying increase in temperature could mitigate the extent of this suppression. Our results provide insights into assessing the impacts of isoprene emissions from vegetation in wildfire-affected regions, which is essential for accurately estimating the consequences of wildfire disasters.
Moreover, according to the IPCC report, global average CO2 concentrations are expected to reach 900 ppm or higher by the end of the 21st century, and global average temperatures could rise by 1°C–4.5°C (IPCC, 2018). Under future conditions, the suppression of isoprene emissions by CO2 will become more pronounced. However, this study shows that this effect must account for seasonal variability. Our results also suggest that rising global temperatures may reduce the suppression effect of CO2 on isoprene emissions in the future. However, current models do not include the coupling mechanism between temperature and the ISOP-CO2 response, which could introduce significant uncertainty into predictions of future isoprene emissions. The current model may exhibit a slight prediction bias (e.g., <10%) during future high-temperature seasons or extreme heatwaves, potentially overestimating emissions during cooler seasons. To more accurately predict future isoprene emissions, it is necessary to incorporate the coupling mechanism between temperature and the ISOP-CO2 response into the model.
Additionally, many studies have shown that elevated atmospheric CO2 concentrations fertilize terrestrial vegetation, leading to increased net primary productivity and leaf area index (Piao et al., 2012; Forkel et al., 2016; Chen et al., 2019). This increase may partially offset the suppression of isoprene emissions caused by higher CO2 levels. Therefore, assessing the impact of elevated CO2 on future isoprene emissions requires a comprehensive approach that considers multiple factors and coupled mechanisms.
In this study, we conducted in situ control experiments with subtropical E. urophylla trees to investigate the responses of their isoprene emissions on CO2 concentrations. The results demonstrated significant seasonality in the ISOP-CO2 response of Eucalyptus, with isoprene suppression by high CO2 concentrations being lower during the high-temperature season and higher during the low-temperature season. We inferred that growth temperature is the primary factor driving this seasonal variation. Additionally, we found a strong correlation (r2 > 0.9) between growth temperature indicators, such as the average daytime mean temperature and the average daytime maximum temperature over the past 10 days with the degree of suppression (k). This suggests that these temperature indicators can predict seasonal changes in the ISOP-CO2 response. Therefore, incorporating the coupling of growth temperature with the ISOP-CO2 response into models is essential for more accurately predicting isoprene emissions under future climate scenarios or extreme wildfire conditions. Although the ISOP-CO2 response curve for E. urophylla in tropical and subtropical regions has been studied, research on other common tree species is necessary due to the species-specific differences in ISOP-CO2 responses. Future studies should focus on a broader range of tree species to understand how various physiological traits influence isoprene emissions under elevated CO2 conditions, which would aid in developing more comprehensive models for predicting emissions at the ecosystem level. Long-term field experiments in natural forests, exposed to varying environmental conditions and stressors, would also help validate findings from controlled studies, providing more realistic insights into how rising CO2 levels affect isoprene emissions in situ. Additionally, future research should explore how elevated CO2 interacts with other environmental factors, such as temperature, moisture, and pollutants like ozone and nitrogen oxide, to build a more holistic understanding of isoprene emissions. Incorporating empirical data into ecosystem models that account for interspecies interactions, varying tree densities, and different forest management practices can bridge the gap between individual tree studies and broader ecosystem impacts.
The raw data supporting the conclusions of this article will be made available by the authors, without undue reservation.
WP: Data curation, Investigation, Methodology, Software, Writing–original draft. YZ: Conceptualization, Data curation, Funding acquisition, Investigation, Methodology, Project administration, Resources, Supervision, Writing–review and editing. JZ: Data curation, Investigation, Methodology, Software, Writing–review and editing. XT: Data curation, Investigation, Methodology, Writing–review and editing. XW: Conceptualization, Funding acquisition, Methodology, Project administration, Supervision, Writing–review and editing.
The author(s) declare that financial support was received for the research, authorship, and/or publication of this article. This work was supported by the National Natural Science Foundation of China (42321003), Guangdong Foundation for Program of Science and Technology Research (2020B1111360001/2023B0303000007/2023B1212060049), Youth Innovation Promotion Association of the Chinese Academy of Sciences (Y2021096), and Guangzhou Municipal Science and Technology Bureau (202206010057).
The authors declare that the research was conducted in the absence of any commercial or financial relationships that could be construed as a potential conflict of interest.
The author(s) declared that they were an editorial board member of Frontiers, at the time of submission. This had no impact on the peer review process and the final decision.
All claims expressed in this article are solely those of the authors and do not necessarily represent those of their affiliated organizations, or those of the publisher, the editors and the reviewers. Any product that may be evaluated in this article, or claim that may be made by its manufacturer, is not guaranteed or endorsed by the publisher.
The Supplementary Material for this article can be found online at: https://www.frontiersin.org/articles/10.3389/fenvs.2024.1490552/full#supplementary-material
Affek, H. P., and Yakir, D. (2002). Protection by isoprene against singlet oxygen in leaves. Plant Physiol. 129, 269–277. doi:10.1104/pp.010909
Bracho-Nunez, A., Knothe, N. M., Welter, S., Staudt, M., Costa, W. R., Liberato, M. A. R., et al. (2013). Leaf level emissions of volatile organic compounds (VOC) from some Amazonian and Mediterranean plants. Biogeosciences 10, 5855–5873. doi:10.5194/bg-10-5855-2013
Carignato, A., Vazquez-Pique, J., Tapias, R., Ruiz, F., and Fernandez, M. (2020). Variability and plasticity in cuticular transpiration and leaf permeability allow differentiation of Eucalyptus clones at an early age. Forests 11, 9. doi:10.3390/f11010009
Chen, J. M., Ju, W., Ciais, P., Viovy, N., Liu, R., Liu, Y., et al. (2019). Vegetation structural change since 1981 significantly enhanced the terrestrial carbon sink. Nat. Commun. 10, 4259. doi:10.1038/s41467-019-12257-8
Chen, W., Zou, Y., Dang, Y., and Sakai, T. (2022). Spatial distribution and dynamic change monitoring of Eucalyptus plantations in China during 1994-2013. Trees-Struct. Funct. 36, 405–414. doi:10.1007/s00468-021-02215-7
Claeys, M., Graham, B., Vas, G., Wang, W., Vermeylen, R., Pashynska, V., et al. (2004). Formation of secondary organic aerosols through photooxidation of isoprene. Science 303, 1173–1176. doi:10.1126/science.1092805
De Souza, V. F., Niinemets, U., Rasulov, B., Vickers, C. E., Duvoisin Junior, S., Araujo, W. L., et al. (2018). Alternative carbon sources for isoprene emission. Trends Plant Sci. 23, 1081–1101. doi:10.1016/j.tplants.2018.09.012
Ehn, M., Thornton, J. A., Kleist, E., Sipila, M., Junninen, H., Pullinen, I., et al. (2014). A large source of low-volatility secondary organic aerosol. Nature 506, 476–479. doi:10.1038/nature13032
Forkel, M., Carvalhais, N., Roedenbeck, C., Keeling, R., Heimann, M., Thonicke, K., et al. (2016). Enhanced seasonal CO2 exchange caused by amplified plant productivity in northern ecosystems. Science 351, 696–699. doi:10.1126/science.aac4971
Goldstein, A. H., Koven, C. D., Heald, C. L., and Fung, I. Y. (2009). Biogenic carbon and anthropogenic pollutants combine to form a cooling haze over the southeastern United States. Proc. Natl. Acad. Sci. U.S.A. 106, 8835–8840. doi:10.1073/pnas.0904128106
Guenther, A., Hewitt, C. N., Erickson, D., Fall, R., Geron, C., Graedel, T., et al. (1995). A global model of natural volatile organic compound emissions. J. Geophys. Res. Atmos. 100, 8873–8892. doi:10.1029/94jd02950
Guenther, A., Karl, T., Harley, P., Wiedinmyer, C., Palmer, P. I., and Geron, C. (2006). Estimates of global terrestrial isoprene emissions using MEGAN (model of emissions of gases and aerosols from nature). Atmos. Chem. Phys. 6, 3181–3210. doi:10.5194/acp-6-3181-2006
Guenther, A. B., Jiang, X., Heald, C. L., Sakulyanontvittaya, T., Duhl, T., Emmons, L. K., et al. (2012). The model of emissions of gases and aerosols from nature version 2.1 (MEGAN2.1): an extended and updated framework for modeling biogenic emissions. Geosci. Model Dev. 5, 1471–1492. doi:10.5194/gmd-5-1471-2012
Harper, K. L., and Unger, N. (2018). Global climate forcing driven by altered BVOC fluxes from 1990 to 2010 land cover change in maritime Southeast Asia. Atmos. Chem. Phys. 18, 16931–16952. doi:10.5194/acp-18-16931-2018
Heald, C. L., Wilkinson, M. J., Monson, R. K., Alo, C. A., Wang, G., and Guenther, A. (2009). Response of isoprene emission to ambient CO2 changes and implications for global budgets. Glob. Change Biol. 15, 1127–1140. doi:10.1111/j.1365-2486.2008.01802.x
Higa, T., Parveen, S., Mutanda, I., Iqbal, M. A., Inafuku, M., Hashimoto, F., et al. (2018). Evaluation of isoprene emission rates of tropical trees by an iterative optimization procedure for G-93 parameters. Atmos. Environ. 192, 209–217. doi:10.1016/j.atmosenv.2018.08.059
Hong, X., Liu, C., Zhang, C., Tian, Y., Wu, H., Yin, H., et al. (2023). Vast ecosystem disturbance in a warming climate may jeopardize our climate goal of reducing CO2: a case study for megafires in the Australian ‘black summer. Sci. Total Environ. 866, 161387. doi:10.1016/j.scitotenv.2023.161387
IPCC (2018). “Global Warming of 1.5°C. An IPCC special report on the impacts of global warming of 1.5°C above pre-industrial levels and related global greenhouse gas emission pathways,” in The context of strengthening the global response to the threat of climate change, sustainable development, and efforts to eradicate poverty. Eds V. Masson-Delmotte, P. Zhai, H.-O. Pörtner, D. Roberts, J. Skea, P. R. Shukla, and et al. (Switzerland: IPCC).
Jagadish, S. V. K., Way, D. A., and Sharkey, T. D. (2021). Plant heat stress: concepts directing future research. Plant Cell Environ. 44, 1992–2005. doi:10.1111/pce.14050
Kuhn, U., Rottenberger, S., Biesenthal, T., Wolf, A., Schebeske, G., Ciccioli, P., et al. (2004). Strong correlation between isoprene emission and gross photosynthetic capacity during leaf phenology of the tropical tree species Hymenaea courbaril with fundamental changes in volatile organic compounds emission composition during early leaf development. Plant Cell Environ. 27, 1469–1485. doi:10.1111/j.1365-3040.2004.01252.x
Lantz, A. T., Allman, J., Weraduwage, S. M., and Sharkey, T. D. (2019a). Isoprene: new insights into the control of emission and mediation of stress tolerance by gene expression. Plant Cell Environ. 42, 2808–2826. doi:10.1111/pce.13629
Lantz, A. T., Solomon, C., Gog, L., McClain, A. M., Weraduwage, S. M., Cruz, J. A., et al. (2019b). Isoprene suppression by CO2 is not due to triose phosphate utilization (TPU) limitation. Front. For. Glob. 2, 8. doi:10.3389/ffgc.2019.00008
Li, S., Li, X., Wei, Z., and Liu, F. (2020). ABA-mediated modulation of elevated CO2 on stomatal response to drought. Curr. Opin. Plant Biol. 56, 174–180. doi:10.1016/j.pbi.2019.12.002
Li, Z., and Sharkey, T. D. (2013). Metabolic profiling of the methylerythritol phosphate pathway reveals the source of post-illumination isoprene burst from leaves. Plant Cell Environ. 36, 429–437. doi:10.1111/j.1365-3040.2012.02584.x
Loreto, F., and Schnitzler, J. P. (2010). Abiotic stresses and induced BVOCs. Trends Plant Sci. 15, 154–166. doi:10.1016/j.tplants.2009.12.006
Loreto, F., and Sharkey, T. D. (1990). A gas-exchange study of photosynthesis and isoprene emission in Quercus-rubra L. Planta 182, 523–531. doi:10.1007/bf02341027
McClain, A. M., and Sharkey, T. D. (2019). Triose phosphate utilization and beyond: from photosynthesis to end product synthesis. J. Exp. Bot. 70, 1755–1766. doi:10.1093/jxb/erz058
Mentel, T. F., Kleist, E., Andres, S., Dal Maso, M., Hohaus, T., Kiendler-Scharr, A., et al. (2013). Secondary aerosol formation from stress-induced biogenic emissions and possible climate feedbacks. Atmos. Chem. Phys. 13, 8755–8770. doi:10.5194/acp-13-8755-2013
Messina, P., Lathiere, J., Sindelarova, K., Vuichard, N., Granier, C., Ghattas, J., et al. (2016). Global biogenic volatile organic compound emissions in the ORCHIDEE and MEGAN models and sensitivity to key parameters. Atmos. Chem. Phys. 16, 14169–14202. doi:10.5194/acp-16-14169-2016
Monson, R. K., and Fall, R. (1989). Isoprene emission from aspen leaves - influence of environment and relation to photosynthesis and photorespiration. Plant Physiol. 90, 267–274. doi:10.1104/pp.90.1.267
Monson, R. K., Jones, R. T., Rosenstiel, T. N., and Schnitzler, J. P. (2013). Why only some plants emit isoprene. Plant Cell Environ. 36, 503–516. doi:10.1111/pce.12015
Monson, R. K., Neice, A. A., Trahan, N. A., Shiach, I., McCorkel, J. T., and Moore, D. J. (2016). Interactions between temperature and intercellular CO2 concentration in controlling leaf isoprene emission rates. Plant Cell Environ. 39, 2404–2413. doi:10.1111/pce.12787
Monson, R. K., Trahan, N., Rosenstiel, T. N., Veres, P., Moore, D., Wilkinson, M., et al. (2007). Isoprene emission from terrestrial ecosystems in response to global change: minding the gap between models and observations. Philos. Trans. R. Soc. A-Math. Phys. Eng. Sci. 365, 1677–1695. doi:10.1098/rsta.2007.2038
Morfopoulos, C., Sperlich, D., Penuelas, J., Filella, I., Llusia, J., Medlyn, B. E., et al. (2014). A model of plant isoprene emission based on available reducing power captures responses to atmospheric CO2. New Phytol. 203, 125–139. doi:10.1111/nph.12770
Mu, Z., Llusia, J., Zeng, J., Zhang, Y., Asensio, D., Yang, K., et al. (2022). An overview of the isoprenoid emissions from tropical plant species. Front. Plant Sci. 13, 833030. doi:10.3389/fpls.2022.833030
Mutanda, I., Inafuku, M., Iwasaki, H., Saitoh, S., Fukuta, M., Watanabe, K., et al. (2016). Parameterization of G-93 isoprene emission formula for tropical trees Casuarina equisetifolia and Ficus septica. Atmos. Environ. 141, 287–296. doi:10.1016/j.atmosenv.2016.06.052
Niinemets, U., Rasulov, B., and Talts, E. (2021). CO2-responsiveness of leaf isoprene emission: why do species differ? Plant Cell Environ. 44, 3049–3063. doi:10.1111/pce.14131
Niinemets, U., and Sun, Z. (2015). How light, temperature, and measurement and growth CO2 interactively control isoprene emission in hybrid aspen. J. Exp. Bot. 66, 841–851. doi:10.1093/jxb/eru443
Niinemets, Ü., Tenhunen, J. D., Harley, P. C., and Steinbrecher, R. (1999). A model of isoprene emission based on energetic requirements for isoprene synthesis and leaf photosynthetic properties for Liquidambar and Quercus. Plant Cell Environ. 22, 1319–1335. doi:10.1046/j.1365-3040.1999.00505.x
Oikawa, P. Y., and Lerdau, M. T. (2013). Catabolism of volatile organic compounds influences plant survival. Trends Plant Sci. 18, 695–703. doi:10.1016/j.tplants.2013.08.011
Ouyang, L., Arnold, R. L., Chen, S., Xie, Y., He, S., Liu, X., et al. (2022). Prediction of the suitable distribution of Eucalyptus grandis in China and its responses to climate change. New For 53, 81–99. doi:10.1007/s11056-021-09845-2
Peñuelas, J., and Staudt, M. (2010). BVOCs and global change. Trends Plant Sci. 15, 133–144. doi:10.1016/j.tplants.2009.12.005
Piao, S., Tan, K., Nan, H., Ciais, P., Fang, J., Wang, T., et al. (2012). Impacts of climate and CO2 changes on the vegetation growth and carbon balance of Qinghai-Tibetan grasslands over the past five decades. Glob. Planet. Change 98-99, 73–80. doi:10.1016/j.gloplacha.2012.08.009
Pierce, T., Geron, C., Bender, L., Dennis, R., Tonnesen, G., and Guenther, A. (1998). Influence of increased isoprene emissions on regional ozone modeling. J. Geophys. Res. Atmos. 103, 25611–25629. doi:10.1029/98jd01804
Possell, M., and Hewitt, C. N. (2011). Isoprene emissions from plants are mediated by atmospheric CO2 concentrations. Glob. Change Biol. 17, 1595–1610. doi:10.1111/j.1365-2486.2010.02306.x
Possell, M., Nicholas Hewitt, C., and Beerling, D. J. (2005). The effects of glacial atmospheric CO2 concentrations and climate on isoprene emissions by vascular plants. Glob. Change Biol. 11, 60–69. doi:10.1111/j.1365-2486.2004.00889.x
Potosnak, M. J., LeStourgeon, L., and Nunez, O. (2014). Increasing leaf temperature reduces the suppression of isoprene emission by elevated CO2 concentration. Sci. Total Environ. 481, 352–359. doi:10.1016/j.scitotenv.2014.02.065
Rapparini, F., Baraldi, R., Miglietta, F., and Loreto, F. (2004). Isoprenoid emission in trees of Quercus pubescens and Quercus ilex with lifetime exposure to naturally high CO2 environment. Plant Cell Environ. 27, 381–391. doi:10.1111/j.1365-3040.2003.01151.x
Rasulov, B., Huve, K., Valbe, M., Laisk, A., and Niinemets, U. (2009). Evidence that light, carbon dioxide, and oxygen dependencies of leaf isoprene emission are driven by energy status in hybrid aspen. Plant Physiol. 151, 448–460. doi:10.1104/pp.109.141978
Rasulov, B., Talts, E., Bichele, I., and Niinemets, U. (2018). Evidence that isoprene emission is not limited by cytosolic metabolites. Exogenous malate does not invert the reverse sensitivity of isoprene emission to high [CO2]. Plant Physiol. 176, 1573–1586. doi:10.1104/pp.17.01463
Rasulov, B., Talts, E., and Niinemets, U. (2016). Spectacular oscillations in plant isoprene emission under transient conditions explain the enigmatic CO2 response. Plant Physiol. 172, 2275–2285. doi:10.1104/pp.16.01002
Rosenstiel, T. N., Potosnak, M. J., Griffin, K. L., Fall, R., and Monson, R. K. (2003). Increased CO2 uncouples growth from isoprene emission in an agriforest ecosystem. Nature 421, 256–259. doi:10.1038/nature01312
Sahu, A., Mostofa, M. G., Weraduwage, S. M., and Sharkey, T. D. (2023). Hydroxymethylbutenyl diphosphate accumulation reveals MEP pathway regulation for high CO2-induced suppression of isoprene emission. Proc. Natl. Acad. Sci. U.S.A. 120, e2309536120. doi:10.1073/pnas.2309536120
Sharkey, T. D., and Monson, R. K. (2014). The future of isoprene emission from leaves, canopies and landscapes. Plant Cell Environ. 37, 1727–1740. doi:10.1111/pce.12289
Sharkey, T. D., Preiser, A. L., Weraduwage, S. M., and Gog, L. (2020). Source of 12C in Calvin-Benson cycle intermediates and isoprene emitted from plant leaves fed with 13CO2. Biochem. J. 477, 3237–3252. doi:10.1042/bcj20200480
Sharkey, T. D., Singsaas, E. L., Lerdau, M. T., and Geron, C. D. (1999). Weather effects on isoprene emission capacity and applications in emissions algorithms. Ecol. Appl. 9, 1132–1137. doi:10.1890/1051-0761(1999)009[1132:Weoiec]2.0.Co;2
Sindelarova, K., Granier, C., Bouarar, I., Guenther, A., Tilmes, S., Stavrakou, T., et al. (2014). Global data set of biogenic VOC emissions calculated by the MEGAN model over the last 30 years. Atmos. Chem. Phys. 14, 9317–9341. doi:10.5194/acp-14-9317-2014
Sun, Z., Niinemets, U., Hueve, K., Noe, S. M., Rasulov, B., Copolovici, L., et al. (2012). Enhanced isoprene emission capacity and altered light responsiveness in aspen grown under elevated atmospheric CO2 concentration. Glob. Change Biol. 18, 3423–3440. doi:10.1111/j.1365-2486.2012.02789.x
Van der Velde, I. R., van der Werf, G. R., Houweling, S., Maasakkers, J. D., Borsdorff, T., Landgraf, J., et al. (2021). Vast CO2 release from Australian fires in 2019-2020 constrained by satellite. Nature 597, 366–369. doi:10.1038/s41586-021-03712-y
Wang, C., Lu, W., Lin, Y., and Luo, J. (2013). Floristic geography of Eucalyptus and ecological assessment within this distribution. Eucalypt Sci. and Technol. 30, 44–51. doi:10.13987/j.cnki.askj.2013.04.010
Wang, Q., Wu, Y., Wu, W., Lyu, L., and Li, W. (2024). A review of changes at the phenotypic, physiological, biochemical, and molecular levels of plants due to high temperatures. Planta 259, 57. doi:10.1007/s00425-023-04320-y
Wilkinson, M. J., Monson, R. K., Trahan, N., Lee, S., Brown, E., Jackson, R. B., et al. (2009). Leaf isoprene emission rate as a function of atmospheric CO2 concentration. Glob. Change Biol. 15, 1189–1200. doi:10.1111/j.1365-2486.2008.01803.x
Yang, W., Cao, J., Wu, Y., Kong, F., and Li, L. (2021). Review on plant terpenoid emissions worldwide and in China. Sci. Total Environ. 787, 147454. doi:10.1016/j.scitotenv.2021.147454
Zeng, J., Song, W., Zhang, Y., Mu, Z., Pang, W., Zhang, H., et al. (2022a). Emissions of isoprenoids from dominant tree species in subtropical China. Front. For. Glob. Change 5, 1089676. doi:10.3389/ffgc.2022.1089676
Zeng, J., Zhang, Y., Mu, Z., Pang, W., Zhang, H., Wu, Z., et al. (2023). Temperature and light dependency of isoprene and monoterpene emissions from tropical and subtropical trees: field observations in south China. Appl. Geochem. 155, 105727. doi:10.1016/j.apgeochem.2023.105727
Zeng, J., Zhang, Y., Pang, W., Ran, H., Guo, H., Song, W., et al. (2024). Optimizing in-situ measurement of representative BVOC emission factors considering intraspecific variability. Geophys. Res. Lett. 51, e2024GL108870. doi:10.1029/2024gl108870
Zeng, J., Zhang, Y., Zhang, H., Song, W., Wu, Z., and Wang, X. (2022b). Design and characterization of a semi-open dynamic chamber for measuring biogenic volatile organic compound (BVOC) emissions from plants. Atmos. Meas. Tech. 15, 79–93. doi:10.5194/amt-15-79-2022
Keywords: biogenic volatile organic compounds (bvocs), isoprene, tropical/subtropical, isoprene-CO2 response, Eucalyptus urophylla
Citation: Pang W, Zhang Y, Zeng J, Tian X and Wang X (2024) Modulating effects of temperature on CO2-inhibited isoprene emissions in Eucalyptus urophylla. Front. Environ. Sci. 12:1490552. doi: 10.3389/fenvs.2024.1490552
Received: 04 September 2024; Accepted: 23 September 2024;
Published: 02 October 2024.
Edited by:
Jianhui Tang, Chinese Academy of Sciences (CAS), ChinaReviewed by:
Dasa Gu, Hong Kong University of Science and Technology, Hong Kong SAR, ChinaCopyright © 2024 Pang, Zhang, Zeng, Tian and Wang. This is an open-access article distributed under the terms of the Creative Commons Attribution License (CC BY). The use, distribution or reproduction in other forums is permitted, provided the original author(s) and the copyright owner(s) are credited and that the original publication in this journal is cited, in accordance with accepted academic practice. No use, distribution or reproduction is permitted which does not comply with these terms.
*Correspondence: Yanli Zhang, emhhbmdfeWw4NkBnaWcuYWMuY24=
Disclaimer: All claims expressed in this article are solely those of the authors and do not necessarily represent those of their affiliated organizations, or those of the publisher, the editors and the reviewers. Any product that may be evaluated in this article or claim that may be made by its manufacturer is not guaranteed or endorsed by the publisher.
Research integrity at Frontiers
Learn more about the work of our research integrity team to safeguard the quality of each article we publish.