- 1Department of Geographical Science, College of Sciences, Guangdong University of Petrochemical Technology (GDUPT), Maoming, Guangdong, China
- 2Yunnan Key Laboratory of Meteorological Disasters and Climate Resources in the Greater Mekong Subregion, Yunnan University, Kunming, Yunnan, China
- 3Yunnan Key Laboratory of Plateau Geographic Processes and Environmental Change, Faculty of Geographical Science, Yunnan Normal University, Kunming, Yunnan, China
The examination of the spatiotemporal characteristics and developmental trends of drought is crucial for enhancing water resource management, bolstering drought resistance, and improving disaster prevention capabilities. This study employs the Standardized Precipitation Evapotranspiration Index (SPEI) and grain yield data across various time scales, in conjunction with methodologies such as Run Theory, Mann-Kendall, and Standardized Yield Residual Series, to conduct an in-depth investigation into the spatiotemporal variation characteristics of meteorological drought in Hunan Province and its impact on grain yield. The findings suggest that: (1) Since 1960, the likelihood of seasonal drought occurrence in Hunan Province has been ranked as autumn > winter > spring > summer, with mild drought occurring most frequently, followed by moderate drought, while the frequency of severe and extreme drought remains low. (2) Meteorological drought in Hunan Province exhibits spatial differences at the seasonal scale, with the overall drought changes in spring and summer displaying a non-significant upward trend; the western and southern regions exhibit a trend of aridification in autumn; and in winter, the Zhangjiajie and Xiangxi regions show an insignificant downward trend. (3) From 1960 to 2022, grain production in Hunan Province has demonstrated a pattern of fluctuation and increase. The meteorological yield of grain crops displays a high-low-high spatial distribution from south to north. Concurrently, there is a positive correlation between short-term climate change and meteorological output, while long-term climate change is not evident. (4) El Niño Southern Oscillation (ENSO) is a significant circulation factor affecting meteorological drought in Hunan Province, and the meteorological drought in autumn and winter in Hunan Province is significantly influenced by ENSO. The research findings can provide reference significance and a scientific basis for drought research and comprehensive management in Hunan Province, and offer data and theoretical support for promoting economic development.
1 Introduction
Since the onset of the industrial revolution, there has been a marked intensification of global warming, driven primarily by carbon emissions from production systems, leading to the normalization of extreme climatic events such as elevated temperatures, prolonged droughts, and heavy rainfall (Adnan et al., 2022; Elahi et al., 2024; Ehsan et al., 2023). Within this framework, drought events represent some of the most prevalent climate anomalies globally, distinguished by their enduring effects and high frequency (Yuan et al., 2023; Huang et al., 2019). Drought events not only severely impede the sustainable development of socio-economic systems but also disrupt the normal functioning of ecosystems. This disruption leads to a range of ecological and environmental issues, including water scarcity, land degradation, recurrent forest fires, and desertification. These problems have garnered considerable attention from numerous scholars in the field (Piao et al., 2010; Wang et al., 2012; Yin et al., 2023). Statistics indicate that over the past few decades, China has experienced a significant increase in drought-affected areas, with some regions witnessing an escalation of up to 20 times. Consequently, drought now constitutes more than 50% of all meteorological disasters in the country. The decline in grain production due to drought represents half of the total reduction in grain output attributed to all disasters in China. Additionally, economic losses resulting from drought account for approximately 35% of the total damages caused by various disasters (Hu, 2023). In 2000, the drought-induced grain loss and economic damages amounted to 6 × 10¹⁰ kg and 2.1×10¹¹ RMB respectively. Given these figures, the magnitude of this issue, its severity, and its subsequent impact cannot be understated.
Nevertheless, the etiology of meteorological drought is multifaceted and governed by a myriad of factors. This complexity makes it challenging to precisely quantify the influence of any given factor throughout the drought event (Su et al., 2018). Given the intricate nature of meteorological drought causation, an increasing number of scholars have shifted their research emphasis from examining temperature or precipitation factors to investigating the influence of atmospheric circulation indices on meteorological drought, as noted by Hao and Singh. (2015), Jiang and Wang. (2021), Fan et al. (2021) Previous research has demonstrated that atmospheric circulation significantly contributes to meteorological drought. Anomalies in this circulation pattern influence the progression of temperature, precipitation, and evaporation within a region, thereby facilitating the onset of drought events (Liu et al., 2007; Wang et al., 2008). Atmospheric circulation, characterized by its periodicity, persistence, robust predictability, and delayed climate impacts across diverse regions, serves as a pivotal guide in regional climate prediction (Liu et al., 2023). Consequently, investigating the correlation between meteorological drought and atmospheric circulation can furnish a theoretical foundation for comprehensive studies on meteorological drought. Furthermore, scholars both domestically and internationally have conducted extensive research on drought indices. The Composite Index (CI), Palmer Drought Severity Index (PDSI), Standardized Precipitation Index (SPI), and Standardized Precipitation Evapotranspiration Index (SPEI) are commonly used meteorological drought indices that can provide a rapid monitoring of meteorological droughts to some extent (Su et al., 2018; Jiang and Wang, 2021; Fan et al., 2021). SPI only considers the variation in precipitation to reflect the characteristics of meteorological drought, while SPEI not only takes into account the impact of precipitation and temperature on meteorological drought but also considers the influence of potential evapotranspiration, as well as the multi-timescale characteristics of SPI (Pei et al., 2020). Therefore, this study adopts the Standardized Precipitation Evapotranspiration Index (SPEI) as the index for the study of meteorological drought in Hunan Province.
Hunan Province, a significant food-producing region in China, is frequently impacted by drought events (Xie et al., 2023). Data from Hunan Province, spanning a 48-year period from 1950 to 1998, indicates that the average annual area affected by disasters is approximately 642,000 ha. This represents roughly 15% of Hunan’s total arable land area (Zhou et al., 2015). Drought events have had a profound impact on the grain crop harvest in Hunan Province, with the reduction in yield due to drought being twice as severe as that resulting from floods (Zhou et al., 2015). A bibliometric analysis of publicly available studies on meteorological drought in Hunan Province (Figure 1) reveals a paucity of research. The majority of these studies primarily concentrate on analyzing typical drought years, identifying drought characteristics, and examining the factors influencing drought within specific regions of Hunan Province. To some extent, this has hindered the comprehensive understanding of drought characteristics in Hunan Province. Meanwhile, the characteristics of drought succession in Hunan Province are not clear at multiple scales, especially at seasonal scales. Therefore, the analysis of drought characteristics in Hunan Province under different time scales is more conducive to elucidating its causes. Meanwhile, it is also helpful to strengthen the understanding of the coupling relationship between grain yield and drought events.
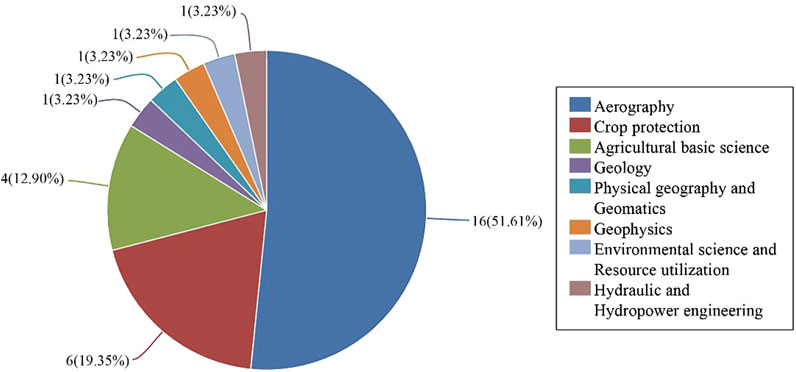
Figure 1. Distribution map of disciplines involved in meteorological drought research in Hunan Province.
This study seeks to conduct a comprehensive analysis of the spatiotemporal characteristics of meteorological drought in Hunan Province, investigating temporal variations and spatial evolution trends at multiple scales, as well as exploring its effects on grain yield. To accomplish this, we utilize SPEI meteorological drought data and grain yield data, applying methods such as run theory and trend testing to evaluate the causes of meteorological drought and its effects on grain yield. Meanwhile, building on this understanding, the study will propose corresponding countermeasures to promote the sustainable development of the ecological environment in the region.
2 Materials and methods
2.1 The study area
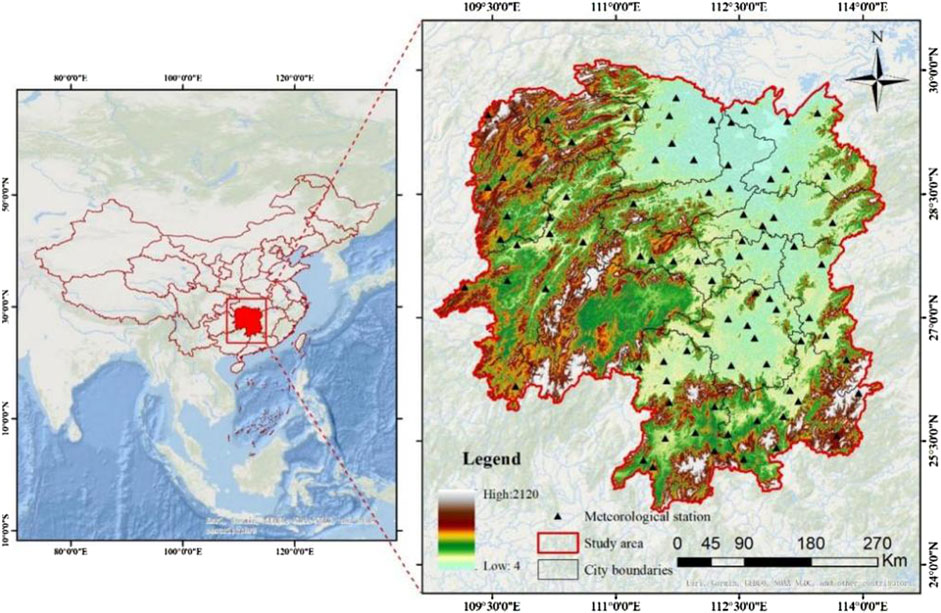
Hunan Province, situated in the central region of China along the middle and lower reaches of the Yangtze River, shares borders with Jiangxi Province to the east, the Nanling Mountains to the south, Chongqing City and Guizhou Province to the west, and Dongting Lake to the north. Hunan Province, situated in a mid-latitude region between 24°38′- 30° 08′N and 108°47′- 114°15′E, spans an area of 2.118 × 10⁵ km2. This province can be segmented into five distinct regions: Xiangdong, Xiangnan, Xiangxi, Xiangbei, and Xiangzhong (Figure 2). The terrain of Hunan Province is characterized by mountains, hills, basins, and plains. The overall topography exhibits a horseshoe-shaped configuration, with higher elevations in the east, west, and south, and lower elevations in the middle and north. The province is home to four major rivers—Xiangjiang, Zijiang, Yuanjiang, and Lishui—which all converge into Dongting Lake. Given the intricate natural geographical environment of the province, it is particularly vulnerable to climate change and drought conditions (Zhou et al., 2015).
2.2 Data sources
Compared with data obtained from actual meteorological stations, gridded meteorological data has spatial representativeness and continuity, which play a significant role in describing the overall drought characteristics of Hunan Province. Therefore, the standardized precipitation evapotranspiration index (SPEI) data from 1960 to 2022 used in this study were obtained from the Software Engineering and Information Systems Institute (SPEI), created by CSIC (the Consejo Superior de Investigaciones Científicas) (https://spei.csic.es/index.html).
The atmospheric circulation indices used include ENSO (El Niño Southern Oscillation), AO (Arctic Oscillation), NAO (North Atlantic Oscillation), and PDO (Pacific Interdecadal Oscillation Index), with a time scale ranging from 1960 to 2022, all sourced from data sourced from the Earth Systems Research Laboratory of the National Oceanic and Atmospheric Administration (NOAA) in the United States (https://www.esrl.noaa.gov). The grain production data of Hunan Province from the National Bureau of Statistics (https://data.stats.gov.cn/index.htm)。
2.3 Research methods
2.3.1 Run theory
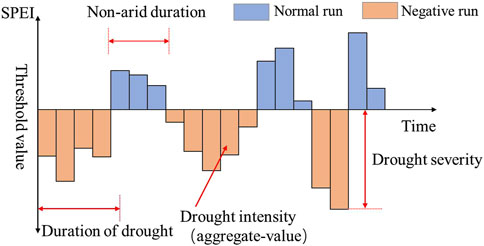
Drought identification is performed by combining the SPEI index with run theory, using K = −0.5 as the drought threshold (Hu, 2023). If the drought index in the sequence exceeds a certain threshold for one or more consecutive periods, it is termed a positive run; otherwise, it is a negative run. This study uses the SPEI time series and applies run theory to analyze the drought indicator sequence by defining drought thresholds. Characteristic variables such as drought duration, intensity, and severity are extracted from the SPEI time series, and the drought event process is identified using run theory, as shown in Figure 3.
2.3.2 Meteorological yield separation method
In statistical studies of the relationship between long-term grain yield and meteorological factors, grain yield is typically decomposed into trend yield, meteorological yield, and random yield (Yuan and Liu, 2022), The calculation formula is as follows:
In the formula,
The HP filtering method is a technique used for decomposing time series in a state-space framework, and it can be applied to separate meteorological data. The Hodrick-Prescott (HP) filter can be regarded as an approximate high-pass filter, which allows the high-frequency component (climate change factors) to pass through while filtering out the low-frequency component (factors of technological progress and economic development). This enables the separation of high-frequency components with periods less than 8 years (Rong et al., 2024). This method is straightforward to implement and offers high separation accuracy. The fitting results can effectively capture the impact of climate change on crop yields (Li and Zhang, 2022). In this study, the HP filtering method was used to separate the trend component of crop yield from the actual yield data, thereby isolating the meteorological yield component. Specifically, this involved extracting
In the formula, λ is the smoothing parameter, For annual data, previous studies have used a reference value of λ = 100.
2.3.3 Constructing a standardized residual series
To analyze the impact of SPEI on meteorological crop yields in Hunan Province, this study used the Z-score method to standardize the meteorological yield data, resulting in the corresponding standardized yield residuals (Standardized yield Residual Series, SYRS). The calculation formula is as follows:
In the formula,
2.3.4 Trend analysis and verification
2.3.4.1 The Theil-Sen Median
The Theil-Sen Median method is a non-parametric statistical method for estimating trend slopes in situations where there may be outliers in the data or traditional linear regression assumptions are not met. This method does not require assumptions about the basic distribution of the data and takes the median slope of any two points in the time series as the true slope, so it is not affected by extreme values (Long et al., 2023). It is widely used in long-term time series analysis of meteorology, hydrology, vegetation, and other fields. The calculation formula is as follows:
In the formula, 1 < j < i < n,
2.3.4.2 Mann-Kendall tendency test
The Mann-Kendall tendency test is a non-parametric statistical method used to test the significance of trends in time series data. This method is also not affected by outliers and does not require assumptions about the distribution of data. Thus, it is widely used in the analysis of climate parameters and hydrological sequences (Li et al., 2023a). Z is the statistic of the Mann-Kendall test, where a positive value indicates an upward trend in the sequence and a negative value indicates a downward trend in the sequence. When their absolute values are greater than or equal to 1.64, 1.96, and 2.58, it indicates that they have passed the significance tests with confidence levels of 90%, 95%, and 99%, respectively (Li et al., 2023b).
2.3.4.3 Wavelet analysis
To calculate the real part of the wavelet, this study uses the Morlet continuous complex wavelet as basis function [i.e., the comr function (Equation 1)] (Li et al., 2023b; Yin et al., 2024). It is expressed as follows:
where Fe is the center frequency, Fb is the frequency bandwidth. The wavelet square difference is denoted Var and can be obtained by integrating the square of the wavelet coefficient over the time translation domain b.
2.3.4.4 Hysteresis
Based on the correlation analysis method, this article constructs a sliding time series of the atmospheric circulation index with a lag of 0–11 months and analyzes its lag correlation with Hunan Province’s SPEI through the Pearson correlation analysis method. In the text, * indicates that the p-value passed the significance test of 0.05, and ** indicates that the p-value passed the significance test of 0.01 (Fan et al., 2021).
3 Results
3.1 Time variation characteristics of meteorological drought in Hunan Province
3.1.1 The time characteristics of SPEI from 1960 to 2022
This study constructed a multi-scale time series figure for Hunan Province, spanning from 1960 to 2022, utilizing the SPEI index at intervals of 1 month, 3 months, and 12 months (Figure 4A). The findings reveal significant disparities in the sensitivity of multi-time scale values of SPEI in Hunan Province to temporal changes. The SPEI-01 time series demonstrates high volatility, suggesting that on a 1-month time scale, SPEI values are more responsive to short-term climate variations. This heightened sensitivity suggests that SPEI-01 is an effective tool for monitoring and assessing short-term climate anomalies, such as extreme droughts or floods. Although the volatility of SPEI-03 remains relatively high, its fluctuations appear comparatively smoother than those of SPEI-01. This could be attributed to the fact that short-term meteorological changes are partially smoothed over a 3-month time scale, yet still reflect short-term or medium-term climate anomalies. The fluctuation of the SPEI-12 time series is significantly smoother, indicating that the response of SPEI values to climate change is relatively stable on a 12-month time scale (with the primary period being 25 years) (Figure 4B). The long-term average effect mitigates short-term fluctuations, making SPEI-12 more suitable for evaluating long-term climate trends or predicting future climate change.
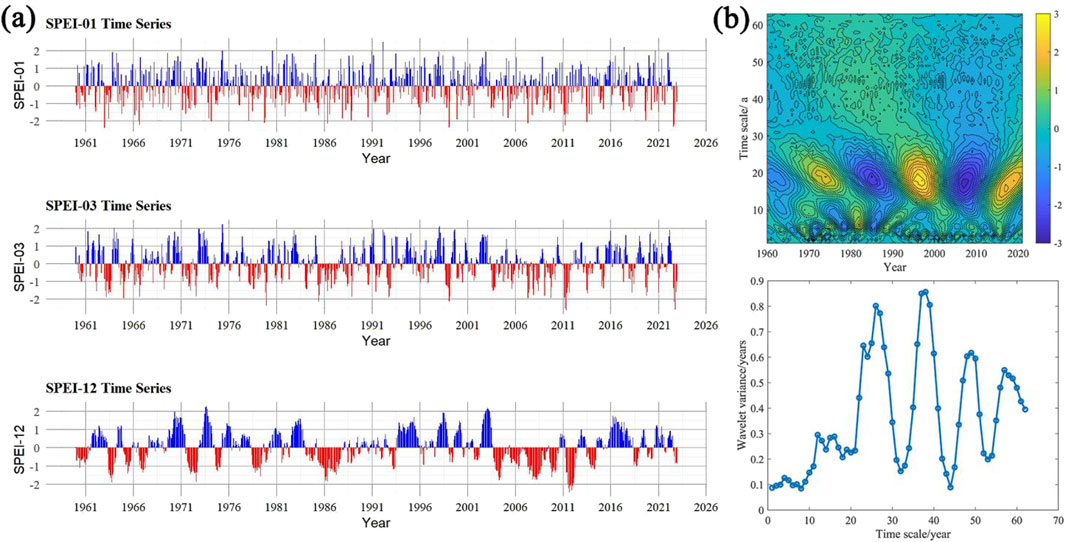
Figure 4. Temporal characteristics of SPEI in Hunan Province from 1960 to 2022 [(A): Multiscale time series of SPEI in Hunan Province from 1960 to 2022; (B): The wavelet transform of SPEI-12 in Hunan Province from 1960 to 2022)].
The SPEI-12 time series chart reveals that Hunan Province has undergone numerous significant drought events since 1960, underscoring the region’s propensity for drought. Notable drought years in Hunan Province encompass spring 1960 to spring 1961, summer 1963 to spring 1964, summer 1971 to autumn 1972, summer 1978 to spring 1980, spring 1984 to spring 1988, and autumn 2003 to summer 2012. Some drought episodes have been particularly prolonged, such as those from spring 1984 to spring 1988 and from autumn 2003 to summer 2012.
3.1.2 Characteristics of meteorological drought degree from 1960 to 2022
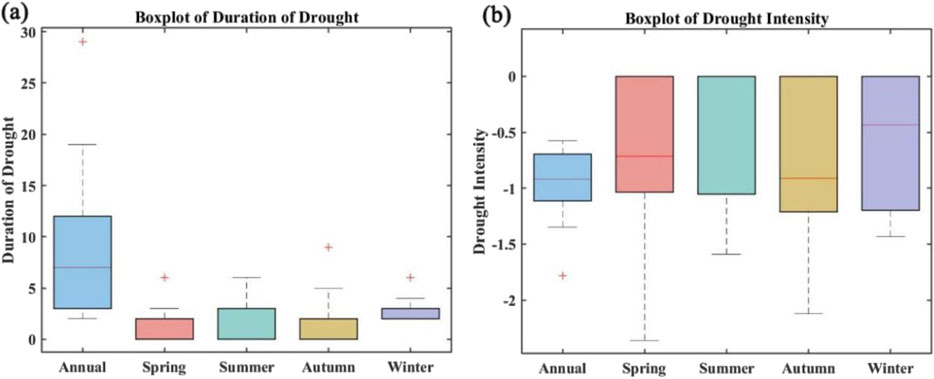
This study employs the run theory to categorize drought levels based on SPEI, with k = −0.5 selected as the drought threshold. It also conducts a statistical analysis of the annual and seasonal duration and intensity of drought in Hunan Province (Figure 5). In the interannual scale analysis, the longest drought duration in SPEI was 29 months (1985–1987), with the minimum drought intensity recorded at −1.78. Notably, from July 2011 to January 2012, Hunan Province experienced a severe 7-month extreme drought, which had a significant impact on the local climate and environment. Frequent droughts were also observed between 2003 and 2013, aligning with the actual years of drought in Hunan Province. On a seasonal scale, the spring drought lasted for 3 months over two consecutive years from 1962 to 1963, and in 1974, 1986, 2008, 2011, and 2015. The summer drought in 1963, 1966, 1972, 1986, and 2007 also lasted for 3 months. The autumn drought duration in 1992, 2001, 2009, 2019, and 2022 was longer than in other years. Specifically, from 2003 to 2005, the autumn drought persisted for three consecutive years, each lasting 3 months; the winter drought lasted for 3 months in 1964, 1973, 1980, and for two consecutive years in 1998–1999 and 2000.
The maximum drought intensity of the Standardized Precipitation Evapotranspiration Index (SPEI) was recorded in the spring of 2011, at −2.36. The drought intensity during the summer of 1963 and the autumn of 1966 were both below −1.50, signifying a severe drought year. The autumn drought intensity in 2022 reached −2.12. The period from 2011 to 2012 marked two consecutive years of extreme drought. A significant difference exists between the seasonal and interannual drought intensities of SPEI, primarily due to the varying time scales and associated influencing factors. Seasonal drought intensity primarily focuses on the drought conditions within a specific season and is closely related to factors such as seasonal precipitation patterns, temperature fluctuations, and soil moisture. In contrast, interannual drought intensity considers the drought conditions throughout the year, taking into account the degree of drought in each season and the overall impact of climate conditions throughout the year. Therefore, interannual drought intensity is often more stable and more susceptible to long-term climate change trends.
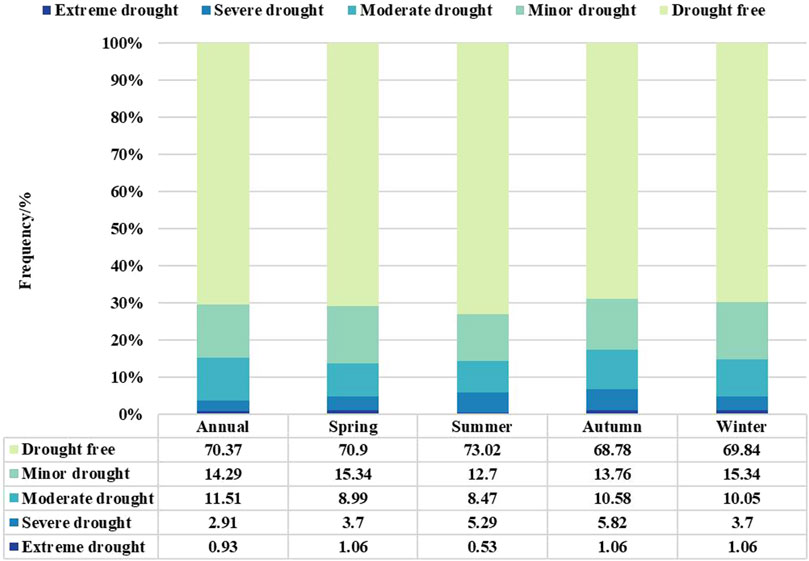
The analysis of drought frequency at both annual and seasonal scales reveals that light and moderate droughts are the most prevalent in the study area, while severe droughts occur less frequently (Figure 6). Despite this, extreme drought events have been recorded, suggesting a significant impact on the region at an interannual scale. A closer examination of seasonal drought frequency indicates that drought-free conditions predominate, particularly in summer when approximately 70% of the time is free from drought. This may be attributed to higher precipitation levels during this season, suggesting that the region is largely immune to drought impacts. Light droughts rank second in frequency, with spring and winter experiencing the highest rates at 15.34%, while summer has the lowest at 12.7%. The incidence of moderate drought is more pronounced in autumn and winter, at 10.58% and 10.05% respectively, but is less common in spring and summer. Severe droughts are least frequent across all seasons, with spring and winter having identical rates of 3.7%, lower than in summer and autumn. Extreme droughts are the least common, accounting for only about 1% of all cases, and remain consistently low throughout all seasons.
3.2 Spatial variation characteristics of meteorological drought
This study examines the spatial characteristics of SPEI in Hunan Province over a seasonal scale from 1960 to 2022 (Figure 7). During spring, the drought trend in the region under investigation demonstrated a downward trajectory, albeit not statistically significant (α > 0.1). The western regions of Huaihua and Shaoyang exhibited higher slope values compared to other areas, suggesting a more pronounced humidification trend in these regions. In summer, all regions of Hunan Province displayed positive slope values, with the drought changes indicating an insignificant (α > 0.05) upward trend, suggesting a general humidification season. In autumn, approximately 93.06% of Hunan Province’s areas showed no significant (α > 0.05) trend in drought change. Only a few areas in Yongzhou City exhibited a significant (α ≤ 0.05) downward trend, with the lowest slope value at −0.0032, indicating a notable drought trend in Yongzhou City. Conversely, the eastern regions of Hunan Province, such as Yueyang and Changsha, demonstrated a wetting trend. In winter, only Zhangjiajie and Xiangxi regions showed an insignificant (α > 0.05) downward trend, with a slope value of −0.0016, indicating a trend towards aridification. Overall, the drought trend across the entire study area followed an upward-upward-downward pattern from the southeast, central, and northwest regions respectively.

Figure 7. Spatial characteristics of meteorological drought in Hunan Province from 1960 to 2022 at the seasonal scale. (A) Spring. (B) Summer. (C) Autumn. (D) Winter.
3.3 The impact of meteorological drought on crop yields
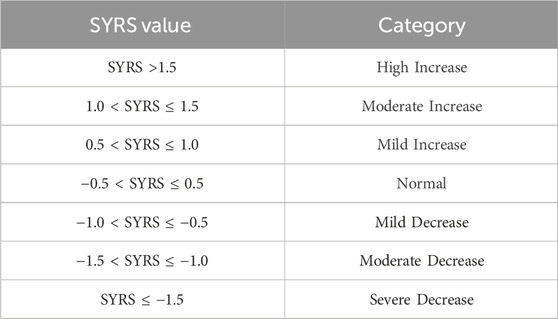
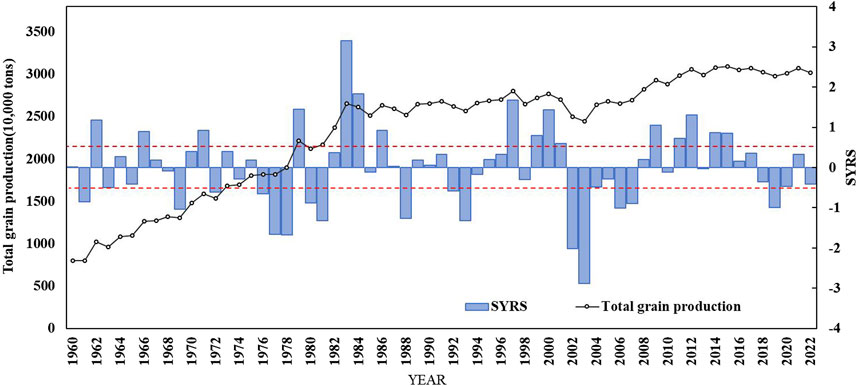
Data from 1960 to 2022 indicates that crop yields in Hunan Province have varied between 8.025 and 30.942 million tons, with an average growth rate of approximately 3.437 million tons per decade. This suggests a consistent upward trend (Figure 8). The significant increase in crop yields over time underscores the substantial enhancement in agricultural productivity due to technological advancements and socio-economic development, which have resulted in higher yields (Lu, 2022). Despite periods of increased crop yields, there were also instances where yields declined. To isolate the influence of meteorological factors on these fluctuations, this study examined the progression of standardized yield residuals (SYRS) in Hunan Province from 1960 to 2022 (Figure 8). While the overall meteorological yield exhibits an upward trajectory, this shift is not statistically significant, characterized by a slope of 0.048 and a modest rate of ascent. Notably, the peaks and troughs in SYRS align closely with those in crop yields. Based on the thresholds presented in Table 1, years marked by severe crop yield reduction include 1977, 1978, 2002, and 2003. Moderate reductions occurred in 1969, 1981, 1988, 1993, and 2006. Mild reductions spanned the years 1961, 1963, 1972, 1976, 1980, 1992, 2007, and 2019. In summation, there were 17 years characterized by yield reductions, with the most pronounced decrease observed in 2003.
To explore the possible reasons for the decline in crop yield, this paper further analyzed the intra-annual variation of the 2003 SPEI values on different time scales (SPEI-1, SPEI-3 and SPEI-12) (Figure 9A). Figure 9A shows that the SPEI values of the second half of 2003 were negative, which means drought conditions, with the lowest value reaching −1.55, indicating an extreme drought event. It can be seen that the main growing season of crops (April–October) was affected by long-term drought stress, which may have seriously threatened crop growth. In addition, this paper also analyzed the intra-annual variation of the 1983 SPEI values corresponding to a year with high crop yield increase on different time scales (SPEI-1, SPEI-3 and SPEI-12) (Figure 9B). The SPEI values of 1983 were normal on all time scales, indicating wet conditions. Only March, August and November showed mild drought, suggesting that drought had little impact in 1983. The results show that if crops are severely affected by drought during the growing season, their yields will fluctuate significantly. Long-term water shortage will lead to a decrease in crop yield.
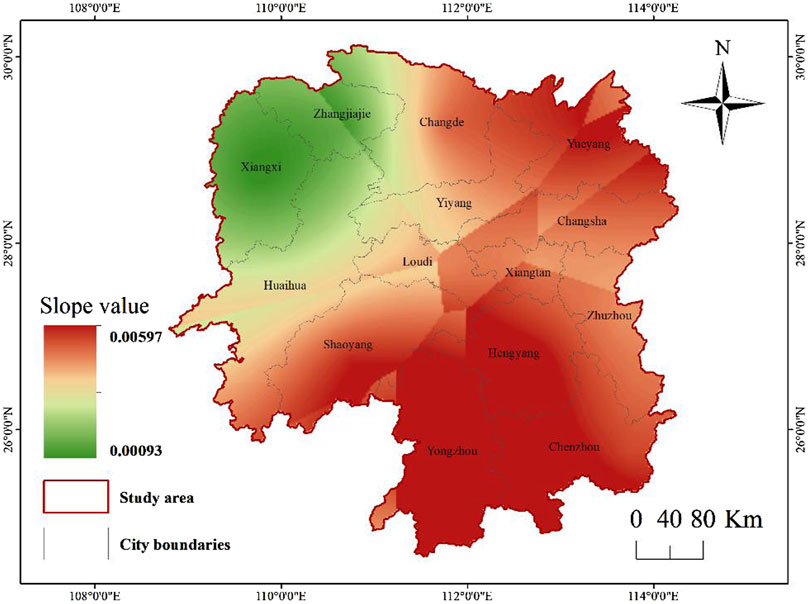
The spatial distribution patterns of meteorological crop yields were analyzed using the Theil-Sen median statistic method (Figure 10). Between 1960 and 2022, there was a significant annual increase in meteorological crop yields in Hunan Province at a 0.01 confidence level, with a slope value of 33.67. The yield trends across different regions were consistent with the provincial trend, all demonstrating an upward trajectory. Changde City had a higher slope value than other regions, indicating the most significant increase in this area, while Zhangjiajie City had a slope value of 0.00093, reflecting a smaller increase trend. Overall, crop yields across the entire study area showed an increasing trend, with significant regional variations in spatial distribution. From south to north, the spatial distribution generally followed a high-low-high pattern, with low-value areas observed in the northwest regions such as Xiangxi and Zhangjiajie. In areas with higher meteorological yields, such as the regions surrounding Yongzhou City and Yueyang City, the terrain is relatively flat and water systems are abundant, providing better moisture conditions. Even during extended periods without precipitation, these areas can still experience drought. However, the availability of good water resources can partially mitigate the threat of meteorological drought to crops by providing irrigation. In areas with lower meteorological yields, such as Xiangxi and Zhangjiajie, the mountainous terrain can reduce precipitation due to orographic effects. Additionally, the complex topography makes water accumulation and irrigation more challenging, making these regions more prone to meteorological drought and resulting in lower meteorological yields. The lower meteorological yields in areas such as Changsha and Xiangtan City may be due to excessively high local temperatures, increased evaporation, and precipitation levels that are insufficient to meet the evaporation demands, leading to drought conditions.
This study employed Pearson correlation analysis to assess the lagged associations between SPEI-01, SPEI-30, SPEI-12, and meteorological crop yields in Hunan Province. The findings reveal that SPEI-1 has a non-significant positive correlation with SYRS, with a p-value of 0.9251; SPEI-03 exhibits a negative correlation with SYRS, which is also non-significant, with a p-value of 0.88019; Similarly, SPEI-12 demonstrates a non-significant negative correlation with SYRS, with a p-value of 0.99537. None of these correlations were statistically significant. Overall, as the time scale of SPEI increases, the correlation between meteorological drought and crop yields decreases. This suggests that at a 1-month time scale, SPEI values are more responsive to short-term climate variations. The long-term climate change is not sensitive to the reflection of grain production in Hunan Province, which does not indicate that long-term climate change has no effect on grain production. Long-term climate change does have a certain impact on grain production, but this impact may be masked or mitigated by other factors. For example, improvements in agricultural technology, such as the optimization of irrigation systems, the breeding of high-yield crop varieties, and the application of precision agriculture technology, may enhance the adaptability of crops to climate change, thereby mitigating the negative impact of long-term climate change on grain production to a certain extent. Government agricultural policies, effective natural disaster management, and other agricultural inputs may also reduce the impact of long-term climate change on grain production.
4 Discussion
4.1 Response of meteorological drought to atmospheric circulation
The results of this paper prove that the meteorological drought in Hunan Province exhibits notable spatial disparities at the seasonal scale. Meanwhile, grain production in Hunan Province generally exhibited a fluctuating upward trend during 1960 and 2022, with significant influence from meteorological drought. Therefore, in order to understand the cause of meteorological drought in Hunan Province, this paper analyzes the teleconnection between atmospheric circulation and meteorological drought in Hunan Province. This study employs the Pearson correlation statistical method to examine the lag correlation between SPEI and atmospheric circulation (Figure 11).
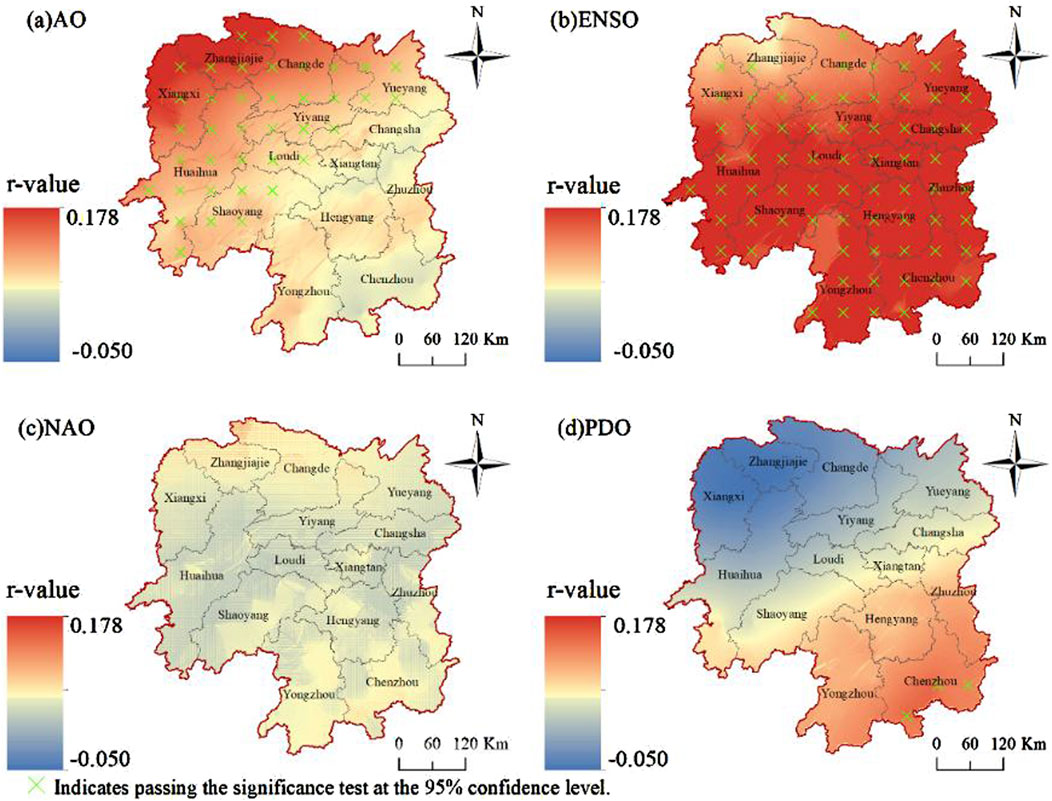
Figure 11. Response characteristics of SPEI and atmospheric circulation in Hunan Province. (A) AO. (B) ENSO. (C) NAO. (D) PDO.
The findings indicate that the proportion of AO and SPEI demonstrating a significant positive correlation is 0.542, which is distributed in areas such as Zhangjiajie, Xiangxi, Changde, Huaihua, among others. ENSO exhibits the most robust drought response in Hunan Province. With the exception of Zhangjiajie, which did not pass the significance test, the correlation between SPEI and ENSO in most other regions displays a significant positive correlation, with a proportion of 0.944. NAO does not significantly impact meteorological drought in Hunan Province. The proportion of PDO and SPEI showing a significant positive correlation is 0.0417, which is distributed in a small portion of the southeastern part of Chenzhou. From a correlation perspective, the meteorological drought in Hunan Province from 1960 to 2022 is primarily influenced by AO and ENSO, with ENSO being the dominant teleconnection factor for the meteorological drought in Hunan Province. Research has indicated that atmospheric circulation anomalies in the Eastern Hemisphere and the Western Pacific are closely linked to the occurrence of El Niño events (Huang, 2015). Against the backdrop of global warming, ENSO leads to anomalies in tropospheric water vapor, which in turn cause regional to global atmospheric circulation, temperature, and precipitation anomalies, consistent with the conclusions of this study.
The teleconnection relationship between SPEI values and the atmospheric circulation index in Hunan Province across various seasons is detailed in Table 3. The correlation between SPEI during spring and summer with the four atmospheric circulation indices was not statistically significant (p > 0.05). However, a positive correlation was observed between SPEI in autumn and winter with ENSO (p < 0.05), yielding correlation coefficients of 0.147 and 0.465, respectively. This suggests that meteorological drought in Hunan Province during autumn and winter is significantly influenced by the El Niño Southern Oscillation.
4.2 Comparison of meteorological drought in Hunan Province with other areas
This study examines the spatiotemporal characteristics of meteorological drought in Hunan Province, as well as its teleconnection with atmospheric circulation, and draws reliable conclusions. The findings reveal significant disparities in the seasonal distribution of drought events within Hunan Province, with a higher frequency observed in autumn and winter compared to spring and summer. Despite this, even in neighboring regions, there remain substantial differences in the evolution patterns of meteorological drought (Lu et al., 2022; Lv et al., 2023). This suggests that the driving patterns of meteorological drought may be intricately linked to the region’s unique terrain, climate patterns, and human activities (Liu et al., 2020).
This paper considers the relationship between drought and circulation factors from the perspective of statistics, and reveals the time-delay relationship between drought and atmospheric circulation, which is an in-depth and supplementary to the previous research on drought. However, there are many factors affecting drought in Hunan Province, and the actual physical mechanism is more complicated (such as terrain, landform and vegetation cover) (Su et al., 2018; Fan et al., 2021). Despite the established role of atmospheric circulation in influencing meteorological drought, variations exist in the primary controlling circulation factors that dictate the evolution patterns of this phenomenon within a specific region (Dong et al., 2023; Fan et al., 2021). The findings of this study underscore the substantial influence of ENSO on meteorological drought in Hunan Province. Nonetheless, research conducted in adjacent regions has demonstrated that the SOI and PDO exert a more pronounced impact on meteorological drought in Henan Province (Lu et al., 2022). Furthermore, on a more extended timescale, the research conducted by Niu et al. proposes that the synergistic impact of solar activity and ENSO may primarily contribute to the drought conditions (Niu et al., 2021). Consequently, future research should focus on integrating regional climate, geography, and human activity indicators to investigate the influence of various circulation factors on regional meteorological drought.
This study elucidates the spatiotemporal characteristics of drought in Hunan Province and its correlation with atmospheric circulation. The findings offer a novel theoretical framework for comprehending drought events in the region, bearing significant implications for regional water resource management, agricultural planning, and ecological conservation. Notably, by identifying the substantial influence of ENSO on drought in Hunan Province, this research provides a scientific foundation for climate prediction and drought warning in the area.
4.3 Strategies for drought response and grain security in Hunan Province
This study elucidates the spatiotemporal characteristics of drought in Hunan Province and their correlation with atmospheric circulation. These findings provide a new theoretical framework for understanding drought events in the region, which is of significant importance for regional water resource management, agricultural planning, and ecological conservation. In particular, by identifying the significant impact of ENSO on drought in Hunan Province, this study provides a scientific basis for climate prediction and drought early warning in the area. The following specific recommendations are proposed for different stakeholders:
(1) Agricultural Water Conservation and Crop Selection Optimization
① Water-saving irrigation techniques: Promote water-saving irrigation methods such as drip and sprinkler irrigation to reduce water evaporation; ② Drought-resistant crop cultivation: Select and plant crop varieties with stronger drought resistance.
(2) Water Resource Policy and Disaster Emergency Plan Development
① Regional water resource management: Develop regional water resource management policies that take into account the spatial distribution characteristics of drought; ② Drought response plans: Formulate emergency management, resource allocation, and public education plans.
(3) Drought Monitoring and Water Resource Assessment
① Drought monitoring models: Improve drought monitoring and prediction models to enhance forecasting accuracy; ② Water resource assessment: Conduct water resource assessments to provide a scientific basis for the rational allocation and utilization of water resources.
(4) Ecosystem Protection and Agricultural Structural Adjustment
① Ecological Impact Assessment: Assess the impact of drought on ecosystems and develop protection and restoration plans; ② Promotion of Water-Saving Agriculture: Promote water-saving agricultural technologies and efficient water use practices in agriculture, considering the establishment of a cross-regional cooperation mechanism.
4.4 Limitations and prospects of the research results
This article has made significant strides in elucidating the spatiotemporal characteristics of meteorological drought in Hunan Province and its teleconnection with atmospheric circulation. However, there remains room for enhancement due to various factors. Primarily, this study concentrated on the influence of the atmospheric circulation index on meteorological drought, neglecting to fully account for other potential contributors to drought, such as land use changes and human activities (Zhang et al., 2020; Cai et al., 2022). Subsequent research endeavors should holistically account for a multitude of factors in order to elucidate the underlying causes and evolutionary mechanisms of meteorological droughts.
Conversely, despite Hunan Province being one of the primary grain bases in China (Xu et al., 2022; Wu et al., 2021), its evaluation of meteorological drought evolution has been limited to the province itself. It has not delved into the impact process and evolutionary cycle of meteorological drought on hydrological, agricultural, and socioeconomic droughts (Figure 12). Future research should aim to integrate a broader range of meteorological models and statistical methods to enhance our understanding and predictive capabilities concerning the evolution of meteorological drought and the cyclical changes in drought types. Such advancements would offer scientific backing for drought management and climate change adaptation strategies not only in Hunan Province but also in broader regions.
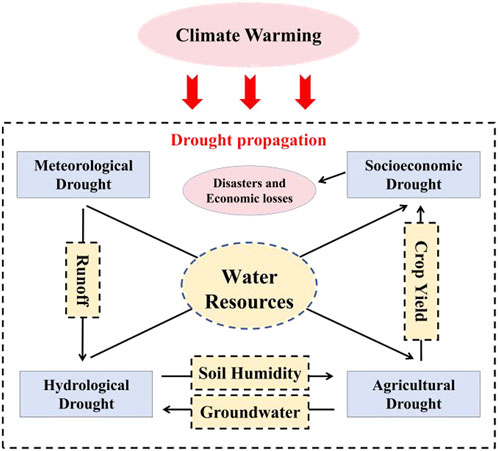
Figure 12. Driving and transition relationships between different droughts. [Note: Adapted from Tian et al. (2022)].
5 Conclusion
(1) On an interannual scale, Hunan Province underwent a severe drought that lasted for 7 months between 2011 and 2012. On a seasonal basis, the peak intensity of the SPEI was observed in the spring of 2011, while the summer of 1963 and autumn of 1966 were identified as severe drought years. The period from 2011 to 2012 marked two consecutive years of extreme drought. An analysis of seasonal drought frequency reveals that since 1960, the likelihood of experiencing a seasonal drought in Hunan Province has been ranked as follows: autumn > winter > spring > summer. Mild droughts have occurred most frequently, followed by moderate droughts, with severe and extreme droughts being less common.
(2) The meteorological drought in Hunan Province exhibits notable spatial disparities at the seasonal scale. Broadly, the drought patterns in spring and summer display a non-significant upward trajectory, with an accentuated increase observed in certain areas of Huaihua, Shaoyang, and Yongzhou. Conversely, the western and southern sectors of Hunan Province manifest a trend towards aridification during autumn, particularly in Yongzhou City where a pronounced downward trend is evident. In winter, Zhangjiajie and Xiangxi regions demonstrate a marginal downward trend.
(3) Between 1960 and 2022, grain production in Hunan Province generally exhibited a fluctuating upward trend, with significant influence from meteorological drought. The spatial distribution of the meteorological yield of grain crops displayed a high-low-high regional variation from south to north. Short-term climate change, as indicated by SPEI-01, demonstrated a positive correlation with meteorological output. However, long-term climate change did not significantly impact this relationship.
(4) Between 1960 and 2022, the circulation impacted various cities and counties in Hunan Province differently due to their distinct geographical locations. The meteorological drought prevalent in most areas of Hunan Province is primarily influenced by the AO and ENSO, with ENSO being a significant factor affecting the province’s meteorological drought conditions. Furthermore, the autumn and winter meteorological droughts in Hunan Province are notably influenced by ENSO.
Data availability statement
The original contributions presented in the study are included in the article/supplementary material, further inquiries can be directed to the corresponding authors.
Author contributions
R-YW: Conceptualization, Data curation, Formal Analysis, Funding acquisition, Methodology, Project administration, Resources, Software, Writing - original draft, Writing - review and editing, LX: Data curation, Formal Analysis, Investigation, Methodology, Software, Supervision, Validation, Visualization, Writing - original draft. TL: Conceptualization, Data curation, Formal Analysis, Funding acquisition, Project administration, Writing - original draft, Writing - review and editing. PY: Methodology, Software, Supervision, Visualization, Writing - review and editing. WZ: Data curation, Formal Analysis, Investigation, Methodology, Validation, Visualization, Writing - original draft. QH: Conceptualization, Data curation, Formal Analysis, Resources, Writing - original draft, Writing - review and editing.
Funding
The author(s) declare that financial support was received for the research, authorship, and/or publication of this article. This research was funded by the GDUPT Talents Recruitment Project, Academic Affairs of GDUPT for Goal Problem-Oriented Teaching Innovation and Practice Project, and Key Project of Yunnan Normal University Scientific Research Innovation Fund. Grant numbers 2019rc098, 41967038 and YJSJJ23-B142. The APC was funded by grant numbers 2019rc098, 41967038 and YJSJJ23-B142.
Acknowledgments
We thank the editor and reviewers for their very helpful comments and suggestions for improving the quality of the article.
Conflict of interest
The authors declare that the research was conducted in the absence of any commercial or financial relationships that could be construed as a potential conflict of interest.
Publisher’s note
All claims expressed in this article are solely those of the authors and do not necessarily represent those of their affiliated organizations, or those of the publisher, the editors and the reviewers. Any product that may be evaluated in this article, or claim that may be made by its manufacturer, is not guaranteed or endorsed by the publisher.
References
Adnan, A., Chengyi, Z., Muhammad, W., Ahmed khan, K., and Ahmad, R. (2022). Analysis of energy input–output of farms and assessment of greenhouse gas emissions: a case study of cotton growers. Front. Environ. Sci. 9. doi:10.3389/fenvs.2021.826838
Cai, Q., Liu, Y., Fang, X., Xie, M., Zhang, H., et al. (2022). Insight into spatial-temporal patterns of hydroclimate change on the Chinese Loess Plateau over the past 250 years, using new evidence from tree rings. Sci. total Environ. 850, 850157960–157960. doi:10.1016/j.scitotenv.2022.157960
Dong, S., Lin, A., Dong, Y., et al. (2023). Analysis of interannual variation of regionally persistent high temperature events in south China during 1961-2017. Chin. J. Atmos. Sci. 47 (05), 1325–1340. doi:10.3878/j.issn.1006-9895.2204.21123
Ehsan, E., Guojing, L., Xinru, H., et al. (2023). Decoupling livestock and poultry pollution emissions from industrial development: a step towards reducing environmental emissions. J. Environ. Manag., 350119654–119654. doi:10.1016/J.JENVMAN.2023.119654
Elahi, E., Zhu, M., Khalid, Z., and Wei, K. (2024). An empirical analysis of carbon emission efficiency in food production across the Yangtze River basin: towards sustainable agricultural development and carbon neutrality. Agric. Syst. 218, 218103994. doi:10.1016/j.agsy.2024.103994
Fan, L., Lü, A., and Zhang, W. (2021). Spatial-temporal characteristics of drought in qinghai province and its response to atmospheric circulation. Arid Zone Resour. Environ. 35 (12), 60–65. doi:10.13448/j.cnki.jalre.2021.326
Hao, Z., and Singh, P. V. (2015). Drought characterization from a multivariate perspective: a review. J. Hydrology 527, 527668–527678. doi:10.1016/j.jhydrol.2015.05.031
Hu, X. (2023). Spatial-temporal evolution and prediction of meteorological drought in different climatic regions of gansu province. Northwest A&F University.
Huang, S., Wang, L., Wang, H., Huang, Q., Leng, G., Fang, W., et al. (2019). Spatio-temporal characteristics of drought structure across China using an integrated drought index. Agric. Water Manag. 218, 182–192. doi:10.1016/j.agwat.2019.03.053
Huang, Z. Y. (2015). “Research on the climatic characteristics and influencing factors of persistent high-temperature events,” in Hunan Province (Lanzhou University).
Jiang, D., and Wang, X. (2021). A brief interpretation of drought change from IPCC Sixth Assessment Report. Trans. Atmos. Sci. 44 (05), 650–653. doi:10.13878/j.cnki.dqkxxb.20210810007
Li, B., and Zhang, Y. (2022). Quantitative analysis of the impact of climate change during different growth stages on winter wheat yield in Henan Province. Jiangsu Agric. Sci. (12), 238–246. doi:10.15889/j.issn.1002-1302.2022.12.036
Li, T., Lv, A., Zhang, W., and Liu, Y. (2023b). Spatiotemporal characteristics of watershed warming and wetting: the response to atmospheric circulation in arid areas of northwest China. Atmosphere 14 (1), 151–151. doi:10.3390/atmos14010151
Li, T., Zhang, W., Lv, A., et al. (2023a). Temporal and spatial characteristics of heat resources in growing season in yunnan province, China. Mt. Res. 41 (03), 361–374. doi:10.16089/j.cnki.1008-2786.000754
Liu, Y., Hoskins, B., and Blackburn, M. (2007). Impact of Ti-betan orography and heating on the summer flow over Asia. J. Meteorological Soc. Jpn. Ser. 11 (85B), 1–19. doi:10.2151/jmsj.85b.1
Liu, Z., Sun, Q., Lu, H., et al. (2023). Spatial-temporal characteristics of drought and atmospheric circulation response in ningxia. Res. Soil Water Conservation 30 (03), 225–231+239. doi:10.13869/j.cnki.rswc.2023.03.011
Liu, Z., Zhang, X., Li, Z., et al. (2020). Analysis on spatial-temporal distribution and atmospheric circulation of seasonal droughts in the Dongting Lake basin in recent 58 years. Resour. Environ. Yangtze Basin 29 (06), 1432–1444. doi:10.11870/cjlyzyyhj202006017
Long, Y., Jiang, F., Deng, M., Wang, T., and Sun, H. (2023). Spatial-temporal changes and driving factors of ecoenvironmental quality in the Three-North region of China. J. Arid Land 15 (03), 231–252. doi:10.1007/s40333-023-0053-0
Lu, J., Gan, R., Yang, F., et al. (2022). Correlation analysis of drought characteristics in henan province based on SPEI index and circulation index. China Rural Water Hydropower (04), 17–24. doi:10.3969/j.issn.1007-2284.2022.04.003
Lu, Q. (2022). Temporal and spatial variation characteristics of drought in Guangxi and its impact on crop production. Nanning Normal University.
Lv, P., Zhou, Q., Xian, J., et al. (2023). Seasonal drought spatial-temporal characteristics and its response to atmospheric circulation in anhui province. Water Resour. Hydropower Eng. Technol. 54 (12), 93–105. doi:10.13928/j.cnki.wrahe.2023.12.008
Niu, J., Wang, L., Yang, K., Liu, S., Yin, J., Liang, Q., et al. (2021). Spatial-temporal characteristics of drought and flood disasters in Yunnan Province on the margin of the Tibetan plateau over the past 620 years. Int. J. Climatol. 42 (2), 1388–1398. doi:10.1002/joc.7309
Pei, Z. F., Fang, S. B., Wang, L., and Yang, W. (2020). Comparative analysis of drought indicated by the SPI and SPEI at various timescales in Inner Mongolia,China. Water 12 (7), 1925–1944. doi:10.3390/w12071925
Piao, S., Ciais, C., Huang, Y., Shen, Z., Peng, S., Li, J., et al. (2010). The impacts of climate change on water resources and agriculture in China. Nature 467 (7311), 43–51. doi:10.1038/nature09364
Rong, Y., Huang, G. Y., and Ma, H. Y. (2024). Impact of climate change on grain yield per unit area in the huang-huai-hai region: analysis by HP filtering method. J. Henan Agric. Univ. (06), 1–17. doi:10.16445/j.cnki.1000-2340.20240822.001
Su, B., Huang, J., Fischer, T., Wang, Y., Kundzewicz, Z. W., Zhai, J., et al. (2018). Drought losses in China might double between the 1.5°C and 2.0°C warming. Proc. Natl. Acad. Sci. 115 (42), 10600–10605. doi:10.1073/pnas.1802129115
Tian, F., Yang, J., Liu, L., and Wu, J. (2022). Progress of research on the conception, characteristic, and influencing factors of drought propagation from the perspective of geographic sciences. Prog. Geogr. 41 (01), 173–184. doi:10.18306/dlkxjz.2022.01.015
Wang, J., Li, Y., Wang, R., et al. (2012). Review of research progress on meteorological drought in China. J. Arid Meteorology 30 (4), 497–508.
Wang, L., Chen, W., and Huang, R. (2008). Interdecadal modulation of PDO on the impact of ENSO on the east Asian winter monsoon. Geophys. Res. Lett. 35 (20), L20702. doi:10.1029/2008gl035287
Wu, J. F., Yao, H. X., Chen, X. H., Wang, G., Bai, X., and Zhang, D. (2021). A framework for assessing compound drought events from a drought propagation perspective. J. Hydrology 640, 127228. doi:10.1016/j.jhydrol.2021.127228
Xie, A., Luo, R., Deng, J., et al. (2023). Characteristics and causes analysis of extreme drought events in hunan province during summer, autumn, and winter of 2022/2023. J. Arid Meteorology 41 (06), 910–922. doi:10.11755/j.issn.1006-7639(2023)-06-0910
Xu, B., Lu, Z., Yang, S., et al. (2022). Spatio-temporal evolution pattern and influencing factors of agricultural production efficiency in hunan province. Econ. Geogr. 42 (03), 141–149. doi:10.15957/j.cnki.jjdl.2022.03.015
Yin, J., Gentine, P., Slater, L., Gu, L., Pokhrel, Y., Hanasaki, N., et al. (2023). Future socio-ecosystem productivity threatened by compound drought–heatwave events. Nat. Sustain. 6 (3), 259–272. doi:10.1038/s41893-022-01024-1
Yin, J., Hu, W., Chen, A., Li, T., and Zhang, W. (2024). Human-caused increases in organic carbon burial in plateau lakes: the response to warming effect. Sci. total Environ. 937, 937173556–173556. doi:10.1016/j.scitotenv.2024.173556
Yuan, X., and Liu, F. (2022). Comparison of four methods for separating meteorological yield of rapeseed. Guizhou Agric. Sci. (08), 112–118. doi:10.3969/j.issn.1001-3601.2022.08.015
Yuan, X., Wang, Ji, P., Wu, P., Sheffield, J., and Otkin, J. A. (2023). A global transition to flash droughts under climate change. Sci. (New York, N.Y.) 380 (6641), 187–191. doi:10.1126/science.abn6301
Zhang, Q., Yao, Y., Li, Y., et al. (2020). Progress and prospect on the study of causes and variation regularity of droughts in China. Acta Meteorol. Sin. 78 (3), 500–521. doi:10.11676/qxxb2020.032
Keywords: Hunan Province, run theory, meteorological drought, atmospheric circulation, temporal and spatial characteristics, teleconnection
Citation: Wang R-Y, Xu L, Li T, Yin P, Zhu W and Han Q (2024) Temporal-spatial characteristics of climate drought and its effects on grain yield in Hunan Province, China. Front. Environ. Sci. 12:1489662. doi: 10.3389/fenvs.2024.1489662
Received: 01 September 2024; Accepted: 17 October 2024;
Published: 29 October 2024.
Edited by:
Devaraju Narayanappa, CSC - IT Center for Science, FinlandReviewed by:
Adnan Abbas, Nanjing University of Information Science and Technology, ChinaMingzhong Xiao, Sun Yat-sen University, China
Copyright © 2024 Wang, Xu, Li, Yin, Zhu and Han. This is an open-access article distributed under the terms of the Creative Commons Attribution License (CC BY). The use, distribution or reproduction in other forums is permitted, provided the original author(s) and the copyright owner(s) are credited and that the original publication in this journal is cited, in accordance with accepted academic practice. No use, distribution or reproduction is permitted which does not comply with these terms.
*Correspondence: Taohui Li, dGFvaHVpMDgxM0Bmb3htYWlsLmNvbQ==; Qiaohua Han, aHFoMDIwN0AxNjMuY29t
†These authors have contributed equally to this work and share first authorship
 Ruei-Yuan Wang
 Lirong Xu
 Taohui Li
 Pengfei Yin3
 Qiaohua Han