- Solux College of Architecture and Design, University of South China, Hengyang, China
Introduction: Regional carbon storage is a significant indicator of ecosystem service functions. Examining the impact of changes in land use on carbon stock in the Chang-Zhu-Tan urban agglomeration under different topographic reliefs is paramount for sustainable land resource utilization and realizing carbon peaking and neutrality goals.
Methods: This study focuses on the Chang-Zhu-Tan urban agglomeration, using the InVEST model in combination with land use data to explore the distribution pattern of land use change and carbon storage from the perspective of topographic relief.
Results: The research results show that:(1) the optimal analysis window for topographic reliefs in the study area is 17 × 17, covering an area of 0.26 km², with an average topographic relief of 78.58 m. (2) Between 2000 and 2020, Cultivated land and forest land decreased by 592.27 km² and 421.5 km², respectively, while the built-up land area increased by 982.36 km². (3) Due to human activities, carbon stock in the study area showed a decreasing trend, with a total reduction of 13.37 × 10⁶ tons over the past 20 years. (4) The distribution of carbon stock across topographic reliefs mainly exhibits low-value and moderate-value carbon stock concentrations in flat and slightly undulating areas. In contrast, moderately high-value and high-value carbon stock concentrations are concentrated in gently and moderately undulating areas.
Discussion: These research findings provide a scientific foundation for optimizing the spatial pattern of the study area and formulating carbon peak and carbon-neutral policies.
1 Introduction
As globally significant carbon reservoirs, land ecosystems sequester greenhouse gases such as carbon dioxide through carbon sequestration, storing them within the carbon reservoir (Li et al., 2021; He et al., 2016). As an essential component of carbon sinks, land-based ecosystem carbon storage plays a significant role in addressing climate change and achieving carbon neutrality (Gong et al., 2022; Cantarello et al., 2011). Land use changes directly impact terrestrial ecosystems’ carbon storage (Zhao et al., 2018; Fu et al., 2019). Rapid urbanization exacerbates conflicts between humans and the land, as intense human land use leads to ecosystem degradation, reducing carbon storage in terrestrial ecosystems (Lin et al., 2022a; Cao et al., 2022). Against the backdrop of the carbon peak and carbon neutral goals, studying the relationship between changes in land use and the distribution of carbon storage in terrestrial ecosystems is of great significance for enhancing regional ecosystem carbon sink capacity, achieving carbon peak and neutrality targets, and promoting regional sustainable development (Deng et al., 2022; Li et al., 2018).
Scholars have recently researched the correlation between land use and carbon storage changes. Gao Jing, through a spatiotemporal analysis of carbon storage evolution in the Yangtze River Delta region, found that the leading cause of reduced regional carbon storage was primarily attributed to socio-economic factors rather than natural causes (Gao and Wang, 2019). Li Lu researched the correlation between urban growth and carbon storage in Wuhan, China. They found that under integrated spatial regulation, the urban demand for high-carbon-density land decreases, and regional carbon storage decreases accordingly (Li et al., 2020). Du Xuejun found that due to increased carbon emissions from urban areas and reduced carbon sinks in forests, the ecosystem service value of Hangzhou, China, has been continuously declining, with significant impacts on ecology and the environment resulting from land use change (Du and Huang, 2017). These studies found that land use is the primary factor leading to changes in carbon storage and affects the functionality and composition of ecosystems, thereby controlling the capacity of carbon sequestration of regional ecosystems. Research on changes in land use can effectively analyze its impact on carbon storage. Recently, much research based on different types of land use characteristics (Wang R.-Y. et al., 2024; Yue et al., 2023), combined with the Lund-Potsdam-Jena-guess (LPJ-GUESS) dynamic vegetation model (Zhao et al., 2014), denitrification-decomposition (DNDC) model (Musafiri et al., 2021), and global production efficiency model (GLO-PEM) (Tan et al., 2012), evaluates regional ecosystem carbon storage. However, these models suffer from drawbacks such as long sampling periods, complex data requirements, and large workloads (Zhu et al., 2021; Jiang et al., 2017). In contrast, the Integrated Valuation of Ecosystem Services and Trade-offs (InVEST) model, with its minimal data requirements, high precision, and convenient operation, has widely applied its carbon storage module in terrestrial ecosystem carbon storage research (He et al., 2023; Wu et al., 2024). For example, Sun Tiancheng used the InVEST model to assess carbon storage in the southeastern coastal zone of Hainan Island and proposed ecosystem restoration strategies for coastal zones (Sun et al., 2023). He Chunyang employed the InVEST model to evaluate carbon storage changes in Beijing. They found that the associated model could effectively assess the impact of future urban expansion on the environment (He et al., 2016). The studies, as mentioned earlier, have achieved satisfactory results by coupling changes in land use with the InVEST model, which enables a clear reflection of the spatial distribution pattern of carbon storage (Adelisardou et al., 2022; Li et al., 2023).
Scholars have conducted numerous studies using the InVEST model to investigate the correlation between changes in land use and regional carbon storage (Wang C. et al., 2022; Wang Y. et al., 2024). However, only a few studies have considered the impact of topographic relief on changes in carbon storage (Fang et al., 2018; Meena et al., 2021). As a core element of dual evaluation in national spatial planning, Terrain topography plays a crucial role in regional ecological protection and sustainable development (Shi et al., 2022; Xu and Dong, 2023). The topography of the Chang-Zhu-Tan urban agglomeration (CZTUA) is primarily characterized by hills and ridges, which are unique surface landforms. The rugged terrain renders ecosystems relatively fragile and significantly impacts the functions of regional ecosystems and the sustainable development of socio-economics (Yang et al., 2022). Therefore, studying the pattern of carbon storage changes in the CZTUA from the perspective of topographic reliefs is of particular reference significance for optimizing related land use and enhancing ecosystems’ carbon sequestration service capacity.
The new development direction explored in China’s new urbanization involves central cities driving the development of urban agglomeration and urban agglomeration, propelling regional development. As an integral part of the Yangtze River Economic Belt, the CZTUA serves as a core area for China’s economic and social development and a a key area for developing new urbanization (Mi et al., 2023, Tang et al., 2021). It bears the historical responsibility of regional coordinated development. Research on the CZTUA can effectively address common problems in developing urban agglomerations. Therefore, taking the CZTUA as the research area, based on land use and Digital Elevation Model (DEM) data, employing the neighborhood analysis method to extract topographic reliefs and mean change point method to extract the optimal analysis window for topographic reliefs. Using the carbon storage module of the InVEST model, this research investigates the changes in land use and carbon storage from the perspective of topographic reliefs in the study area during three periods: 2000, 2010, and 2020. It aims to reveal the impact of land use change on carbon storage and explore the distribution patterns of carbon storage in the CZTUA about topographic reliefs, aiming to provide a scientific foundation for optimizing the spatial pattern of the study area and formulating carbon peak and carbon neutral policies.
2 Materials and methods
2.1 Study area
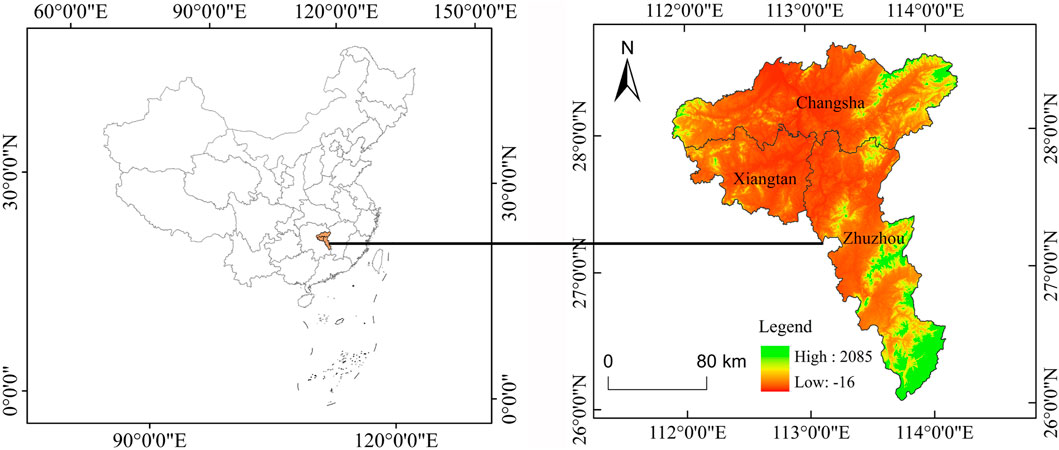
Located in the central part of China, the CZTUA is an essential component of the Yangtze River economic belt, Comprising the three cities of Changsha, Zhuzhou, and Xiangtan, with an area of nearly 28,000 km2 (Figure 1). The topography of the CZTUA is notably unique, characterized by a combination of hills and ridges, with a regional climate predominantly influenced by subtropical monsoon climates and vegetation mainly composed of subtropical evergreen broad-leaved forests. The area is rich in forestry resources, with forested land accounting for 62.29% of the total area in 2020. The annual average temperature ranges between 16°C and 18°C, while annual precipitation ranges between 1,200 and 1,500 mm. In 2022, the total population of the research area was approximately 17 million, with a gross domestic product (GDP) of 281.97 billion US dollars, accounting for 41.7% of Hunan Province’s GDP. The CZTUA is the most developed region in terms of economy and society in Hunan Province. It is a significant ecological security barrier for the Yangtze River economic belt (Mi et al., 2023). Balancing the relationship between urban agglomeration development and ecosystem protection is an essential proposition for the sustainable development of the research area.
2.2 Data sources
The land use data and administrative boundary data for the three periods in 2000, 2010, and 2020 were sourced from the Chinese Academy of Sciences Resource and Environmental Science Data Center (https://www.resdc.cn), with a resolution of 30 m. Following the first-level classification standard of land use status in China, land use is divided into six major categories (cultivated land, forest land, grassland, water, built-up land, and unused land). DEM data were acquired using the ASTER Global Digital Elevation Map (v2) from the Geospatial Data Cloud (http://www.gscl.oud.cn/), with a resolution of 30 m.
The carbon density data primarily rely on research findings from certain scholars (Ouyang et al., 2021; Ouyang et al., 2022) and the carbon density dataset of Chinese terrestrial ecosystems (Xu et al., 2019). Due to incomplete data on the carbon density of dead organic matter, it was not included in the calculation scope. Carbon density data are presented in Table 1.
2.3 Methods
2.3.1 Window analysis method
Using DEM data, the window analysis method (neighborhood analysis method) was employed to extract topographic relief (Hui et al., 2015), with the formula as follows (see Equation 1):
In the equation, D represents the topographic relief of different grid cells under different windows; Hmax denotes the maximum altitude of the grid; and Hmin denotes the minimum elevation of the grid.
2.3.2 Mean change point method
The mean change point method was used to determine the ideal analysis window for topographic relief in the research (Zhao et al., 2017). The mean shift analysis method is a statistical analysis method used to calculate points of anomaly and mutation within a data series, and it is particularly effective for calculating points with only one inflection point. The formula is as follows:
1) Based on the average topographic relief values for each analysis window, the average topographic relief value per unit area for each window is calculated using Equation 2:
In the equation, Ti represents the unit topographic relief value corresponding to the i window; ti represents the average topographic relief value under the i window; Si represents the area of the window; i denotes the window size, ranging from 1, 2, 3, to n, where n is the maximum size of the window. In this study, n is 49; thus, the maximum window size is 49 × 49.
2) Based on the unit topographic relief values under different windows, Equation 3 was used to perform logarithmic calculations.
In the equation, Xi represents the logarithm of Ti.
3) Equations 4, 5 were employed to calculate the arithmetic mean X and the sum of the squared deviations S for the sequence {Xi}:
X represents the sequence {Xi} arithmetic mean, and S represents the sum of squares of deviations for the total sample.
4) For each k value (2, 3, 4,..., n), the sequence was divided into two parts, {X1, X2,..., Xk-1} and {Xk, Xk+1,..., Xn}. Then, the arithmetic means Xk1 and Xk2 are calculated separately for each sequence part, along with the statistical parameter Sk. The formula is as follows (see Equation 6):
In the equation, Sk denotes the sum of squares of deviations for the two consecutive segments of samples.
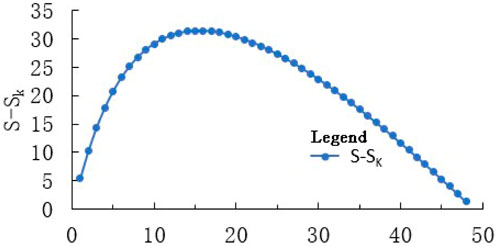
By computing the difference between S and Sk, the maximum difference between them identifies the inflection point, which is the optimal analysis window.
2.3.3 Topographic Relief Extraction
2.3.3.1 Determination of the optimal analysis window
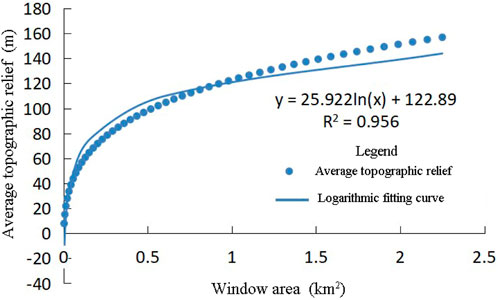
The study uses the window analysis method to analyze the DEM data, resulting in 49 different windows of topographic relief layers. The average topographic relief values and grid area corresponding to different windows were statistically analyzed. As shown in (Figure 2), a good fit existed between the regions corresponding to various windows and the average topographic relief. The coefficient of determination R2 was 0.956. The mean change point method was utilized to more accurately find the optimal analysis window corresponding to the fitted curve. As shown in (Figure 3), the maximum difference between S and Sk was 31.36 at the 16th point, corresponding to a 17 × 17 analysis window with an area of 0.26 km2. Thus, the analysis window at this point was considered the optimal window for extracting topographic relief.
2.3.3.2 Topographic relief extraction
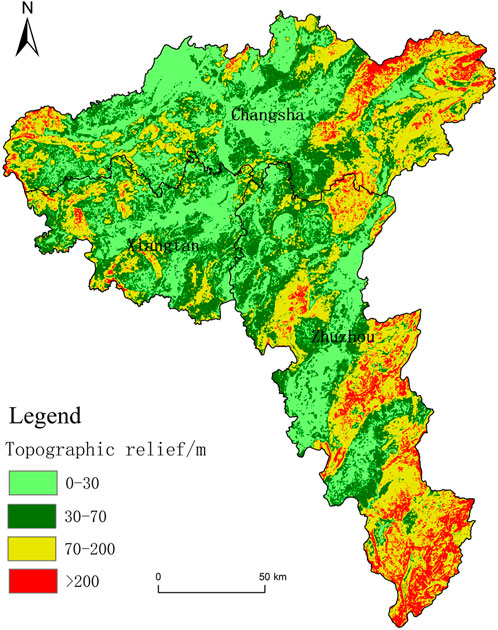
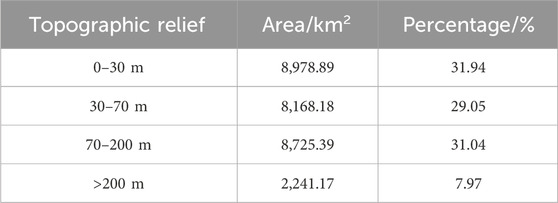
Based on the DEM data, topographic relief of the CZTUA was extracted using a 17 × 17 analysis window. The region’s topographic relief range was 0–600 m, with an average topographic relief of 78.58 m. Based on the topographic characteristics of the CZTUA and referring to the research results of some scholars (Zhang et al., 2018; Chen et al., 2016), divide the topographic relief of the study area into four levels: flat (0–30 m), slightly undulating (30–70 m), gently undulating (70–200 m), and moderately undulating (>200 m). The topographic relief classification map (Figure 4) and the classification statistics table (Table 2) were created by drawing and calculating the area proportions of various types of topographic relief.
Figure 4; Table 2 show that the topographic relief of the CZTUA is predominantly characterized by flat, slightly undulating, and gently undulating terrains, accounting for 92.03% of the study area. Flat areas occupy the most significant proportion at 31.94%, followed by gently undulating and slightly undulating areas, accounting for 31.04% and 29.05%, respectively. Moderately undulating areas have the smallest area, accounting for only 7.97%. Regarding spatial distribution, flat areas are mainly distributed in the northern and central parts of Changsha, the eastern and middle parts of Xiangtan, and the central and northwestern parts of Zhuzhou. Slightly undulating areas are mainly distributed around flat areas, with some areas interspersed with flat areas. Gently undulating areas are mainly distributed on the eastern and western sides of Changsha, the western and southern parts of Xiangtan, and the central-northern, northeastern, eastern, and southeastern parts of Zhuzhou. Moderately undulating areas are primarily distributed in the eastern parts of Changsha and the eastern and southeastern parts of Zhuzhou, with some areas interspersed with gently undulating areas. Overall, the topographic relief of the CZTUA exhibits a spatial distribution characterized by “low in the central part, high around the periphery.”
2.3.4 Carbon storage assessment based on the InVEST model
Using the carbon storage module of the InVEST model, combined with land cover data and carbon storage from four carbon pools (aboveground biomass carbon density, belowground biomass carbon density, soil carbon density, and dead organic matter carbon density), to calculate the carbon storage of regional ecosystems (Wang Y. et al., 2024), with the formula as follows (see Equations 7, 8):
Where Ci represents the total carbon density of land type i; Ci_above is the aboveground biomass carbon density of land type i; Ci_below is the belowground biomass carbon density of land type i; Ci_soil is the soil organic carbon density of land type i; Ci_dead denotes the dead organic matter carbon density of land type i; Ci_total is the total carbon storage of land type i; Ai denotes the area of land type i.
3 Results
3.1 Land use change
3.1.1 Land use dynamics and transitions
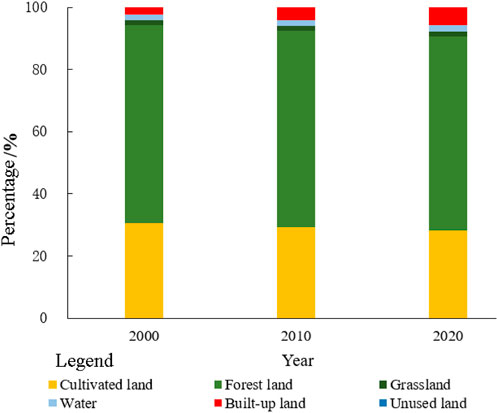
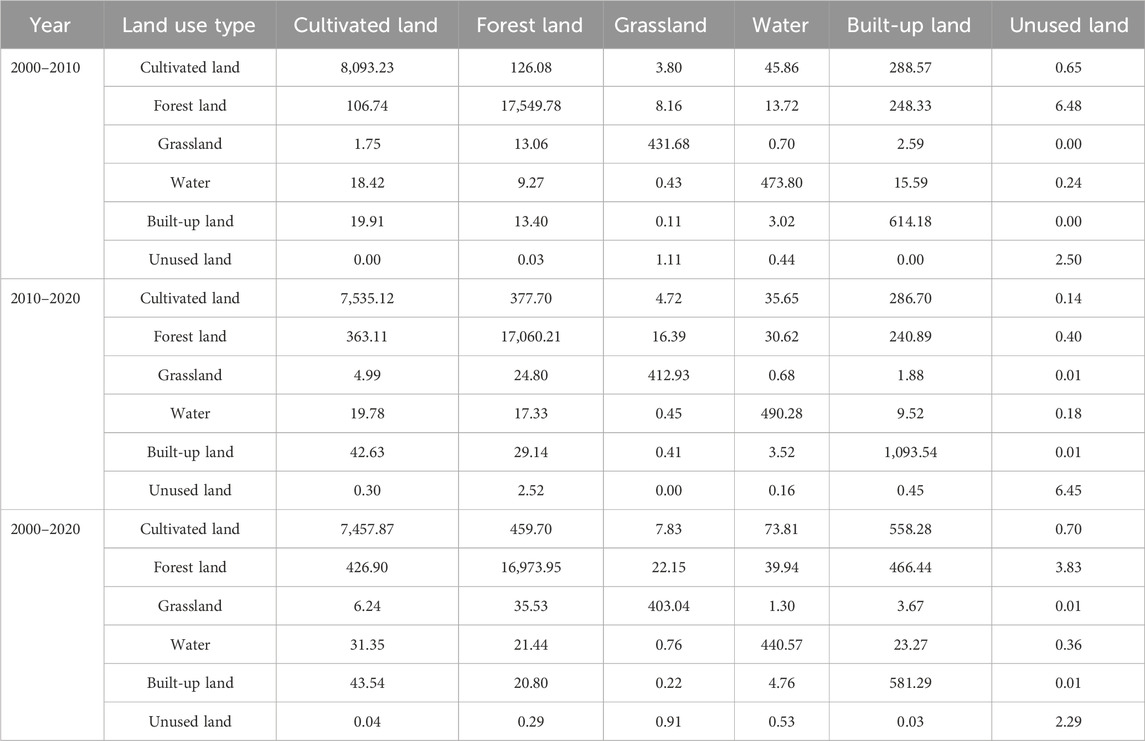
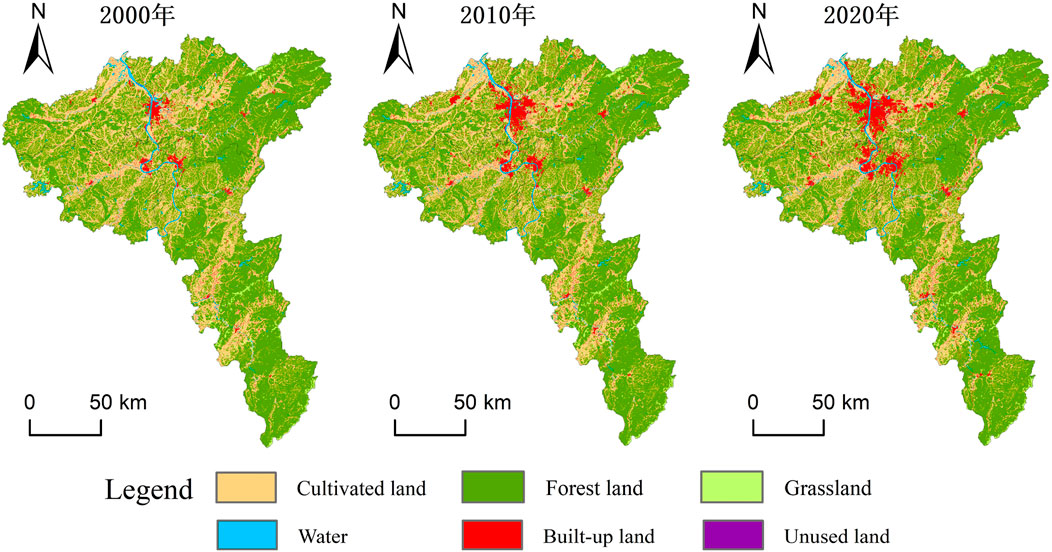
As illustrated in Figure 5, forests and cultivated lands are the predominant land use types in the CZTUA, collectively covering over 90% of the total study area. Transition matrices were constructed for 2000–2010, 2010–2020, and 2000–2020 (Table 3). Combining these matrices with the land use distribution maps (Figure 6), it can be concluded that land use transitions within the CZTUA from 2000 to 2010 primarily occurred among cultivated lands, forests, and built-up lands. Cultivated lands witnessed the largest outflow, covering 318.15 km2, followed by forests with 221.58 km2. A significant inflow was observed in built-up lands, totaling 518.64 km2. Apart from mutual transitions between cultivated lands and forests, most outgoing lands were converted to built-up lands. Additionally, water and unused lands received 19.80 km2 and 5.79 km2, respectively, while grasslands contributed 4.49 km2 to the outflow. The trends persisted from 2010 to 2020, with cultivated lands and forests predominantly converting to built-up lands, albeit slowly. Specifically, cultivated lands saw an outflow of 274.12 km2, forests 199.91 km2, and the built-up regions experienced an inflow of 463.73 km2. Moreover, water continued to expand, with an inflow of 23.37 km2, unused lands exhibited an outflow of 2.68 km2, and grasslands 10.39 km2. Overall, between 2000 and 2020, land use changes in the CZTUA were characterized primarily by a reduction in cultivated land and forest land and an increase in built-up land. Cultivated land and forest land decreased by 592.27 km2 and 421.5 km2, respectively, while the built-up land area increased by 982.36 km2.
3.1.2 Land use changes across varied topographic reliefs
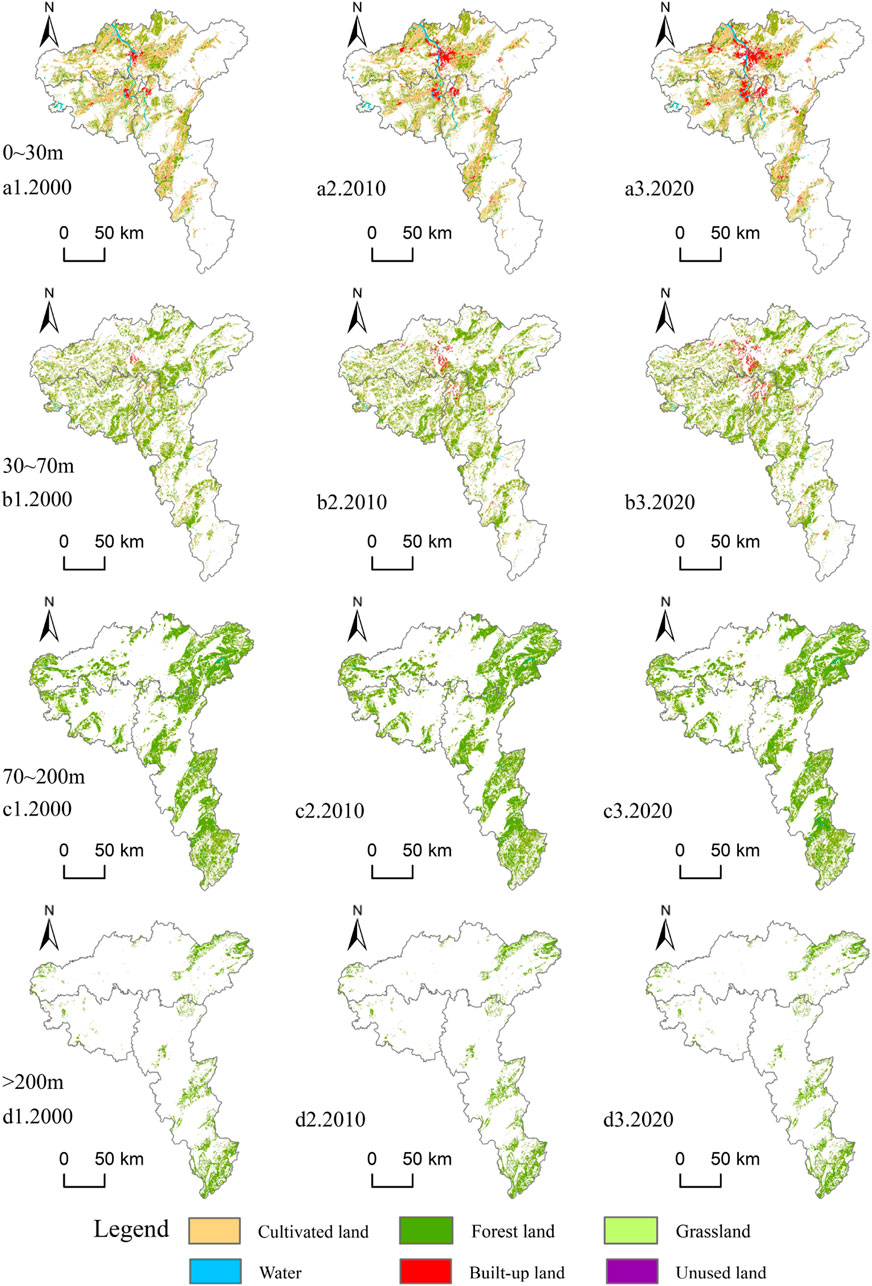
The CZTUA features complex terrain characteristics, influencing the distribution of land use types. The spatial layout of land use across different topographic reliefs was obtained by overlaying classified topographic relief raster data with land use maps for 2000, 2010, and 2020 using ArcGIS (Figure 7; Table 4).
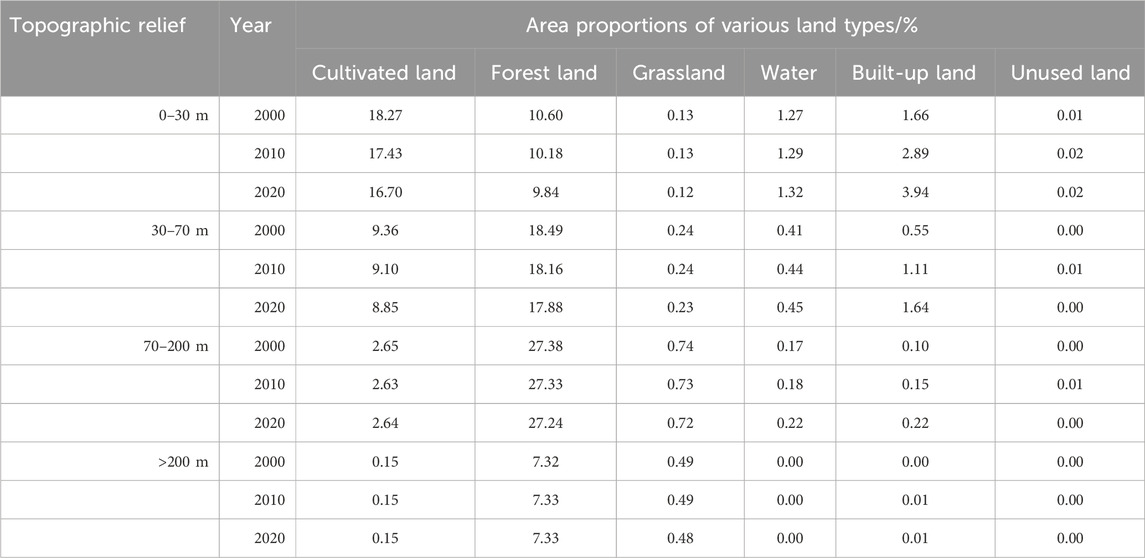
Table 4. Changes in the area of different land use types for each topographic relief in the study area.
The integration of Figures and tables reveals that cultivated lands, water, and built-up lands mainly occupy flat and slightly undulating areas. In contrast, forests predominantly occur in slightly undulating and gently undulating areas, and grasslands are concentrated in gently and moderately undulating areas. Overall, over the 20 years, land use changes in areas with different topographic reliefs exhibit a degree of continuity. Changes in flat areas primarily occurred in suburban areas of various cities, characterized by substantial conversions of cultivated lands and forests to built-up lands, accompanied by a gradual increase in water. Changes in slightly undulating areas resembled flat areas but with smaller magnitudes. Land use changes in gently undulating areas involved limited conversions of cultivated lands, forests, and grasslands to built-up lands and water. Changes in moderately undulating areas remained minimal, except for minor conversions of grasslands to built-up lands.
3.2 Land use and carbon storage dynamics
3.2.1 Temporal and spatial variations in carbon storage
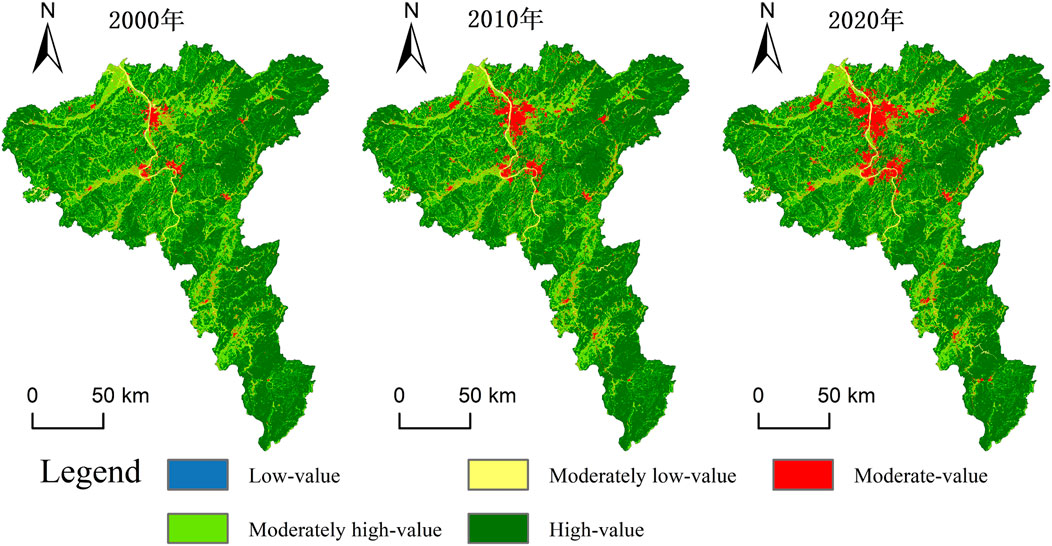
Using the InVEST model, the carbon storage of the CZTUA was estimated for the years 2000, 2010, and 2020. Over time, carbon storage exhibited a gradual decreasing trend, with respective storage values of 96.91 × 10⁷t, 96.20 × 10⁷t, and 95.57 × 10⁷t for the three periods, reflecting a total decrease of 13.37 × 10⁶t. Based on the characteristics of carbon storage distribution in the research area and referencing the findings of some scholars (Lin et al., 2022b; Wang R.-Y. et al., 2024), a combined approach using the natural breakpoint method and manual classification was employed to categorize carbon storage distribution into five levels: low-value, moderately low-value, moderate-value, moderately high-value, and high-value areas. Analysis of the changes in the area for each level of carbon storage (Table 5) revealed a gradual decrease in high-value and moderately high-value regions, accompanied by an increase in moderate-value and moderately low-value areas. Furthermore, the area of low-value regions exhibited a trend of first increasing and then decreasing.
From the spatial distribution of carbon storage (Figure 8), the study area exhibits an overall relatively high level of carbon storage, with most regions situated in the high-value and moderately high-value zones, albeit showing a declining trend. Between 2000 and 2010, high-value and moderately high-value areas were primarily distributed in regions with high vegetation coverage surrounding the study area, dominated by cultivated lands and forests, while moderate-value and moderately low-value areas were mainly located in the central-northern parts near urban areas, characterized by built-up lands and water. Low-value areas were scattered throughout the study area, primarily adjacent to urban edges, dominated by unused lands. Between 2010 and 2020, the distribution of carbon storage remained consistent, with the expansion of built-up lands into cultivated lands and forests leading to a transition from high-value and moderately high-value areas to moderate-value and moderately low-value areas. Between 2000 and 2020, the spatial variation of carbon storage in the research area primarily involved the transition of high-value and moderately high-value areas near urban centers to moderate-value and moderately low-value areas, reflecting a spatial distribution pattern of “low in the center, high around the periphery.”
3.2.2 Changes in carbon storage across land classes
Table 6 reveals that forests had the highest carbon storage in the CZTUA from 2000 to 2020, followed by cultivated and built-up lands, with the most negligible carbon storage in unused land. The quantity of carbon storage was closely related to the size of each land class. Based on the changes in carbon stocks across different land types over the past 20 years, cultivated lands, forests, and grasslands exhibited a decreasing trend. The proportions of carbon storage for these three land types decreased from 20.39%, 76.89%, and 0.97% in 2000 to 19.25%, 76.13%, and 0.95% in 2020, respectively. Carbon storage in built-up lands rapidly increased, rising from 1.21% in 2000 to 3.08% in 2020. This trend is the continuous expansion of built-up lands, encroaching on surrounding cultivated lands, forests, and grasslands, thereby leading to varying degrees of reduction in carbon storage for these three types of land. Carbon storage in water increased from 0.54% in 2000 to 0.60% in 2020. This increase is primarily attributed to adjustments in agricultural structures, resulting in the continuous expansion of aquaculture areas, coupled with the close association with urban wetland construction initiatives such as the construction of wetland parks like Meixi Lake and Songya Lake in Changsha City. Due to their small area, unused lands experienced almost no change in carbon storage over the 20 years.

Table 6. Carbon storage and its proportion of different land use types in the study area from 2000 to 2020.
3.3 Topographic reliefs and changes in carbon storage
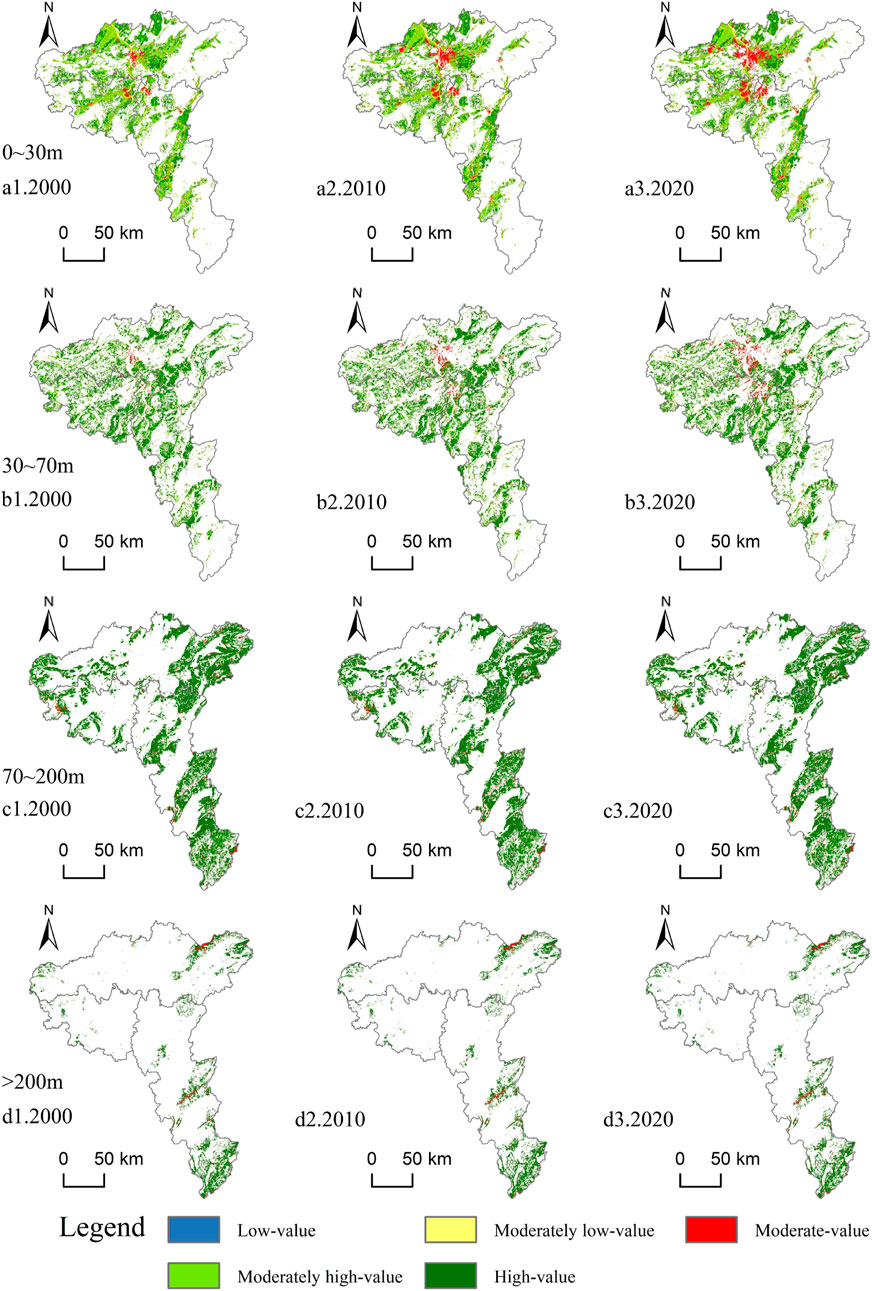
The spatial distribution of carbon storage across different topographic reliefs was obtained by overlaying classified topographic relief raster data with 2000, 2010, and 2020 carbon storage maps using ArcGIS (Figure 9; Table 7). Figure 9 reveals that areas with different levels of carbon storage are distributed across flat regions, with moderate-value and moderately low-value areas primarily concentrated in this region, characterized by built-up lands and water. In slightly undulating areas, high-value, moderately high-value, and moderate-value areas are predominant compared to flat regions; high-value areas have increased, and moderate-value areas have decreased because of the lower proportion of built-up area and the higher proportion of forest area in these areas compared to flat regions. In gently and moderately undulating areas, the range of high-value areas for carbon storage significantly increased, accompanied by small proportions of moderately high-value and moderate-value areas, with forests predominating in high-value areas and cultivated lands and grasslands in moderately high-value and moderate-value areas, respectively.
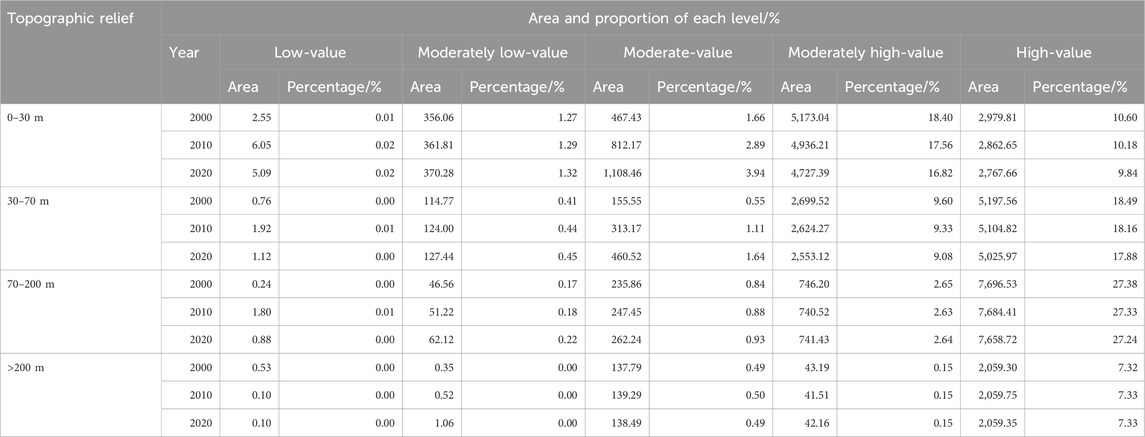
As shown in Table 7, it can be observed that changes between different levels of carbon storage were more significant in flat regions from 2000 to 2010, primarily characterized by a decrease in the areas of high-value and moderately high-value regions and an increase in moderate-value areas. The areas of high-value and moderately high-value regions decreased by 0.42% and 0.84%, respectively, while the area of moderate-value regions increased by 1.66%. Similar trends in changes between different levels of carbon storage in flat regions continued until 2020. In slightly undulating areas, changes between varying levels of carbon storage from 2000 to 2010 were relatively minor compared to flat regions, mainly with a decrease in the areas of high-value and moderately high-value regions and an increase in moderate-value areas. The areas of high-value and moderately high-value regions decreased by 0.33% and 0.27%, respectively, while the area of moderate-value regions increased by 0.56%. The trends in changes between different levels of carbon storage in slightly undulating areas continued until 2020. In gently undulating areas, changes between varying levels of carbon storage from 2000 to 2010 were even more minor compared to slightly undulating areas, primarily characterized by a slight decrease in the areas of high-value and moderately high-value regions and a slight increase in moderately low-value and moderate-value areas. In 2020, changes between different levels of carbon storage in gently undulating areas showed slight differences compared to previous trends, mainly with a slight increase in the area of moderately high-value regions, increasing by 0.01%. Changes between different levels of carbon storage in moderately undulating areas remained relatively stable throughout the 20 years. In summary, changes between varying levels of carbon storage value zones were primarily concentrated in flat and slightly undulating areas, closely associated with converting cultivated lands and forests to built-up lands in these two regions.
4 Discussion
4.1 Response of carbon storage to land use changes
Enhancing ecosystem carbon sink capacity to address global climate change and achieve carbon neutrality and peak targets has garnered widespread attention. A comprehensive and scientific assessment of ecosystem carbon sequestration capacity is crucial to realizing these dual carbon goals. Research indicates that between 2000 and 2020, the land use changes in the CZTUA primarily involved an increasing trend in built-up lands and water, accompanied by a continuous decrease in other land types. Urban expansion is often accompanied by significant rural-to-urban migration and the outward shift of industrial land toward city outskirts. Population density and GDP concentration increases can lead to various ecological and environmental issues. According to official projections, the urbanization rate in the CZTUA is expected to reach 80% by 2025, presenting both opportunities and challenges for the region’s efforts to achieve carbon peaking and carbon neutrality goals (Jiang et al., 2017). From the perspective of topographic reliefs, topographic reliefs significantly impact the distribution of various land classes. Over 2 decades of rapid urban development, the ecosystem’s carbon storage gradually decreased due to continuous land use changes. Analyzing from the perspective of topographic reliefs, the distribution of carbon storage exhibits significant topographical differentiation across different undulation levels. Addressing carbon loss resulting from land use changes in the research area underscores the importance of formulating scientifically sound and low-carbon sustainable development strategies (Wang T. et al., 2022).
4.2 Ecological restoration recommendations
Against the backdrop of ecological civilization construction and green development principles, harmonizing the relationship between urban development and environmental conservation is an urgent task. Therefore, in future territorial spatial planning, the CZTUA should strictly delimit urban development boundaries, with urban development transitioning from outward expansion to inward development. Given the solid industrial foundation of the CZTUA, the capacity of infrastructure and public services is enhanced to increase population carrying capacity (Wu and Wang, 2023). In regions with significant topographic reliefs, such as eastern and western Changsha, central and southern Zhuzhou, and northwestern Xiangtan, where ecological fragility is prominent, population distribution should be guided toward nearby industrial zones to establish an urban system aligned with the region’s comprehensive resource and environmental carrying capacity. Red lines for ecological protection should be strictly observed within the environmental space to safeguard ecosystem service functions. As forests constitute the most extensive land class with the most substantial carbon sink effect in the study area, further strengthening ecological engineering construction, especially for ecologically fragile zones with gentle and medium undulations, such as eastern Changsha and southern Zhuzhou, is necessary to enhance carbon sink capacity. Given the climate regulation function of wetlands, continuous improvement of urban wetland network construction and reinforcement of internal ecological corridors and ecological nodes are essential. For example, the Xiangjiang River, which serves as a critical water source for the central districts of the three cities, requires strengthened soil and water conservation measures. Within the agricultural space, strict implementation of cropland protection policies, restoration of small habitat patches such as ponds and ditches, and orderly guidance of rural settlements in areas with gentle and medium undulations towards flat areas for consolidation and concentration to provide livable and low-carbon production and living environments are recommended. Additionally, deepening cooperation among cities in the CZTUA to enhance the efficiency of green innovation and promote the deep integration of production circles, living circles, and ecological circles is essential.
4.3 Limitations and prospects
The study conducted a precise assessment of ecosystem carbon storage in the research area using the InVEST model, but it still has certain limitations. The carbon density data used in the research employed neighboring regions and are influenced by environmental factors such as temperature and precipitation, leading to changes in carbon density. Moreover, fixed carbon density data were used in the study without considering interannual variations in carbon density (Li et al., 2022a; Zhao et al., 2019). The changes in carbon storage mainly result from the transfer between different land types. Therefore, if actual carbon density change data were available, the assessment results would be more accurate. The analysis of land use changes and carbon storage distribution patterns from the perspective of topographic reliefs demonstrates novelty; however, terrain morphology is influenced not only by topographic reliefs but also by factors such as altitude and slope. Thus, future research should focus on incorporating factors such as altitude and slope into careful consideration.
5 Conclusion
The study focused on the Changsha-Zhuzhou-Xiangtan urban agglomeration and analyzed the spatiotemporal land-use changes across different topographic reliefs. It also examined the distribution pattern of carbon storage in the research area between 2000 and 2020 from the perspective of topographic reliefs. The conclusions are as follows:
The optimal analysis window for topographic reliefs in the study area was 17 × 17, with an area of 0.26 km2. The topographic relief range in the region varied from 0 to 600 m, with an average topographic relief of 78.58 m.
Between 2000 and 2020, land use changes in the CZTUA were characterized primarily by a reduction in cultivated land and forest land and an increase in built-up land. Cultivated land and forest land decreased by 592.27 km2 and 421.5 km2, respectively, while the built-up land area increased by 982.36 km2. Topographic reliefs had a considerable influence on the distribution of various land types, with cultivated land, water, and the built-up regions mainly distributed in flat areas and areas with slight undulations, while forest land predominantly occupied areas with slight undulations and gentle undulations and grassland primarily occupied areas with gentle undulations and moderate undulations.
Between 2000 and 2020, carbon storage in the study area showed a gradually decreasing trend, with carbon storage volumes of 96.91 × 10⁷t, 96.20 × 10⁷t, and 95.57 × 10⁷t in the three periods, representing a total decrease of 13.37 × 10⁶t. The reduction in carbon storage was observed mainly in cultivated land, forest land, and grassland. At the same time, an increase was noted in built-up lands and water.
The spatial distribution of carbon storage is greatly influenced by the topographical relief. The distribution of carbon storage across topographic reliefs exhibited certain regularities, with moderately low-value and moderate-value carbon storage concentrations observed in flat areas and areas with slight undulations. In comparison, moderately high-value and high-value carbon storage concentrations were concentrated in areas with gentle and moderate undulations.
Data availability statement
The original contributions presented in the study are included in the article/supplementary material, further inquiries can be directed to the corresponding authors.
Author contributions
YM: Conceptualization, Data curation, Investigation, Methodology, Software, Writing–original draft, Writing–review and editing. SL: Formal Analysis, Funding acquisition, Investigation, Methodology, Project administration, Writing–review and editing. BW: Formal Analysis, Funding acquisition, Project administration, Resources, Supervision, Validation, Visualization, Writing–review and editing.
Funding
The author(s) declare that financial support was received for the research, authorship, and/or publication of this article. This research was funded by the Hunan Provincial Natural Science Foundation of China (Grant No. 2023JJ50126), and the Key scientific research projects funded by Hunan Provincial Department of Education (No.22A0309).
Conflict of interest
The authors declare that the research was conducted in the absence of any commercial or financial relationships that could be construed as a potential conflict of interest.
Publisher’s note
All claims expressed in this article are solely those of the authors and do not necessarily represent those of their affiliated organizations, or those of the publisher, the editors and the reviewers. Any product that may be evaluated in this article, or claim that may be made by its manufacturer, is not guaranteed or endorsed by the publisher.
References
Adelisardou, F., Zhao, W., Chow, R., Mederly, P., Minkina, T., and Schou, J. S. (2022). Spatiotemporal change detection of carbon storage and sequestration in an arid ecosystem by integrating Google Earth Engine and InVEST (the Jiroft plain, Iran). Int. J. Environ. Sci. Technol. 19, 5929–5944. doi:10.1007/s13762-021-03676-6
Cantarello, E., Newton, A. C., and Hill, R. A. (2011). Potential effects of future land-use change on regional carbon stocks in the UK. Environ. Sci. and Policy 14, 40–52. doi:10.1016/j.envsci.2010.10.001
Cao, L., Kong, F., and Xu, C. (2022). Exploring ecosystem carbon storage change and scenario simulation in the Qiantang River source region of China. Sci. Prog. 105, 00368504221113186. doi:10.1177/00368504221113186
Chen, X., Bi, R., Liu, Z., Ding, Y., and Zhang, X. (2016). Analytical study of the relief amplitude in Shanxi Province based on ASTER GDEM data. J. Shanxi Agric. Univ. Nat. Sci. Ed 36 (6), 417–421. doi:10.13842/j.cnki.issn1671-8151.2016.06.008
Deng, Y., Jiang, W., Wu, Z., Peng, K., Ling, Z., Li, Z., et al. (2022). Assessing and characterizing carbon storage in wetlands of the guangdong–Hong Kong–Macau greater bay area, China, during 1995–2020. IEEE J. Sel. Top. Appl. Earth Observations Remote Sens. 15, 6110–6120. doi:10.1109/JSTARS.2022.3192267
Du, X., and Huang, Z. (2017). Ecological and environmental effects of land use change in rapid urbanization: the case of hangzhou, China. Ecol. Indic. 81, 243–251. doi:10.1016/j.ecolind.2017.05.040
Fang, H., Ji, B., Deng, X., Ying, J., Zhou, G., Shi, Y., et al. (2018). Effects of topographic factors and aboveground vegetation carbon stocks on soil organic carbon in Moso bamboo forests. Plant Soil 433, 363–376. doi:10.1007/s11104-018-3847-7
Fu, Q., Xu, L., Zheng, H., and Chen, J. (2019). Spatiotemporal dynamics of carbon storage in response to urbanization: a case study in the su-xi-chang region, China. Processes 7, 836. doi:10.3390/pr7110836
Gao, J., and Wang, L. (2019). Embedding spatiotemporal changes in carbon storage into urban agglomeration ecosystem management — a case study of the Yangtze River Delta, China. J. Clean. Prod. 237, 117764. doi:10.1016/j.jclep.ro.2019.117764
Gong, W., Duan, X., Mao, M., Hu, J., Sun, Y., Wu, G., et al. (2022). Assessing the impact of land use and changes in land cover related to carbon storage by linking trajectory analysis and InVEST models in the Nandu River Basin on Hainan Island in China. Front. Environ. Sci. 10. doi:10.3389/fenvs.2022.1038752
He, C., Zhang, D., Huang, Q., and Zhao, Y. (2016). Assessing the potential impacts of urban expansion on regional carbon storage by linking the LUSD-urban and InVEST models. Environ. Model. and Softw. 75, 44–58. doi:10.1016/j.envsoft.2015.09.015
He, Y., Ma, J., Zhang, C., and Yang, H. (2023). Spatio-Temporal evolution and prediction of carbon storage in guilin based on FLUS and InVEST models. Remote Sens. 15, 1445. doi:10.3390/rs15051445
Hui, Y., Yong, L., Shaoquan, L., Yong, W., Yong, Y., and Weidong, L. (2015). The influences of topographic relief on spatial distribution of mountain settlements in Three Gorges Area. Environ. Earth Sci. 74, 4335–4344. doi:10.1007/s12665-015-4443-2
Jiang, W., Deng, Y., Tang, Z., Lei, X., and Chen, Z. (2017). Modelling the potential impacts of urban ecosystem changes on carbon storage under different scenarios by linking the CLUE-S and the InVEST models. Ecol. Model. 345, 30–40. doi:10.1016/j.ecolmodel.2016.12.002
Li, C., Zhao, J., Thinh, N. X., and Xi, Y. (2018). Assessment of the effects of urban expansion on terrestrial carbon storage: a case study in xuzhou city, China. Sustainability 10, 647. doi:10.3390/su1003.0647
Li, J., Guo, X., Chuai, X., Xie, F., Yang, F., Gao, R., et al. (2021). Reexamine China’s terrestrial ecosystem carbon balance under land use-type and climate change. Land Use Policy 102, 105275. doi:10.1016/j.landusepol.2020.105275
Li, L., Ji, G., Li, Q., Zhang, J., Gao, H., Jia, M., et al. (2023). Spatiotemporal evolution and prediction of ecosystem carbon storage in the yiluo river basin based on the PLUS-InVEST model. Forests 14, 2442. doi:10.3390/f14122442
Li, L., Song, Y., Wei, X., and Dong, J. (2020). Exploring the impacts of urban growth on carbon storage under integrated spatial regulation: a case study of Wuhan, China. Ecol. Indic. 111, 106064. doi:10.1016/j.ecolind.2020.106064
Li, X., Huang, C., Jin, H., Han, Y., Kang, S., Liu, J., et al. (2022a). Spatio-Temporal patterns of carbon storage derived using the InVEST model in heilongjiang province, northeast China. Front. Earth Sci. 10. doi:10.3389/feart.2022.846456
Lin, T., Wu, D., Yang, M., Ma, P., Liu, Y., Liu, F., et al. (2022a). Evolution and simulation of terrestrial ecosystem carbon storage and sustainability assessment in karst areas: a case study of guizhou province. Int. J. Environ. Res. Public Health 19, 16219. doi:10.3390/ijerph.192316219
Lin, T., Yang, M., Wu, D., Liu, F., Yang, J., and Wang, Y. (2022b). Spatial correlation and prediction of land use carbon storage based on the InVEST-PLUS-model A case study in Guangdong Province. China. Environ. Sci. 42 (10), 4827–4839. doi:10.19674/j.cnki.issn1000-6923.2022.0172
Meena, V. S., Ghosh, B. N., Singh, R. J., Bhattacharyya, R., Sharma, N. K., Alam, N. M., et al. (2021). Land use types and topographic position affect soil aggregation and carbon management in the mountain agro-ecosystems of the Indian Himalayas. Land Degrad. and Dev. 32, 3992–4003. doi:10.1002/ldr.3864
Mi, Y., Li, T., Wu, B., and Zhao, Y. (2023). Spatio-temporal evolution and prediction of carbon storage in Chang-Zhu-Tan 3+5 urban agglomeration based on optimization simulation. J. Environ. Eng. Technol. 13 (5), 1740–1751. doi:10.12153/j.issn.1674-991X.202.21291
Musafiri, C. M., Macharia, J. M., Kiboi, M. N., Ng’etich, O. K., Shisanya, C. A., Okeyo, J. M., et al. (2021). Comparison between observed and DeNitrification-DeComposition model-based nitrous oxide fluxes and maize yields under selected soil fertility management technologies in Kenya. Plant Soil 463, 395–413. doi:10.1007/s11104-021-04924-x
Ouyang, X., Tang, L., Wei, X., and Li, Y. (2021). Spatial interaction between urbanization and ecosystem services in Chinese urban agglomerations. Land Use Policy 109, 105587. doi:10.1016/j.landusepol.2021.105587
Ouyang, X., Wang, K., and Wei, X. (2022). Impacts of urban-rural construction land linkages on eco-system services: a case study of Dongting Lake area. Acta Ecol. Sin. 42 (21), 8713–8722. doi:10.5846/stxb202110182937
Shi, Z., Ma, L., Zhang, W., and Gong, M. (2022). Differentiation and correlation of spatial pattern and multifunction in rural settlements considering topographic gradients: evidence from Loess Hilly Region, China. J. Environ. Manag. 315, 115127. doi:10.1016/j.jenvman.2022.115127
Sun, T., Ma, Z., Huang, Z., Wang, Z., and Chen, S. (2023). Coastal ecosystem restoration strategy based on carbon storage change: a case study of the south-east coastal zone of hainan Island. Trop. Geogr. 43 (3), 443–458. doi:10.13284/j.cnki.rddl.003643
Tan, K. P., Kanniah, K. D., and Cracknell, A. P. (2012). A review of remote sensing based productivity models and their suitability for studying oil palm productivity in tropical regions. Prog. Phys. Geogr. Earth Environ. 36, 655–679. doi:10.1177/0309133312452187
Tang, L., Wei, X., and Li, Y. (2021). Spatial interaction between urbanization and ecosystem services in Chinese urban agglomerations. Land Use Policy 109, 105587. doi:10.1016/j.landusepol.2021.105587
Wang, C., Luo, J., Qing, F., Tang, Y., and Wang, Y. (2022). Analysis of the driving force of spatial and temporal differentiation of carbon storage in taihang mountains based on InVEST model. Appl. Sci. 12, 10662. doi:10.3390/app.122010662
Wang, R.-Y., Mo, X., Ji, H., Zhu, Z., Wang, Y.-S., Bao, Z., et al. (2024). Comparison of the CASA and InVEST models’ effects for estimating spatiotemporal differences in carbon storage of green spaces in megacities. Sci. Rep. 14, 5456. doi:10.1038/s41598-024-55858-0
Wang, T., Gong, Z., and Deng, Y. (2022). Identification of priority areas for improving quality and efficiency of vegetation carbon sinks in Shaanxi province based on land use change. J. Nat. Resour. 37 (05), 1214–1232. doi:10.31497/zrzyxb.20220508
Wang, Y., Wang, Y., and Duan, X. (2024). Ecological and economic influencing factors on the spatial and temporal evolution of carbon balance zoning in the Taihu Basin. Front. Ecol. Evol. 11. doi:10.3389/fevo.2023.1230919
Wu, F., and Wang, Z. (2023). Assessing the impact of urban land expansion on ecosystem carbon storage: a case study of the Changzhutan metropolitan area, China. Ecol. Indic. 154, 110688. doi:10.1016/j.ecolind.2023.110688
Wu, X., Shen, C., Shi, L., Wan, Y., Ding, J., and Wen, Q. (2024). Spatio-temporal evolution characteristics and simulation prediction of carbon storage: a case study in Sanjiangyuan Area, China. Ecol. Inf. 80, 102485. doi:10.1016/j.eco.inf.2024.102485
Xu, L., He, N., and Yu, G. (2019). A dataset of carbon density in Chinese terrestrial ecosystems (2010s). China Sci. Data 4. doi:10.11922/csdata.2018.0026.zh
Xu, X., and Dong, J. (2023). Assessing the effects of topographic gradients on landscape patterns: the study case of Tingjiang river basin, China. Heliyon 9, e17619. doi:10.1016/j.heliyon.2023.e17619
Yang, Z., Hong, Y., Guo, Q., Yu, X., and Zhao, M. (2022). The impact of topographic relief on population and economy in the southern anhui mountainous area, China. Sustainability 14, 14332. doi:10.3390/su142114332
Yue, S., Ji, G., Chen, W., Huang, J., Guo, Y., and Cheng, M. (2023). Spatial and temporal variability characteristics of future carbon stocks in anhui province under different SSP scenarios based on PLUS and InVEST models. Land 12, 1668. doi:10.3390/land12091668
Zhang, J., Zhu, W., Zhao, F., Zhu, L., Li, M., Zhu, M., et al. (2018). Spatial variations of terrain and their impacts on landscape patterns in the transition zone from mountains to plains: a case study of Qihe River Basin in the Taihang Mountains. Sci. China Earth Sci. 48 (4), 450–461. doi:10.1007/s11430-016-9158-2
Zhao, M., He, Z., Du, J., Chen, L., Lin, P., and Fang, S. (2019). Assessing the effects of ecological engineering on carbon storage by linking the CA-Markov and InVEST models. Ecol. Indic. 98, 29–38. doi:10.1016/j.ecolind.2018.10.052
Zhao, M., Yue, T., Zhao, N., Sun, X., and Zhang, X. (2014). Combining LPJ-GUESS and HASM to simulate the spatial distribution of forest vegetation carbon stock in China. J. Geogr. Sci. 24, 249–268. doi:10.1007/s11442-014-1086-2
Zhao, Y. L., Li, X. B., and Zhang, Y. (2017). Technology and application of mountainous area divisions in Qian-Gui Karst areas. J. Geo-information Sci. 19 (7), 934–940. doi:10.3724/SP.J.1047.2017.00934
Zhao, Z., Liu, G., Mou, N., Xie, Y., Xu, Z., and Li, Y. (2018). Assessment of carbon storage and its influencing factors in qinghai-tibet plateau. Sustainability 10, 1864. doi:10.3390/su10061864
Keywords: topographic relief, InVEST model, land-use change, carbon storage, Chang-Zhu-Tan urban agglomeration
Citation: Mi Y, Li S and Wu B (2024) Study on the variation of carbon storage in the Chang-Zhu-Tan urban agglomeration in China based on topographic relief. Front. Environ. Sci. 12:1481540. doi: 10.3389/fenvs.2024.1481540
Received: 16 August 2024; Accepted: 28 November 2024;
Published: 17 December 2024.
Edited by:
Salvador García-Ayllón Veintimilla, Polytechnic University of Cartagena, SpainReviewed by:
Wenfeng Gong, Hainan University, ChinaYang Yang, Beijing University of Technology, China
Copyright © 2024 Mi, Li and Wu. This is an open-access article distributed under the terms of the Creative Commons Attribution License (CC BY). The use, distribution or reproduction in other forums is permitted, provided the original author(s) and the copyright owner(s) are credited and that the original publication in this journal is cited, in accordance with accepted academic practice. No use, distribution or reproduction is permitted which does not comply with these terms.
*Correspondence: Yi Mi, MzA2OTcxOTYxNUBxcS5jb20=; Sheng Li, c2hlbmdsaUB1c2MuZWR1LmNu
 Yi Mi
Yi Mi Sheng Li*