 Yangyulong Wu
94% of researchers rate our articles as excellent or good
Learn more about the work of our research integrity team to safeguard the quality of each article we publish.
Find out more
ORIGINAL RESEARCH article
Front. Environ. Sci., 18 October 2024
Sec. Environmental Economics and Management
Volume 12 - 2024 | https://doi.org/10.3389/fenvs.2024.1476141
This article is part of the Research TopicEnvironmental Economics and Low-Carbon TransitionView all articles
Investigating the relationship between green finance (GF), government environmental governance (GEG), and green economic efficiency (GEE) is essential for developing sustainable development policies. This study uses panel data from 30 provincial administrative regions in China, covering the period from 2011 to 2021, to assess the effects of GF and GEG on GEE through the Spatial Durbin Model. The findings reveal several key points. First, most provinces are in low-low spatial clusters in terms of GEE, though there is a gradual improvement over time. Second, GF significantly enhances GEE, while GEG has a notable inhibitory effect. Third, GF exhibits a positive spatial spillover effect on the GEE of neighboring regions, whereas GEG shows a negative spatial spillover effect. Fourth, these spillover effects are mainly observed in the eastern regions, with little significance in the central and western areas. Moreover, one of the GEG indicators, environmental regulation, demonstrates a positive spatial spillover effect in the eastern region, contrary to the overall negative national trend. In general, this paper examines the interplay among the three variables within a unified analytical framework, filling the gaps in existing research. Furthermore, the paper delineates GEG into environmental regulation and environmental investment, which is a dimension frequently neglected in current research.
Since the reform and opening up in 1978, China has made remarkable advancements in its economic development. According to statistics released by China’s National Bureau of Statistics, the country’s per capita Gross Domestic Product (GDP) surged from 385 yuan in 1978 to 89,358 yuan in 2023, reflecting an average annual growth rate of 12.9%. Despite the economic expansion, the ecological environment has gradually declined. A report from the Ministry of Ecology and Environment of China indicates that sulfur dioxide emissions soared to 2.435 million tons in 2022. Clearly, this economic miracle has come with significant environmental costs. The Chinese government once prioritized economic growth almost to the exclusion of environmental protection. To address this, in September 2009, the government implemented a green development strategy to tackle environmental pollution and facilitate the transition towards a green economy (GE) (Falcone, 2020). Concurrently, the government has strengthened its environmental governance. The annual report on China’s ecological environment statistics shows that national investment in environmental governance surged from 452.52 billion yuan in 2009 to 901.35 billion yuan in 2022. Moreover, as finance is crucial for supporting real industries, Green Finance (GF) acts as an “accelerator” in the transition from a traditional economy to a GE. Specifically, GF imposes stricter credit constraints on high-pollution and high-energy-consuming corporations, encouraging them to invest in technological innovation and reduce pollutant emissions, thus GF has become one of the essential policy tools for promoting green transformation and strengthening environmental governance (Gao et al., 2024b; Lee, 2020; Rasoulinezhad and Taghizadeh-Hesary, 2022; Wang L. et al., 2022).
The concept of GE can be defined as a novel economic development model that emphasizes advanced technology, minimizes environmental harm, and sustains economic growth (Georgeson et al., 2017; Jänicke, 2012). Moderate environmental regulation in government environmental governance (GEG) can incentivize innovation among enterprises, positively impacting the development of a GE. Additionally, GF can reinforce credit constraints of high-pollution and high-energy-consuming corporations, thus promoting the growth of a GE (Falcone, 2020; Lee, 2020; Naseer et al., 2022; Yao, 2021). However, due to differences in research methods and sample selection, existing studies on the nexus among GF, GEG, and the GE have not reached a unified consensus, and these studies only focus on the pairwise relationships between these variables. Meanwhile, existing studies simply summarize GEG as environmental regulation, while in fact, government environmental governance includes both environmental investment and environmental regulation (Wu et al., 2020).
Therefore, the marginal contributions of this paper are to study how GF and GEG jointly affect the GEE, putting them into a unified analytical framework, and subdivide GEG into two aspects: environmental investment and environmental regulation, and consider the spatial spillover effect of each variable simultaneously.
This paper utilizes panel data from 30 provincial administrative regions in mainland China (excluding Tibet) spanning from 2011 to 2021. It assesses the GE using the Slack-Based Measure (SBM) model incorporating undesired output to build the green economic efficiency (GEE) variable, evaluates GEG comprehensively, and establishes the GF index using the entropy method to gauge the development level of GF. The Spatial Dubin Model (SDM) is employed to examine the impact of GF and GEG on GEE, while also considering the spatial spillover effects of each variable. The extensive research samples and scientific rigor of the methods help accurately understand the relationships among the three variables, thus providing a reference for formulating GE development policies.
This paper is divided into six parts: introduction, literature review, theoretical basis and research hypothesis, research design, empirical analysis, and conclusions and discussions. The introduction summarizes the background and significance of this study. The literature review examines the relevant literature on the three variables involved. The theoretical basis and research hypothesis section elaborates theoretical foundations and research hypotheses of this study. The research design section discusses the selection criteria for each variable and the construction of models. The empirical analysis part describes the model outcomes and interprets those findings. Finally, the conclusions and discussions section describes the research conclusions, offers relevant policy recommendations, and discusses possible research deficiencies.
GEE is defined as the overall economic efficiency of an economic system in generating more economic output while incurring fewer environmental costs (Wang et al., 2019; Zhao et al., 2020). Improving the GEE is a process led by the GEG and requires multi-body participation, particularly the role of GF in promoting the transformation towards GE (Bennett and Satterfield, 2018; Falcone, 2020; Wu et al., 2020).
Research on the impact of GF on the GE mainly focuses on high-quality development, reducing pollutant emissions, and transitioning to a GE. These indicators are directly associated with GEE (Wang et al., 2019; Zhao et al., 2020). First, GF notably boosts high-quality economic development in the short term, with technological innovation playing a partial intermediary role, but over the long term, GF does not have such a positive influence on high-quality economic development (Liu et al., 2021; Wang R. et al., 2022). Then, in terms of reducing pollutant emissions, GF has significantly inhibited emissions from highly polluting enterprises by strengthening credit constraints on them (Rasoulinezhad and Taghizadeh-Hesary, 2022; Wang L. et al., 2022). Finally, for economic transformation, the development of GF can accelerate the transition process from a traditional economy to a GE (Falcone, 2020; Gao et al., 2024a). Additionally, the coordination between GF and the GE in China is barely satisfactory, with the overall coordination level exhibiting a high level of spatial dependence (Liu et al., 2020). Therefore, the GEE, as proposed in this paper, has a theoretical basis for being affected by GF. At the same time, a study has found that the coordination between GF and the GE in China is currently only marginally satisfactory. Thus, investigating the impact of GF on GEE is essential for improving the coordination between GF and the GE.
GEG mainly includes environmental investment (EI) and environmental regulation (ER) (Tang et al., 2018; Wu et al., 2020). Existing literature predominantly focuses on the influence of GEG on GEE through the lens of ER. The main research results are as follows: first, the Chinese government’s ER has an inverted “U” effect on GEE, meaning moderate ER can promote GEE, while too much or too little ER will inhibit GEE (Luo et al., 2021; Shuai and Fan, 2020). This inverted “U” effect is not limited to China; other regions, such as the European Union, also reflect this effect on GEE (Dzwigol et al., 2023). Second, there is notable regional variation in how ER influences GEE. For instance, in the national and eastern regions of China, ER affects GEE in an inverted “U” shape, while in the central and western regions, the impact is consistently negative (Shuai and Fan, 2020). A specific study focusing on detailed regions, such as the Beijing-Tianjin-Hebei area, reveals that the impact of ER on GEE mirrors the entire country’s trend, showing an inverted “U” shaped impact (Li B. et al., 2021). Thus, although the overall trend of ER’s impact on GEE is consistent, significant regional heterogeneity is observed. However, current research often simplifies GEG to the variable of ER, failing to comprehensively evaluate GEG.
Studies on the influence of GF on GEG are limited, but GF is increasingly being employed as a tool for environmental governance by the Chinese government. In terms of macro policy framework, the Chinese government issued “Green Credit Guidelines” in 2012, defining the governance logic of GF policy (Li et al., 2022; Wang X. et al., 2022). Regarding micro policy implementation, the government can fund green projects through direct budget allocation and provide financing channels for GF (Rasoulinezhad and Taghizadeh-Hesary, 2022). Specifically, GF led by the Chinese government incentivizes short-term financing behaviors of high-pollution and high-energy-consuming corporations, but in the long term, it significantly inhibits their investment behaviors, with a heterogeneous impact on different types of corporations (Gao et al., 2024c; Wang X. et al., 2022; Zhang et al., 2021). Clearly, GF has become a crucial supplementary tool for the Chinese government in environmental governance.
Based on the above literature, it can be concluded that regarding the relationship among GF, GEG, and GEE, existing research primarily analyzes the relationship between two out of the three variables, with few studies considering all three together. Since GF, GEG, and GEE are interrelated, it is important for the Chinese government to analyze how GF and GEG jointly affect GEE. Moreover, existing research often evaluates GEG solely from the perspective of ER. Therefore, this study uses both EI and ER to comprehensively evaluate GEG.
The key point of Porter hypothesis is that moderate GEG can be seen as an “innovation incentive” for enterprises, encouraging them to seek more environmentally friendly and efficient production technologies, thereby improving resource utilization efficiency and creating new business opportunities (Porter and van der Linde, 1995). Although meeting environmental standards may incur additional costs in the short term, in the long run, this stimulus will encourage companies to engage in technological innovation, develop new products, or enter new markets, thereby enhancing their competitiveness.
Under the theoretical framework of Porter hypothesis, the development of GF has become a bridge connecting GEG and corporate innovation. GF can provide funding for enterprises to invest in green technology research and development (R&D) (Shi et al., 2022). The green upgrade of technology will enable them to meet environmental requirements and further gain competitive advantages. GF can not only help businesses address environmental challenges, but also complement other green development policies of the government, forming a virtuous cycle that encourages green innovation and investment.
The Porter hypothesis provides theoretical support for GF, emphasizing the positive relationship between environmental policies and corporate innovation. In such a framework, GF is seen as a key medium for promoting enterprises to adapt to GEG and achieve green and sustainable economic growth.
The Environmental Kuznets Curve (EKC) is a theoretical model used in economics to describe the relationship between economic development and environmental pollution. The EKC suggests that in the process of economic development in a country or region, environmental pollution will first increase with economic growth. But after reaching a certain turning point, with further economic development, environmental pollution will begin to decline, and this relationship presents an inverted “U” shaped curve (Kaika and Zervas, 2013).
The EKC curve provides an important theoretical reference for the development of GF. On the one hand, GF can be seen as a tool to help economies reach or reduce the inverted U-shaped peak of EKC earlier, by providing funding for clean technology research and environmental protection projects, thereby reducing environmental pressures faced in economic growth (Bakry et al., 2023). On the other hand, the EKC curve provides a guide for financial institutions to recognize that as the economy develops, environmental risks may gradually evolve into important financial risks (Alola and Ozturk, 2021). GF products can therefore be designed to respond to these risks, providing protection for investors and lending institutions. All of these contribute to the improvement of GEE (Sun et al., 2021).
In economics, externalities refer to the effects of economic behavior on the public that are not reflected in market prices. Specifically, they can be divided into positive externalities that have a beneficial impact on the public and do not require repayment, and negative externalities that have an adverse impact on the public and do not require payment (Tisdell, 1970).
While economic growth leads to an increase in GDP, it often also causes environmental pollution, such as the discharge of wastewater, exhaust gas, and soot. The emissions of these pollutants often bring negative externalities, causing harm to the public while no one pays for the pollution (Zhao et al., 2017). Therefore, there are two aspects worth considering. Firstly, the government needs to carry out environmental governance to weaken the negative externalities caused by pollution, such as investing in environmental protection, strengthening environmental regulations, or levying Pigouvian taxes (Andrew, 2008). Obviously, the theory of externalities provides theoretical support for GEG. Secondly, the concept of GEE needs to be introduced to comprehensively measure economic efficiency by combining inputs, desired outputs, and undesired outputs (Zhao et al., 2020). When considering economic growth, pollution issues should also be considered. Clearly, the externality theory also provides the basis for GEE.
To further refine the theoretical framework of the research, the following research hypotheses are proposed in this paper.
Hypothesis 1:. The development of GF will promote GEE.
GF is an important lever for reducing pollutant emissions and improving GEE. The purpose of GF is to provide green loans to enterprises, support their green development, and facilitate green projects. On one hand, GF can promote technological transformation and drive the advancement of green technologies (Duchêne, 2020). On the other hand, GF facilitates the improvement of industrial structures and safeguards the development of environmentally friendly industries (Ozili, 2022). Additionally, since production factors are fixed, the inflow of financial resources into green industries will result in reductions in the production factors available to traditional “non-green” industries (Afzal et al., 2022). These mechanisms are all directly related to GEE, and they all serve as positive mechanisms affecting GEE. Hence, this paper hypothesizes that the enhancement of GF will promote GEE.
Hypothesis 2:. GEG will affect GEE, and the sign of this impact depends on the intensity of intervention.
The Porter Hypothesis posits that moderate government intervention in the environment can promote technological innovation, thereby enhancing economic efficiency. However, excessive government environmental intervention can increase production costs for businesses and reduce their competitiveness, which is detrimental to the improvement of economic efficiency (Brännlund, 2009). The inverted U-shaped impact of ER on GEE presented in the literature review also partially corroborates this point (Luo et al., 2021; Shuai and Fan, 2020). Therefore, this paper hypothesizes that GEG will affect GEE, but the direction of the impact depends on the intensity of GEG.
Hypothesis 3:. The EI and ER within GEG will have heterogeneous impacts on GEE.
The existing research, as described in the literature review, has expounded the inverted U-shaped impact of ER on GEE (Luo et al., 2021; Shuai and Fan, 2020). Despite the absence of research on the impact of EI on GEE, EI affects indicators like pollutant emissions and economic profits that are directly related to GEE, with its impact showing an inverted U-shape for some and a direct positive or negative effect for others (Chen et al., 2024; Pekovic et al., 2018). Clearly, unlike the consistent impact of ER on GEE, there is no consensus on how EI affects GEE. Therefore, this study hypothesizes that there is heterogeneity in the impact of EI and ER on GEE.
Hypothesis 4:. A province’s GF will have a positive spillover effect on the GEE of neighboring provinces, while an unreasonable GEG will indirectly promote the GEE in neighboring provinces.
Finance is a fluid resource that not only affects the local area but also spills over to surrounding provinces. Due to the expansive nature of capital, GF, in order to expand its development, will invest in neighboring provinces, seeking more growth, and thus will generate spatial spillover effects (Kwilinski et al., 2023). Government intervention can also produce spillover effects. If a regional government intervenes excessively, it will cause the resources of that area to be squeezed out to neighboring areas where intervention is relatively lighter (Ezcurra and Rios, 2020; Li X. et al., 2021). Therefore, this paper hypothesizes that GF has a positive spatial spillover effect, and unreasonable GEG will also generate a positive spatial spillover effect.
Moving forward, this paper will focus on the theoretical foundations and these four hypotheses and conduct empirical research to comprehensively verify their validity.
This paper first examines the influence of GF and GEG on GEE by introducing a benchmark panel data regression model. Referring to the model constructions of existing studies, the following panel regression model is built (Duchêne, 2020; Sachs et al., 2019; Wu et al., 2020). See Formula 1.
In Formula 1,
GF and GEG not only impact local GEE but also have a spatial spillover effect on neighboring provinces’ GEE. Therefore, a spatial econometric model is formulated to investigate the spatial effects of GF and GEG on GEE.
First, the spatial correlation of the data needs to be assessed using the global Moran index and the local Moran index. The spatial econometric model can only be applied when the data exhibit significant spatial correlation. See Formulas 2, 3 respectively.
In Formulas 2, 3,
Moreover, the spatial econometric model must choose a suitable spatial weight matrix. The method usually used in studies is to calculate whether provinces are adjacent based on the longitude and latitude of different provinces, to obtain the adjacency matrix as the spatial weight matrix (Zeng, 2022). See Formula 4.
Finally, it is concluded that the spatial econometric model is applicable, and the spatial weight matrix mentioned above is chosen. The SDM is selected by conducting model selection tests, and this model is used to evaluate the spatial influence of GF and GEG on GEE. See Formula 5 for model construction.
Formula 5 includes the coefficient
Green Economic Efficiency (GEE). At present, SFA, DEA and SBM are mainly used to evaluate economic efficiency. Referring to the existing research methods, this study constructs a GEE index system based on labor input, capital input, energy input, undesired output and desired output, and uses the SBM model with undesired output to evaluate GEE (Zhao et al., 2020). The SBM model with undesired output was first proposed in 2004 to comprehensively measure economic efficiency by combining desired output and undesired output (Tone, 2004). See Formula 6 for the specific form of the model.
In Formula 6,
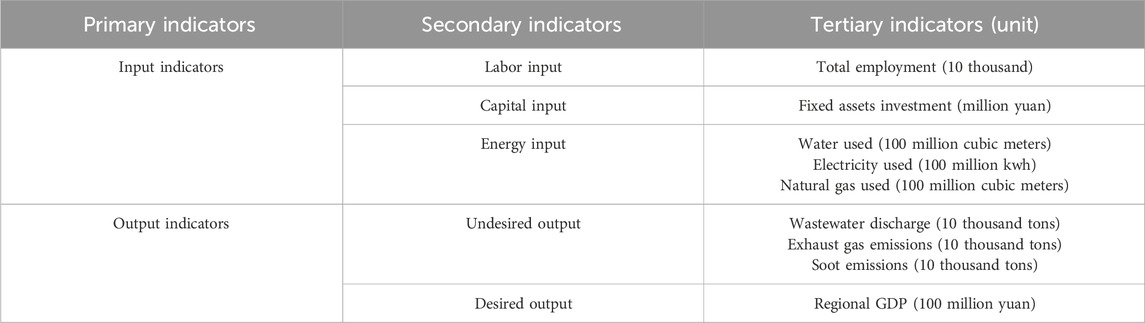
Table 1. Index system for GEE.
Green Finance (GF). Following the principles of integrity, scientific rigor, and data accessibility, and referring to existing studies, the GF index is formulated by incorporating four indicators: green investment, insurance, credit, and securities (Duchêne, 2020; Sachs et al., 2019). To mitigate subjective bias in evaluation, the entropy method, an objective evaluation approach, is employed to determine the weight of each indicator within the GF index (Zhao et al., 2022). See Formulas 7–11 for details.
Before using the entropy method, the data should be standardized to eliminate the influence of dimension.
Positive indicators:
Negative indicators:
In Formulas 7, 8,
Then, we need to calculate the weight of each indicator.
In Formula 9,
In Formula 10,
Finally, the level of development in GF can be determined. See Formula 11.
See Table 2 for specific index selection.
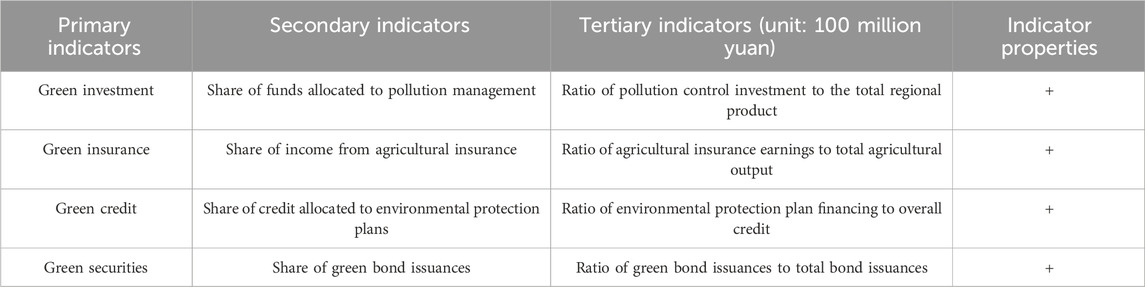
Table 2. GF index system.
Government Environmental Governance (GEG) involves two main aspects: government environmental investment (EI) and government environmental regulation (ER), both of which jointly constitute GEG (Wu et al., 2020). According to the index selection methodology proposed by Wu et al. (2020), government investment aimed at controlling industrial pollution is used to evaluate EI, while the frequency of keywords related to environmental governance in government work reports is used to assess ER. To mitigate the impact of data dimension on model estimation coefficients, EI and ER samples are normalized.
To address potential endogenous problems resulting from the exclusion of control variables, four variables are selected based on existing literature: urbanization rate (UR), opening (OP), industrial structure (IS), and green innovation (GI) (Naseer et al., 2022; Wang et al., 2019; Yao, 2021; Zhao et al., 2020). The urbanization rate is calculated by dividing the number of urban residents by the total population. Opening is measured by dividing the region’s total trade volume by its GDP. The industrial structure is defined as the ratio of the output value of the tertiary sector to that of the secondary sector. Green innovation is assessed using the efficiency of green innovation, determined by the SBM model, which includes undesired output.
This research utilizes panel data from 30 provincial administrative regions in mainland China (excluding Tibet) spanning from 2011 to 2021. Data on GEE is sourced from the China Environmental Statistics Yearbook, China Energy Statistics Yearbook, and China Statistical Yearbook. Data on GF are derived from the China Environmental Statistics Yearbook, China Insurance Yearbook, and China Statistical Yearbook. Information on GEG comes from the China Environmental Statistics Yearbook and provincial Government Work Reports. Control variable data are collected from the China Environmental Statistics Yearbook, China Science and Technology Statistics Yearbook, China Energy Statistics Yearbook, and China Statistical Yearbook. All the yearbooks mentioned are selected from 2012 to 2022. For missing data, linear interpolation has been used to complete the dataset.
Before analyzing, it’s crucial to understand the overall characteristics of the data through descriptive statistics. This helps to prevent data loss and avoid significant dimensional disparities, which could affect the regression coefficients and the significance of the results (see Table 3).
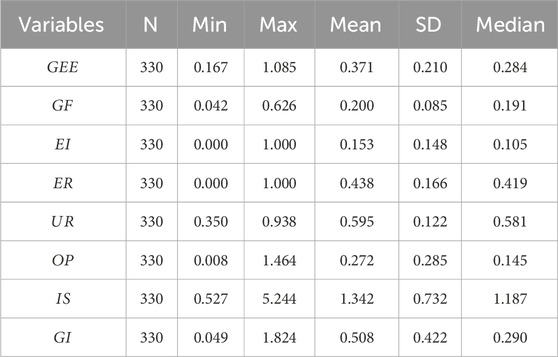
Table 3. Descriptive statistics.
In Table 3, the dimensional differences between each variable are minimal, the data concentration for each indicator is high, and there are no excessively large or small outliers. Additionally, the sample size for each variable is 330, with no missing data.
Before conducting regression analysis, it is necessary to analyze the correlation between various variables to avoid multicollinearity. The correlation coefficients between the dependent variable GEE, core explanatory variables GF, EI, ER, and control variables are calculated (see Table 4).
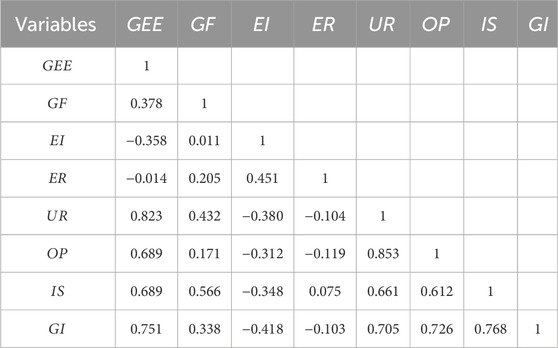
Table 4. Correlation coefficient matrix.
Table 4 shows that GF positively correlates with both the four control variables and GEE. In contrast, both EI and ER negatively correlate with GEE. Except for control variables, the correlations among the other variables are all below 0.5, indicating no issues with multicollinearity.
The panel data in this paper is a short panel, with an individual dimension of N = 30 and a time dimension of T = 11. Although the time dimension is relatively small, to enhance result robustness and avoid autocorrelation problems of disturbance items of the same individual in different periods, a clustering robust standard is used for estimation. To minimize discrepancies between estimation methods, both fixed effect (FE) and random effect (RE) models are employed (see Table 5).
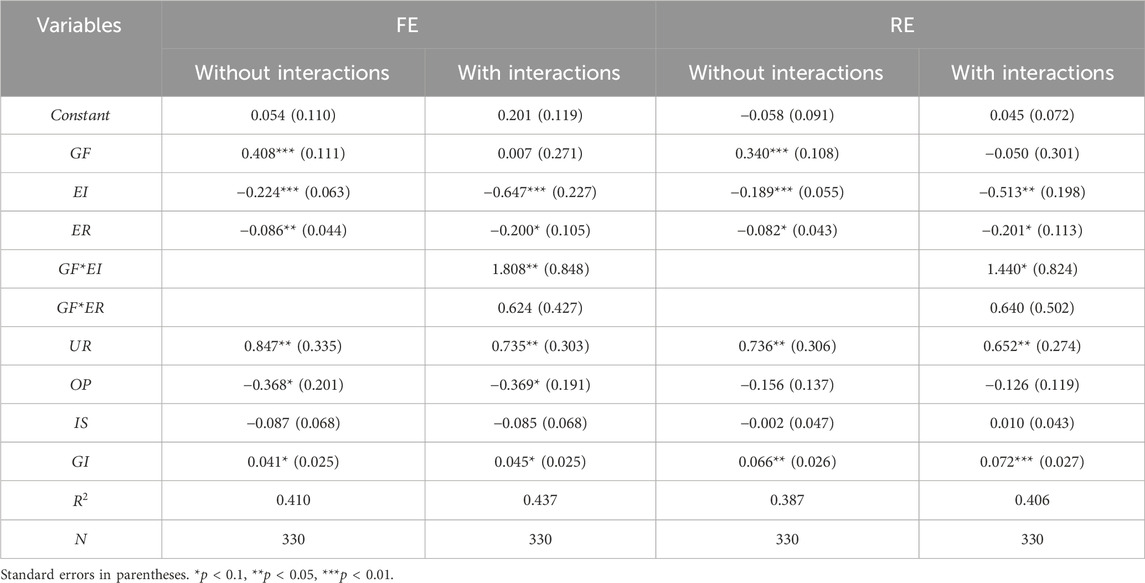
Table 5. Benchmark regression results.
As shown in Table 5, the size and significance levels of the estimated coefficients are roughly the same for both the fixed effect and random effect estimation methods, with no significant deviations due to different methods. The coefficients for GF are 0.408 and 0.340, respectively, both significant at the 1% level, indicating that the advancement of GF notably enhances GEE. This is because GF, being a limited financial resource, plays a crucial role in fostering the advancement of GEE. Green investment facilitated by GF has significantly propelled the growth of green enterprises. Green insurance and green securities within the green financial market help mitigate risks associated with green technological innovation by enterprises, fostering their technological advancement. The GF policy promotes the formation of environmental protection industries, gradually eliminating traditional industries with high pollution and high energy consumption, further stimulating the development of GEE.
The coefficients for EI are −0.224 and −0.189, respectively, both significant at the 1% level, suggesting that EI does not support the growth of GEE. This can be attributed to the government’s focus on post-treatment EI aimed at mitigating pollution effects from industrial enterprises. Such policies do not encourage these enterprises to enhance their production technologies or GEE. Instead, by addressing pollution effects through government investment, there is an implicit allowance for industrial pollution practices, significantly negatively impacting GEE.
Moreover, the estimated coefficients for ER are −0.086 and −0.082, significant at the 5% and 10% levels, respectively, indicating that the government’s ER has a minor adverse effect on GEE. This may be due to the “one size fits all” approach when the government intervenes in the economy using administrative means, unilaterally regulating all industrial enterprises that may cause pollution, thus inhibiting the ability for independent innovation in the market, resulting in a negative impact on GEE. This also aligns with current research conclusions that ER has an inverted “U” shaped impact on GEE, where moderate ER can promote the improvement of GEE, while excessive regulation may inhibit it (Luo et al., 2021; Shuai and Fan, 2020).
When the interaction terms are added, GF is no longer significant because adding interaction terms between explanatory variables implies multicollinearity, which weakens the significance of the coefficients. However, this does not affect the promoting effect of GF on GEE, as GF is significant without interaction terms. The coefficients for GF*EI are 1.808 and 1.440, significant at the levels of 5% and 10% respectively, but the coefficients for GF*ER are not significant. This indicates that the combined effect of GF and EI has a promoting effect on GEE, which may be due to the integration of GF into economic development. GF empowers high-tech industries, changing the characteristics of long R&D cycles and low returns of high-tech green enterprises in the past (Xiao et al., 2023). GF drives economic development while also protecting the ecological environment, achieving high-quality economic development. Local governments might have realized the role of GF and stimulated its development by increasing EI. GF is a form of financing, while EI is an investment. Investment, as a source of financing, can obviously promote financing and ultimately further enhance GEE (Bouchmel et al., 2024; Tong et al., 2022). However, ER does not have this characteristic, so the coefficients of its interaction terms with GF are not significant.
Overall, considering the two variables chosen for GEG, which are EI and ER, it is evident that GEG negatively impacts GEE. In contrast, GF significantly promotes GEE. Finally, the interaction between GF and EI also enhances GEE.
The conclusions from the benchmark regression validate Hypothesis 1, which states that the development of GF promotes GEE. Additionally, the above results partially confirm the correctness of Hypothesis 2 and Hypothesis 3, as reflected in the heterogeneous effects of the two components of GEG, EI and ER, on GEE. To comprehensively validate Hypothesis 2 and Hypothesis 3, as well as to test Hypothesis 4, the following analysis will be conducted using spatial effect analysis methods.
This paper employs the global Moran index to examine the overall spatial correlation among GF, EI, ER and GEE. The global Moran indexes of four variables are calculated by Stata software (see Table 6).
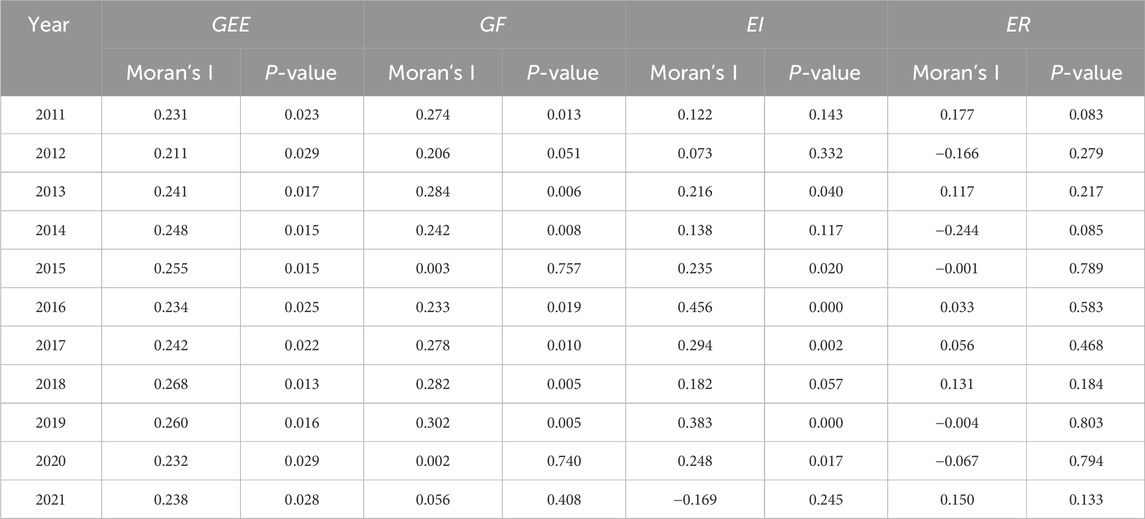
Table 6. Global Moran indexes.
As indicated in Table 6, the global Moran indexes for the dependent variable, GEE, are statistically significant at the 5% level across all years, indicating the presence of spatial correlation in GEE. For the independent variables, GF and EI show a significant regional correlation in most years, but the global Moran indexes of ER are not significant in most years. This is because most ERs belong to the national overall planning policy, and there is no obvious spatial correlation or spatial heterogeneity across the country.
Stata software is used to draw the local Moran scatter diagrams for 2011, 2016, and 2021, respectively, to explore the spatial clustering state of GEE of the provinces. The results are shown in Figure 1.
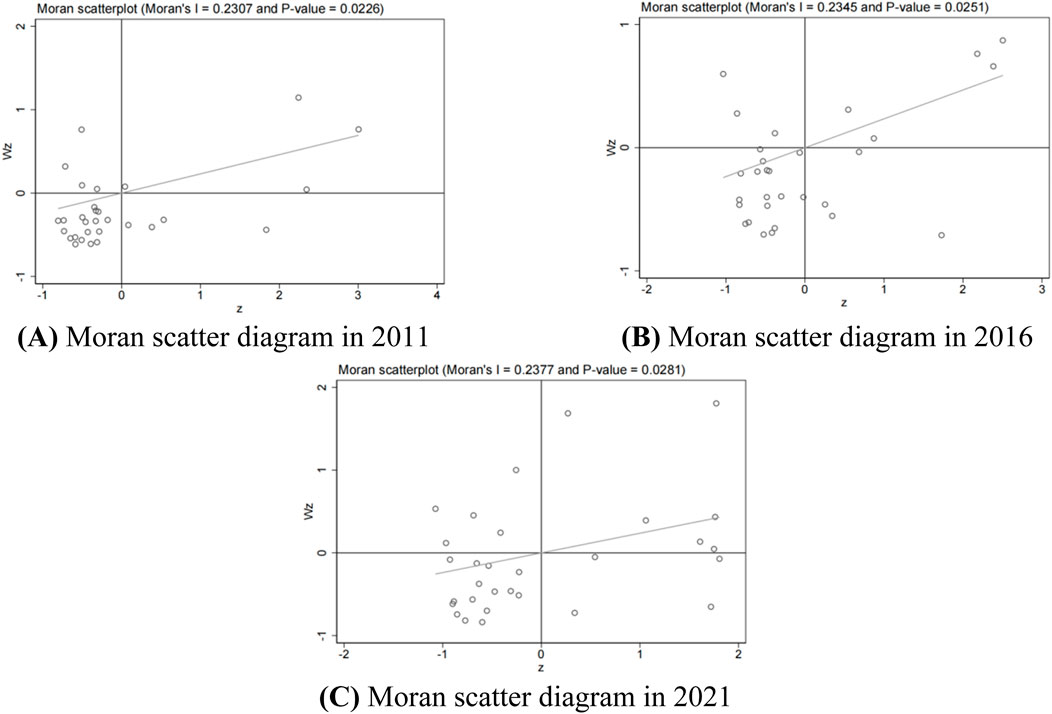
Figure 1. Moran scatter diagrams. (A) Moran scatter diagram in 2011 (B) Moran scatter diagram in 2016 (C) Moran scatter diagram in 2021.
By observing the Moran scatter diagrams for 2011, 2016, and 2021, it is found that the GEE of most provinces is in a “low-low” clustering state (LL). However, over time, more provinces gradually shift to a “high-high” clustering state (HH), and the number of provinces in the “low-low” clustering state (LL) gradually decreases. This indicates that over time, the GEE of each province and its surrounding provinces has gradually improved and made significant progress. Additionally, this local spatial analysis reveals significant spatial clustering of GEE for provinces from 2011 to 2021, with the majority falling within the first and third quadrants, indicating a significant positive spatial correlation.
To select the appropriate spatial econometric model, model tests were conducted on GEE, GF, EI, ER, and control variables. The Least Squares Mean Square (LM) test, Likelihood Ratio (LR) test, Wald test and Hausman test are performed respectively (see Table 7).
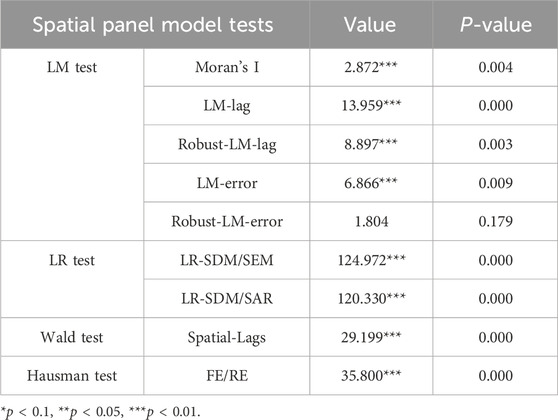
Table 7. Spatial econometric model tests.
The LM test finds that, except for “Robust-LM-error,” all other hypothesis tests reject the original hypothesis of “No Spatial Autocorrelation,” suggesting significant spatial autocorrelation. At the 1% significance level, the LR test rejects the original hypothesis, indicating that the SDM will not degenerate into a Spatial Autoregression Model (SAR) or Spatial Error Model (SEM), making SDM the most suitable choice. The Wald test shows that the spatial lag terms of the Dubin model are very significant, and it is suitable to use the Dubin model to measure the spatial spillover effect. The Hausman test result indicates that the SDM should be estimated using a fixed effect model. Hence, the SDM with fixed effects is chosen to estimate the influence of GF, EI, and ER on GEE. The spatial lag terms are computed according to the adjacency weight matrix (see Table 8).
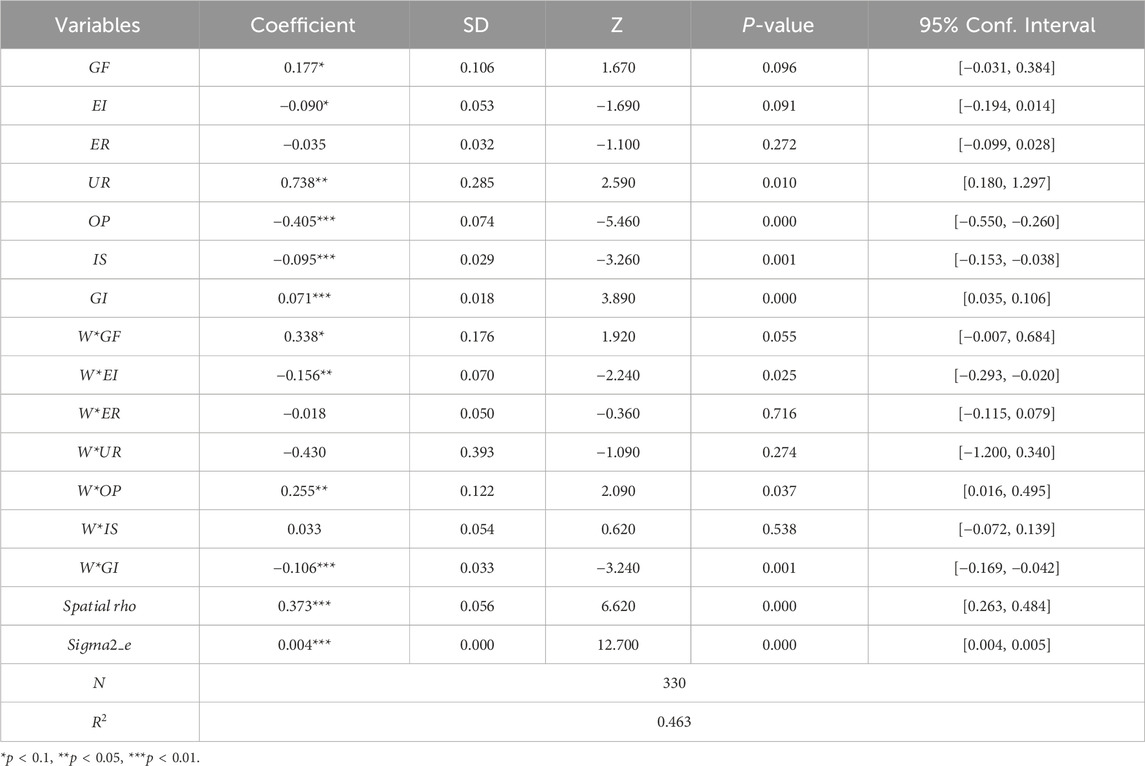
Table 8. SDM estimation results.
Table 8 indicates that the spatial lag coefficient (Spatial rho) for the GEE of 30 provinces is 0.373, significant at the 1% level. This suggests a notable spatial clustering effect in China’s provincial GEE, with a clear positive spatial spillover effect hinting at susceptibility to nearby influences. Additionally, the coefficient for GF is 0.177, significant at the 10% level, signifying that GF positively impacts GEE enhancement in the region. Conversely, the coefficient for EI is −0.09, also significant at the 10% level, indicating a slight negative influence of government EI on GEE. These findings closely align with the benchmark regression results. Moreover, ER is not significant, likely due to the central government in China formulating national unified policies for environmental governance, minimally affected by location factors (Bennett and Satterfield, 2018). Consequently, after introducing spatial relationships, the nationwide effect of ER is not obvious.
Regarding spatial spillover impacts, the regression coefficient of the spatial spillover effect of GF is 0.338, significant at the 10% level, indicating that GF not only promotes GEE in the region but also in adjacent regions, demonstrating a positive spillover effect. This is consistent with the progression from “low-low” (LL) to “high-high” (HH) described by Moran scatter diagrams. The significant spatial spillover effect coefficient of −0.156 for EI at the 5% level indicates that EI focused on post-pollution treatment not only impedes GEE in the region but also suppresses GEE in neighboring provinces, demonstrating a negative spillover effect. ER, another variable measuring GEG, does not exhibit a significant spatial spillover effect. These results show that GEG via EI and ER has either a negative or ineffective impact on adjacent areas in the spatial dimension. Thus, the government should reduce administrative intervention and promote GEE through market economic means. This aligns with the literature suggesting that government intervention in environmental protection should be minimized, respecting market mechanisms, and that only appropriate ER can promote GEE (Armitage et al., 2012; Luo et al., 2021; Shuai and Fan, 2020).
The results of the SDM fully validate Hypothesis 2, showing that GEG has a negative impact on local GEE while also causing some negative spatial spillover effects, which stem from the excessive government intervention commonly found in China (Luo et al., 2021; Shuai and Fan, 2020). Regarding Hypothesis 3, it has been confirmed that EI and ER have heterogeneous effects on GEE, not only in the benchmark regression but also in terms of their spatial spillover effects, which completely validates this hypothesis. Moreover, the first part of Hypothesis 4 has also been validated, indicating that GF generates positive spatial spillover effects. However, the second part of Hypothesis 4, which states that unreasonable GEG generates positive spatial spillover effects, has not been validated. At the national level, the estimated coefficients for the spatial spillover effects of the two components of GEG, EI and ER, are both negative. Therefore, it is necessary to conduct a regional heterogeneity analysis to explore whether there are specific areas where GEG may generate positive spatial spillover effects, thus supporting Hypothesis 4.
Due to variations in resource allocation and economic progress across regions, and to validate Hypothesis 4, it is crucial to examine the regional disparities in how GF, EI, and ER affect GEE. Using Stata software and the adjacency matrix, the 30 provincial administrative regions are classified into eastern, central, and western regions to analyze the region-specific impacts of GF, EI, and ER on GEE (see Table 9).
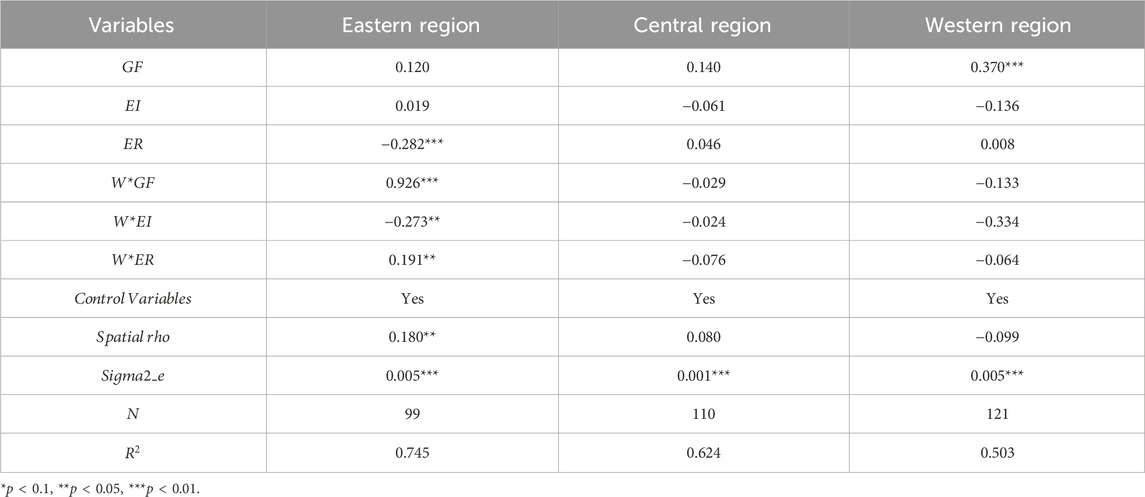
Table 9. Regional heterogeneity analysis result.
From Table 9, it is evident that the significance of the coefficients has decreased due to the smaller sample size after sample segmentation. Among them, only the spatial lag coefficient (Spatial rho) of the eastern region is significant at the 5% level, while the spatial lag coefficients of both the central and western regions are not significant. From a national perspective, the spatial spillover effect of GEE is predominantly observed in the eastern region, rather than in the central or western regions. This is because, in China, the eastern region has a relatively developed economy, dense population, convenient inter-provincial transportation, and close industrial ties, while the central and western regions are relatively vast and sparsely populated, with inconvenient transportation and isolated industries across different provinces (Li and Qi, 2016). Therefore, the eastern region is more prone to spatial spillover effects. Interestingly, contrary to the national scenario, ER exhibits a positive spillover effect in the eastern region, with a coefficient of 0.191, significant at the 5% level. This indicates that in the eastern region, while administrative environmental protection regulations may somewhat weaken the local GEE, they positively promote the growth of GEE in adjacent regions. Since the eastern provinces are closely linked, local ER can stimulate crisis awareness among industrial enterprises in neighboring provinces, thereby promoting the growth of GEE in those regions. Therefore, Hypothesis 4 is fully validated in the eastern region of China, as ER is included in GEG, excessive GEG indeed promotes the improvement of GEE in neighboring areas.
Thus, all four hypotheses proposed in this paper have been validated through empirical analysis, which further supports the correctness of the theoretical framework of this study.
To further test whether each variable has spatial spillover effect, this paper decomposes the spatial effects of SDM. Specifically, the relationship between explanatory variables and explained variable in the same region can be expressed by direct effect (DE), while the impact of explanatory variables in other regions on the explained variable in this region is indirect effect (IE). Adding together DE and IE yields the total effect (TE). This decomposition method is helpful to understand the mechanism of variables in space (see Table 10).
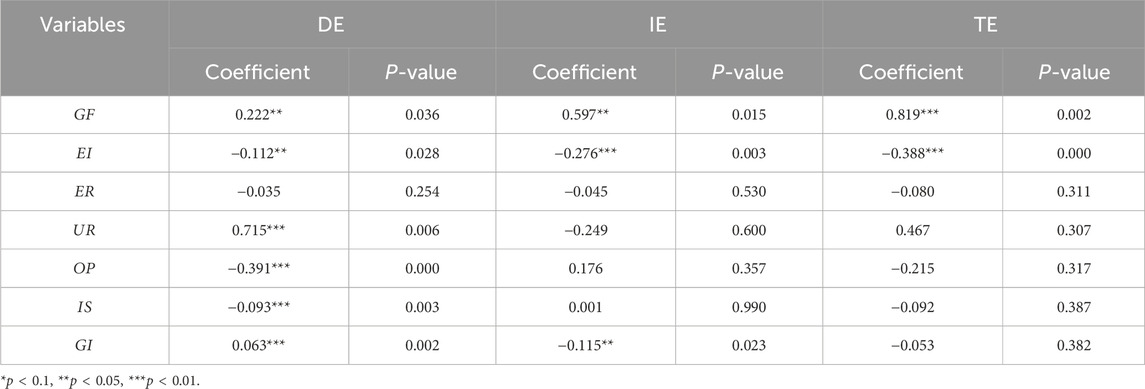
Table 10. Spatial effect decomposition.
Table 10 reveals that the coefficients for DE, IE, and TE of GF are 0.222, 0.597, and 0.819, respectively, all statistically significant at the 5% level at minimum. For EI, the coefficients for DE, IE, and TE are −0.112, −0.216, and −0.388, respectively, and these are also significant at least at the 5% level. In contrast, ER shows no significant DE, IE, or TE. Overall, the coefficients and significance levels for each variable, whether DE, IE, or TE, align with the SDM results from the previous section, indicating that the model is relatively robust.
This paper utilizes panel data from 30 provincial administrative regions in mainland China (excluding Tibet) covering the period from 2011 to 2021 to investigate the impact of GF and GEG on GEE. The SDM is employed to analyze the spillover effects of GF and GEG on GEE.
The conclusions of this paper are as follows. Firstly, the GEE of most provinces in China exhibits a “low-low” (LL) clustering state. However, over time, more and more provinces have gradually shifted to a “high-high” (HH) clustering state, indicating an overall improvement in GEE. Secondly, the development of GF can promote GEE and has a positive spatial spillover effect, thereby also boosting the GEE in neighboring provinces. Thirdly, the two variables of GEG, EI and ER, have a negative impact on GEE in the local province and show a negative spatial spillover effect, inhibiting the GEE in surrounding provinces. Fourth, an examination of regional heterogeneity reveals that the spillover effects of GF and GEG on GEE are predominantly concentrated in the eastern region, with insignificant spillover effects in both the central and western regions. Moreover, ER demonstrates a positive spillover effect in the eastern region, contrasting with the negative spillover effect observed on a national level. Finally, the impact of GF and GEG on GEE shows significant regional heterogeneity.
Based on these research findings, several policy recommendations can be proposed:
Firstly, to improve China’s GEE, it is essential to fully leverage the role of GF, using it as a breakthrough point to achieve transformation towards a GE. Secondly, The Chinese government should adhere to the principle of moderation in environmental governance to avoid excessive regulation that could negatively impact GEE. Thirdly, the Chinese government should capitalize on the spatial spillover effect of GEE to achieve mutual improvement across provinces. Fourth, due to significant regional heterogeneity, it is crucial to devise tailored policies that enhance GEE by considering the unique characteristics of each region.
This paper also has some limitations. Firstly, it uses provincial panel data. However, there is heterogeneity within each province in China, so relying solely on provincial data may be too general to fully reflect the national situation. Secondly, the study employs a short panel with a relatively small time dimension, which may not fully capture the evolution of variables over time. Incorporating more detailed municipal-level data and expanding the time dimension are directions for future research.
The raw data supporting the conclusions of this article will be made available by the authors, without undue reservation.
YW: Conceptualization, Data curation, Formal Analysis, Investigation, Methodology, Resources, Software, Validation, Visualization, Writing–original draft, Writing–review and editing.
The author(s) declare that no financial support was received for the research, authorship, and/or publication of this article.
The author declares that the research was conducted in the absence of any commercial or financial relationships that could be construed as a potential conflict of interest.
All claims expressed in this article are solely those of the authors and do not necessarily represent those of their affiliated organizations, or those of the publisher, the editors and the reviewers. Any product that may be evaluated in this article, or claim that may be made by its manufacturer, is not guaranteed or endorsed by the publisher.
The Supplementary Material for this article can be found online at: https://www.frontiersin.org/articles/10.3389/fenvs.2024.1476141/full#supplementary-material
DE, Direct Effect; EI, Environmental Investment; EKC, Environmental Kuznets Curve; ER, Environmental Regulation; FE, Fixed Effect; GDP, Gross Domestic Product; GE, Green Economy; GEE, Green Economic Efficiency; GEG, Government Environmental Governance; GF, Green Finance; GI, Green Innovation; IE, Indirect Effect; IS, Industrial Structure; LM, Least Squares Mean Square; LR, Likelihood Ratio; OP, Opening; RE, Random Effect; R&D, Research and Development; SAR, Spatial Autoregression Model; SBM, Slack-Based Measure; SDM, Spatial Dubin Model; SEM, Spatial Error Model; TE, Total Effect; UR, Urbanization Rate.
Afzal, A., Rasoulinezhad, E., and Malik, Z. (2022). Green finance and sustainable development in Europe. Econ. Res.-Ekon. Istraž. 35 (1), 5150–5163. doi:10.1080/1331677X.2021.2024081
Alola, A. A., and Ozturk, I. (2021). Mirroring risk to investment within the EKC hypothesis in the United States. J. Environ. Manage. 293, 112890. doi:10.1016/j.jenvman.2021.112890
Andrew, B. (2008). Market failure, government failure and externalities in climate change mitigation: the case for a carbon tax. Public Adm. Dev. 28 (5), 393–401. doi:10.1002/pad.517
Armitage, D., De Loë, R., and Plummer, R. (2012). Environmental governance and its implications for conservation practice. Conserv. Lett. 5 (4), 245–255. doi:10.1111/j.1755-263X.2012.00238.x
Bakry, W., Mallik, G., Nghiem, X. H., Sinha, A., and Vo, X. V. (2023). Is green finance really “green”? Examining the long-run relationship between green finance, renewable energy and environmental performance in developing countries. Renew. Energy 208, 341–355. doi:10.1016/j.renene.2023.03.020
Bennett, N. J., and Satterfield, T. (2018). Environmental governance: a practical framework to guide design, evaluation, and analysis. Conserv. Lett. 11 (6), e12600. doi:10.1111/conl.12600
Bouchmel, I., Ftiti, Z., Louhich, W., and Omri, A. (2024). Financing sources, green investment, and environmental performance: cross-country evidence. J. Environ. Manage. 353, 120230. doi:10.1016/j.jenvman.2024.120230
Brännlund, R. (2009). Environmental policy without costs? A review of the porter hypothesis. Int. Rev. Environ. Resour. Econ. 3 (2), 75–117. doi:10.1561/101.00000020
Chen, Y., Luo, P., and Chang, T. (2024). Testing the effectiveness of government investments in environmental governance: evidence from China. Sustainability 16 (14), 5828. doi:10.3390/su16145828
Duchêne, S. (2020). Review of handbook of green finance. Ecol. Econ. 177, 106766. doi:10.1016/j.ecolecon.2020.106766
Dzwigol, H., Kwilinski, A., Lyulyov, O., and Pimonenko, T. (2023). The role of environmental regulations, renewable energy, and energy efficiency in finding the path to green economic growth. Energies 16 (7), 3090. doi:10.3390/en16073090
Ezcurra, R., and Rios, V. (2020). Quality of government in the European regions. Do spatial spillovers matter?. Reg. Stud. 54 (8), 1032–1042. doi:10.1080/00343404.2019.1665644
Falcone, P. M. (2020). Environmental regulation and green investments: the role of green finance. Int. J. Green Econ. 14 (2), 159–173. doi:10.1504/ijge.2020.109735
Gao, D., Feng, H., and Cao, Y. (2024a). The spatial spillover effect of innovative city policy on carbon efficiency: evidence from China. Singap. Econ. Rev. 1–23, 1–23. doi:10.1142/S0217590824500024
Gao, D., Zhou, X., Mo, X., and Liu, X. (2024b). Unlocking sustainable growth: exploring the catalytic role of green finance in firms’ green total factor productivity. Environ. Sci. Pollut. Res. 31 (10), 14762–14774. doi:10.1007/s11356-024-32106-6
Gao, D., Zhou, X., and Wan, J. (2024c). Unlocking sustainability potential: the impact of green finance reform on corporate ESG performance. Corp. Soc. Responsib. Environ. Mgmt 31, 4211–4226. doi:10.1002/csr.2801
Georgeson, L., Maslin, M., and Poessinouw, M. (2017). The global green economy: a review of concepts, definitions, measurement methodologies and their interactions. Geo Geogr. Environ. 4 (1), e00036. doi:10.1002/geo2.36
Jänicke, M. (2012). “Green growth”: from a growing eco-industry to economic sustainability. Energy Policy 48, 13–21. doi:10.1016/j.enpol.2012.04.045
Kaika, D., and Zervas, E. (2013). The Environmental Kuznets Curve (EKC) theory—Part A: concept, causes and the CO2 emissions case. Energy Policy 62, 1392–1402. doi:10.1016/j.enpol.2013.07.131
Kwilinski, A., Lyulyov, O., and Pimonenko, T. (2023). Spillover effects of green finance on attaining sustainable development: spatial Durbin model. Computation 11 (10), 199. doi:10.3390/computation11100199
Lee, J. W. (2020). Green finance and sustainable development goals: the case of China. J. Asian Financ. Econ. Bus. 7 (7), 577–586. doi:10.13106/JAFEB.2020.VOL7.NO7.577
Li, B., He, X., Niu, Z., and Pan, J. (2021). The impact of environmental regulationson green economic efficiency – evidencefrom beijing-tianjin-hebei UrbanAgglomeration. Pol. J. Environ. Stud. 30 (5), 4039–4057. doi:10.15244/pjoes/130977
Li, J., Zhang, B., Dai, X., Qi, M., and Liu, B. (2022). Knowledge Ecology and policy governance of green finance in China—evidence from 2469 studies. Int. J. Environ. Res. Public Health 20 (1), 202. doi:10.3390/ijerph20010202
Li, K. X., and Qi, G. (2016). Transport connectivity and regional development in China. J. Int. Logist. Trade 14 (2), 142–155. doi:10.24006/jilt.2016.14.2.142
Li, X., Chen, F., and Hu, S. (2021). Spatial spillover effect of government public health spending on regional economic growth during the COVID-19 pandemic: an evidence from China. Complexity 2021, 1–10. doi:10.1155/2021/5552552
Liu, N., Liu, C., Xia, Y., Ren, Y., and Liang, J. (2020). Examining the coordination between green finance and green economy aiming for sustainable development: a case study of China. Sustainability 12 (9), 3717. doi:10.3390/su12093717
Liu, Y., Lei, J., and Zhang, Y. (2021). A study on the sustainable relationship among the green finance, environment regulation and green-total-factor productivity in China. Sustainability 13 (21), 11926. doi:10.3390/su132111926
Luo, G., Wang, X., Wang, L., and Guo, Y. (2021). The relationship between environmental regulations and green economic efficiency: a study based on the provinces in China. Int. J. Environ. Res. Public Health 18 (3), 889. doi:10.3390/ijerph18030889
Naseer, S., Song, H., Aslam, M. S., Abdul, D., and Tanveer, A. (2022). Assessment of green economic efficiency in China using analytical hierarchical process (AHP). Soft Comput. 26 (5), 2489–2499. doi:10.1007/s00500-021-06507-5
Ozili, P. K. (2022). Green finance research around the world: a review of literature. Int. J. Green Econ. 16 (1), 56–75. doi:10.1504/IJGE.2022.125554
Pekovic, S., Grolleau, G., and Mzoughi, N. (2018). Environmental investments: too much of a good thing?. Int. J. Prod. Econ. 197, 297–302. doi:10.1016/j.ijpe.2018.01.012
Porter, M. E., and van der Linde, C. (1995). Toward a new conception of the environment-competitiveness relationship. J. Econ. Perspect. 9 (4), 97–118. doi:10.1257/jep.9.4.97
Rasoulinezhad, E., and Taghizadeh-Hesary, F. (2022). Role of green finance in improving energy efficiency and renewable energy development. Energy Effic. 15 (2), 14. doi:10.1007/s12053-022-10021-4
Sachs, J. D., Woo, W. T., Yoshino, N., and Taghizadeh-Hesary, F. (2019). Importance of green finance for achieving sustainable development goals and energy security. Handb. green finance 3, 1–10. doi:10.1007/978-981-10-8710-3_13-1
Shi, J., Yu, C., Li, Y., and Wang, T. (2022). Does green financial policy affect debt-financing cost of heavy-polluting enterprises? An empirical evidence based on Chinese pilot zones for green finance reform and innovations. Technol. Forecast. Soc. Change 179 (C), 121678. doi:10.1016/j.techfore.2022.121678
Shuai, S., and Fan, Z. (2020). Modeling the role of environmental regulations in regional green economy efficiency of China: empirical evidence from super efficiency DEA-Tobit model. J. Environ. Manage. 261, 110227. doi:10.1016/j.jenvman.2020.110227
Sun, Y., Li, M., Zhang, M., Khan, H. S. U. D., Li, J., Li, Z., et al. (2021). A study on China’s economic growth, green energy technology, and carbon emissions based on the Kuznets curve (EKC). Environ. Sci. Pollut. Res. 28 (6), 7200–7211. doi:10.1007/s11356-020-11019-0
Tang, X., Chen, W., and Wu, T. (2018). Do authoritarian governments respond to public opinion on the environment? Evidence from China. Int. J. Environ. Res. Public Health 15 (2), 266. doi:10.3390/ijerph15020266
Tisdell, C. (1970). On the theory of externalities. Econ. Rec. 46, 14–25. doi:10.1111/j.1475-4932.1970.tb02462.x
Tone, K. (2004). Dealing with undesirable outputs in DEA: a slacks-based measure (SBM) approach. North Am. Prod. Workshop, 44–45. doi:10.1007/978-1-4419-6151-8_8
Tong, L., Chiappetta Jabbour, C. J., Belgacem, S. B., Najam, H., and Abbas, J. (2022). Role of environmental regulations, green finance, and investment in green technologies in green total factor productivity: empirical evidence from Asian region. J. Clean. Prod. 380, 134930. doi:10.1016/j.jclepro.2022.134930
Wang, L., Wang, Y., Sun, Y., Han, K., and Chen, Y. (2022). Financial inclusion and green economic efficiency: evidence from China. J. Environ. Plan. Manag. 65 (2), 240–271. doi:10.1080/09640568.2021.1881459
Wang, R., Wang, F., and Bie, F. (2022). Does green finance and water resource utilization efficiency drive high-quality economic development?. Sustainability 14 (23), 15733. doi:10.3390/su142315733
Wang, X., Elahi, E., and Khalid, Z. (2022). Do green finance policies foster environmental, social, and governance performance of corporate?. Int. J. Environ. Res. Public Health 19 (22), 14920. doi:10.3390/ijerph192214920
Wang, Z., Wang, X., and Liang, L. (2019). Green economic efficiency in the Yangtze River Delta: spatiotemporal evolution and influencing factors. Ecosyst. Health Sustain 5 (1), 20–35. doi:10.1080/20964129.2018.1559000
Wu, L., Ma, T., Bian, Y., Li, S., and Yi, Z. (2020). Improvement of regional environmental quality: government environmental governance and public participation. Sci. Total Environ. 717, 137265. doi:10.1016/j.scitotenv.2020.137265
Xiao, Y., Shi, X., and Kong, L. (2023). From green finance to sustainable innovation: how to unleash the potential of China’s high-tech industry. Environ. Sci. Pollut. Res. 30 (59), 123368–123382. doi:10.1007/s11356-023-30940-8
Yao, S. (2021). Fuzzy-based multi-criteria decision analysis of environmental regulation and green economic efficiency in a post-COVID-19 scenario: the case of China. Environ. Sci. Pollut. Res. 28 (24), 30675–30701. doi:10.1007/s11356-021-12647-w
Zeng, L. (2022). The driving mechanism of urban land green use efficiency in China based on the EBM model with undesirable outputs and the spatial Dubin model. Int. J. Environ. Res. Public Health 19 (17), 10748. doi:10.3390/ijerph191710748
Zhang, S., Wu, Z., Wang, Y., and Hao, Y. (2021). Fostering green development with green finance: an empirical study on the environmental effect of green credit policy in China. J. Environ. Manage. 296, 113159. doi:10.1016/j.jenvman.2021.113159
Zhao, P., Zeng, L., Lu, H., Zhou, Y., Hu, H., and Wei, X.-Y. (2020). Green economic efficiency and its influencing factors in China from 2008 to 2017: based on the super-SBM model with undesirable outputs and spatial Dubin model. Sci. Total Environ. 741, 140026. doi:10.1016/j.scitotenv.2020.140026
Zhao, X., Cai, Q., Ma, C., Hu, Y., Luo, K., and Li, W. (2017). Economic evaluation of environmental externalities in China’s coal-fired power generation. Energy Policy 102, 307–317. doi:10.1016/j.enpol.2016.12.030
Keywords: green finance, government environmental governance, green economic efficiency, spatial dubin model, spatial spillover effect
Citation: Wu Y (2024) Analysis on the relationship among green finance, government environmental governance and green economic efficiency: evidence from China. Front. Environ. Sci. 12:1476141. doi: 10.3389/fenvs.2024.1476141
Received: 05 August 2024; Accepted: 07 October 2024;
Published: 18 October 2024.
Edited by:
Yi Dou, The University of Tokyo, JapanReviewed by:
Irina Georgescu, Bucharest Academy of Economic Studies, RomaniaCopyright © 2024 Wu. This is an open-access article distributed under the terms of the Creative Commons Attribution License (CC BY). The use, distribution or reproduction in other forums is permitted, provided the original author(s) and the copyright owner(s) are credited and that the original publication in this journal is cited, in accordance with accepted academic practice. No use, distribution or reproduction is permitted which does not comply with these terms.
*Correspondence: Yangyulong Wu, eWFuZ3l1bG9uZzg1M0BvdXRsb29rLmNvbQ==
Disclaimer: All claims expressed in this article are solely those of the authors and do not necessarily represent those of their affiliated organizations, or those of the publisher, the editors and the reviewers. Any product that may be evaluated in this article or claim that may be made by its manufacturer is not guaranteed or endorsed by the publisher.
Research integrity at Frontiers
Learn more about the work of our research integrity team to safeguard the quality of each article we publish.