 William Nkonde
 Claire Furlong
 Brian Reed
 Damir Brdanovic
94% of researchers rate our articles as excellent or good
Learn more about the work of our research integrity team to safeguard the quality of each article we publish.
Find out more
ORIGINAL RESEARCH article
Front. Environ. Sci. , 22 January 2025
Sec. Water and Wastewater Management
Volume 12 - 2024 | https://doi.org/10.3389/fenvs.2024.1473729
Introduction: Exploring sanitation at a city scale is crucial due to approaches such as Citywide Inclusive Sanitation (CWIS). Sanitation impacts individuals, households and the whole city, as recognised by CWIS. The Shit Flow Diagram Graphic (SFDG) is the primary tool for citywide situation analysis. However, current SFDGs assume that individuals use only home toilets, overlooking the complexity of toilet usage, including public and workplace facilities. Our understanding of citywide sanitation flows is incomplete if analyses ignore the other toilets that people use. This study explored the impact of one type of institutional sanitation, school sanitation, on citywide sanitation flows.
Methods: To do this an overview and analysis of school sanitation at a citywide level was needed and a method to split the school pupils’ excreta flows was developed. Data was collected from secondary sources (e.g. from Ghana Statistical and Educational Services), structured observations (n = 26), and interviews with key informants (n = 15), headteachers (n = 26) and students (n = 39) from across Accra Metropolitan Area, Ghana. This data was used to construct three SFDGs, which were compared using Trend Graphs (graphs used to compare the state of sanitation across the different stages of the sanitation value chain).
Results and Discussion: The findings indicated that school sanitation was less safely managed than household sanitation and that SFDGs could be used assess school-level sanitation. Method development was crucial to accurately partition pupils’ excreta flows. While annual flows from schools appeared insignificant citywide, this seasonal flow could adversely affect public and environmental health during school terms. Therefore, it may be more important to consider the school population as a whole when thinking about the impact of school sanitation. This study highlights the importance of understanding where people spend their day and how this is related to the different sanitation systems they use; it demonstrates the need to move beyond household sanitation. This study successfully demonstrates the level of information that is needed regarding people’s sanitation practices which enables their excreta flows to be split between different facilities. It could be used as a guide for future studies and the further development of methods to explore this topic.
The world is becoming increasingly urbanized with over 50% of the population now living in cities; this rate is expected to increase further to 66% by 2050 (Ritchie et al., 2024). The majority of this urban growth has occurred in low- and middle-income countries (Ritchie et al., 2024); such fast and continuous urban growth increases the pressure on urban services, such as sanitation. Sanitation systems in these cities can be onsite (non-sewered), offsite (sewered), or a mixture of both (Peal et al., 2020), which adds to the complexity of service delivery. Over the past few decades, the focus of urban sanitation has been on offsite infrastructure, which normally serves only a part of the city in low- and middle-income countries (Evans and Saywell, 2006); this means that onsite infrastructure and the needs of a majority of the population have been neglected. As past approaches have failed to meet the needs of these growing populations, new approaches are required. The citywide inclusive sanitation (CWIS) approach was developed in response to this challenge, and its foundation is the provision of equitable sanitation services at the citywide scale, although it is evolving in terms of what this entails (Gambrill et al., 2020; Lüthi et al., 2020; Mills et al., 2020; Schrecongost et al., 2020).
Before applying any approach at the citywide scale, city sanitation authorities need to understand the existing situation; however, this is not a straightforward task given that services are typically provided on an irregular basis without regulatory oversight or performance information (Baum et al., 2013; Sato et al., 2013; Peal et al., 2020). To assess the delivery of sanitation services in cities, Peal et al. (2014) explored the use of “fecal waste flow diagrams,” which are now known as shit flow diagrams (SFDs). The SFD tool has a standard methodology and the outputs are the shit flow diagram graphic (SFDG) along with a report (SFD-PI, 2018). SFDGs have become a useful tool for assessing the sanitation conditions in urban areas (Scott and Cotton, 2020; Safi et al., 2022) and are popular for sanitation delivery context analysis at the citywide scale (Furlong, 2015). To date, over 340 SFDGs have been produced for cities around the world (SFD, 2024). The SFDG illustrates the amount of the populations excreta that is safely managed as it moves along the sanitation service/value chain (SSC or SVC) and the proportion that leaves the SSC safely or unsafely at each stage of the SVC (SFD PI, 2018). The SSC includes the provision of sanitation services by integrating collection, containment, conveyance, treatment, and disposal (Safi et al., 2022).
Although SFDs are produced at the citywide scale and allow for the exploration of different categories of origin, e.g., household and institutional (SFD PI, 2018), it is generally assumed that people use only one toilet throughout the day, namely, their “home toilet.” However, actual toilet usage is more complex as people use several toilets throughout the day, such as those in medical facilities, offices, schools, and shopping malls. The importance of toilets beyond the household toilet has been acknowledged by the sustainable development goals (SDGs) through the inclusion of monitoring of toilets in both schools (WASHData, 2024a) and healthcare facilities (WASHData, 2024b), which are considered to be a part of the universal WASH access. Sanitation outside the home could have a disproportionate impact on the citywide conditions, as public and institutional facilities may be used more frequently than facilities at home. Without considering this complexity, and ignoring the other toilets that people frequently use throughout the city, our understanding of citywide sanitation is incomplete. Worryingly, this could mean that even if there is good household sanitation quality, coverage, and usage, the population may not be protected from fecal-oral diseases due to poor sanitation in other sectors, such as medical facilities, offices, and schools.
The complexity of collecting such data and splitting excreta flows is believed to be the main reason why this has not been explored, but there are often good datasets for institutions, such as schools, hospitals, and barracks. Schools are of great interest and significance, as currently over one-quarter of the global population is of school age (UNESCO Institute of Statistics, 2017; UN, 2019), and 78% of this population lives in low- and middle-income countries (UNESCO Institute of Statistics, 2024). As students spend nearly 80% of their waking time in schools (Reid et al., 2002; Nahmod et al., 2017), they may be using school sanitation systems more often than those in their homes. Additionally, given the global aim of inclusive and equitable education for all under SDG4 (UN, 2019), several countries have introduced compulsory free primary education, meaning that a large percentage of the population is in school. Schools have been traditionally excluded from SFDGs; in a study of 20 SFDGs, only six recognized the significance of schools, although no data were included in the SFDGs (Nkonde, 2022). This is because significant estimates and assumptions are needed to understand the utilization of school sanitation facilities (Boadi, 2019). As schools have clearly defined and relatively stable populations, with the amount of time spent in school known along with sanitation types and management strategies, they provide a good case study for investigating the impact of institutional sanitation on citywide sanitation.
This study aimed to explore the impact of institutional (school) sanitation on citywide sanitation. Hence, detailed information was required on both school sanitation and the usage patterns of students so that a method could be developed to split the excreta flows of school pupils between school and home. Therefore, this work also contains an overview and analysis of school sanitation at the citywide level, and a new methodology was developed to allocate the excreta flows of school pupils. SFDGs were used to explore this as it has been used extensively to assess sanitation service delivery at the citywide level across the SSC (SFD, 2024).
The Accra Metropolitan Area (AMA) in Ghana was chosen for this study due to the availability of data (GSS, 2021a), especially the level of information on the current city sanitation situation (Boadi, 2019), the high percentage of the school-aged population (GSS, 2021a; GSS, 2021c), and accessibility to institutions holding data. The AMA, commonly called Accra, is situated in the southern part of the Greater Accra region of Ghana (Boadi, 2019). It comprises an area of 140 km2 and has 10 sub-metropolitan districts with a population of 1,281,570, of whom 25% are of school age (GSS, 2021a; GSS, 2021c).
In AMA, schools are differentiated by the age of the students (Figure 1) and their ownership. Private and public senior high schools along with basic schools (a combination of primary and junior high schools) are spread across all 10 sub-metropolitan districts, with an average of two private senior high schools and 123 private and public basic schools per district (GES, 2020). Two of the 10 districts have no private senior high school (Nkonde, 2022). In Ghana, education is managed by the Ministry of Education through the Ghana Education Service (GES), which formulates and implements policies in partnership with other organizations, such as the United Nations Children’s Fund (GSS, 2019; African Union & UNICEF, 2020). The GES is currently implementing free compulsory basic and secondary education (FCUBE) (GSS, 2019).
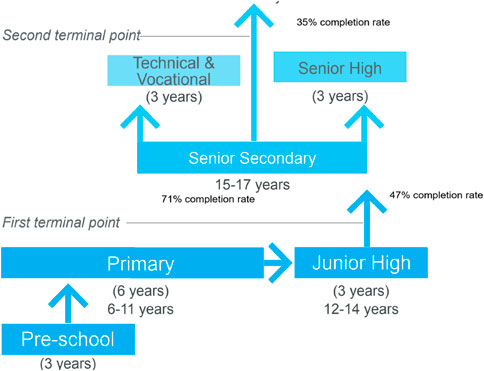
Figure 1. Education system in Ghana. Source: Decosas et al. (2018).
This case study used a mixed-methods approach, quantitative data was gathered from secondary data sources e.g. Ghana Statistical Service, structured observations and interviews, while qualitative data was gathered from secondary sources e.g. reports and interviews. This approach was used so that the data could be validated. Data collection was undertaken between July and September 2022 after obtaining ethical approval from the IHE, Delft, The Netherlands (IHE-RECO-2022-003).
The schools were selected using stratified convenience sampling, with one school chosen from each category of schools present in each district. Twenty six schools were selected: one public senior high school, one private senior high school, 17 public basic schools, and seven private basic schools. Secondary data were collected from the Ghana Statistical Service (GSS) and GES on the school population, school policies, and sanitation situation in the schools and cities (Table 1).
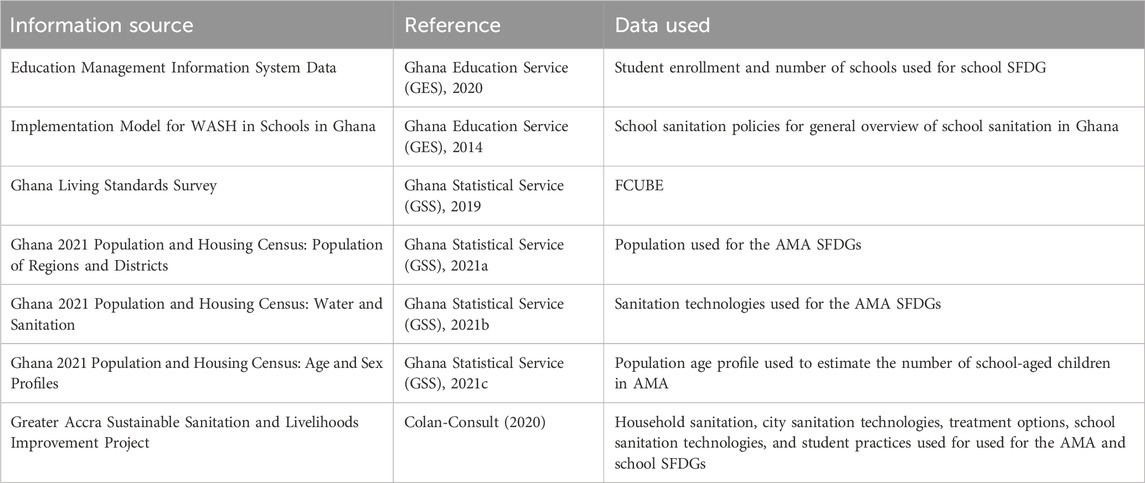
Table 1. Secondary data sources used in the study.
A total of 80 key informants were interviewed using a semi-structured approach. The headteachers of the selected schools were interviewed, and they also identified students who could be interviewed (Table 2). The School Health Education Program (SHEP) coordinators were interviewed from each district (Table 2). Other key informants were also purposively sampled based on their roles, responsibilities, and knowledge (Table 2), but harder-to-access key informants such as private operators and utility employees were sampled through snowball sampling (Table 2). All interviews were conducted in English, either at the offices of these individuals or at the schools; the interviews lasted between 30 and 45 min, and informed consent was obtained prior to participation. Interviews with the students were conducted in the presence of a parent, guardian, or headteacher, and informed consent was obtained from both the student and the adult present. Notes were taken during the interviews and analyzed using themes related to the objectives of this research. After each interview with the headteachers, structured observations of the school sanitation systems were conducted. The structured observation sheets were developed based on the WHO Sanitation Sanitary Inspection Forms (WHO, 2018) and is included in Supplementary Table S1.
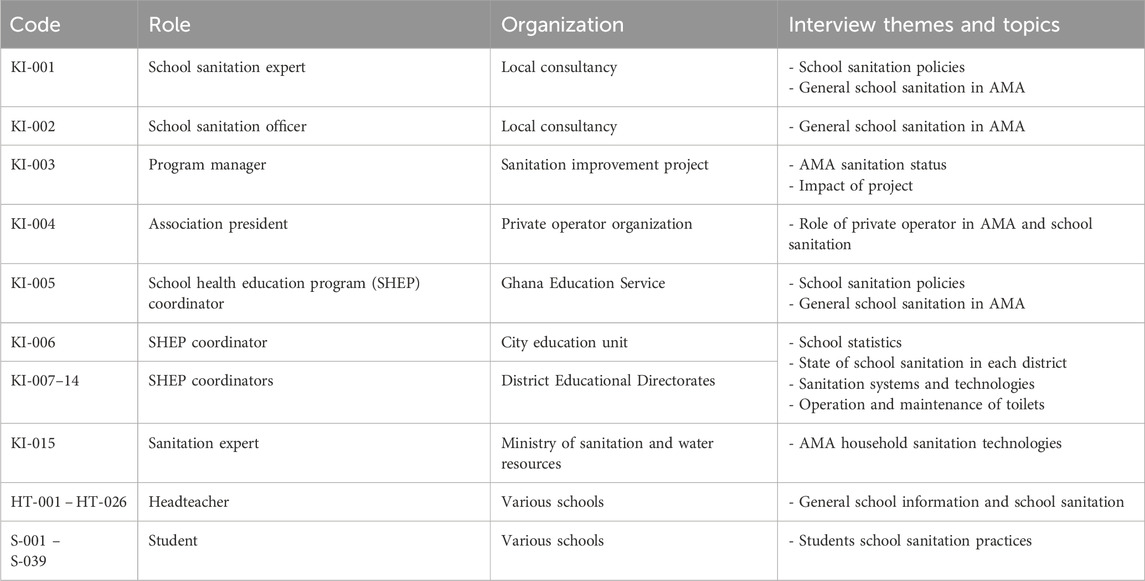
Table 2. Details of key informant interviews.
SFDGs were generated using the online SFDG generator following the standard methodology in the SFD manual (SFD PI, 2018). Three SFDGs were developed to explore the impact of school sanitation on the excreta flows of the city. SFDG1 depicts the excreta flow of the current population in AMA; this was used to understand the city sanitation situation in 2022. SFDG2 depicts the current excreta flow from only the schools in AMA; this was generated to visualize the status of school sanitation. SFDG3 depicts the excreta flow of the city by including the inputs from the school sanitation; this SFDG was generated by removing the excreta flows of the students from their home toilets and incorporating the school sanitation excreta flows of the pupils from the school toilets.
To develop SFDG3, the students’ excreta flows had to be split between their households and schools. The proportions of pupils’ excreta disposed of at school were calculated using the number of waking hours per day (h) and the number of days in a year that a pupil is in school (d). This depends on the type of attendance, i.e., residential (R) or day (D). Not all students use toilets at school, so the proportion of students using school sanitation facilities (C) was needed. For each student using the school toilet, some excreta may still be deposited at home, so the proportion of excreta deposited in the school sanitation system (k) was needed. These data were used to calculate the school sanitation usage population equivalent (SUPe) given by Equations 1–3
School sanitation usage population equivalent:
School sanitation usage population equivalent for day (D) or residential (R) students:
or
The proportion of time spent by the students in school in a year:
or
Where:
• SUPe = School usage population equivalents
• SUPeD or SUPeR = School usage population equivalents (D = day, R = residential)
• SpD or SpR = Student population of students (D = day, R = residential)
• tD or tR = Proportion of time the students spend at school per year (D = day, R = residential)
• dD or dR = Number of days students spend at school (D = day, R = residential)
• hSD or hSR = Total hours spent in school per day (D = day, R = residential)
• hW = Total waking hours of the student
• CD or CR = Proportion of students who use the school toilets (D = day, R = residential)
• kD or kR = Proportion of day students’ usage of school compared to home sanitation facilities (D = day, R = residential)
The accuracy of the various data sources varied; to ensure that the results were not unduly influenced by inaccurate data, a two-step validation process was used. First, the data used to generate the SFDGs were color-coded based on the level of triangulation to show the level of confidence. Data with a wide range of sources were coded green, while data from a single source without triangulation were coded amber. Sensitivity analysis was performed using different scenarios to assess the impact of variations in the amber-coded data. The range of results was assessed, and if this range was large then the middle value was chosen; however, if there was little difference in the results, the value deemed by the authors to be most valid was chosen for generating the SFDGs.
The SFDGs were compared using trend graphs (Martinez, 2016). Trend graphs were developed to illustrate the differences in sanitation provision over time (Martinez, 2016; Safi et al., 2022); however, in the present study, they were used to compare differences in the safe management of sanitation services between households and schools in AMA (SFDG1 vs. SFDG2) and to explore the impact of school sanitation on citywide sanitation (SFDG1 vs. SFDG3).
Figure 2 shows the SFDG for AMA in 2022 based on household sanitation. In AMA, 1% of the population was practicing open defecation, and the excreta of approximately 99% of the population was safely contained through various sanitation technologies (Figure 2), including sewers, biodigesters, septic tanks, holding tanks, ventilated pit latrines, and ordinary pit latrines (Colan-Consult, 2020; GSS, 2021b). While 98% of the captured excreta was emptied (Figure 2) only 69% of this excreta reached the treatment facilities (Colan-Consult, 2020), which were approximately 85% efficient (KI-014; SSGL, 2017). This means that the excreta of only 62% of the population in AMA was safely managed (Figure 2).
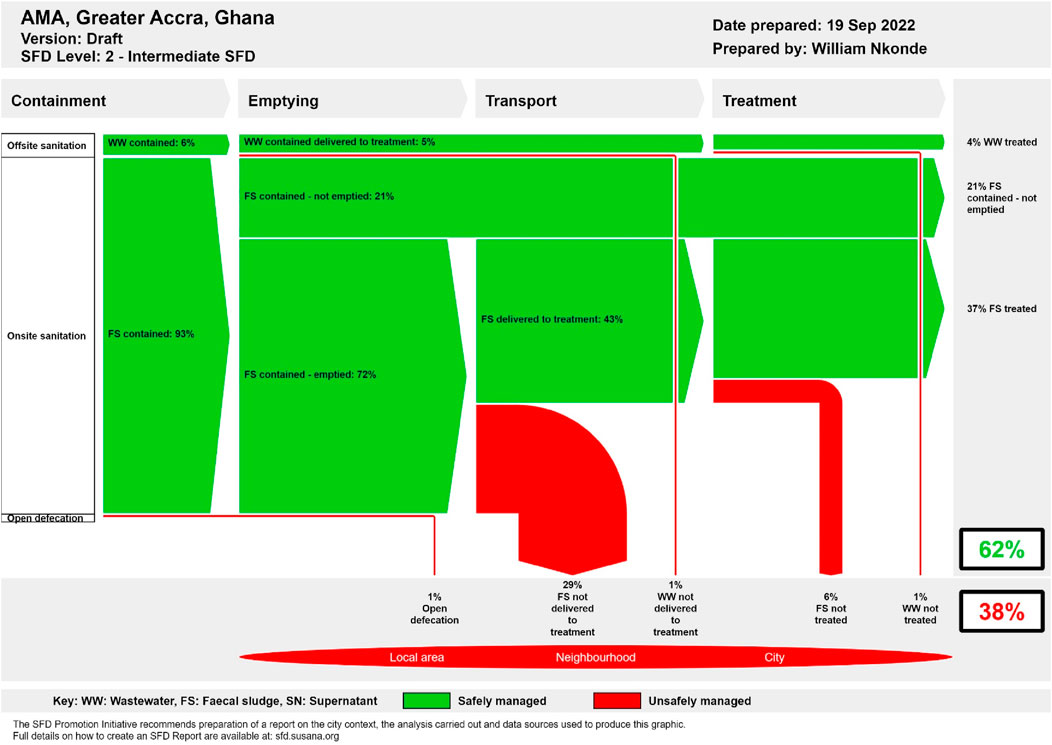
Figure 2. SFDG1 for AMA households for 2022.
The number of school-aged children actually attending schools in AMA was 235,761 (Table 3), which was 74% of the school-aged population (GSS, 2021a; GSS, 2021c). School enrollment in AMA is higher than the average rate of 66% for Sub-Saharan African countries (African Union & UNICEF, 2020; White, 2021; Onukwue, 2022), and this is probably due to FCUBE (GSS, 2019). Ghana’s education system has three levels (Figure 1), but the primary and junior levels are combined and collectively referred to as basic schools (KI-001; KI-005; GES, 2020). Schools are either managed by the state (public) or privately owned (private), and the financing, operation, and maintenance of school sanitation infrastructure differ between these two categories (KI-005; GES, 2020).
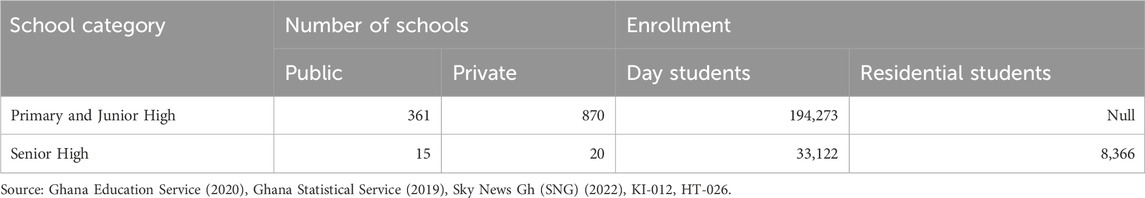
Table 3. AMA school statistics.
Only 3.5% of the overall school population in AMA are residential students (Table 3); this is important in terms of sanitation as they would use the school sanitation facilities more often than the day students who live at home during the school term. Five senior high schools had residential students who only returned home at the end of each term. It was estimated that the residential students spend 275 days per year in school, including weekends during the school term (GES, 2020; Sky News Gh (SNG), 2022), while the day students spend 185 days per year in school (HT-026; KI-012; Ghana Students, 2022). Residential students only account for 0.6% of the AMA population, so no adjustments were made to the population used to generate SFDG3. Knowing the amount of time that the day students spend in school is essential to understanding their sanitation practices. Typically, students in Ghana spend 9 h in school from 07:30 to 16:30 (GEO, 2022). Studies have shown that students under the age of 12 are awake for between 12 and 14 h a day, while those aged between 12 and 18 years of age are awake for between 14 and 16 h daily (Reid et al., 2002; Nahmod et al., 2017). If an average of 14 waking hours is considered, then the day students spend over 64% of their waking hours in school on school days (GEO, 2022; Reid et al., 2002; Nahmod et al., 2017).
The GES policy provides guidelines for the use of adequate and safe sanitation facilities and recommends the use of specific technologies, such as septic tanks and ventilated improved pit (VIP) latrines (GES, 2014). In AMA, septic tanks and VIPs are the most common technologies for both schools and households (Figure 3). These are also typical sanitation technologies used in schools in Sub-Saharan Africa (Harvey and Adenya, 2009).
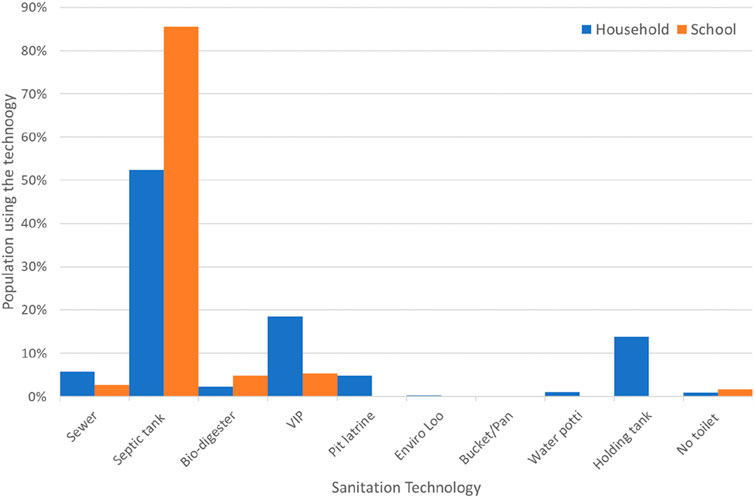
Figure 3. Sanitation technology types used in households and schools. AMA population data (GSS, 2021b) and school data were obtained from observations and interviews triangulated with Colan-Consult (2020).
Nearly half of the students reported using the school toilets only when needed, and approximately one-third of the students reported using the toilets either once or twice a day, but 28% of the students interviewed did not use the school toilets at all (Figure 4). Some headteachers (19%, n = 26) noted that not all school students used the school toilets (HT-001 to HT-026). Hence, as with household toilets, the availability of school toilets does not equate to usage. These data were fed into the estimation of the parameter C in Equations 2 for the day students (Table 4).
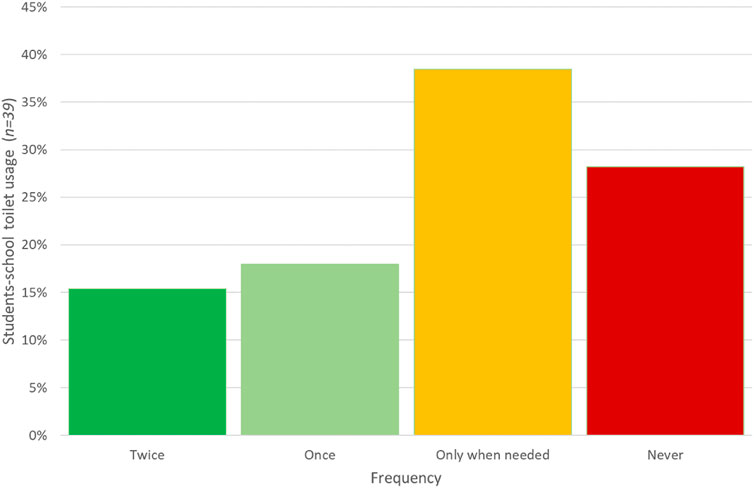
Figure 4. Student usage of school toilets.
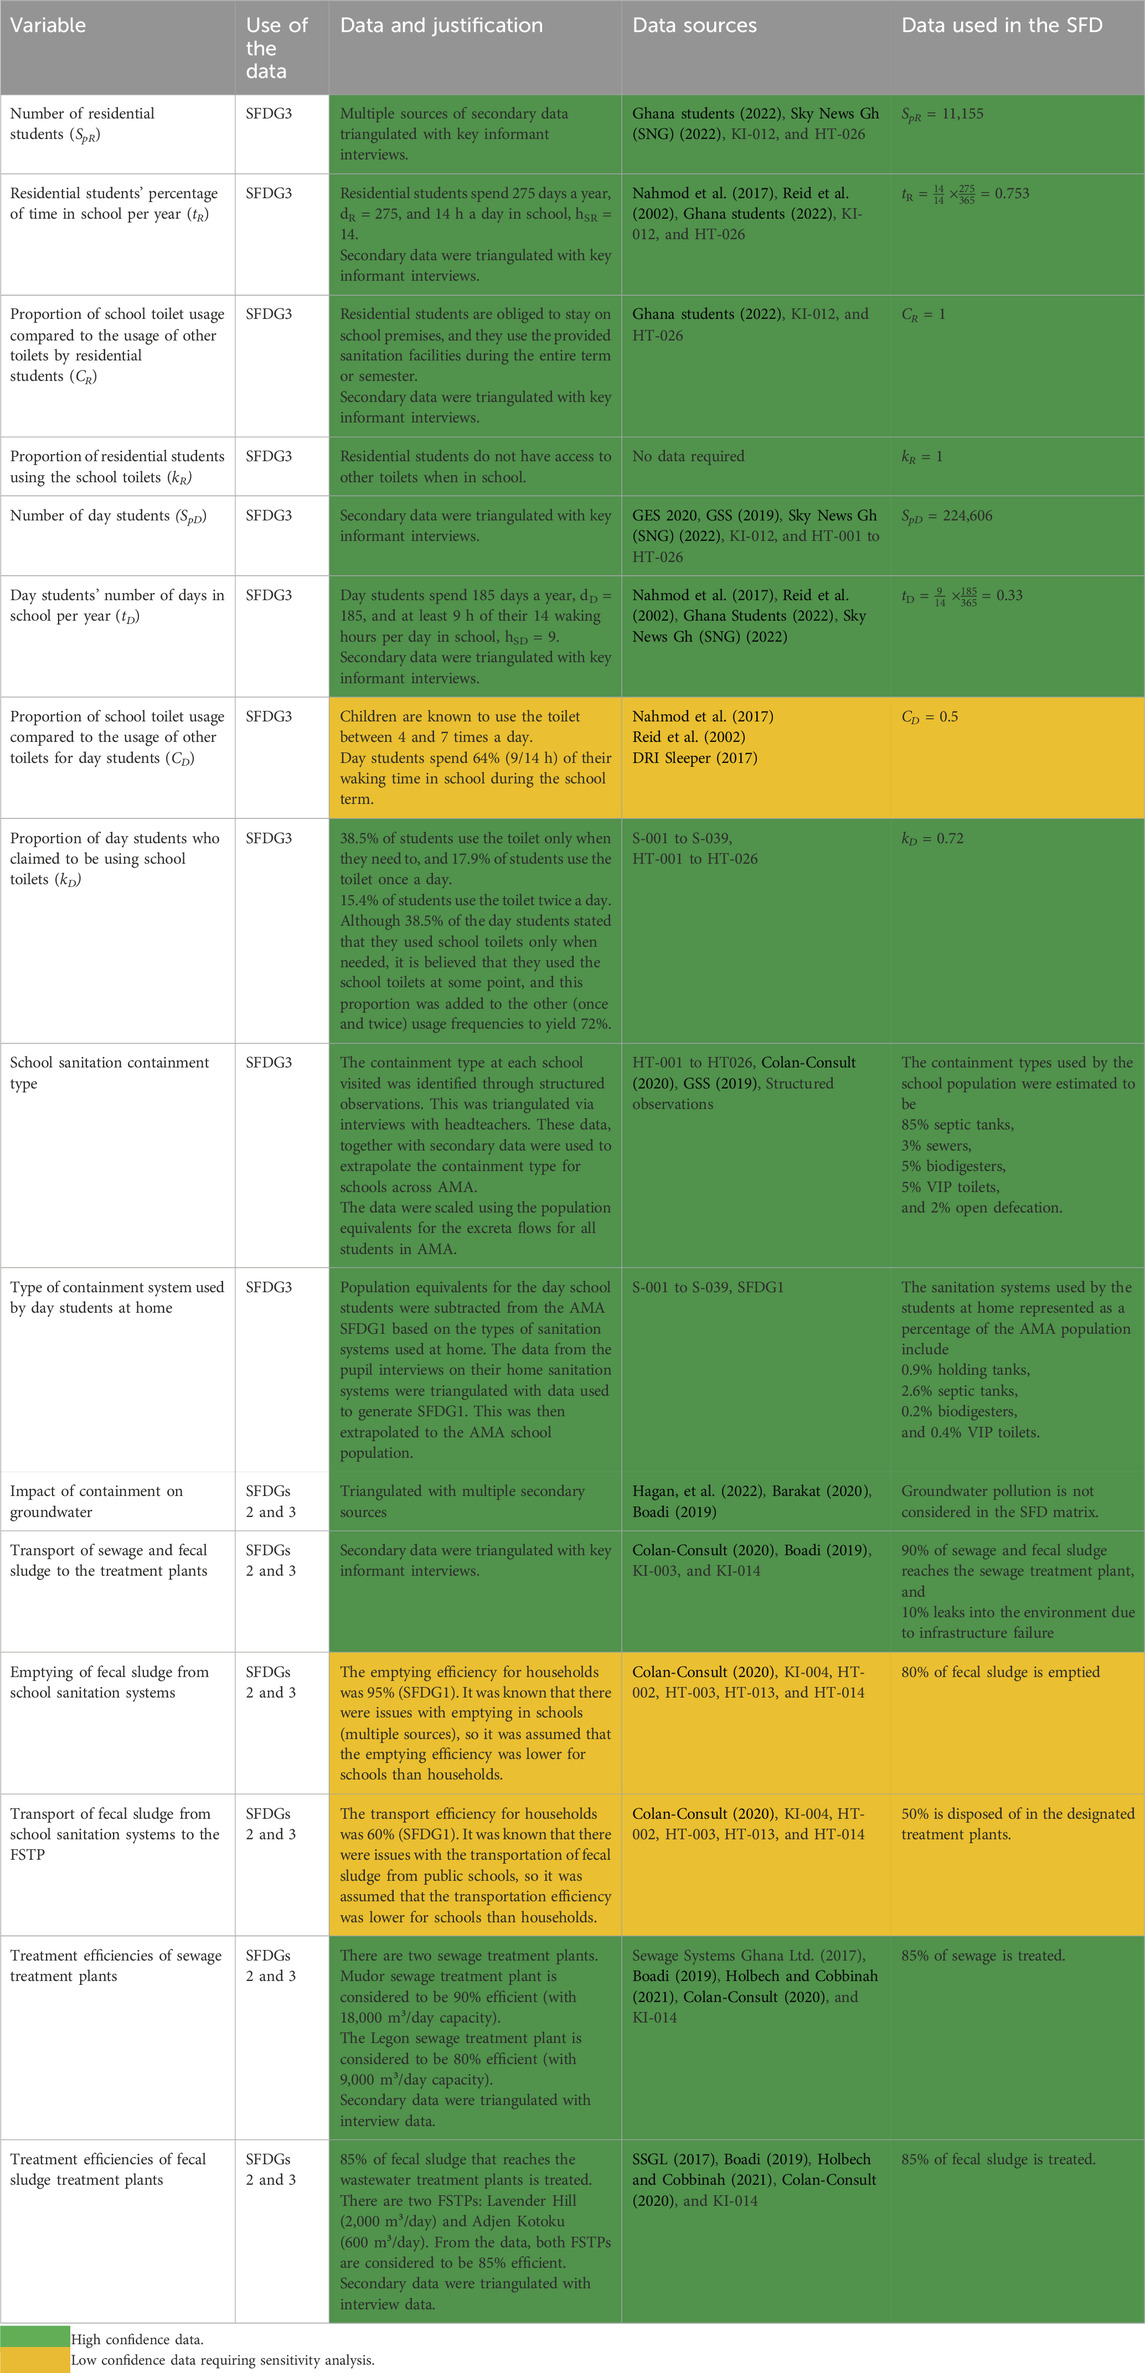
Table 4. Data for SFDG2 and SFDG3.
The students stated that their school toilet usage was dependent on the level of toilet cleanliness (64%, n = 39); the other factors highlighted by the students included security and privacy (8%, n = 39), student-to-toilet ratio (15%, n = 39), and type of toilet technology (49%, n = 39); it should be noted that many of these factors are interrelated (Garn et al., 2014; Schmitt et al., 2017; Shao et al., 2021). Similar findings have been reported based on studies in China and Nigeria, where one of the main barriers to school sanitation usage included toilet cleanliness (Abigail et al., 2012; Shao et al., 2021). This was supported by the structured observations cleanliness scored lower than all other parameters for public and private schools (Figure 5).
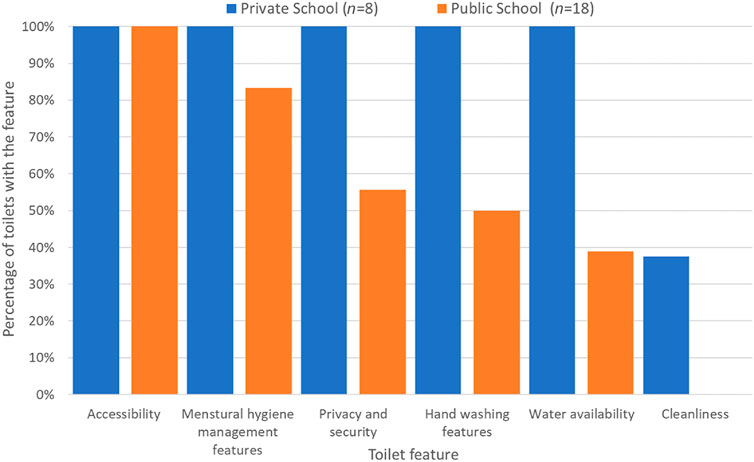
Figure 5. Structured observational scores of various features of school toilets.
The structured observations (Figure 5) were categorized into two themes physical infrastructure (accessibility, menstrual health management (MHM) features, privacy, and security), and operation and maintenance (O&M) (water availability and cleanliness).
This is due to the differences in funding requirements. For parameters related to physical infrastructure, both private and public schools had fair to good scores ranging from 50% to 100%, while features related to O&M were rated low at <40% (Figure 5). The lack of funding for O&M was the reason given for the lack of cleanliness by headteachers from both public and private schools (HT-002; HT-003; HT-013; HT-014). This impacted the sanitation system in public schools as many were not emptied when full, resulting in leakage into the environment (KI-004). This was supported by the structured observations which noted that 38% (n = 18) of the sanitation systems in public schools was not emptied when full. Half of the headteachers from the public schools (n = 18) noted that their schools had experienced overflowing sanitation containment systems. This information fed into the estimates for the emptying and transportation of fecal sludge in Table 4.
Private schools outperformed public schools in every category, as shown in Figure 5 this was thought to be due to the lack of O&M funding in public schools and the additional pressure on their sanitation systems related to increased student numbers due to FCUBE (GSS, 2019). The low performance of the O&M-related features compared to the infrastructure features (Figure 5) illustrates that although thought and investment were put into building school sanitation infrastructure, the public schools were struggling to manage their O&M due to a lack of continuous funding. This is in line with a UNICEF and WHO (2022) study that found that although there has been significant capital investment in the construction of public-school sanitation, there is a lack of sustainability as emptying, transportation, and treatment of fecal sludge are often neglected due to a lack of continuous funding. Similar situations have been reported in other developing countries, where O&M could not be sustained over a long period of time despite using novel approaches, such as community involvement, preventive maintenance programs, and packaged operation and maintenance (Chatterley et al., 2013; Duijster et al., 2022).
The data in Table 4 were used to generate SFDG2 and SFDG3.
The population equivalent for residential students SUPeR was calculated using the data in Table 4 and Equations 2, 3. A sensitivity analysis was performed on the calculated population equivalent for day students SUPeD (Equations 2, 3) due to the uncertainty of the data for the parameter CD (proportion of children actually using sanitation whilst in school). The tested CD values were related to the original assumption of CD = 0.5 in Table 4. Three scenarios were tested by varying the CD value, and the results are found in Table 5. Scenario C with CD = 0.75 was used in SFDG3 rather than CD = 0.5 as assumed in Table 4 as students are in school for 9 h out of their 14 waking hours (Table 4), which is equivalent to 64% of their waking time. Although AMA has a relatively high percentage of the population attending school (18.4%, Table 3), this only accounts for approximately 4% of the excreta flow from AMA owing to usage patterns, such as usage frequency and time spent in school.
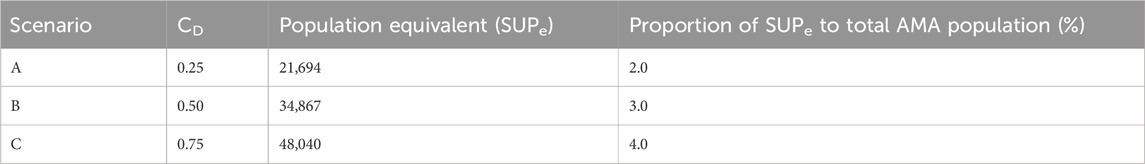
Table 5. Summary of CD sensitivity analysis.
Sensitivity analysis was performed on the assumptions made for the emptying and transportation of fecal sludge from schools in Table 4. Five scenarios were tested around these assumptions, and the results are shown in Table 6. The population used to test these scenarios was the total student population of 235,761. The baseline or reference values for these five scenarios were the SFDG1 emptying and transport efficiencies (Scenario 1, Table 6). In Scenarios 2 and 3 (Table 6), the emptying efficiency decreased by 10% and 20%, respectively, while the transport efficiency remained constant; this unexpectedly caused the percentage of safely managed excreta to increase from 54% to 65% because the unemptied fecal sludge was considered to be safely contained, which is related to groundwater contamination (Table 4) rather than the overall public health risk. The assumptions noted in Table 4 (Scenario 4, Table 6) related to emptying and transport resulted in a 50:50 split between safely and unsafely managed excreta. It was observed that for each drop of 10% in transport efficiency, the overall safe management rate dropped by 4% (Scenarios 1, 4, and 5, Table 6). After assessment, the data from Scenario 4 was used to generate the SFDGs.
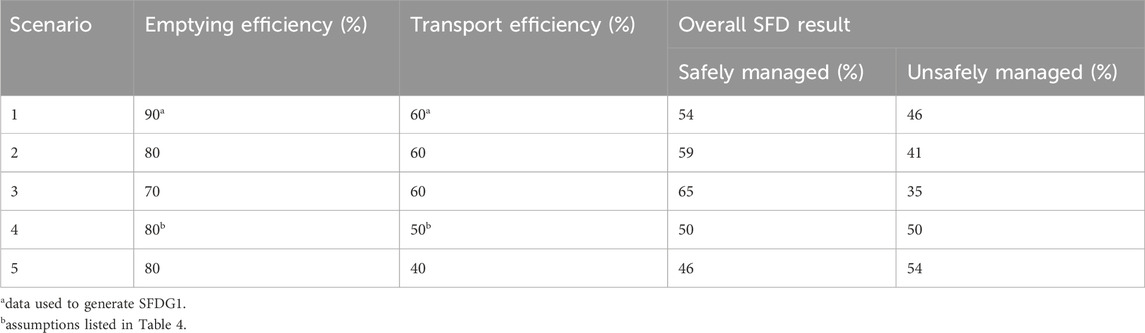
Table 6. Summary of sensitivity analysis for the emptying and transport efficiencies of fecal sludge from school sanitation systems.
SFDG2 (Figure 6) shows the excreta flows from schools in AMA; 71% of the excreta deposited in schools was safely contained using onsite and offsite sanitation technologies. Very few of the schools were connected to sewers (Colan-Consult, 2020; Boadi, 2019, KI-003), as the sewer network mostly serviced the central business district (Colan-Consult, 2020; Boadi, 2019, KI-003), where few schools are located.
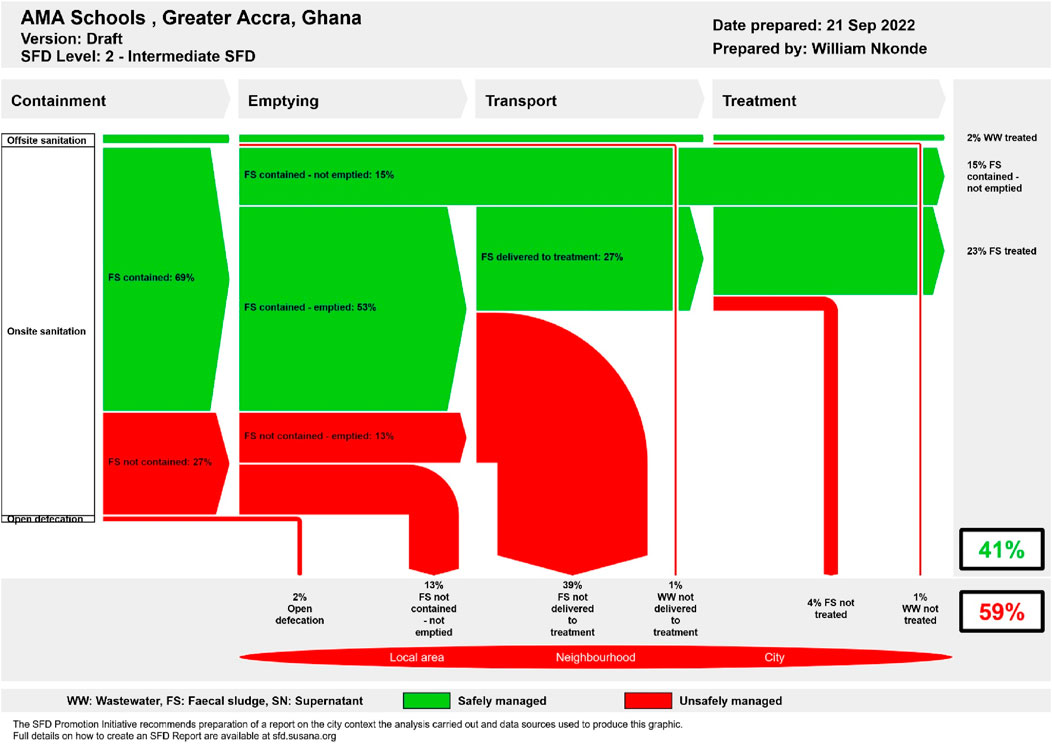
Figure 6. SFDG2 of AMA school sanitation.
While 27% of the excreta deposited at the schools was not contained and leaked into the immediate environment (Figure 6). A total of 68% of the excreta was emptied, but 40% of this flow ended up in the environment untreated (Figure 6). Therefore, 29% of the excreta from schools reached a treatment plant, and only 41% of the excreta from the schools was safely managed (Figure 6).
Comparisons were performed between school (Figure 6) and household sanitation (Figure 2) in AMA for each stage of the SSC (Figure 7). This shows that school sanitation service delivery was worse at every stage of the SSC compared to household sanitation. Surprisingly, Figure 7 shows that open defecation in schools is higher than in households, as some schools do not have adequate sanitation facilities (Figure 3). The emptying and transport stages of the SSC are worse in schools than in households owing to a lack of continuous funding and investment for O&M. This means that (on average) the excreta disposed of in schools was less safely managed than that disposed of in households in AMA (Figure 7).
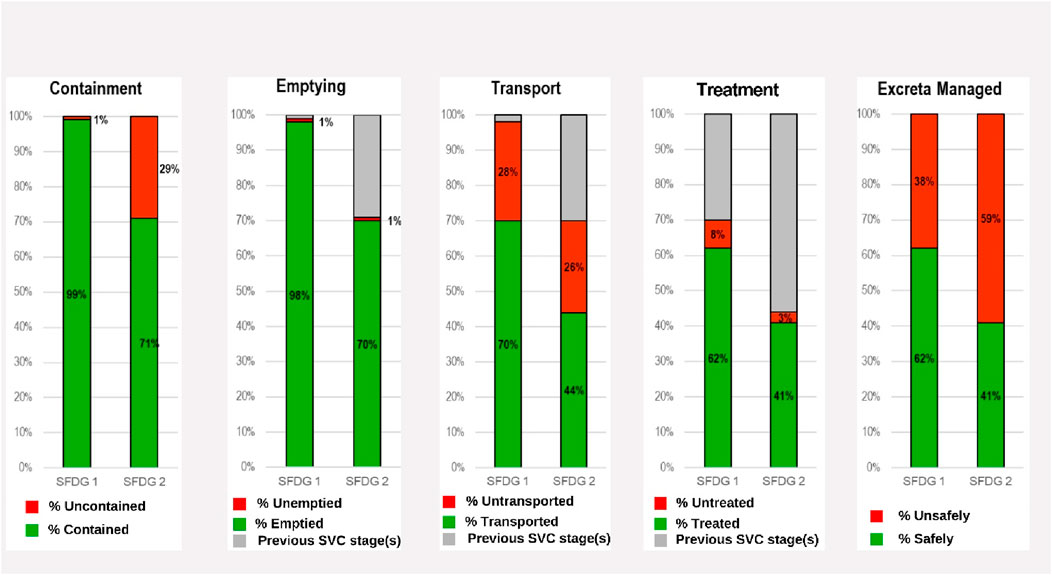
Figure 7. Comparison of AMA city and school sanitation along the SSC.
The data from SFDG2 were converted to school usage population equivalents using Equations 1–3. The final SFDG3 (Figure 8) shows the sanitation service delivery at the citywide level, including both household and school sanitation, using data from Table 4. Trend graphs (Figure 9) were then used to compare SFDG1 (Figure 2) to SFDG3 (Figure 8) to observe the impact of school sanitation on citywide sanitation. Impacts highlighted by the trend graphs (Figure 9) include the following:
• Uncontained excreta increased from 1% to 2% due to a lack of or poorly maintained containment in schools. It should be noted that the situation in the schools may be worse than that illustrated in the SFDG, as it was assumed that students who did not use the school toilets used their toilets at home and that fecal sludge is safely managed if it is not collected.
• Unemptied and uncontained excreta increased from the initial 2% to between 2% and 3% owing to a lack of O&M for school sanitation, which was related to funding.
• Excreta not delivered to the fecal sludge treatment plants (FSTPs) increased from 28% to 29% due to a lack of funds for O&M for school sanitation.
• Treated excreta decreased by 1% from 62% to 61% owing to the impact of school sanitation in the previous stages.
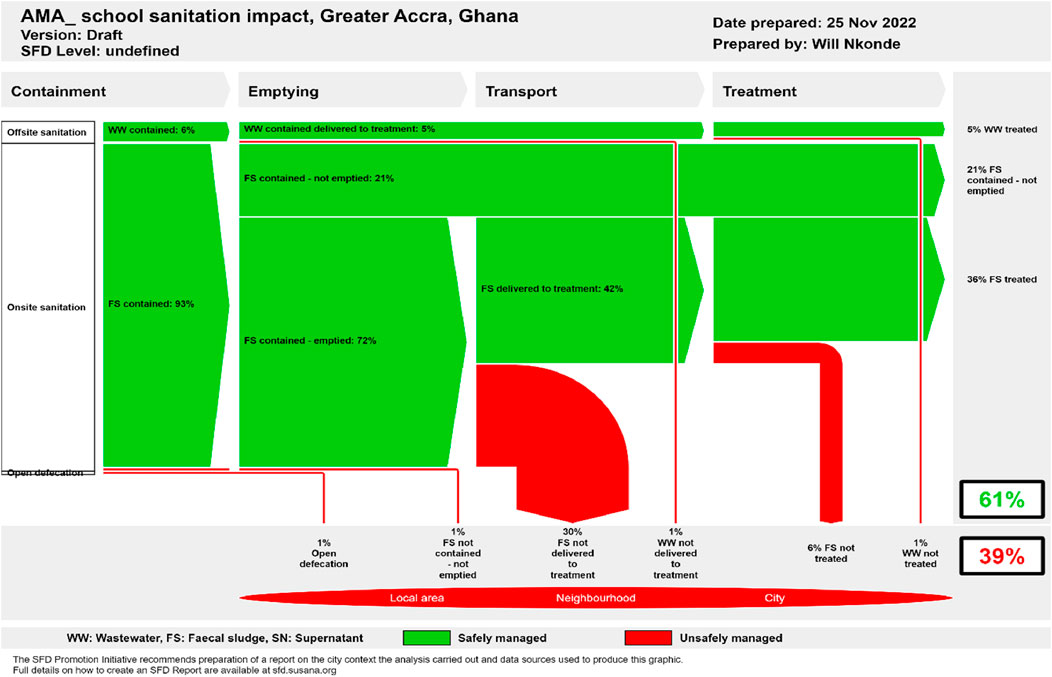
Figure 8. SFDG3 the impact of school sanitation on the sanitation in AMA at a citywide level.
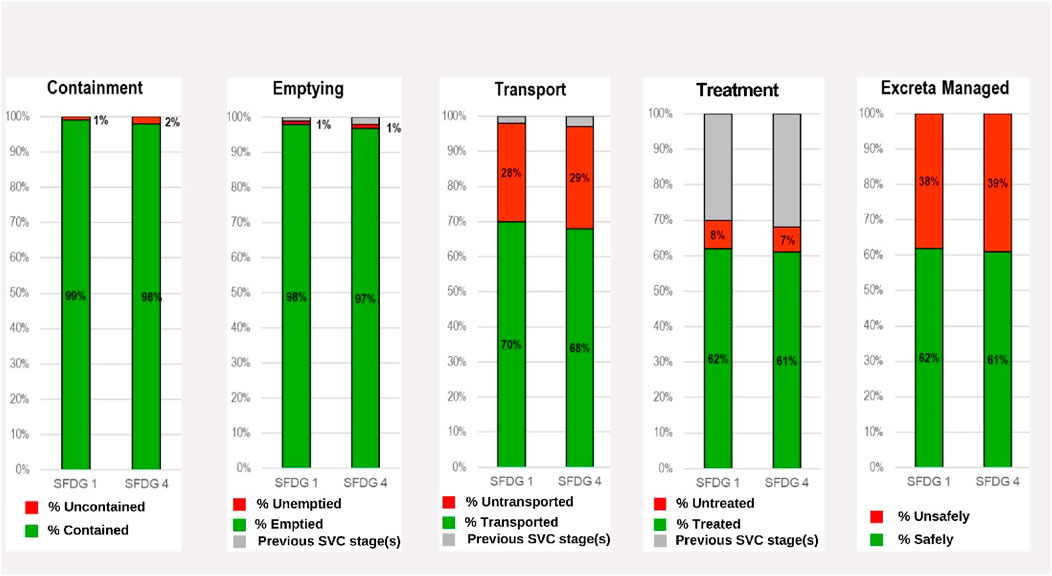
Figure 9. Comparison between SFDG1 (AMA city) and SFDG3 (AMA with impact from schools).
Limited data were required to produce SFDG2 (Figure 6) for the schools (Table 3) compared to the data required to split the excreta flow and integrate it into the citywide SFDG (Table 3, SFDG3). SFDG2 (Figure 6) could be used to highlight the main challenges in assessing and monitoring the progress of school and healthcare sanitation facilities in relation to the SDGs across the SSC. The data collected and the process developed to split excreta flows highlights the complexity of exploring sanitation beyond a household level on a citywide scale. The process highlighted in this work could be used as a guide for future studies, as it could help reduce the time required for data collection and analysis.
Although 18.4% of the people in AMA attend school, and considering the state of school sanitation in the city, the citywide sanitation services were only adversely impacted by 1%, which is the sensitivity limit of the SFDG tool used. This means that in cities with a lower percentage of the population attending school and a low number of residential students, the impact will be insignificant at the citywide level. This is because the school excreta flows of the day students (SUPeD, Equation 2) only account for between 6% and 16% (Scenarios A-C, Table 5) of their annual excreta flow. This is due to the time spent in school during the year (tD = 0.34, Table 4). For residential students, this value was 76% of their annual excreta flow due to the time spent in school each year (tR = 0.75, Table 4). Hence, there will be a higher impact of school sanitation in cities with a higher number of residential students compared to the total city population. This indicates that the main factors influencing the institutional impact on sanitation at the citywide level are the percentage of the population at the institution, and the proportion of time spent in the institution per year. This means that larger residential institutions, such as hospitals, barracks, and universities, will have a bigger impact on citywide sanitation. The present research demonstrates the effects of where people spend their day on city sanitation flows. As approximately 70% of the people in AMA are employed or involved in income-generating activities (AMA, 2020), with the majority of people working outside their homes, it is assumed that these people will not be using household sanitation for the majority of their waking hours. According to Mazeau et al. (2014), 63% of men and 41% of women in one area of Accra use two or three different toilets every day. It is hypothesized that this flow of excreta is likely to have the biggest impact on the sanitation landscape of the city in relation to non-household toilets.
The findings of this study hide the fact that the excreta flows in schools are seasonal. Although these flows are insignificant at the citywide level when considering annual flows, there will be significant health and environmental impacts during the school terms. Thus, it may be more important to consider the school population as a whole, as in SFDG2 (Figure 6), and compare it to the household city sanitation situation (Figure 7) with regard to impact.
Fieldwork for this study was conducted between August and September 2022 coinciding with the schools’ summer holidays, which limited access to the schools, staff, and students. Gaining official data on private school sanitation was challenging as this information was not publicly available, so interview data were used. The SFD tool was designed for situational analysis at the citywide level and for use in advocacy and decision-making; it was not designed for accuracy or precision, so the sensitivity of the tool was only 1% of the population. The tool does not display decimal outputs but rather rounds them to the nearest integers. The SFDGs presented in this work are based on assumptions that have been justified (Table 4), which is linked to the use of SFDGs. More detailed information would therefore be required for an accurate or precise understanding of school sanitation flows at the city level. In this study, excreta was considered as a whole rather than its fractions, namely, urine and feces; if the patterns of defecation and urination were considered separately, the present findings may be significantly altered.
With regard to the residential students in AMA, no adjustments were required for the area's population. For large institutions, such as residential schools and regional hospitals that people commute to from outside the area, more data is required in regards to the locations of their homes so that the excreta flows can be added to the areas where they temporarily reside. It should be noted that some children from AMA also attended schools outside the study area, which was not considered in this analysis.
To obtain an overview of the sanitation conditions in schools across AMA, stratified convenience sampling was used with at least one school sample per district. In total, 18 public and 8 private schools were sampled, and the conditions of the school sanitation systems were very different for these two types of schools (Figure 5). This means that the school SFDGs and data will be skewed toward the poorer conditions in the public schools. Hence, we recommend that the different types of schools be taken into consideration when sampling in the future to replicate this study. The official statistical records may also be incorrect in some countries as there may be financial incentives for school registration, so the number of enrolled students may be inflated.
This study explores if the SFDG process can be used to map excreta flow originating from more than one source (households and schools) at a citywide level. This approach can give a more comprehensive understanding of the citywide sanitation landscape, which is currently limited to household sanitation only. This study shows that the SFDG process could be used to compare excreta flows from schools with those from households. Within the case study area, school sanitation was less safely managed than household sanitation at all stages of the SSC. This was attributed to the lack of continuous funding for O&M as the current focus was found to be on the construction of school toilets rather than maintaining the facilities. In the case study area and for school sanitation in low- and middle-income countries, there is a need to consider the entire SSC and use a systems approach in line with the SDGs. This study shows that the SFDGs can be used to assess the management of sanitation at the school level.
A new method was developed to avoid double counting of the pupils and to split the pupils’ annual flows between their home and school. To do this an in-depth understanding of school sanitation and pupil usage was required for the case study area. The results showed that the level of school sanitation usage is linked to the cleanliness of the toilet facility. In turn, this is connected to the O&M and funding issues, again highlighting the need to focus beyond sanitation infrastructure, as the presence of a toilet facility does not equate to its usage.
The developed method highlights the importance of where people spend their time during the day and how this is related to the different sanitation systems they use. A greater understanding of this relationship is needed to obtain a complete picture of the citywide sanitation landscape. It has been hypothesized that flows from work-based sanitation systems may have the biggest impact on the city sanitation landscape in terms of non-household toilets. The focus of citywide sanitation needs to move beyond household sanitation. To do this, more information is needed on the population’s sanitation practices. This would then enable their excreta flows to be split between different facilities. An example of such redistribution is presented in this paper. This work demonstrates how different flows from institutional facilities can be incorporated in SFDGs at the citywide level. Currently, the SFD tool cannot show where the excreta flows originate, which could be achieved using different colors in the graphic to indicate whether the source of the excreta flow is a household or an institution.
The datasets presented in this study can be found in online repositories. The name of the repository and accession number can be found below: https://doi.org/10.25831/np66-xg34.
The studies involving humans received ethical approval from the IHE, Delft, Netherlands (IHE-RECO-2022-003). The studies were conducted in accordance with all local legislations and institutional requirements. Written informed consent for participation in this study was provided by each participant’s legal guardian/next of kin.
WN: data curation, formal analysis, investigation, methodology, visualization, writing–original draft, and writing–review and editing. CF: conceptualization, data curation, formal analysis, methodology, project administration, resources, supervision, visualization, writing–original draft, and writing–review and editing. BR: formal analysis, methodology, and writing–review and editing. DB: funding acquisition, supervision, and writing–review and editing.
The authors declare that financial support was received for the research, authorship, and/or publication of this article. This research was undertaken while studying for an MSc in Sanitation at the IHE Delft Institute for Water Education, The Netherlands, with a scholarship funded by the Bill and Melinda Gates Foundation (grant numbers OPP1157500 and INV-009151).
The authors wish to extend special thanks to the Bill and Melinda Gates Foundation (BMGF); the IHE Institute for Water Education; and the Training, Research and Networking for Development (TREND) group, particularly the Managing Director and staff assigned to support the data collection in Ghana. The authors would also like to thank the participants in this study, whose involvement made this research possible.
Author WN was employed by the Lusaka Water Supply and Sanitation Company.
The remaining authors declare that the research was conducted in the absence of any commercial or financial relationships that could be construed as a potential conflict of interest.
All claims expressed in this article are solely those of the authors and do not necessarily represent those of their affiliated organizations or those of the publisher, editors, and reviewers. Any product that may be evaluated in this article or claim that may be made by its manufacturer is not guaranteed or endorsed by the publisher.
The Supplementary Material for this article can be found online at: https://www.frontiersin.org/articles/10.3389/fenvs.2024.1473729/full#supplementary-material
Abigail, A. H., Anwazzi, E. E., Gabriel, A. U., and Ibrahim, Z. A. (2012). An assessment of toilet facilities in secondary schools in jos north local government area of plateau state. 2, 091, 094. doi:10.15580/gjer.2012.4.110112199
Accra Metropolitan Assembly (AMA). (2020). The city of Accra on the implementation of the 2030 agenda for sustainable - development and african union agenda 2063 2020 voluntary local review (VLR) report. Available at: https://www.uneca.org/sites/default/files/TCND/voluntary-local-reviews-africa/Accra-VLR.pdf. Accessed December 11, 2023.
African Union, UNICEF. (2020). Transforming education in Africa. Available at: https://au.int/sites/default/files/documents/40839-doc-Transforming_Education_in_Africa_-_sum_-_English.pdf. Accessed November 11, 2023.
Barakat, A. (2020). Groundwater NO3 concentration and its potential health effects in Beni Moussa perimeter (Tadla plain, Morocco). Geoenvironmental Disasters 7, 14. doi:10.1186/s40677-020-00149-9
Baum, R., Luh, J., and Bartram, J. (2013). Sanitation: a global estimate of sewerage connections without treatment and the resulting impact on MDG progress. Environ. Sci. & Technol. 47, 1994–2000. doi:10.1021/es304284f
Boadi, G. F. (2019). Faecal sludge management in Accra: classification of Latrine technologies and excreta pathways. Available at: https://www.academia.edu/42604794/KWAME_NKRUMAH_UNIVERSITY_OF_SCIENCE_AND_TECHNOLOGY_KNUST_KUMASI_Faecal_Sludge_Management_in_Accra_Characterisation_of_Latrine_Technologies_and_Excreta_Pathways?auto=download. Accessed June 6, 2023.
Chatterley, C., Linden, K. G., and Javernick-Will, A. (2013). Identifying pathways to continued maintenance of school sanitation in Belize maintenance of school sanitation in Belize. J. Water, Sanitation Hyg. Dev. 3, 411–422. doi:10.2166/washdev.2013.128
Colan-Consult (2020). Greater Accra sustainable sanitation and livelihoods improvement Project (GASSLIP). Accra, Ghana: Retrieved from Accra: TREND Group.
Decosas, J., Dramaix, M., Obeng-Amoako, G. O., and Decosas, H. (2018). The situation of adolescents in Ghana UNICEF, KOICA. Available at: https://www.unicef.org/ghana/media/4101/file/Situation%20Analysis (Accessed June 12, 2024).
DRI Sleeper. (2017). My child goes to the toilet a lot in the day: is this why they wet the bed at night? Available at: https://dri-sleeper.com/blogs/bedwetting/my-child-goes-to-the-toilet-a-lot-during-the-day-is-this-why-they-wet-the-bed-at-night. Accessed October 11, 2023.
Duijster, D., Monse, B., Marquez, M., Pakes, U., Stauf, N., and Benzian, H. (2022). Improving toilet usability and cleanliness in public schools in the Philippines using a packaged operation and maintenance intervention. Int. J. Environ. Res. public health 19, 10059. doi:10.3390/ijerph191610059
Evans, B., and Saywell, D. (2006). Sanitation 21 task force sanitation 21: simple approaches to complex sanitation-A draft framework for analysis. Available at: https://www.ircwash.org/sites/default/files/IWATaskForceonSanitation-2006-Sanitation21.pdf. Accessed May 19, 2024.
Furlong, C. (2015). SFD report kumasi, Ghana 2015. Available at: www.sfd.susana.org (Accessed February 01, 2024).
Gambrill, M., Gilsdorf, R. J., and Kotwal, N. (2020). Citywide inclusive sanitation—business as unusual: shifting the paradigm by shifting minds. Front. Environ. Sci. 7, 201. doi:10.3389/fenvs.2019.00201
Garn, J. V., Caruso, B. A., Drews-Botsch, C. D., Kramer, M. R., Brumback, B. A., Rheingans, R. D., et al. (2014). Factors associated with pupil toilet use in Kenyan primary schools. Int. J. Environ. Res. public health 11 (9), 9694–9711. doi:10.3390/ijerph110909694
Ghana Education Org (GEO) (2022). General timetable for basic 7. Available at: https://ghanaeducation.org/general-timetable-for-basic-7-download-now/?expand_article=1 Accessed February 20, 2024.
Ghana Education Service (GES) (2020). Education management information system, 2019/2020. Ghana: GES.
Ghana Statistical Service (GSS) (2019). Ghana living standards survey. Available at: https://www.statsghana.gov.gh/gssmain/fileUpload/pressrelease/GLSS7%20MAIN%20REPORT_FINAL.pdf. Accessed April 20, 2023.
Ghana Statistical Service (GSS) (2021c). Ghana 2021 population and housing census, age and sex profile. Available at: https://www.statsghana.gov.gh/gssmain/fileUpload/pressrelease/2021%20PHC%20General%20Report%20Vol%203B_Age%20and%20Sex%20Profile_181121.pdf. Accessed December 12, 2023.
Ghana Statistical Service (GSS) (2021a). Ghana 2021 population and housing census, Population of Regions and Districts. Available at: https://statsghana.gov.gh/gssmain/fileUpload/pressrelease/2021%20PHC%20General%20Report%20Vol%203A_Population%20of%20Regions%20and%20Districts_181121.pdf. Accessed June 12, 2023.
Ghana Statistical Service (GSS) (2021b). Ghana 2021 population and housing census, Water and Sanitation. Available at: https://statsghana.gov.gh/gssmain/fileUpload/pressrelease/Volume%203M_Water%20and%20Sanitation_240222a.pdf. Accessed May 20, 2024.
Ghana Students (2022). GES academic calendar for KG, JHS & SHS 2022. Available at: https://ghstudents.com/ges-academic-calendar/Last (Accessed June 23, 2022).
Hagan, G. B., Minkah, R., Yiran, G. A. B., and Dankyi, E. (2022). Assessing groundwater quality in periurban Accra, Ghana: implications for drinking and irrigation purposes. Groundwater Sustain. Dev. 17, 100761. doi:10.1016/j.gsd.2022.100761
Harvey, P., and Adenya, E. (2009). An assessment of sanitation and hygiene in primary schools in Zambia. Addis Ababa, Ethiopia: Loughborough University. Available at: https://hdl.handle.net/2134/28633.
Holbech, L. H., and Cobbinah, C. C. (2021). Pollution or protection - what early survey data shows on rapid waterbird utilisation of a newly established sewage treatment plant in urban Ghana, west Africa on rapid waterbird utilisation of a newly established sewage treatment plant in urban Ghana, west Africa. Wetlands 41, 110. doi:10.1007/s13157-021-01510-w
Lüthi, C., Willetts, J., and Hoffmann, S. (2020). Editorial: city-wide sanitation: the urban sustainability challenge. Front. Environ. Sci. 8. doi:10.3389/fenvs.2020.585418
Martinez, L. F. (2016). Using the SFD methodology for modelling future scenarios in kumasi, Ghana, Loughborough, UK: MSc Dissertation, WEDC.
Mazeau, A. P., Reed, B., Sansom, K., and Scott, R. (2014). Selection and use determinants of shared toilet facilities in Ashaiman. Ghana: Loughborough University. Available at: https://hdl.handle.net/2134/24032.
Mills, F., Willetts, J., Evans, B., Carrard, N., and Kohlitz, J. (2020). Costs, climate and contamination: three drivers for citywide sanitation investment decisions. Front. Environ. Sci. 8. doi:10.3389/fenvs.2020.00130
Nahmod, N. G., Lee, S., Buxton, O. M., Chang, A. M., and Hale, L. (2017). High school start times after 8:30 am are associated with later wake times and longer time in bed among teens in a national urban cohort study. Sleep. Health 3 (6), 444–450. doi:10.1016/j.sleh.2017.09.004
Nkonde, W. (2022). The impact of school sanitation on citywide sanitation, A case study of Accra, Ghana, Thesis for Masters of Science in Sanitation at IHE Delft.
Onukwue, A. (2022). Sub-Saharan Africa is the only region where out-of-school children keep increasing. Available at: https://qz.com/sub-saharan-africa-is-the-only-region-where-out-of-scho-1849497164. Accessed May 12, 2024.
Peal, A., Evans, B., Ahilan, S., Ban, R., Blackett, I., Hawkins, P., et al. (2020). Estimating safely managed sanitation in urban areas; lessons learned from a global implementation of excreta-flow diagrams. Front. Environ. Sci. 8. doi:10.3389/fenvs.2020.00001
Peal, A., Evans, B., Blackett, I., Hawkins, P., and Heymans, C. (2014). Fecal sludge management (FSM): analytical tools for assessing FSM in cities. J. Water, Sanitation Hyg. Dev. 4 (3), 371–383. doi:10.2166/washdev.2014.139
Reid, A., Maldonado, C., and Baker, F. (2002). Sleep behavior of South African adolescents. Sleep 25, 417–421. doi:10.1093/sleep/25.4.417
Ritchie, H., Sambrosk, V., and Rosser, M., (2024). Urbanization. Our world in data. Available at: https://ourworldindata.org/urbanization. Accessed May 7, 2024.
Safi, F., Furlong, C., Luthra, B., Rohilla, S. K., and Brdjanovic, D. (2022). Monitoring progress in citywide sanitation. Front. Environ. Sci. 9. doi:10.3389/fenvs.2021.751534
Sato, T., Qadir, M., Yamamoto, S., Endo, T., and Zahoor, A. (2013). Global, regional, and country level need for data on wastewater generation, treatment, and use. Agric. Water Manag. 130, 1–13. doi:10.1016/j.agwat.2013.08.007
Schmitt, M. L., Clatworthy, D., Ratnayake, R., Klaesener-Metzner, N., Roesch, E., Wheeler, E., et al. (2017). Understanding the menstrual hygiene management challenges facing displaced girls and women: findings from qualitative assessments in Myanmar and Lebanon. Confl. health 11 (1), 19–11. doi:10.1186/s13031-017-0121-1
Schrecongost, A., Pedi, D., Rosenboom, J. W., Shrestha, R., and Ban, R. (2020). Citywide inclusive sanitation: a public service approach for reaching the urban sanitation SDGs sanitation: a public service approach for reaching the urban sanitation SDGs. rontiers Environ. Sci. 8. doi:10.3389/fenvs.2020.00019
Scott, P., and Cotton, A. P. (2020). The sanitation cityscape–toward a conceptual framework for integrated and citywide urban sanitation. Front. environ. sci. 8, 70. doi:10.3389/fenvs.2020.00070
Sewerage Systems Ghana Limited (SSGL) official website (2017). Available at: https://www.seweragesystems.com/index.php/our-plant/kotoku-plant.htm. Accessed May 1, 2024.
Shao, T., Zhao, J., Hu, H., and Zhang, Q. (2021). Analysis of factors affecting students going to school toilets in a rural primary school in China. BMC Public Health 21 (1), 32. doi:10.1186/s12889-020-10099-4
Shit Flow Diagram (SFD) (2024). SFDs for cities worldwide. Available at: https://sfd.susana.org/about/worldwide-projects. Accessed May 20, 2024.
Shit Flow Diagram (SFD) PI. (2018). SFD manual (Vol. 1 & 2): SuSanA. Available at: https://www.susana.org/_resources/documents/default/3-2357-7-1529046600.pdf. Accessed May 20, 2024.
Sky News Gh (SNG) (2022). Sky news Ghana: trusted educational news. Available at: https://skynewsgh.com/accra-girls-senior-high-school-courses-and-details/. Accessed May 20, 2024.
UNESCO Institute of Statistics (2017). More than one-half of children and adolescents are not learning worldwide. UIS/FS/2017/ED/46.
UNESCO Institute of Statistics (2024). World education statistics. Available at: https://tcg.uis.unesco.org/wp-content/uploads/sites/4/2024/09/World-Education-Statistics-2024.pdf (Accessed May 20,2024).
UNICEFWHO (2022). Progress on drinking water, sanitation and hygiene in schools: 2000-2021. New York.
United Nations (2019). Transforming our world: the 2030 agenda for sustainable development. New York: United Nations, Department of Economic and Social Affairs.
WASHData (2024a). Available at: https://washdata.org/monitoring/schools. Accessed October 10, 2024.
WASHData (2024b). Available at: https://washdata.org/monitoring/health-care-facilities. Last accessed Accessed October 10, 2024.
White, T. (2021). Figure of the week: education participation rates in Africa increase, with some caveats. Washington, DC: Retrieved from Brookings Institution United States of America: Available at: https://policycommons.net/artifacts/4142507/figure-of-the-week/4950934/on2. Accessed May 21, 2024.
World Health Organisation (WHO), (2018). Guidelines on sanitation and health. Geneva: World Health Organization; Available at: https://iris.who.int/bitstream/handle/10665/274939/9789241514705-eng.pdf?sequence=25. Accessed May 20, 2024.
Keywords: citywide inclusive sanitation, fecal sludge management, sanitation value chain, sanitation tools, shit flow diagram, urban sanitation
Citation: Nkonde W, Furlong C, Reed B and Brdanovic D (2025) Assessing institutional sanitation and its impact at a citywide level: an exploration of school sanitation in the Accra Metropolitan Area, Ghana. Front. Environ. Sci. 12:1473729. doi: 10.3389/fenvs.2024.1473729
Received: 31 July 2024; Accepted: 21 November 2024;
Published: 22 January 2025.
Edited by:
Björn Vinnerås, Swedish University of Agricultural Sciences, SwedenReviewed by:
Jim Wright, University of Southampton, United KingdomCopyright © 2025 Nkonde, Furlong, Reed and Brdanovic. This is an open-access article distributed under the terms of the Creative Commons Attribution License (CC BY). The use, distribution or reproduction in other forums is permitted, provided the original author(s) and the copyright owner(s) are credited and that the original publication in this journal is cited, in accordance with accepted academic practice. No use, distribution or reproduction is permitted which does not comply with these terms.
*Correspondence: William Nkonde, d2lsbGlhbW5rb25kZUBnbWFpbC5jb20= Claire Furlong, Yy5mdXJsb25nQHVuLWloZS5vcmc=
†These authors have contributed equally to this work and share first authorship
Disclaimer: All claims expressed in this article are solely those of the authors and do not necessarily represent those of their affiliated organizations, or those of the publisher, the editors and the reviewers. Any product that may be evaluated in this article or claim that may be made by its manufacturer is not guaranteed or endorsed by the publisher.
Research integrity at Frontiers
Learn more about the work of our research integrity team to safeguard the quality of each article we publish.