- 1Key Laboratory of Xinjiang Coal Resources Green Mining, Ministry of Education, Xinjiang Institute of Engineering, Urumqi, China
- 2School of Energy Engineering, Xi’an University of Science and Technology, Xi’an, China
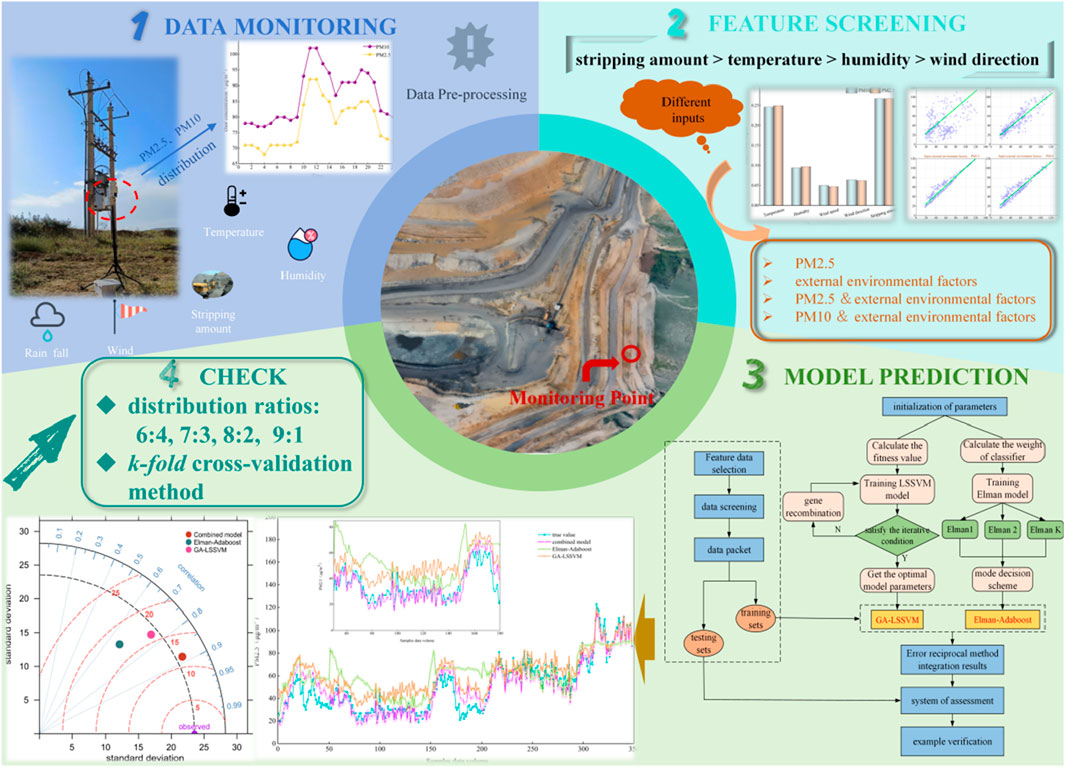
The prediction of dust concentration in open-pit mine is a critical foundation for minimising dust pollution. In order to improve the prediction accuracy of dust concentration in an open-pit mine, the combined prediction algorithm model of GA-LSSVM and Elman-Adaboost based on the integration of error reciprocal approach was investigated. Firstly, the monitoring equipment of dust concentration and meteorological factors was installed in the open-pit mine site to collect important data, and the distribution law of dust concentration, meteorological and production intensity data was analyzed. The mutual information feature screening algorithm was utilised to efficientlyly remove the redundant and disruptive model prediction performance. The characteristic variables, according to the importance of information, select four indicators of stripping amount, temperature, humidity and wind direction, and then determine the input variables of the prediction model. The dust concentration prediction model was then developed using the genetic algorithm optimised least squares support vector machine (GA-LSSVM) and the Elman neural network optimised adaptive enhancement algorithm (Elman-Adaboost) models. The final prediction results were integrated using the error reciprocal method, and then the combined prediction model of dust concentration in open-pit mine in winter was constructed. Finally, the sample data is divided into a training set and a testing set in a 7:3 ratio to predict dust concentration, and the model evaluation index and test method are proposed. The results show that, using PM2.5 as an example, the model’s input variables are historical PM2.5 concentration data and external environmental factors selected based on mutual information. The evaluation indexes of the model include the correlation coefficient R2, root mean square error RMSE, and standard deviation SD. The combined model had an R2 of 0.893, RMSE of 11.697, and SD of 22.174. Compared to the GA-LSSVM model and Elman-Adaboost models, the R2 increased by 24.5% and 41.2% respectively, while the RMSE decreased by 31.0% and 36.7% respectively. When compared to the original sample data set SD (23.528), it is evident that the combined model clearly has higher prediction accuracy.
Highlights
• The distribution law of dust concentration, meteorology, and production intensity in an open-pit mine was analyzed.
• The mutual information feature screening algorithm is proposed to construct the dust concentration prediction index set.
• The GA-LSSVM and Elman-Adaboost combined prediction algorithm model integrated by the error reciprocal method is established.
• The combined model has high prediction accuracy.
1 Introduction
Open-pit mining generates productive dust at all stages of production, including drilling. This type of dust remains suspended in the air for long periods of time, This type of dust remains suspended in the air for long periods of time, reducing visibility in the workplace and endangering the open-pit mine environment. Furthermore, due to variations in dust’s physical and chemical properties, exposure can cause a variety of pathological changes in the body, raising the risk of serious occupational diseases such as pneumoconiosis. Currently, dust pollution and occupational hazards associated with dust in open-pit mines have emerged as major industry challenges that require immediate attention (Xiao et al., 2023a; Xiao et al., 2024; Xiao et al., 2023b). However, the complexity of the open-pit mining environment, the randomness and uncertainty of dust, significantly reduce the accuracy of predicting future trends in dust concentration (Jiang et al., 2022). Therefore, the urgent development of an accurate predictive model for the concentration of dust in open-pit mines can effectively prevent and control the generation of dust, provide.
Scholars both domestically and internationally have been devoted to developing effective and precise techniques for predicting dust concentration. Numerous studies have been conducted on the prediction of dust concentration. These methods can be divided into two main categories: statistical tools and machine learning algorithms (Dong et al., 2019). Additionally, due to the potential coupling relationships among multiple influencing factors of dust. This indirectly leads to continuous fluctuations in the input variables of the predictive indicators. Therefore, we will analyze existing research by focusing on the model approach and the predictive input. For example, Balaga et al. (2021). developed a functional model based on a power function by analyzing dust particle distribution characteristics. This model can predict mine dust even in the absence of empirical data. Wang et al. (2021) proposed the ARIMA prediction model based on a time series of mine dust concentration. Using the Bayesian information criterion, they compared the benefits and drawbacks of the models and chose the best model to improve prediction accuracy. Sastry et al. (2015) utilized various statistical tools to construct mathematical models for predicting and analyzing the dispersion of dust during drilling operations in an open-pit coal mine. While a single dust concentration time series can represent the regression prediction of dust concentration data for a future period, these methods, while simple and user-friendly. The main reliance is on the mathematical description of the dispersion extent of a single dust concentration, constrained by various factors such as geographical conditions (Dong et al., 2022), may fail to capture all external influences on dust concentration data in open-pit mines. As a result, the predicted outcomes may have limited reference significance.
In order to overcome the limitations of traditional prediction models, machine learning algorithms that are adept at handling multiple variables, such as neural networks, support vector machines (Sun et al., 2023), and meteorological factors are currently known to have a significant impact on dust suspended in the air (Lin et al., 2021). Meteorological factors must be considered when predicting dust concentrations in open-pit mines. Many scholars have addressed this issue and used meteorological factors as input variables in their prediction models. Lu et al. (2021) analyzed the regression prediction of PM2.5 in open-pit mines by employing different time intervals and utilizing particle swarm optimization gradient enhancement machine. Yan et al. (2023) for example, considered the main factors influencing dust concentration and used an Elman neural network model to analyze and predict the changing trend of dust concentration in bucket shovels in deep open-pit mines. Qi et al. (2020) used PM and individual meteorological data as model input variables and proposed a hybrid algorithm using particle swarm optimization RF. The results showed that the algorithm had a high prediction performance. Liu et al. (2023) investigated the dust concentration and meteorological environment data collected in the open-pit mine, as well as the causes of the dust concentration changes. They developed a dust concentration prediction model based on an LSTM neural network. The findings revealed significant variations in dust concentration characteristics across seasons. The model’s prediction results showed a fitting degree of approximately 0.88, with a small prediction error. Hoven (Wen et al., 2021) et al. analyzed and ranked the influencing factors of dust concentration based on feature importance. Among them, relative humidity had the greatest impact on the prediction effect. Building on this finding, they developed a random forest algorithm prediction model that takes into account external environmental factors, allowing them to predict PM2.5, PM10, and TSP dust concentrations in open-pit mines. Chen et al. (2020) used the Hammerstein recurrent neural network (CHRNN) prediction model and selected time and meteorological factors as input variables to predict PM2.5 concentration. However, in the production environment of open-pit mines, dust concentration is influenced not only by meteorological factors, but also by the mine’s operating conditions. To accurately forecast future dust concentration trends in open-pit mines, the established model should take into account a variety of factors such as meteorological parameters and production intensity. For example, Wang Zhiming et al. (2023) used weather forecast data and mine production data as model inputs, combined six optimization algorithms to improve the RF algorithm, and developed a new model for predicting daily dust concentration in open-pit mines. It is worth noting that there has been little research into the production intensity of open-pit mines as an input variable in the dust prediction model. This could be because the mining intensity of open-pit mines fluctuates, making it difficult to quantify production data.
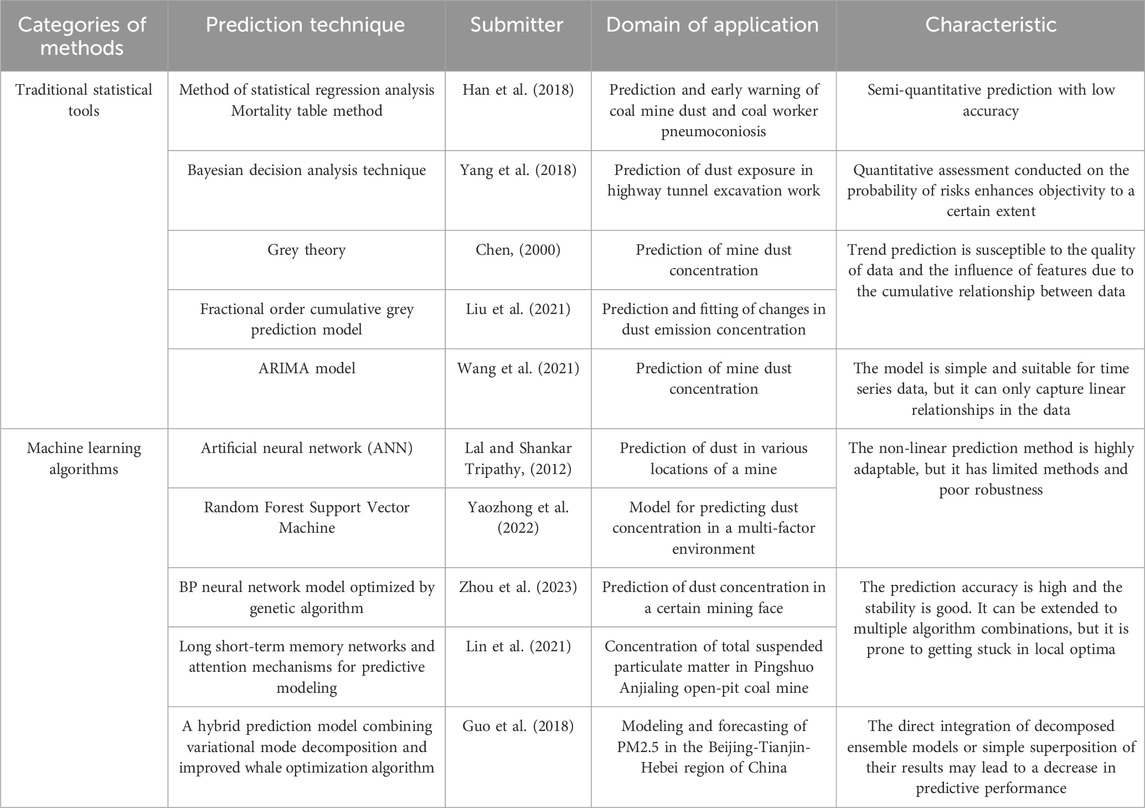
To summarize, a multitude of studies have been carried out to forecast the levels of dust concentration in open-pit mines. Previous prediction models predominantly relied on established index parameters to estimate the concentration of dust. The input index has transitioned from a solitary time series data of dust concentration to a comprehensive multi-index. The prediction method has evolved from an initial mathematical statistical tool to a machine learning algorithm that is extensively employed for managing multivariate data. Identifying the key factors that influence dust concentration in open-pit mines is difficult due to the intricate and unpredictable internal environment. When dealing with the prediction of multiple data features, statistical tools and machine learning algorithms each have their own strengths and weaknesses (Table 1). The lack of research on the time series of dust concentration in open-pit mines hampers the development of dust concentration prediction models. Therefore, it is necessary to make reasonable choices regarding the factors and models that influence dust concentration and propose more scientific prediction methods to effectively improve prediction performance (Dong et al., 2024).
In order to optimize the use of data and reduce the impact of personal biases, this study utilizes a mutual information feature selection algorithm to evaluate the effects of various environmental factors on dust concentration data. The objective of this approach is to guarantee the impartiality of selecting prediction indices and to establish a systematic prediction index system for measuring dust concentration in open-pit mines. The study employs the Genetic Optimization Least Squares Support Vector Machine (GA-LSSVM) model and the Elman Neural Network Optimization Adaptive Enhancement Algorithm (Elman-Adaboost) model to forecast the dust concentration in the open-pit mine. Therefore, the error reciprocal method is chosen to integrate the final prediction results by weight, resulting in the construction of a combined prediction model for dust concentration in a winter open-pit mine. This presents a novel approach for forecasting the amount of dust in an open-pit mine.
2 Materials and methods
2.1 Mine overview
Weijiamao Open-pit Coal Mine is located in the southeast of Jungar Coalfield, which is owned by North United Electric Power Co., Ltd. The majority of the mining area is covered in Quaternary loess and aeolian sand, leaving only the bedrock exposed in the local beam top or gully. The Weijiamao Open-pit Coal Mine began construction in 2009, with stripping using a single bucket-truck intermittent process and coal mining using a single bucket-truck-semi-fixed crushing station-belt conveyor semi-continuous process, with a design production capacity of 6 million t/year. The open-pit mine is located in a typical continental arid climate zone, with cold winters, hot summers, a large temperature difference between day and night, and low total rainfall. The annual average temperature ranges from 5.0°C to 7.8°C, with minimum temperatures as low as −37°C. In general, the freezing season lasts from October to April the following year, with the majority of rainfall falling between June and September. The rainiest months are July and August, with annual total precipitation ranging from 231 to 459mm, accounting for 25.2% of total annual precipitation (Zhang, 2019). Because of the perennial drought climate and low relative humidity in the air at Weijiamao Open-pit Coal Mine, a large amount of dust generated during daily production is easily accumulated and causes serious dust pollution. As a result, selecting an open-pit mine for dust concentration prediction research can provide a useful theoretical reference.
2.2 Data acquisition
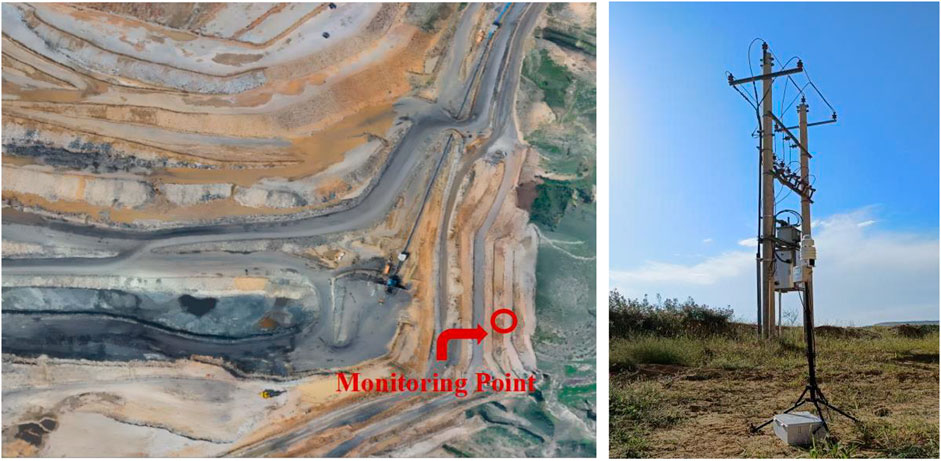
Based on existing literature, the data set for the prediction model in this paper consists primarily of dust concentration data and meteorological data with a time interval of 10 min recorded by the winter monitoring of Weijiamao Open-pit Coal Mine, as well as production intensity (stripping amount) data provided by the open-pit mine’s production department. The monitoring point is located on the 1,112 level of the eastern end of the open-pit mine, near the slope top line, as shown in Figure 1. PM2.5, PM10, temperature, humidity, wind speed, wind direction, rainfall, and stripping amount are among the 1,160 data sets presented. Table 2 shows the data monitoring variables and their technical parameters.
2.3 Data pre-processing
The quality of the sample data has a direct impact on the analysis of subsequent data changes and the model’s prediction effect, so preprocessing is critical. Observing the obtained data reveals that there are missing and abnormal conditions. This could be due to the original data in the real-time monitoring process experiencing equipment power failures, network delays, and other issues resulting in storage failures, as well as external factors such as bad weather causing missing and abnormal data (Xia et al., 2020). Furthermore, due to the comprehensive nature of the monitoring data, which includes multiple variables with different dimensions and levels, the model training process must avoid interference from extreme data values. As a result, this paper focuses primarily on preprocessing the data in three areas: handling missing values, addressing outliers, and standardizing the data.
2.3.1 Missing, abnormal value processing
The presence of missing values makes complete data analysis difficult, resulting in the loss of some useful information in data mining modeling, which is detrimental to the development of robust models. Data comparison reveals that some data are missing between 17:10 and 18:50 on 30 January 2024. The direct deletion and interpolation methods are the most commonly used for restoring and repairing this type of data. Given the continuous nature of the monitoring data in this paper, and the total number of missing data is 11 groups, the mean interpolation method is used to fill the gaps.
In the formula,
The method for processing abnormal values is similar to that used for processing missing values. The sample data is time series data, so there is a logical relationship between adjacent data. To ensure the integrity of the relevant data as much as possible, the average value of the adjacent data from Equation 1 is used to correct the abnormal value.
2.3.2 Data standardization
Data standardization processing can accelerate the convergence effect of the model and reduce the adverse effects of the difference in dimensional levels on the training of the prediction model. In this paper, the deviation standardization method (Min-Max standardization) is used to linearly transform the original data, and the values are mapped to [0,1], but the linearity and periodicity of the data are not changed. Please refer to Equation 2 for further details.
In the formula,
2.3.3 Data processing result
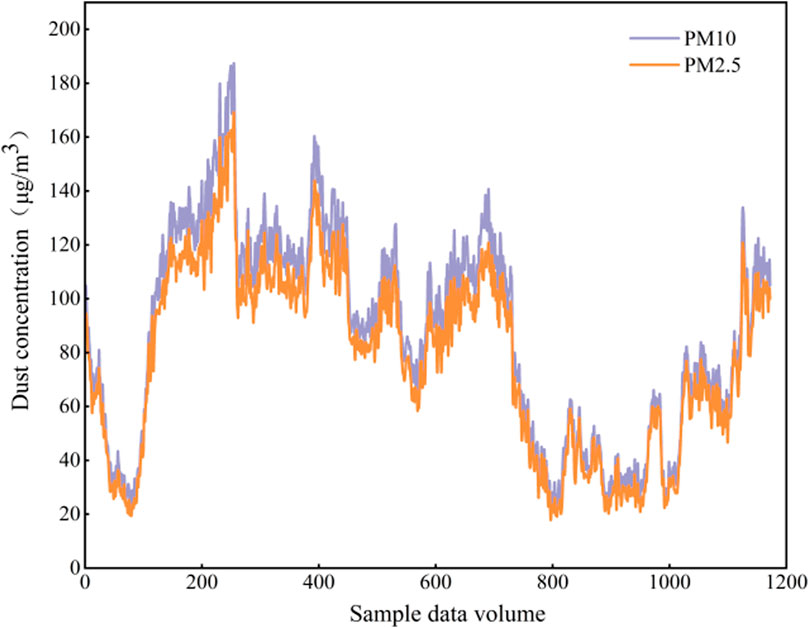
To ensure the suitability of the sample data for further research, the missing data is first supplemented. Then, the abnormal data is detected and identified, and the original data is corrected and smoothed using the mean interpolation method. This process enhances the reliability of the analysis results. Figure 2 displays the outcomes of the data processing. After undergoing preprocessing, any invalid and non-standard data are eliminated, and data redundancy is reduced. This results in a smoother data trend, increased accuracy in overall prediction, and enhanced fitting of subsequent prediction findings.
2.4 Data analysis
2.4.1 Analysis of distribution law
(1) Distribution of dust concentration data.
Figure 3 depicts the variation characteristics of PM10 and PM2.5 mass concentrations that were monitored on site. The figure shows that the mass concentrations of PM10 and PM2.5 range from 20 to 191 μg/m³ and 18–171 μg/m³. The overall data show a certain fluctuation, in which the change trend of PM10 and PM2.5 is relatively consistent, with a strong correlation, and the overall trend is presented as ‘two peaks and two valleys'.
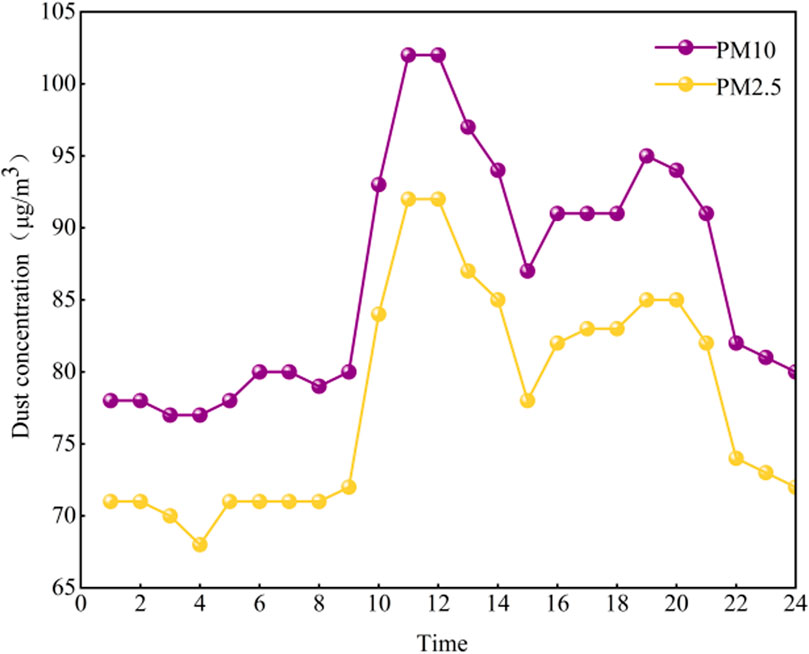
To investigate the dust concentration change rule further, the data is processed every hour, as shown in Figure 4. The hourly concentration changes of PM10 and PM2.5 are not significantly different from the concentration changes every 10 min. The dust concentration is relatively stable from 0o to 9 o’clock, but then rapidly increases from 9o to 11 o’clock. The maximum values of PM10 and PM2.5 are 102 and 92 μg/m³, respectively. In the winter, the dust concentration fluctuates after 11 o’clock.
This situation could be caused by the sun gradually rising between 0o and 9 o’clock, resulting in a static and stable atmosphere in the stope pit. This prevents air exchange with the outside world, making it difficult for particulate matter to diffuse, resulting in minimal changes in PM values during this time. Solar radiation increases between 9:00 and 11:00 a.m. during the cold winter months. Although rising temperatures can increase ground turbulence, dust particles are still difficult to disperse due to the low temperature environment. As production intensifies, dust concentrations rise. The presence of a specific airflow in the stope influences dust migration and diffusion (Peng, 2020). It resulted in a sharp decrease in dust concentration between 12:00 and 15:00; after that, the mine could not be directly exposed to the sun, the wind speed decreased, the relative humidity increased, and the mass concentration of particulate matter fluctuated.
(2) The Distribution law of meteorological and stripping data.
Table 3 describes the overall distribution of meteorological and stripping amount data using descriptive statistical analysis in this paper, with the goal of better understanding the distribution pattern of meteorological and stripping amount data. The analysis reveals that the mine has low temperatures and humidity in winter, with temperature ranging from −16.60°C to 9.10°C and humidity ranging from 22.90 to 89.40%RH. The temperature and humidity show opposing trends, Temperature and humidity show opposing trends, consistent with meteorological principles. Throughout the monitoring period, there was no rainfall, and the natural wind speed averaged 1.47 m/s. Because of the location of the Weijiamao open-pit mine, the prevailing wind directions in winter are northeast and southeast. According to data provided by the mine’s production department, stripping amount data is converted from daily to 10 min intervals. The stripping amount of data is typically in the 0.02 million square meter range.
2.4.2 Feature screening
In the field of open-pit mine dust prediction, not all features contribute equally to improving the model’s performance. Identifying the significant features in multivariate time series can effectively eliminate redundant variables that disrupt the model’s predictive performance. This process helps reduce the complexity of model prediction and mitigates the risk of overfitting. Therefore, feature screening is a critical preprocessing step. This study utilizes the mutual information feature selection algorithm to rank the importance of factors influencing dust concentration. This approach relies on information theory to assess the significance of relationships between variables. A higher mutual information value indicates a stronger correlation between the variables (Zhang et al., 2024). The specific methods are outlined below. See Equation 3.
For any two random variables X and Y, the expression for mutual information
Among them,
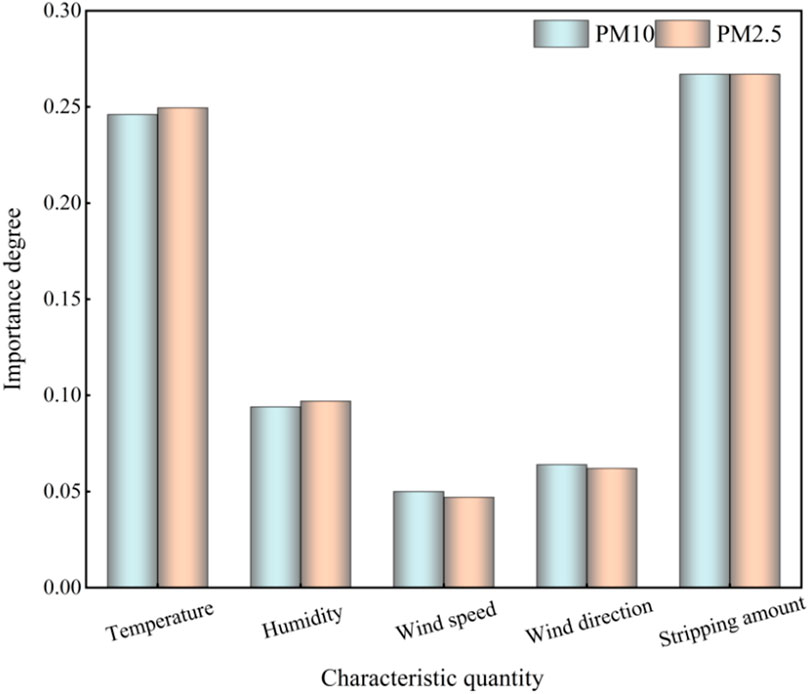
Figure 5 shows the results of mutual information feature screening. It reveals that the key factors in the screening of PM10 and PM2.5 features are ranked as follows: stripping amount > temperature > humidity > wind direction > wind speed.
Due to the absence of rainfall throughout the monitoring period, and the presence of high levels of humidity and rainfall, it was determined that rainfall was the primary influencing factor on humidity. Furthermore, during the monitoring period, the fluctuation in wind direction exhibited a significant variability in comparison to wind speed. As a result, wind direction played a more crucial role than wind speed in determining the external environmental factors affecting dust concentration. Based on the quantitative screening results of mutual information, the preliminary identification of the multi-input environmental variables for the winter dust concentration prediction model of the open-pit mine includes stripping amount, temperature, humidity, and wind direction.
2.5 Model construction
2.5.1 GA-LSSVM model
The Least Squares Support Vector Machine (LSSVM) model is a variant of the Support Vector Machine (SVM) that addresses the unequal constraint defects of SVM and facilitates the resolution of linear equations. This model enhances both solution efficiency and convergence accuracy (Li et al., 2022; Zhiyuan et al., 2023). The LSSVM model can be expressed as. See Equations 4–9.
In the formula, y represents the value of the output variable, w stands for the weight,
The LSSVM optimization model is then obtained.
In the formula, J represents the deviation value of the predicted output variable,
The Lagrangian function is expressed as.
In the formula, L is the Lagrangian function,
By eliminating the
In the formula, I is the unit matrix, l is the input data of the KKT condition, and
In the formula,
The LSSVM model can be obtained by solving:
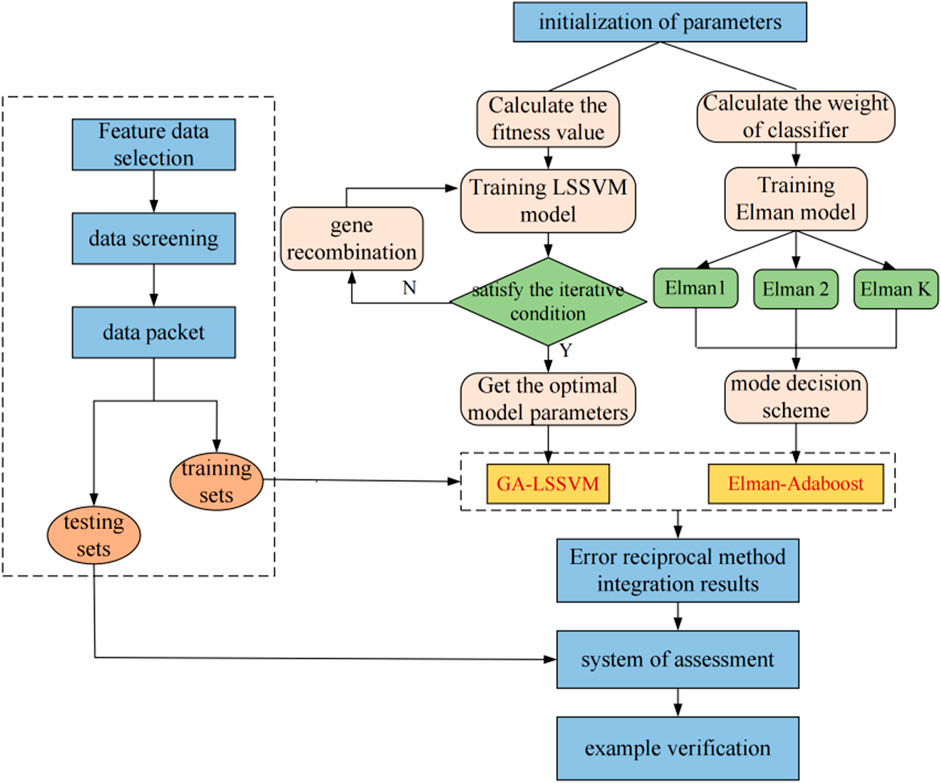
In this paper, a genetic algorithm (GA) is used to optimize the least squares support vector machine (LSSVM) model by adjusting the relationship between the model and the parameters. The specific steps are as follows: ① Select training and test samples to achieve gene coding of
2.5.2 Elman-Adaboost model
The Elman algorithm is a specific form of recurrent neural network. The structure of a neuron is composed of four distinct layers: the input layer, hidden layer, context layer, and output layer. This network distinguishes itself from the BP neural network by integrating a distinctive context layer that possesses a dynamic memory function. This addition significantly improves the network’s capacity to handle dynamic data and selectively eliminate external interferences. See Equations 10–17.
The space of the nonlinear state of an Elman network is expressed as:
In the formula, y represents the ranging distance; x represents the middle layer node; u represents the multi-scale wavelet energy difference;
Adaboost is an adaptive enhanced ensemble iterative algorithm that assigns weak classifiers and sample weights to construct strong learners. The model has a simple structure and can repeatedly train the output prediction samples of Elman neural network. It can handle continuous values and has significant advantages in reducing deviation and improving learning accuracy (Wang Yongqi et al., 2023). The core steps are.
(1) Training sample weight initialization.
In the formula,
(2) Set k weak predictors according to the time and accuracy requirements.
(3) Calculate the prediction error:
In the formula,
(4) The calculation formula of weak predictor performance weight is:
(5) The obtained weight
In the formula, Z represents the normalization factor;
(6) After N cycles of training on weak predictors, the strong predictor function is obtained by combining them. The calculation formula is as follows:
In the formula,
2.5.3 Prediction result integration
In order to enhance the prediction accuracy of the model, the above algorithm assigns different weights using the error reciprocal method. Subsequently, a combined prediction model for dust concentration in an open-pit mine in winter is developed. The error reciprocal method utilizes reciprocals to allocate weights based on the error of each algorithm, effectively reducing the overall error of the combined algorithm, and consolidating the final prediction results (Figure 6). With the specific steps detailed in Equations 18–20.
In the formula,
2.5.4 Evaluating indicator
In order to verify the predictive accuracy of the combined prediction model, this paper utilizes the common correlation coefficient (R2), root mean square error (RMSE), and standard deviation (SD) to assess the model’s performance. The specific calculation formulas are as follows. The specific calculation formula is as follows. See Equations 21–23.
In the formula, n the number of samples;
Among them, the value of R2 ranges between 0 and 1. The closer the value is to 1, the better the fitting effect of the prediction model. RMSE reflects the error between the real and predicted values, indicating the degree of deviation between the two. A smaller error implies a more stable model. SD represents the data aggregation index around the mean, reflecting the degree of dispersion in the dataset.
Various indicators assess the model from distinct viewpoints, and the simultaneous application of multiple indicators can yield a more holistic understanding of model performance. The metrics R2, RMSE, and SD serve as complementary measures, each illuminating different facets of the model’s efficacy. Furthermore, employing R2, RMSE, and SD for model evaluation can furnish more nuanced and precise information, thereby facilitating improved decision-making.
3 Result and discussion
3.1 Model hyperparameter adjustment and optimization
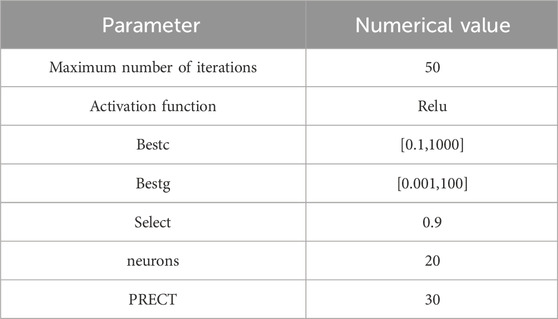
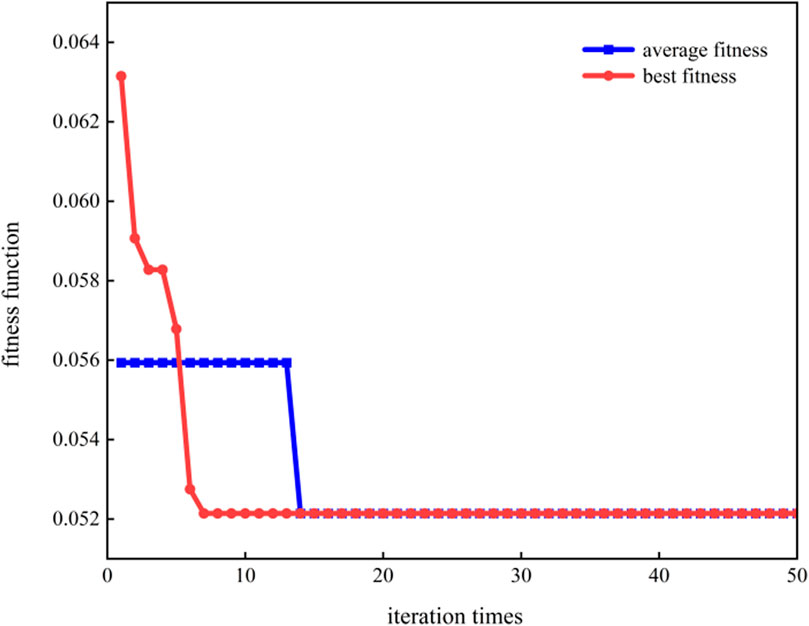
Model training is the procedure of utilizing algorithms and data to modify and enhance the parameters of the model. To achieve optimal prediction results, the prediction model is integrated with the complex database in order to meet specific prediction performance requirements (Jiang and Jintao, 2024). All model prediction experiments in this paper were conducted in a consistent development environment, and the specific parameter settings can be found in Table 4. To improve the accuracy of prediction results, it is crucial to continuously adjust and test model parameters based on the data pattern of dust concentration in the future. Figure 7 depicts the fitness value of the model achieved by making continuous adjustments to the parameters. The fitness value reaches a stable state at the 7th and 14th iterations, respectively, with the optimal fitness value determined to be 0.05214. The most effective parameter combination for the kernel function and penalty factor of the GA-LSSVM model is (1.3992,16.7093). The AdaBoost regression model, which is defined by the user, is utilized as the base learner with a predetermined quantity of 100. The Elman network functions as the fundamental regressor, consisting of 30 neurons, and the number of training iterations is set to 100.
3.2 Analysis of model results
3.2.1 Multi-input variable prediction
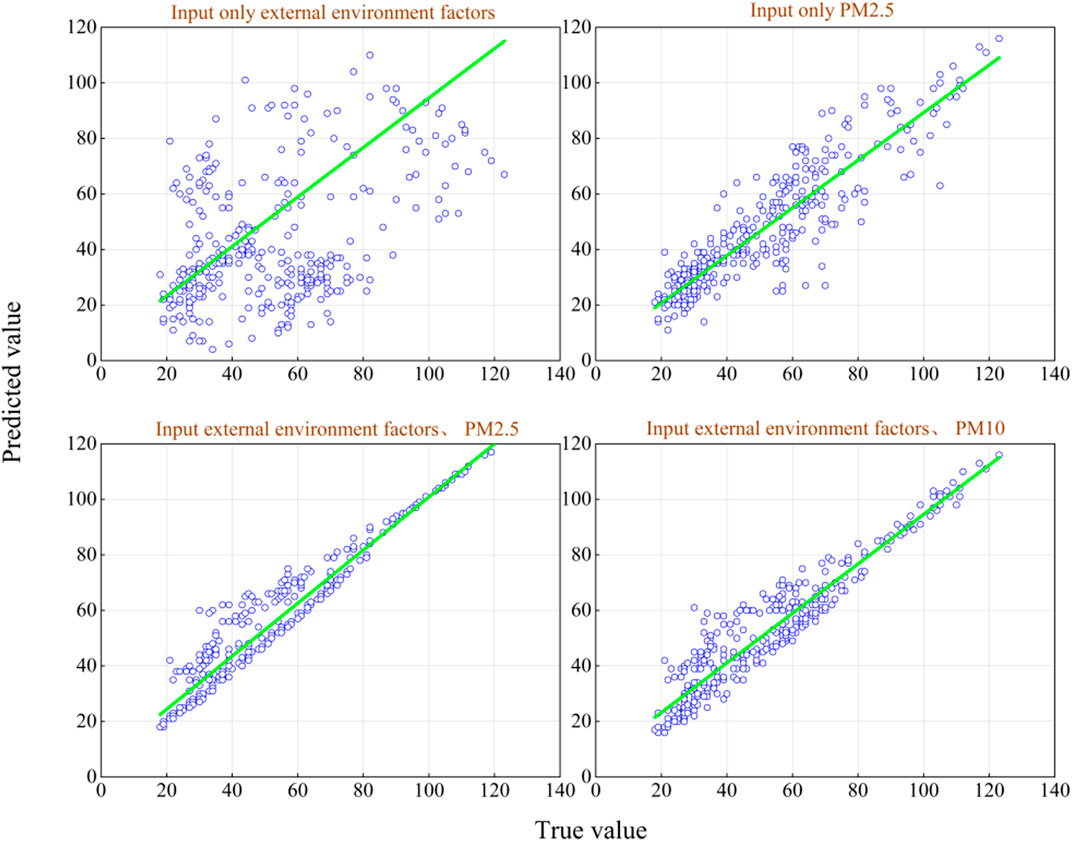
Using PM2.5 as an example of the output variable for model prediction, the mutual information feature screening algorithm mentioned earlier identifies the significant prediction indices. The input variables are ultimately identified as four external environmental factors: stripping amount, temperature, humidity, and wind direction. Furthermore, as PM2.5 dust concentration is a substantial constituent of PM10, the concentration of PM10 can be used as an additional point of reference. If needed, it can be used as an input variable to improve the predictive accuracy of future PM2.5 trends. In order to assess the prediction results based on various input variables, four specific input scenarios are examined: using only PM2.5, using only external environmental factors, using both external environmental factors and PM2.5, and using both external environmental factors and PM10. By performing a comparative analysis of the model’s prediction results, we can gain a clearer understanding of how multiple factors affect the model’s predictive performance.
Figure 8 displays the anticipated scatter plot of PM2.5 concentration based on various input conditions. Upon comparison, it is evident that the input external environmental factors exhibit the highest degree of fitting with PM2.5. Following this, the external environmental factors and PM10 are identified as the subsequent input variables. This suggests that the effectiveness of the model is significantly influenced by the input conditions, and taking into account various factors can improve the accuracy of the prediction model. In addition, incorporating output factors into the input variables yields more precise prediction outcomes when compared to only considering external environmental factors. Hence, it is essential to include past PM2.5 concentration data from the previous day and the chosen prediction indexes based on mutual information as input variables in subsequent forecasts to predict the future trajectory of PM2.5 accurately.
3.2.2 Model comparison results
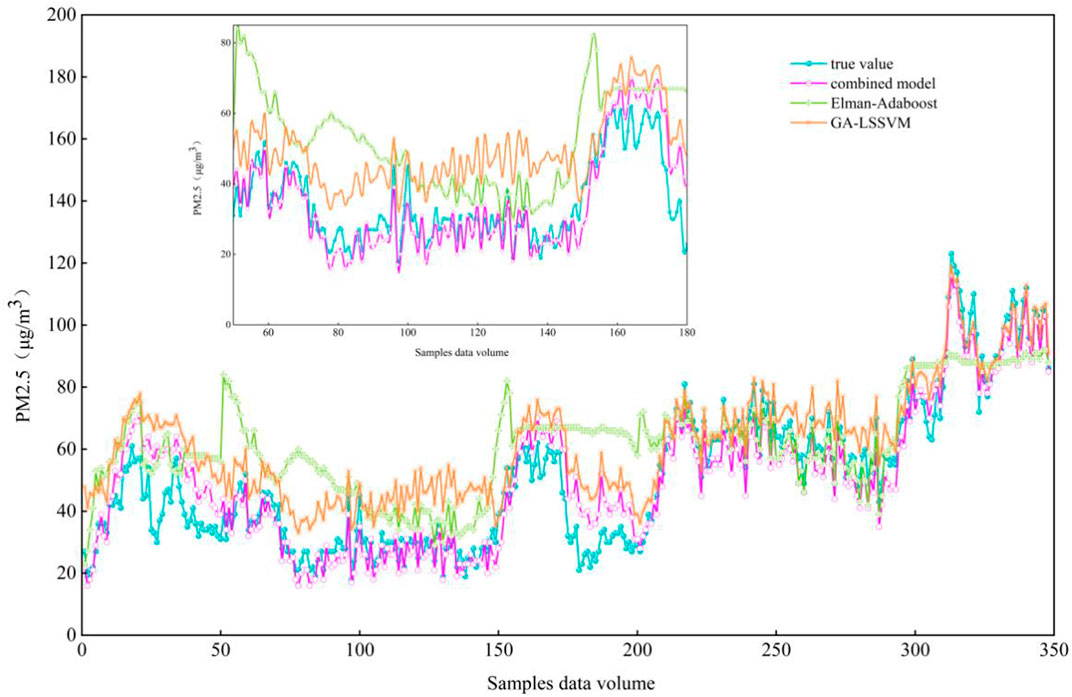
In order to verify the effectiveness of the combined prediction model based on the error reciprocal method proposed in this paper, in accordance with a 7:3 ratio, the sample data is partitioned into a training set and a test set for the purpose of predicting dust concentration. Specifically, the training set comprises 812 samples, while 348 samples are utilized for prediction. This approach mitigates the risk that the integrated model may fail to adequately capture the intricate patterns present in the data, thereby enhancing overall model performance. GA-LSSVM and Elman-Adaboost are selected as the comparison models, respectively. The prediction results of different models are shown in Figure 9.
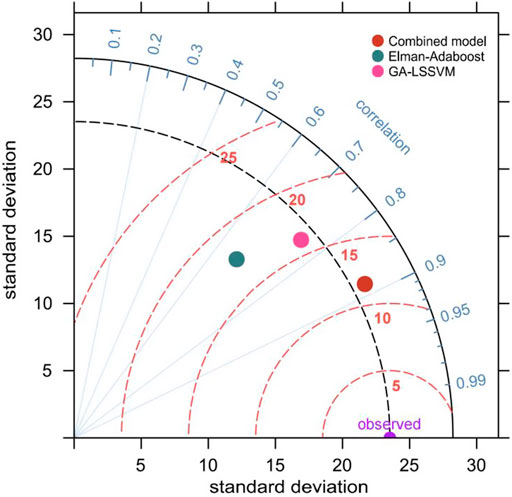
The Taylor diagram is utilized in conjunction with the evaluation index to comprehensively assess and compare the relationship between various model indexes from multiple perspectives and dimensions. In Figure 10, the abscissa, radiation line, and scale dotted line represent the standard deviation, correlation coefficient, and root mean square error, respectively. The evaluation indexes’ comparison results are displayed in Table 5. The comprehensive calculation reveals that there is no significant disparity in the prediction outcomes of the three models. Due to the incorporation of the support vector machine model and the neural network model, the composite model presented in this paper has resulted in substantial enhancements in R2 and RMSE. The combined model outperforms the GA-LSSVM model with a 24.5% increase in R2 and a 31.0% reduction in RMSE. The Elman-Adaboost model was compared to and found to have a 41.2% increase in R2 and a 36.7% decrease in RMSE. Furthermore, the statistical analysis reveals that the original dataset has a standard deviation of 23.528. Additionally, the combined model demonstrates superior accuracy when compared vertically.
3.3 Model checking
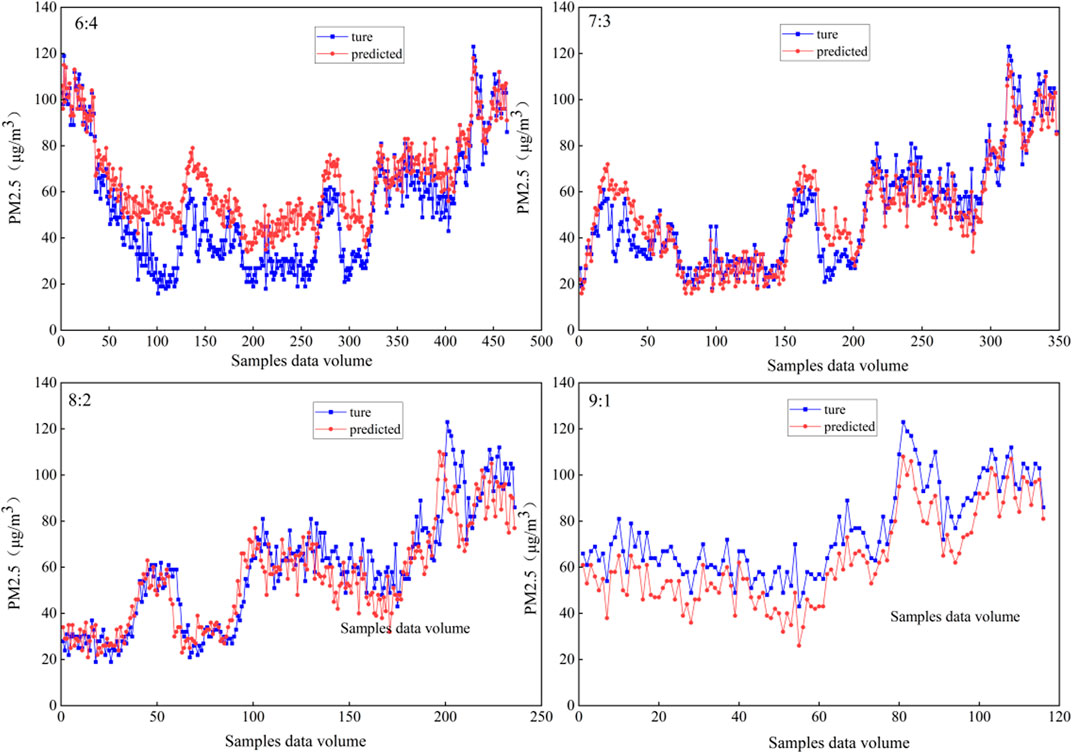
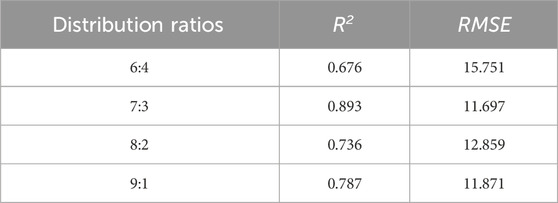
The distribution ratios of the training set and test set can directly impact the accuracy of model predictions, particularly in large-scale data sample sets. Hence, this paper categorizes four prevalent distribution ratios, namely, 6:4, 7:3, 8:2, and 9:1, and assesses the model’s effectiveness using the correlation coefficient (R2) and root mean square error (RMSE) of the evaluation index.
Figure 11 displays the model test results for various distribution ratios. It indicates the number of samples in each of the four training sets: 696, 812, 928, and 1,044. These results are used to assess the prediction model’s generalization ability and actual effectiveness. This evaluation aims to improve the credibility and scientific value of the research findings. And Table 6 demonstrates that the model’s training error does not improve even as the amount of training data increases. When the dataset is trained with a distribution ratio of 7:3, specifically with 812 training samples, the R2 and RMSE metrics achieve their optimal state.
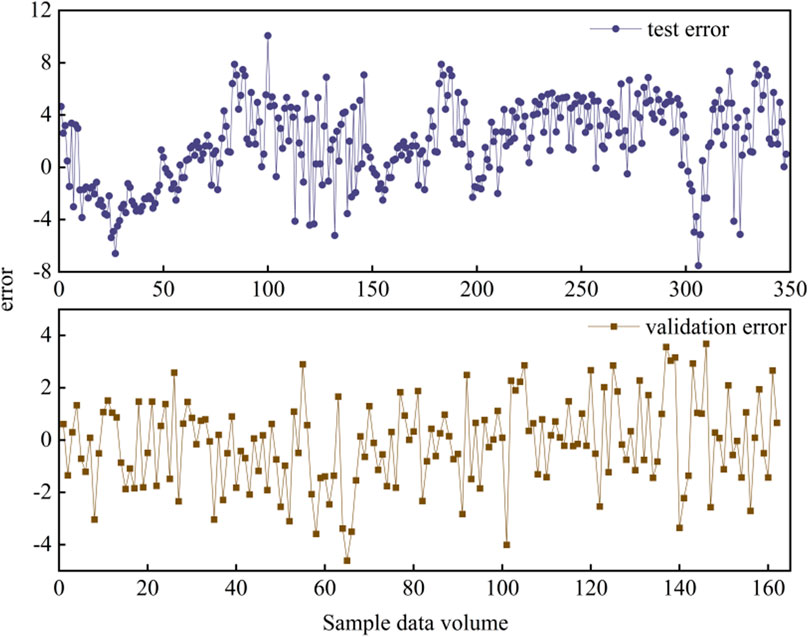
Moreover, the unique characteristics that the model learns from the training data are absent in the test data, which makes it difficult to evaluate the model’s generalization during the training phase. As a result, external support tools are necessary to confirm and assess the model’s effectiveness in real-world applications.
This paper employs the widely used k-fold cross-validation method to evaluate the generalization capability for hyperparameter selection. k-fold cross-validation is a more effective approach for evaluating models compared to the traditional method of partitioning the training set and test set. It helps to prevent problems that may arise from improper data set partitioning (Lu, 2023; Lei et al., 2022; Li et al., 2024).
The k-fold cross-validation generally involves repeating k random segmentation processes. Typically, k is set to 5 or 10. In this study, k = 5 is chosen for cross-validating the training set, which consists of 812 sets. The dataset is divided into five nearly equal and mutually exclusive parts. These parts are denoted as
4 Conclusion
4.1 Main conclusion
The accurate estimation of dust concentration plays an important role in its control design. In this paper, the regression prediction analysis of PM mass concentration in Weijiamao open-pit mine is carried out. Specifically, through the pre-processing and analysis of the data obtained from the real-time monitoring of the open-pit mine site, the mutual information screening algorithm is further used to obtain the dust concentration data affected by the meteorological and production intensity factors. The order is: stripping amount > temperature > humidity > wind direction > wind speed, and finally the external environmental impact indicators of the model are quantitatively determined, including stripping amount, temperature, humidity, and wind direction. In addition, taking the output variable PM2.5 as an example, a combined prediction algorithm model of GA-LSSVM and Elman-Adaboost based on error reciprocal method is constructed. The training sample set and test sample set of the prediction model are established according to the PM2.5 sequence data according to 7 : 3, and the correlation coefficient R2, root mean square error RMSE and standard deviation SD are proposed as the evaluation indexes of the model. The findings indicate that an analysis of various input variable conditions reveals a correlation between the input variables and the output elements. Specifically, when the input variables incorporate information regarding PM2.5 concentration values, the accuracy of the prediction results improves. The combined model demonstrates performance metrics of R2 = 0.893, RMSE = 11.697, and SD = 22.174. In comparison to the GA-LSSVM model and the Elman-Adaboost model, the R2 value shows an increase of 24.5% and 41.2%, respectively, while the RMSE exhibits a decrease of 31.0% and 36.7%, respectively. These results suggest that the predictive performance of the combined GA-LSSVM and Elman-Adaboost algorithm model, which is based on the error reciprocal method, is relatively stable.
4.2 Application of the model
In recent years, integrating computer science into open-pit mining engineering has become increasingly common. However, there is still a gap in developing specific environmental parameters in this area. Utilizing interdisciplinary approaches can expand perspectives and offer new solutions to various challenges. The prediction capabilities of the combined GA-LSSVM and Elman-Adaboost model, based on the error reciprocal method presented in this paper, outperform other algorithms. The findings provide a valuable resource for practical implementation, presenting efficient tactics for improving environmental management, preserving air quality, and integrating production data in open-pit mining, while also mitigating the effects of external environmental fluctuations on mining activities.
In particular, this is primarily evident in the following two areas:
(1) A precise model for forecasting dust concentration can evaluate the extent of dust pollution in open-pit mines. By integrating this model with the software on the host computer, we can create a real-time monitoring system for open-pit mines. This system will provide a visual representation of dust pollution levels using different colors. This system enables the production department to strategically plan the mine’s overall production schedule, efficiently devise strategies to reduce dust, optimize different parameters for dust control, and establish a connection between the prediction model and dust reduction equipment. This method aids in mitigating the detrimental effects of dust pollution on mining machinery and equipment, thereby diminishing the likelihood of severe accidents and promoting the adoption of sustainable mining practices.
(2) Dust pollution in open-pit mining operations contributes to the degradation of the ecological environment and poses significant health risks to workers. The purpose of developing the predictive model is to reduce the influence of human subjective biases and accurately define the mathematical connection between dust concentration and its main factors. This model is useful for managers to improve the monitoring of occupational hazards related to dust. It also helps in implementing early warning systems and risk control technologies, which in turn helps in managing and reducing occupational diseases such as pneumoconiosis.
4.3 Limitations and future research directions
Considering the research background of expediting the development of mine ecological civilization in the country, and taking into account the intricate environment of open-pit mines and the numerous factors that affect dust concentration, the aforementioned study presents a model construction framework for predicting dust concentration data in open-pit mines. This framework establishes a foundation for subsequent dust control efforts. Building upon the aforementioned research findings, this study puts forth additional research prospects for predicting dust concentration in open-pit mines. These prospects aim to stimulate further discussion and implementation in future research endeavors.
In the future, advancements in predicting dust concentration in open-pit mines will require enhancements to the selection mechanism and foundation of the prediction model. It is essential to further evaluate the input variables of the model and introduce constraints to boost its accuracy. There should be a focus on deepening fundamental theoretical research and conducting seasonal analyses of dust concentration data. A comprehensive examination of the variations in dust concentration across the different seasons—spring, summer, autumn, and winter—will help achieve precise predictions that account for both similarities and differences in dust concentration data throughout the year. Additionally, efforts should continue towards developing an integrated system platform for monitoring, forecasting, early warning, and intelligent prevention and control of dust in open-pit mines, along with dedicated research on the monitoring, prediction, and prevention systems specific to dust in this field.
Data availability statement
The raw data supporting the conclusions of this article will be made available by the authors, without undue reservation.
Author contributions
CZ: Investigation, Methodology, Project administration, Resources, Supervision, Visualization, Writing–original draft, Writing–review and editing. XS: Conceptualization, Data curation, Methodology, Software, Writing–original draft, Writing–review and editing. LJ: Methodology, Software, Validation, Writing–original draft.
Funding
The author(s) declare that financial support was received for the research, authorship, and/or publication of this article. This work was supported by the Open Project of Key Laboratory of Xinjiang Coal Resources Green Mining, Ministry of Education (KLXGY-KB2424), Natural Science Foundation of Xinjiang Uygur Autonomous Region (2021D01B34), and Natural Science Foundation of Colleges and Universities in Xinjiang Uygur Autonomous Region (XJEDU2024J126).
Conflict of interest
The authors declare that the research was conducted in the absence of any commercial or financial relationships that could be construed as a potential conflict of interest.
Publisher’s note
All claims expressed in this article are solely those of the authors and do not necessarily represent those of their affiliated organizations, or those of the publisher, the editors and the reviewers. Any product that may be evaluated in this article, or claim that may be made by its manufacturer, is not guaranteed or endorsed by the publisher.
References
Balaga, D., Kalita, M., Dobrza niecki, P., Jendrysik, S., Kaczmarczyk, K., Kotwica, K., et al. (2021). Analysis and forecasting of PM2.5, PM4, and PM10 dust concentrations, based on in situ tests in hard coal mines. Energies 14 (17), 5527. doi:10.3390/en14175527
Chen, R. (2000). Gray prediction of underground dust concentration. Industrial Saf. Dust Control 22 (12), 5–7.
Chen, Y., Tsu-chiang, L., Shun, Y., and Hsin-Ping, W. (2020). PM2.5 prediction model based on Combinational Hammerstein recurrent neural networks. Mathematics 12 (8), 2178. doi:10.3390/math8122178
Dong, Y., Jing, Li, Liu, Z., Niu, X., and Wang, J. (2022). Ensemble wind speed forecasting system based on optimal model adaptive selection strategy: case study in China. Sustain. Energy Technol. Assessments 53 (PB), 102535. doi:10.1016/j.seta.2022.102535
Dong, Y., Sun, Y., Liu, Z., Du, Z., and Wang, J. (2024). Predicting dissolved oxygen level using Young’s double-slit experiment optimizer-based weighting model. J. Environ. Manag., 351. doi:10.1016/j.jenvman.2023.119807
Dong, Y., Zhang, L., Liu, Z., and Wang, J. (2019). Integrated forecasting method for wind energy management: a case study in China. Processes 8 (1), 35. Domini. doi:10.3390/pr8010035
Guo, H., Guo, Y., Zhang, W., He, X., and Qu, Z. (2018). Research on a novel hybrid decomposition-ensemble learning paradigm based on VMD and IWOA for PM2.5 forecasting. Int. J. Environ. Res. Public Health 18 (3), 1024. doi:10.3390/ijerph18031024
Han, L., Li, Y., Yan, W., Xie, L., Wang, S., Wu, Q., et al. (2018). Quality of life and influencing factors of coal miners in Xuzhou, China. J. Thorac. Dis. 10 (2), 835. doi:10.21037/jtd.2018.01.14
Jiang, L., and Jintao, G. (2024). Survey of machine learning for database parameter tuning techniques. Comput. Eng. Appl. 60 (3), 1–16. doi:10.3778/j.issn.1002-8331.2304-0101
Jiang, P., Liu, Z., Zhang, L., and Wang, J. (2022). Advanced traffic congestion early warning system based on traffic flow forecasting and extenics evaluation. Appl. Soft Comput., 118. doi:10.1016/j.asoc.2022.108544
Lal, B., and Shankar Tripathy, S. (2012). Prediction of dust concentration in open cast coal mine using artificial neural network. Atmos. Pollut. Res. 3 (2), 211–218. doi:10.5094/apr.2012.023
Lei, Y., Lei, Q., Jiang, C., Yan, P., Ren, Z., Liu, B., et al. (2022). Climate-informed monthly runoff prediction model using machine learning and feature importance analysis. Front. Environ. Sci. 10, 1049840. doi:10.3389/fenvs.2022.1049840
Li, M. A., Tianxiang, L. I., Xingping, L. A. I., Chen, X. V., Weibo, S. U. N., Fei, X. U. E., et al. (2022). GA-LSSVM prediction of blasting casting effect in open-pit mine based on Fourier series. J. China Coal Soc. 47 (12), 4455–4465. doi:10.13225/j.cnki.jccs.2021.1832
Li, XS, Li, QH, Wang, YM, Liu, W, Hou, D, and Zhu, C (2024). Effect of slope angle on fractured rock masses under combined influence of variable rainfall infiltration and excavation unloading. J. Rock Mech. and Geotech. Eng. 16 (10), 1–20. doi:10.1016/j.jrmge.2024.08.019
Lin, Li, Zhang, R., Sun, J., He, Q., Kong, L., and Liu, X. (2021). Monitoring and prediction of dust concentration in an open-pit mine using a deep-learning algorithm. Environ. Health Sci. Eng. 19, 401–414. doi:10.1007/s40201-021-00613-0
Liu, J., Yu, F., Qian, M., Yue, Z., and Zheng, H. (2021). Study on the prediction of FGM model of soot (dust) emission with weakening buffer operator optimization. J. Saf. Environ. 22 (2), 941–946. doi:10.13637/j.issn.1009-6094.2021.0720
Liu, Z., Zhang, R., Ma, J., Zhang, W., and Li, L. (2023). Analysis and prediction of the meteorological characteristics of dust concentrations in open-pit mines. Sustainability 15 (6), 4837. doi:10.3390/su15064837
Lu, J. (2023). Error analysis of ensemble learning based on cross validation. Comput. Syst. and Appl. 32 (1), 302–309. doi:10.15888/j.cnki.csa.008898
Lu, X., Zhou, W., Qi, C., Luo, H., Zhang, D., and Pham, B. T. (2021). Prediction into the future: a novel intelligent approach for PM2.5 forecasting in the ambient air of open-pit mining. Atmos. Pollut. Res. 12 (6), 101084. doi:10.1016/j.apr.2021.101084
Peng, C. (2020). Distribution law of meteorological factors and evolution characteristics of particulate matter in low temperature stope of open-pit coal mine. Coal Eng. 52 (12), 85–90. doi:10.11799/ce202012060
Qi, C., Zhou, W., Xiang, Lu, Luo, H., Pham, B. T., and Yaseen, Z. M. (2020). Particulate matter concentration from open-cutcoal mines: a hybrid machine learning estimation. Environ. Pollut. 263, 114517. doi:10.1016/j.envpol.2020.114517
Sastry, V. R., Chandar, K. R., Nagesha, K. V., Muralidhar, E., and Mohiuddin, M. S. (2015). Prediction and analysis of dust dispersion from drilling operation in opencast coal mines. Earth Planetsry Sci. 11, 303–311. doi:10.1016/j.proeps.2015.06.065
Sun, Y., Jiao, D., Liu, Z., and Wang, J. (2023). Combined forecasting tool for renewable energy management in sustainable supply chains. Comput. and Industrial Eng., 179. doi:10.1016/j.cie.2023.109237
Wang, Y., Chen, S., Wei, R., Bi, G., and Zhao, S. (2023b). Elman-Adaboost integrated artificial neural network for high voltage AC transmission line single-phase grounding initial voltage traveling wave modulus amplitude ratio of single-end fault location. Electr. power Sci. Eng. 39 (9), 10–19. doi:10.3969/j.ISSN.1672-0792.2023.09.002
Wang, Y., Gao, M., and Shuaibo, Z. (2021). Establishment and application of mine dust concentration prediction model. China Min. Ind. 30 (1), 178–181. doi:10.12075/j.issn.10044051.2021.01.023
Wang, Z., Zhou, W., Mithal, J. I., Yang, Y., Yan, J., Luo, H., et al. (2023a). A novel approach to forecast dust concentration in open pit mines by integrating meteorological parameters and production intensity. Environ. Sci. Pollut. Res. Int. 30 (53), 114591–114609. doi:10.1007/s11356-023-30443-6
Wen, H., Luan, B., Zhou, W., Lu, X., Wang, C., Zhou, Y., et al. (2021). Prediction of dust mass concentration in open-pit coal minesbased on environmental factors. J. Liaoning Tech. Univ. Nat. Sci. Ed. 40 (5), 409–414. doi:10.11956/j.issn.1008-0562.2021.05.005
Xia, Z., Dongbin, Hu, and Quan, Li (2020). Research on prediction model of air pollutant concentration based on wavelet decomposition and SVM. J. Environ. Sci. 40 (8), 2962–2969. doi:10.13671/j.hjkxxb.2020.0123
Xiao, S., Liu, J., Li, W., and Ma, Y. I (2024). Study status and prospect of mine dust occupational hazard risk sssessment. Metal. Mine (5), 55–67. doi:10.19614/j.cnki.jsks.202405005
Xiao, S., Ma, Y., Li, W., Xue, J., Li, K., Ma, X., et al. (2023a). Research progress and prospect of dust control theory and technology in open-pit mines in China in recent 20 years. Metal. Mine (07), 40–56. doi:10.19614/j.cnki.jsks.202307004
Xiao, S., Ma, Y., Weiyan, L., and Liu, J. (2023b). Prediction of dust concentration in open-pit mine based on CiteSpace knowledge graph analysis. J. Xi’an Univ. Sci. Technol. 43 (4), 675–685. doi:10.13800/j.cnki.xakjdxxb.2023.0404
Yan, J., Bai, X., Changhai, Z., and Chen, J. (2023). Prediction of dust concentration in open-pit mines based on Elman model. Inn. Mong. Coal Econ. (4), 5–7. doi:10.13487/j.cnki.imce.023302
Yang, S., Wang, Y., Liu, C., Ting, S., Lei, H., and Fangfang, C. (2018). Assessingcumulative dust exposure for excavating workers in ahigh speed tunnel industry using the Bayesian decisionanalysis technique. Mod. Prev. Med. 45 (10), 1753–1758.
Yaozhong, Z., Yan, J., Jikai, R., Yukun, Y., Qiang, L., Shikun, X., et al. (2022). Prediction of dust concentration in open-pit coal mines basedon machine learning. Coal Eng. 54 (12), 157–161. doi:10.11799/ce202212069
Zhang, J., Cao, F., Dong, Y., Zhang, C., Yu, Y., and Tang, C. (2024). Feature selection algorithm based on mutual information and genetic algorithm. J. Shanxi Univ. Sci. Ed. 47 (1), 1–8. doi:10.13451/j.sxu.ns.2023135
Zhang, Y. (2019). Analysis of slope stability failure mode in Weijiamao surface coal mine based on FLAC3D software. Opencast Min. Technol. 34 (4), 55–58. doi:10.13235/j.cnki.ltcm.2019.04.015
Zhiyuan, Y. U., Xiaobin, L. I., and Renchao, L. I. (2023). Short-term wind power prediction based on GA-LSSVM. Energy energy conservation (6), 58–61. doi:10.16643/j.cnki.14-1360/td.2023.06.055
Keywords: combinatorial forecasting, dust concentration, error reciprocal method, mutual information feature screening, open-pit mine
Citation: Zhiguo C, Shuangshuang X and Jin L (2024) Research on a dust concentration prediction model for open-pit mines based on error reciprocal integration GA-LSSVM and Elman-Adaboost. Front. Environ. Sci. 12:1469816. doi: 10.3389/fenvs.2024.1469816
Received: 24 July 2024; Accepted: 04 November 2024;
Published: 19 November 2024.
Edited by:
Qiangqiang Yuan, Wuhan University, ChinaReviewed by:
Zhenkun Liu, Nanjing University of Posts and Telecommunications, ChinaChen Wang, Guizhou University, China
Agustami Sitorus, National Research and Innovation Agency (BRIN), Indonesia
Copyright © 2024 Zhiguo, Shuangshuang and Jin. This is an open-access article distributed under the terms of the Creative Commons Attribution License (CC BY). The use, distribution or reproduction in other forums is permitted, provided the original author(s) and the copyright owner(s) are credited and that the original publication in this journal is cited, in accordance with accepted academic practice. No use, distribution or reproduction is permitted which does not comply with these terms.
*Correspondence: Xiao Shuangshuang, a2R4aWFvc2h1YW5nQDE2My5jb20=
 Chang Zhiguo1
 Xiao Shuangshuang