- 1College of Water Conservancy and Hydropower Engineering, Gansu Agricultural University, Lanzhou, China
- 2College of Forestry, Gansu Agricultural University, Lanzhou, China
- 3College of Management, Gansu Agricultural University, Lanzhou, China
The Yellow River basin is an important ecological security barrier and ecologically vulnerable region in China. Landscape ecological risk assessment and influencing factor analysis based on land-use/land-cover change (LUCC) and boosted regression tree (BRT) models are of great significance to the coordinated and sustainable development of regional ecological environment and social economy. Based on LUCC and driving factor data from 1980 to 2020, the ecological risk index (ERI) model was constructed to evaluate the spatiotemporal evolution characteristics of ecological risk in the past 40 years. Especially, a new method of influencing factor analysis based on the BRT model is proposed. The final index size of the influencing factors was further quantitatively evaluated. The results showed that the spatial distribution pattern of landscape ecological risk in the Yellow River basin was “highest in the north and lowest in the south, highest in the west and lowest in the east.” During the periods, the overall ecological risk and high risk increased first and then decreased. Elevation (24.8%) was the most important factor affecting landscape ecological risk, followed by precipitation (17.8%), GDP (15.2%), and temperature (14.6%). It showed that the particularity of the geographical location of the Yellow River basin eventually led to the stronger influence of natural factors on the change in landscape ecological risk under the interference of human activities. This study will provide a new perspective for quantitative assessment of the final contribution rate of landscape ecological risk factors.
1 Introduction
As an important part of national and international security, ecological security is an important foundation for sustainable economic and social development and an important guarantee for promoting the construction of ecological civilization (Xie and Li, 2004). In recent years, with the increase in human disturbance to the natural environment, it has not only aggravated the degradation of ecosystem function, the reduction in water conservation function, the frequent occurrence of natural disasters, and other problems but also has seriously endangered the local residents’ production and life and the sustainable development of regional economy (Vetrova et al., 2020; Choi et al., 2009). Therefore, scientific evaluation of landscape ecological risk is an effective way to find out the ecological environment problems in the Yellow River basin. It is also an important cornerstone to promote the high-quality development of the Yellow River basin and build up the national ecological security barrier (Leuven and Gne, 2010).
In recent years, landscape ecological risk assessment has become a hot topic of research in the field of environmental ecology (Naser, 2015). The early ecological risk is evaluated by specific risk sources such as agricultural pollution source diffusion, water pollution, and soil erosion (Liu and Wang, 2007; Yan et al., 2011). Currently, the ecological risk assessment based on LUCC focuses on the coupling relationship between ecological processes and spatial patterns. The evaluation model of “dividing risk plot-calculating ecological risk-estimating risk probability-analyzing spatial heterogeneity” is adopted. It not only describes the heterogeneity and scale change of ecological risk in temporal and spatial dimensions but also reveals the comprehensive expression and spatial distribution characteristics of multidimensional risk sources. It has gradually become the mainstream of ecological risk assessment, but the studies on the Yellow River basin are relatively few (Parker et al., 2003; Foster et al., 2017). The Yellow River basin plays an important role in the economic and social development and ecological security in China. However, with population growth and rapid economic development, the natural ecosystem of the basin has been destroyed. The biggest problems in the Yellow River basin are the shortage of water resources and ecological fragility. The wetland in the upper reaches of the Yellow River has been degraded, and the middle reaches of the Yellow River pass through the Loess Plateau, which is a region with severe soil erosion in the world. The decreasing amount of sediment makes the Yellow River delta shrink, which seriously threatens the ecological security of the estuary area. Therefore, it is urgent to study the ecosystem of the whole Yellow River basin (Veerle and Andreas, 2023).
The interaction of various factors inside and outside the landscape pattern at different spatial and temporal scales leads to the change in landscape ecological risk. The effective identification of driving factors of ecological risk change is of great significance to clarify the specific protection objectives of the study area and avoid the occurrence of ecological risks and the sustainable development of the ecological environment (Kgaphola et al., 2023). At present, the research on the driving factors of landscape ecological risk usually adopts the methods of geographical detection, geographically weighted regression, and correlation analysis. Although the transformation from a single factor to multi-source and multi-level factors has been realized, they all belong to qualitative research on the influencing factors of ecological risk, and there are relatively few quantitative studies (Liu et al., 2008; Leuven and Gne, 2010). The advantage of the BRT is that it can process different data types, quantitative relationships, and missing data at the same time. It can better explain the contribution of independent variables to dependent variables, and quantification shows the relationships between variables. It is widely used in the quantitative study of the influence of multiple factors in fields such as medicine and chemistry, but there are relatively few studies on the influencing factors of ecology (Lu and Mu, 2014).
Therefore, based on the LUCC and BRT model, this study evaluated the variation characteristics of landscape ecological risk in the Yellow River basin and quantitatively analyzed the contribution of influencing factors. The specific objectives of this study are as follows: 1) to analyze the distribution characteristics and dynamic degree of LUCC in the Yellow River basin from 1980 to 2020; 2) to reveal the spatial–temporal variation and aggregation characteristics of landscape ecological risk in the Yellow River basin from 1980 to 2020 based on ERI and Moran’s I index; and 3) to quantitatively evaluate the contribution of natural and human factors to landscape ecological risk using the BRT model. It provides a scientific basis for effectively preventing and resolving ecological risks and promoting ecological protection and high-quality development in the Yellow River basin in the future.
2 Study area and data sources
2.1 Overview of the study area
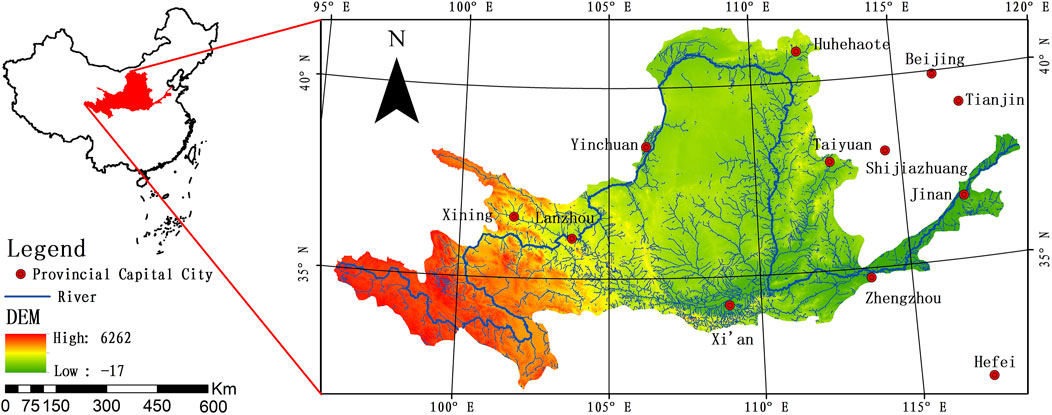
The Yellow River flows through nine provinces and regions (Figure 1). The Yellow River basin spans the eastern, central, and western parts of China. The terrain is highest in the west and lowest in the east, with a drop of 4,480 m (Cui, 2008). From west to east, it is classified into upper, middle, and lower reaches. The upstream area is from the Yaladaze Peak in Bayan Har Mountains of Qinghai province to Hekou town in the Inner Mongolia Autonomous Region. The average elevation of this area is greater than 4,000 m. The land cover is mainly grassland. There are “Zhonghua Water Tower” in the Sanjiangyuan area and many rivers and lakes/wetlands, which are important areas for water supply. However, in recent years, due to climate change and human activities, problems such as land desertification and wetland function degradation have begun to occur (Kooistra et al., 2005). The area from Hekou town to Taohua Valley in Henan province includes the middle reaches of the river, with an elevation of 1,000–2000 m, which experiences a relatively severe soil erosion. The area from the Taohua Valley to the Bohai Sea in Shandong province is the downstream area, and this area has the lowest elevation and rich biological resources. However, the annual sediment deposition has been gradually decreasing, resulting in a serious threat to biodiversity and soil quality (Xin et al., 2003).
2.2 Data sources
The data collected in this paper mainly include the following: 1) LUCC data: LUCC data from 1980 to 2010 were obtained from the Science Data Center of Chinese Academy of Sciences (http://www.resdc.cn). The LUCC data for 2020 were obtained from the National Basic Geographic Information Center (https://www.webmap.cn). This study reclassified the above data into six types: grassland, farmland, forest, urban, water, and bare land. 2) Driving factor data: they mainly comprise natural factors and human factors. Natural factors include DEM, slope, annual average temperature, and annual precipitation. Human factors include population, GDP, distance from road, and distance from resident areas. The spatialization method and data source of these eight driving factor data can be found on http://www.resdc.cn/, and the spatial distribution is shown in Figure 2.

Figure 2. Spatial distribution map of driving factor data; part labels description: Note: (A) DEM is the elevation of the study area; (B) Slope represents the steepness degree of surface units; (C) Temperature is the annual average temperature; (D) Precipitation represents annual precipitation; (E) Population is population per unit area (1 km2); (F) GDP is gross domestic product; (G) distance from road represents distance to the center line of the road; (H) distance from resident areas is distance to the center point of the resident areas.
3 Methods
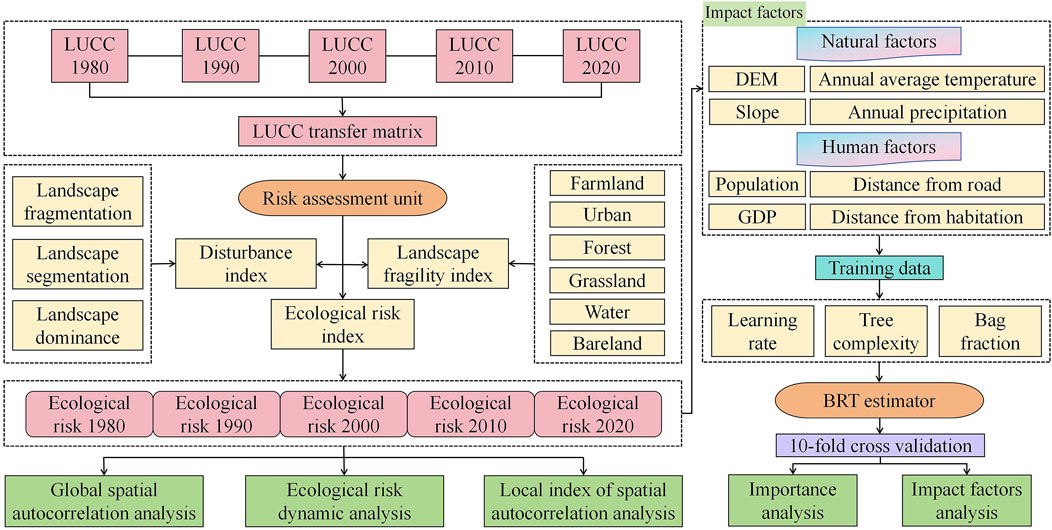
The overall methods of ecological risk assessment and impact factor analysis in the Yellow River basin are shown in Figure 3. First, the land-use transfer matrix was calculated based on the LUCC data from 1980 to 2020, and the landscape ecological risk model was constructed by combining the landscape structure index and landscape vulnerability index. Second, spatial autocorrelation and other methods were used to analyze the spatial and temporal distribution and spatial aggregation characteristics of ecological risks. Finally, the BRT model was used to analyze the contribution of landscape ecological risk from the perspective of natural factors and human factors.
3.1 Land use transfer matrix
The transfer matrix represents the quantitative structure characteristics of land use change at the beginning and end of a certain period in the study area and the transfer changes in various types in the study time interval. It is expressed by the formula
3.2 ERI
LUCC types from 1980 to 2020 are different landscape components. The study area was divided into 3,868 risk zones by using the fishing net tool in ArcGIS 10.7. The ERI of each risk zone was calculated by using the landscape vulnerability index, landscape structure index, and the area proportion of each risk zone (Zhu et al., 2012). The calculation formula is Equation 2:
where
where
3.3 Spatial autocorrelation analysis
GeoDa software was used to calculate global and local Moran’s I to analyze the degree of autocorrelation between spatial attribute values. The global Moran’s I represents the correlation between the spatial attribute values of the entire study area. Moran’s I > 0, <0, and = 0, respectively, indicated that the landscape ecological risk of the study area presented an aggregated, discrete, and random spatial distribution pattern (Xie et al., 2006). Local Moran’s I represents the correlation between the spatial attribute values of adjacent risk zones. Moran’s I > 0 indicates that high–high or low–low has a higher degree of aggregation. Moran’s I = 0 indicates that the degree of aggregation is not significant. Moran’s I < 0 indicates that the aggregation degree of high–low or low–high is low (Li et al., 2010).
3.4 BRT model
The BRT model is a combination of the regression tree algorithm and boosting algorithm. The regression tree algorithm is used to divide the dataset into many easy-to-model groups by recursion, and then the linear regression method was used to model. The boosting algorithm is used to improve the accuracy of the weak classification algorithm by constructing a series of prediction functions and then combining them into a prediction function in a certain way (Martin et al., 2011). The BRT model randomly extracts a certain amount of data in multiple iterations during the operation. The influence degree of independent variables on dependent variables was analyzed. The remaining data are used to cross-validate the fitting results. Finally, the mean value of the generated multiple regression tree is taken and output (Froeschke and Froeschke, 2016). The BRT model can calculate the relationship between the independent variable and the dependent variable when the other independent variables are averaged or unchanged and obtain the contribution of the independent variable to the dependent variable (Zhang et al., 2019). The biggest advantage of the BRT model is that it does not need to consider the interaction between independent variables. Data can have default values, and data types are flexible and diverse.
The process of calculating the weight of each influencing factor using the BRT model is as follows: first, all influencing factors involved in the model are determined. Second, the BRT model is constructed by using R language to select the suitable fitness function and control variable according to influencing factors and target variables. Then, statistical software is used to select appropriate parameter estimation methods to fit the BRT model. Finally, the entropy weight method and fuzzy synthesis method are used to determine the weight of each factor according to the fitting results of the BRT model.
4 Result analysis
4.1 Land-use change
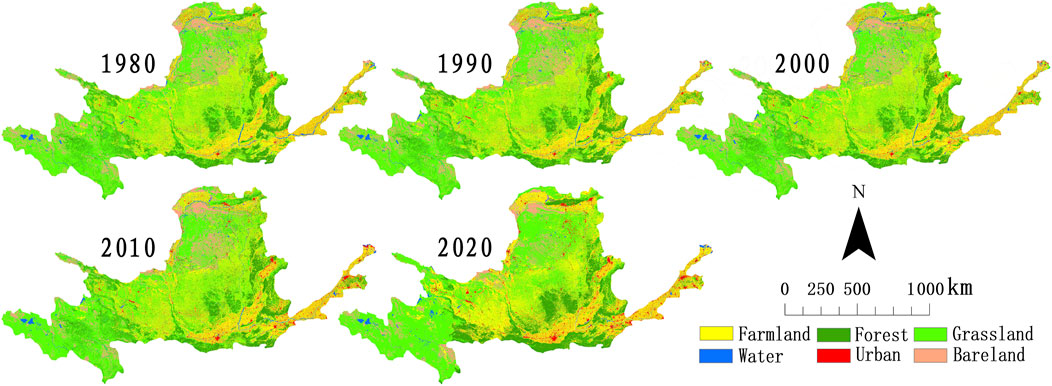
From 1980 to 2020, the proportion of grassland and farmland is the largest, followed by forest. It accounts for more than 88% of the total area (Figure 4). During the periods, farmland, forest, and urban areas showed an increasing trend, while grassland, water, and bare land areas showed a continuously decreasing trend (Table 1). Among them, the area of the farmland increased by 34,300 km2 in 40 years, and the increased area was the largest, which was mainly transferred from the grassland. The forest area increased by 10,900 km2, mainly from grassland and farmland. With the continuous advancement of human activities and urbanization, the urban area has increased by 13,500 km2. However, the grassland area decreased by 26,800 km2, and the bare land decreased by 26,200 km2. Compared with the bare land, the water area has undergone less change. It means that the forest has been well-protected and the bare land has been well-developed and utilized in the past 40 years.
4.2 Spatiotemporal changes of landscape ecological risk
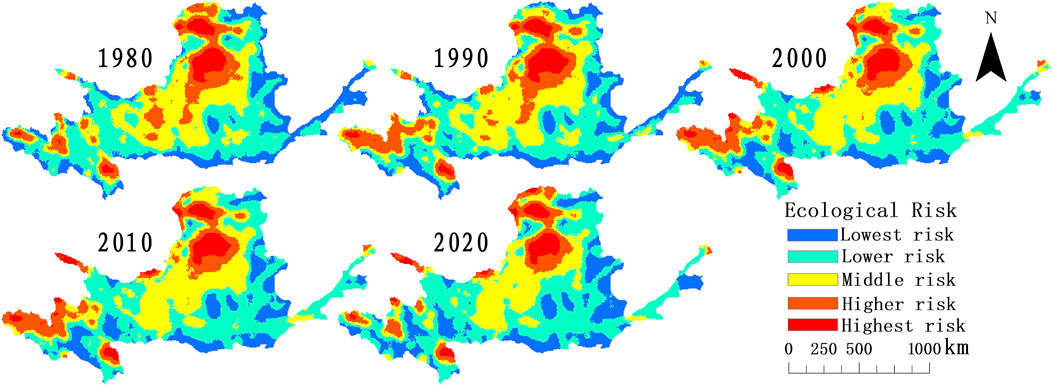
The ERI of 3,868 risk zones in the study area was interpolated by Kriging. With the help of the natural breakpoint tool of ArcGIS 10.7, the ecological risk of the study area is divided into five levels: highest risk (ERI > 0.20), higher risk (0.16 < ERI ≤ 0.20), moderate risk (0.14 < ERI ≤ 0.16), lower risk (0.12 < ERI ≤ 0.14), and lowest risk (ERI ≤ 0.12) (Figure 5).
It can be seen from the spatial distribution map of ecological risk in the Yellow River basin that, in general, the spatial pattern is “highest in the north and lowest in the south, highest in the west and lowest in the east.” The lowest-risk areas are mainly distributed at the junction of Qinghai province, Shaanxi province, Henan province, Shanxi province, and the boundary line of the Yellow River basin. A small part is distributed at the junction of Gansu province and Qinghai province, Zibo city and Jinan city in Shandong province, the north-central part of the Baotou city, and Hohhot city in Inner Mongolia Autonomous Region. The lower-risk regions are mainly distributed at the junction of Shaanxi province and Shanxi province, most of Qinghai province, and its junction with Gansu province. A small part is distributed in the eastern part of Inner Mongolia Autonomous Region, the northwest of Henan province, and the west of Shandong province. The moderate-risk areas are mainly distributed in the junction of Gansu province and Ningxia Hui Autonomous Region and most of Yulin city, Shaanxi province. It is scattered in most areas of Qinghai province and Inner Mongolia Autonomous Region. The higher-risk regions are mainly distribute in most of the central part of Ordos city and the south of Bayannaoer city in Inner Mongolia Autonomous Region and northwest of Yulin city in Shaanxi province. It is scattered in most areas of Qinghai province. The highest-risk areas are mainly distributed in the central part of Hangjinqi county, the junction of Wushenqi county and Etuokeqi county in Ordos city, Inner Mongolia Autonomous Region. A small part is distributed in the west of Qinghai province, the west of Ruoergai County, Sichuan province, and the north of Shapotou District, Ningxia Hui Autonomous Region.
The ArcGIS 10.7 grid calculator tool was used to calculate the annual average values of landscape ecological risk ranking: 2000

Table 2. Area (104 km2) and proportion (%) of each ecological risk level in the Yellow River basin from 1980 to 2020.
The global Moran‘s I index of landscape ecological risk in the study area from 1980 to 2020 was calculated using GeoDa software and found to be 0.657, 0.648, 0.642, 0.641, and 0.624 (Figure 6). It showed that the landscape ecological risk of the whole Yellow River basin presents a high spatial aggregation pattern. Local Moran‘s I was used to calculate the correlation between the spatial attribute values of adjacent risk zones. The results showed that the landscape ecological risk in the study area was dominated by high–high and low–low aggregation types, and high–low and low–high were sporadically distributed.
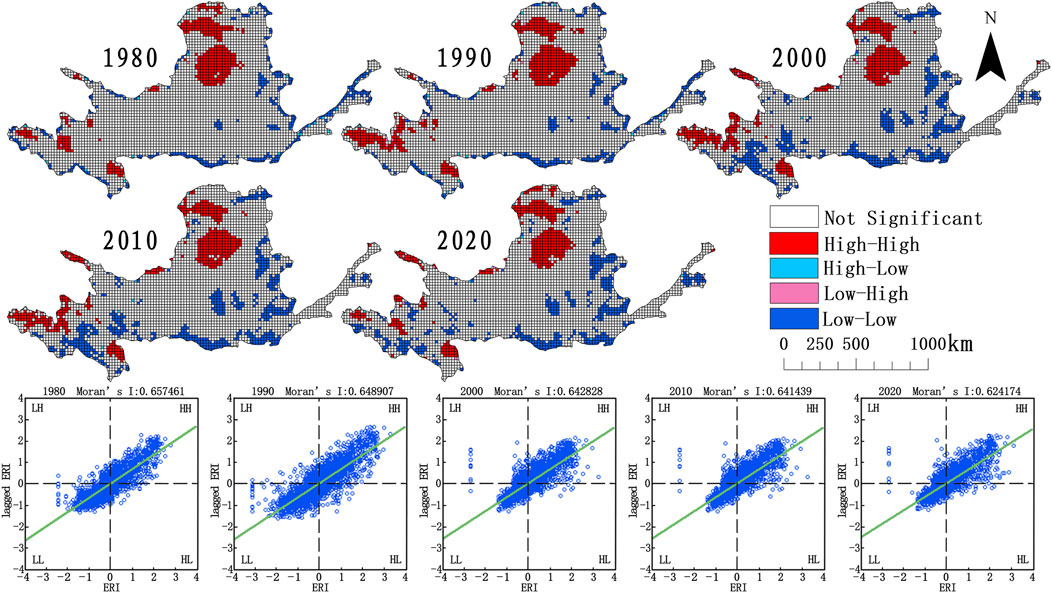
Figure 6. Global and local spatial autocorrelation of ecological risk in the Yellow River basin from 1980 to 2020.
4.3 Analysis of influencing factors of ecological risk
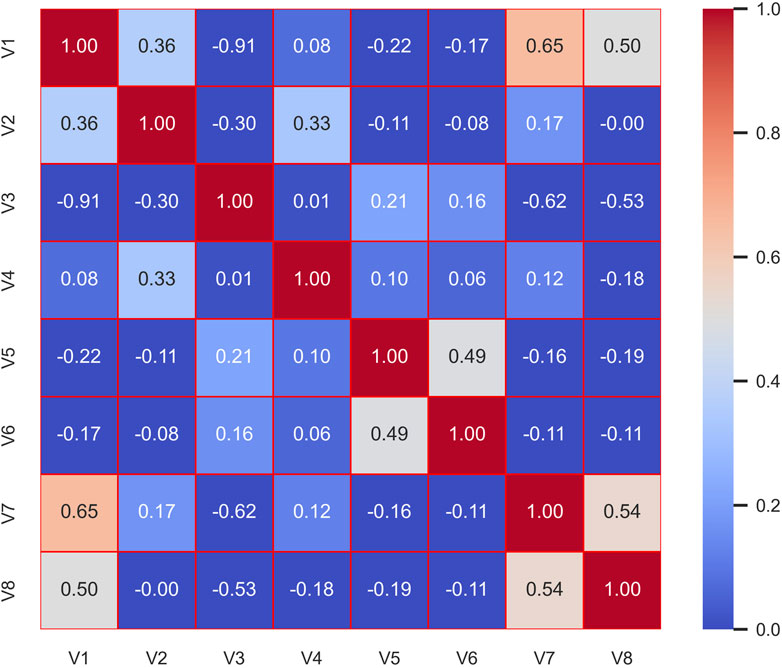
The 8,000 sample points were randomly sampled by ArcGIS. Based on these sample point data, the landscape ecological risk value of the Yellow River basin is taken as dependent variable Y and 8 driving factors were used as independent variable V. They are elevation (V1), slope (V2), temperature (V3), annual precipitation (V4), population (V5), GDP (V6), distance from road (V7), and distance from habitation (V8). As shown in Figure 7, none of the eight independent variables V has high correlation.
In the process of BRT model establishment, 70% of the data were randomly selected for analysis each time. The remaining 30% of the data were used for training and 10-fold cross validation. The BRT model needs to determine three basic parameters: learning rate (lr), tree complexity (tc), and tree number. In order to achieve the optimal model, this study selected lr = 0.01, 0.005, and 0.001 and tc = 1, 5, and 10 for fitting. Figure 8 showed the relationship between the predicted deviation and the number of deciduous trees in different lr and tc values of the BRT model. The blue dotted line in the figure represents a standard error. The blue solid line represents the average value of the prediction deviation change. The vertical red line represents the number of trees used to generate this value. The horizontal red line represents the minimum value of the average value of the prediction deviation change. When the error of the predicted value is the smallest, the number of corresponding decision trees is optimal. The prediction deviation of the BRT model decreases with the increase in tc. When tc increases to 10, the decrease in model prediction deviation is not obvious. The prediction deviation of the BRT model decreases with the value of lr. Due to the influence of hyperparameters on the model fitting results, the deviation is reduced instead. When tc is 10 and lr is 0.005, the number of trees is 6,138. At this time, the prediction deviation of the BRT model is the smallest, and the model achieves the best fitting effect. The final model will use all the data to construct the model parameters, and the correlation coefficient of 10-fold cross validation is 0.88. It shows that the precision of the BRT model is high.
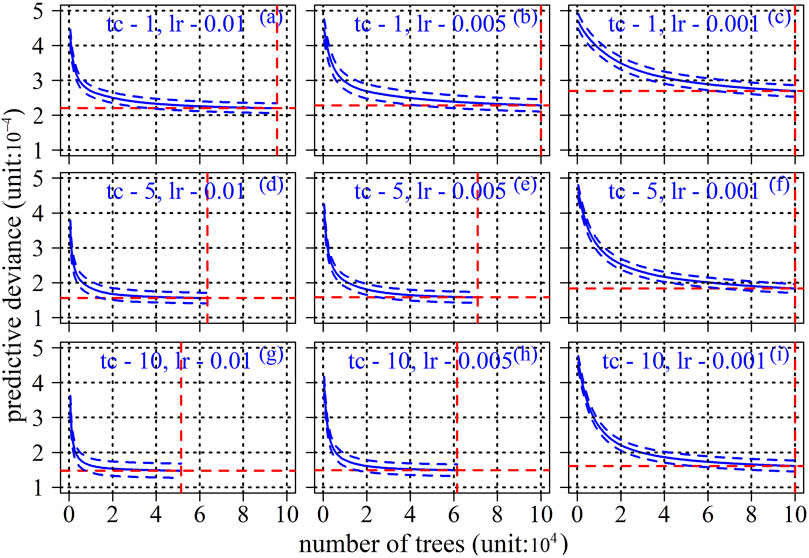
Figure 8. Relationship between the prediction deviation of BRT models with different hyperparameters and the number of decision trees. (A–I) represent the relationship between the predicted deviation and the number of deciduous trees when tc = 1 and Ir = 0.01; the relationship between the predicted deviation and the number of deciduous trees when tc = 1, Ir = 0.005; the relationship between the predicted deviation and the number of deciduous trees when tc = 1, Ir = 0.001; the relationship between the predicted deviation and the number of deciduous trees when tc = 5, Ir = 0.01; the relationship between the predicted deviation and the number of deciduous trees when tc = 5, Ir = 0.005; the relationship between the predicted deviation and the number of deciduous trees when tc = 5, Ir = 0.001; the relationship between the predicted deviation and the number of deciduous trees when tc = 10, Ir = 0.01; the relationship between the predicted deviation and the number of deciduous trees when tc = 10, Ir = 0.005; the relationship between the predicted deviation and the number of deciduous trees when tc = 10, Ir = 0.001, respectively.
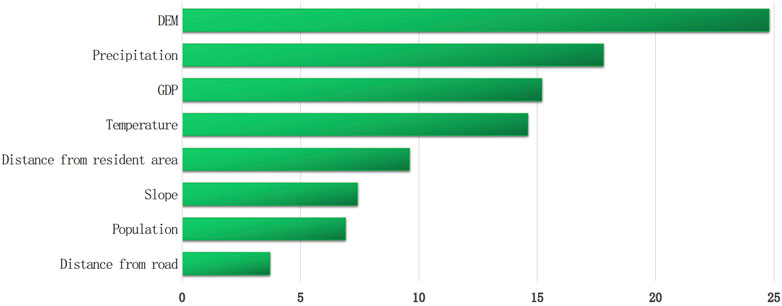
The optimal parameters of the BRT model were used to analyze the relative importance of each factor to landscape ecological risk in the Yellow River basin (Figure 9). The results showed that elevation (24.8%) was the most important factor affecting landscape ecological risk, followed by precipitation (17.8%). GDP and temperature were also considered to be unfavorable factors affecting landscape ecological risk, with levels 15.2% and 14.6%, respectively. The relative importance of other influencing factors was ranked as follows: distance from habitation (9.6%) > slope (7.4%) > population (6.9%) > distance from road (3.7%). Referring to previous studies, when the contribution rate of a single independent variable was greater than 10% in the BRT model, it was considered that the independent variable had a significant impact on the landscape ecological risk. Therefore, the influencing factors that played a significant role in the influencing factors were elevation, precipitation, GDP, and temperature.
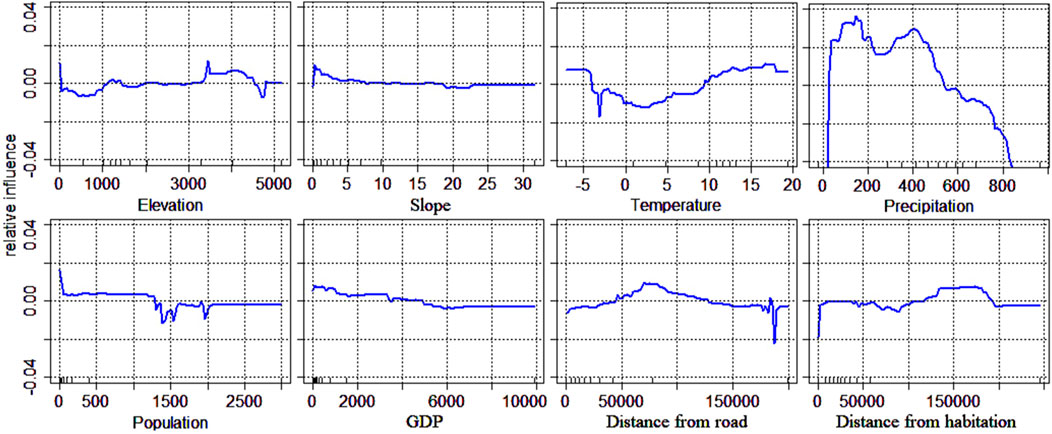
Figure 10 is the response curve of each influencing factor to ecological risk based on the BRT model. The horizontal coordinate represented the numerical change in each influence factor. The vertical coordinate indicated the relative influence degree of different factors on ecological risk. The relative impact of elevation on landscape ecological risk showed that when the elevation was in the range of 15–1,150 m, 1,450–3,350 m, and 4,550–4,832 m, the impact on the ERI was negative, and the remaining effects on the ERI were positive. When the slope was less than 7°, the effect on the ERI was positive, and when the slope was in the range of 18.5°–23°, the effect on the ERI was negative. The slope of the remaining interval had no significant effect on the ecological risk. When the temperature was less than 2.5°C, the effect on the ERI decreases with the increase in temperature, and when the temperature was higher than 2.5°C, the effect on ERI increases with the increase in temperature. When the precipitation was 30–550 mm, the impact on ERI was positive, and the rest of the impact on ERI was negative. When the population was less than 1,300 people/km2, the impact on ecological risk was positive. When the population was greater than 1,300 people/km2, the impact on ecological risk was negative. When the population increased to 2000 people/km2, the impact on ecological risk remained unchanged. The impact of GDP on ecological risk decreases with the increase in GDP. When GDP was less than 5,000 yuan/km2, the impact on ecological risk was positive. When GDP was greater than 5,000 yuan/km2, the impact on ecological risk was negative. When GDP increases to 6,800 yuan/km2, the impact on ecological risk does not change. When the distance from road is 45,000–130000 m, the impact on ecological risk was positive, and the rest of the impact on the ERI was negative. The distance from habitation was similar to the distance from road. When the distance from habitation was 120,000–190,000 m, the impact on the ecological risk was positive, and the rest of the impact on the ERI was negative.
5 Discussion
5.1 The change in landscape ecological risk
As a key ecological security barrier area in China, the ecological risk of the Yellow River basin increased first and then decreased from 1980 to 2020 and reached the maximum in 2000. It reflected that with the development of social economy and technological progress, the efficiency of human land use was constantly improving and the awareness of ecological environment protection was increasing. It showed that China had long adhered to ecological environment governance and ecological civilization construction and achieved certain results. It showed that the ecological risk in the Yellow River basin was effectively avoided and reduced through the implementation of policies such as forest protection, rural residential renovation, and development and utilization of bare land (Wei et al., 2013; Agrawal and Dixit, 2024). From the perspective of space, due to the large longitude span of the Yellow River basin, the significant differences in topography and climate, and the uneven economic development, the highest-risk areas mainly existed in the upper reaches of the Yellow River basin and the central and northern regions (Zhang et al., 2017).
The highest-risk areas in the upper reaches of the Yellow River basin were densely populated with rivers and lakes, and the water bodies were highly separated. Most of them were used for animal husbandry, and the patches of grassland, forest, and bare land showed staggered distribution. The high degree of separation and serious fragmentation result in relatively poor resistance of the ecological environment. The impact of human factors and natural factors had become more sensitive, resulting in high ecological risks (Liu et al., 2008). The highest risk areas in the north-central Yellow River basin were mainly affected by sand of storm. Land desertification intensified, bare land was increased, and the surface was bare, mainly desert and Gobi desert. The landscape type was single, the structure was fragile, and the agricultural production mode was backward. Unreasonable agricultural production activities led to frequent conversion of land-use types in the region, resulting in a fragile ecological environment and high ecological risk (Liu and Xiao, 2006). Therefore, for the highest-risk areas in the upper reaches of the Yellow River basin, the overall protection and restoration of forest, grassland, and bare land should be strengthened. Take actions that suit local circumstances and rational planning, and make good use of the local natural environment and geographical resources and efficient use of energy. We should strictly abide by the red line of ecological protection, continue to implement natural forest protection, return farmland to grassland, and restore the integrity of landscape cover in damaged areas. Further deterioration of landscape ecological risk should be effectively prevented and controlled (Xin and Ye, 2007). For the highest-risk areas in the north-central Yellow River basin, the bare land should be rationally developed and utilized to reduce land desertification and increase vegetation coverage. The structure of agricultural production should be optimized, and ecological compound planting should be carried out in the fragile area of the agricultural landscape. We should change the mode of agricultural development and improve the levels of informatization and mechanization so as to avoid the reduction in ecological environment quality caused by inefficient agricultural production activities (He et al., 2017).
5.2 Analysis of the influencing factors of landscape ecological risk change
By analyzing the relationship between landscape ecological risk and influencing factors, it was shown that the change characteristics of landscape ecological risk in the Yellow River basin from 1980 to 2020 were complex and dynamic processes, which are affected by many factors. On the whole, it was the result of the interaction between natural factors and human factors. The relative stability of natural factors was the most basic factor to determine the distribution of landscape ecological risk, and human factors had a short-term and significant impact on the change of landscape ecological risk (Liu et al., 2012; Wei et al., 2010).
Natural factors include terrain conditions and climate change. In terms of terrain conditions, the elevation of the Yellow River basin was highest in the west and lowest in the east, and the slope was highest in the southwest and lowest in the northeast. In the aspect of climate change, the temperature was low in the west and highest in the east, and the precipitation was highest in the southeast and low in the northwest. When the elevation is between 3,400 and 4,550 m, the slope was between 2° and 18°, the annual average temperature was between 2°C and 5°C, and the annual precipitation was between 400 and 600 mm; the ecological risk of the higher-risk and highest-risk areas in the upper reaches of the Yellow River basin was relatively large. The decrease in the grassland vegetation coverage was mainly due to the low temperature in this region. The land types with high vulnerability, such as bare land and water body, showed mainly staggered distribution, and the increase in landscape fragmentation and the decrease in connectivity lead to high ecological risk (Houet et al., 2010). When the elevation was 1,100–1,400 m, the slope was 0–2°, the annual average temperature was 9°C–15°C, and the annual precipitation was 150–400 mm; the ecological risk of the higher-risk and highest-risk areas in the middle and north of the Yellow River basin was relatively large. It was mainly due to the dual effects of human activities and harsh climatic conditions in the region. Multiple natural disasters such as drought, storms, blowing sand, and frost had caused more bare land and naked land, and the separation of landscape patches had gradually increased, which caused great harm to grasslands and crops, resulting in an increase in ecological risks (Yan et al., 2020).
Human factors included social economy and human interference. Community economy aspects included population and GDP. The human disturbance included the distance from road and the distance from habitation. The population was the main body that had the greatest impact on the ecological environment. GDP was the direct embodiment of social and economic development, and it was also the best indicator to measure the social and economic situations of the region. Social and economic factors were closely related to ecological risks. As a key element and hub of human activities, the road had a great impact on human survival and production. Habitation directly reflects the importance of geographical location, playing an indispensable role in development (Wang et al., 2021). The above research showed that the effect range of natural and human driving factors on landscape ecological risk was limited, and it was not that the greater the driving factors, the stronger the impact. When the relative impact reached a certain extent, the landscape pattern in the study area was more constrained by various factors, and the impact on ecological risk was relatively small (Song et al., 2010).
5.3 Countermeasures of landscape ecological risk control in the Yellow River basin
The Yellow River basin had a more urgent need for ecosystem protection due to its special geographical location, complex terrain, and social environment. In order to prevent further deterioration of landscape ecological risk, the characteristics of different levels of landscape ecological risk should be considered comprehensively, and targeted ecological environment protection measures should be introduced (Liu et al., 2012). For the highest-risk areas in the upper reaches of the Yellow River basin, the policy of natural restoration as the main method and artificial restoration as the supplement was adopted. The north-central highest-risk area adopted the policy of artificial restoration as the main and natural restoration as the auxiliary method. Strengthened ecological protection, restoration, and monitoring formulated ecological red lines, established a long-term mechanism for landscape ecological protection, repaired broken landscapes, and reduced landscape ecological risk levels. It was necessary to strengthen the regulation and control of the higher-risk areas and enhance the role of regional climate regulation, water conservation, and windbreak and sand fixation. Ecological-oriented government performance evaluation indicators were formulated to prevent the increase in the landscape ecological risk level. For middle-risk areas, the relationship between natural environment and human activities should be coordinated, and the classification and control of land types should be strengthened to ensure that the area of dominant land types is not reduced. The traditional farming methods should be changed, soil nutrients should be gradually stabilized, and soil erosion should be avoided. Good ecological environment protection and monitoring work should be carried out in lower-risk areas and lowest risk areas, and the development model of lowest risk areas should be summarized and promoted.
5.4 Limitations and future research directions
The landscape ecological risk assessment and influencing factor analysis of the Yellow River basin based on LUCC and BRT models achieved good results in the study, but there were also some limitations. First of all, testing the optimal size of the risk zone was an important prerequisite for improving the accuracy of landscape ecological risk in the future. In the future, the difference in landscape ecological risk between the administrative boundary as the risk area and the grid as the risk area should be verified. Second, using the BRT model to study the key influencing factors corresponding to different landscape ecological risk levels needed to be further revealed (Mousavi et al., 2019). Despite these limitations, this study can provide a theoretical basis for the coordinated development of ecological protection and health in the Yellow River basin.
6 Conclusion
The research process of the landscape ecological risk assessment and influencing factor contribution based on LUCC was complex. In this paper, BRT, ERI, and Moran ‘I methods were used to explore the spatiotemporal evolution characteristics and driving factors of landscape ecological risk in the Yellow River basin from 1980 to 2020. The research findings are as follows:
(1) The land-use types in the study area were mainly grassland, farmland, and forest, accounting for more than 88% of the total area. During the years 1980–2020, the LUCC types changed significantly, especially the area of the farmland changed the most, which increased by 34,300 km2 in this period. It was mainly transferred from grassland, the urban land was gradually expanding, and the bare land had been well-developed, resulting in unreasonable changes in LUCC structure.
(2) The spatial distribution pattern of landscape ecological risk in the Yellow River basin was “highest in the north and lowest in the south, highest in the west and lowest in the east.” During the period, the overall ecological risk, moderate-risk, higher-risk, and highest-risk area increased first and then decreased. The overall ecological risk reached the maximum in 2000. Low-risk areas showed a trend of decreasing first and then increasing. Lower-risk areas increased. These regions showed significant spatial correlation and high spatial aggregation, mainly high–high and low–low aggregation types.
(3) Elevation (24.8%) was the most important factor affecting landscape ecological risk, followed by precipitation (17.8%). GDP and temperature were also considered to be unfavorable factors affecting landscape ecological risk, with levels of 15.2% and 14.6%, respectively. It showed that the particularity of the geographical location of the Yellow River basin eventually led to the stronger influence of natural factors on the change in landscape ecological risk under the interference of human activities. Therefore, it is necessary to combine the characteristics of high-risk occurrence. In the upper reaches of the Yellow River basin, the policy of natural restoration was adopted as the main method and artificial restoration as the supplement. The central and northern parts of the region adopt the policy of artificial restoration as the main method and natural restoration as the supplement. The negative impact of changes in the natural environment should be minimized and the healthy development of the Yellow River basin should be promoted.
Data availability statement
The raw data supporting the conclusions of this article will be made available by the authors, without undue reservation.
Author contributions
JY: funding acquisition and writing–original draft. XY: data curation, software, and writing–review and editing. QL: writing–review and editing. MS: writing–review and editing. JL: writing–review and editing. GL: methodology, visualization, and writing–review and editing. GQ: methodology, visualization, and writing–review and editing. HQ: data curation, software, and writing–review and editing. PG: writing–review and editing. MZ: writing–review and editing.
Funding
The author(s) declare that financial support was received for the research, authorship, and/or publication of this article. This work was sponsored in part by the National Natural Science Foundation of China (Research on Ecological Risk Assessment and Control Mechanisms of the Gannan Plateau Landscape in the Upper Reaches of the Yellow River) (42461060); Gansu Province Key Research and Development Program Project (Construction and Demonstration of Ecological Security Pattern of Gannan Plateau Landscape in the Upper Reaches of the Yellow River); the Science and Technology Program for Young Scholars of Gansu Province (22JR5RA367); Gansu Province 2024 Central Government-Guided Local Science and Technology Development Fund Project (Key Technology Research and Development for High Water Efficiency Precision Agriculture in the Hexi Oasis Irrigation District) (24ZYQA023); Gansu Province Department of Education Industry Support Program Project (2022CYZC-41); and Gansu Province Financial Special Fund (GSCZZ 20160909).
Conflict of interest
The authors declare that the research was conducted in the absence of any commercial or financial relationships that could be construed as a potential conflict of interest.
Publisher’s note
All claims expressed in this article are solely those of the authors and do not necessarily represent those of their affiliated organizations, or those of the publisher, the editors, and the reviewers. Any product that may be evaluated in this article, or claim that may be made by its manufacturer, is not guaranteed or endorsed by the publisher.
References
Agrawal, N., and Dixit, J. (2024). An assessment of the geomorphodiversity and land use/cover change (LUCC) effects associated with landslides in Meghalaya, India. Earth Surf. Process. Landforms 49 (4), 1468–1482. doi:10.1002/esp.5769
Bang, Y. Z., Dan, S., and Xin, Y. B. (2019). LUCC analysis of urban agglomeration in central Jilin province based on land use transfer matrix. Jilin Normal University Journal(Natural Science Edition.
Boori, M. S. (2014). Land use/cover, vulnerability index and exposer intensity. Journal of Environments 1 (1), 1–7.
Choi, K. W., Lee, J. H. W., Kwok, K. W. H., and Leung, K. M. Y. (2009). Integrated stochastic environmental risk assessment of the harbour area treatment scheme (HATS) in Hong Kong. Environ. Sci. and Technol. 43 (10), 3705–3711. doi:10.1021/es803244s
Foster, N. L., Rees, S., Langmead, O., Griffiths, C., Oates, J., and Attrill, M. J. (2017). Assessing the ecological coherence of a marine protected area network in the Celtic Seas. Ecosphere 8 (2), e01688. doi:10.1002/ecs2.1688
Froeschke, J. T., and Froeschke, B. F. (2016). Two-stage boosted regression tree model to characterize southern flounder distribution in Texas estuaries at varying population sizes. Mar. COAST Fish. 8, 222–231. doi:10.1080/19425120.2015.1079577
He, J. Y., Zhang, D., and Zhao, Z. Q. (2017). Spatial and temporal variations in hydrochemical composition of river water in yellow river basin, China. Chin. J. Ecol. 36 (5), 1390–1401.
Houet, T., Loveland, T. R., Hubert-Moy, L., Gaucherel, C., Napton, D., Barnes, C. A., et al. (2010). Exploring subtle land use and land cover changes: a framework for future landscape studies. Landsc. Ecol. 25 (2), 249–266. doi:10.1007/s10980-009-9362-8
Kgaphola, M. J., Ramoelo, A., Odindi, J., Kahinda, J. M. M., Seetal, A. R., and Musvoto, C. (2023). Impact of land use and land cover change on land degradation in rural semi-arid South Africa: case of the Greater Sekhukhune District Municipality. Environ. Monit. Assess. 195 (6), 710. doi:10.1007/s10661-023-11104-0
Kooistra, L., Huijbregts, M. A. J., Ragas, A. M. J., Wehrens, R., and Leuven, R. S. E. W. (2005). Spatial variability and uncertainty in ecological risk assessment: a case study on the potential risk of cadmium for the little owl in a Dutch river flood plain. Environ. Sci. and Technol. 39 (7), 2177–2187. doi:10.1021/es049814w
Leuven, RSEW, and Gne, I. P. (2010). Riverine landscape dynamics and ecological risk assessment. Freshw. Biol. 47 (4), 845–865. doi:10.1046/j.1365-2427.2002.00918.x
Li, H. F., Calder, C. A., and Cressie, N. (2010). Beyond Moran's I: testing for spatial dependence based on the spatial autoregressive model. Geogr. Anal. 39 (4), 357–375. doi:10.1111/j.1538-4632.2007.00708.x
Liu, D. D., Qu, R. J., Zhao, C. H., Liu, A. P., and Deng, X. Z. (2012). Landscape ecological risk assessment in Yellow River Delta. J. Food Agric. Environ. 10 (2), 970–972. doi:10.1016/j.foodres.2011.12.018
Liu, J. J., and Wang, C. H. (2007). The present situation of water ecology of yellow River Basin and the countermeasures. Sci-Tech Inf. Dev. and Econ.
Liu, L., and Xiao, F. (2006). Spatial-temporal correlations of NDVI with precipitation and temperature in yellow River Basin. Chin. J. Ecol. 25 (5), 477–481. doi:10.1007/s11390-006-0209-3
Liu, S. L., Cui, B. S., Dong, S. K., Yang, Z. F., Yang, M., and Holt, K. (2008). Evaluating the influence of road networks on landscape and regional ecological risk—a case study in Lancang River Valley of Southwest China. Ecol. Eng. 34 (2), 91–99. doi:10.1016/j.ecoleng.2008.07.006
Liu, Q., Yang, Z. F., and Cui, B. S. (2008). Spatial and temporal variability of annual precipitation during 1961–2006 in Yellow River Basin, China. J. Hydrology 08.002.
Lu, Q., and Mu, Z. (2014). Corrosion pattern of steel carbon in soil by using algorithm of boosted regression trees. J. Central South Univ. 45 (6), 1879–1886.
Martin, M. P., Seen, D. L., Boulonne, L., Jolivet, C., Nair, K. M., Bourgeon, G., et al. (2011). Optimizing pedotransfer functions for estimating soil bulk density using boosted regression trees. Soil Sci. Soc. Am. J. 73 (2), 485–493. doi:10.2136/sssaj2007.0241
Mousavi, S. R., Sarmadian, F., and Rahmani, A. (2019). Modelling and prediction of soil classes using boosting regression tree and random forests machine learning algorithms in some part of qazvin plain. Biostatistics. doi:10.22059/IJSWR.2019.280905.668198
Naser, H. A. (2015). The role of environmental impact assessment in protecting coastal and marine environments in rapidly developing islands: the case of Bahrain, Arabian Gulf. Ocean and Coast. Manag. 104 (feb), 159–169. doi:10.1016/j.ocecoaman.2014.12.009
Parker, D. C., Manson, S. M., Janssen, M. A., Hoffmann, M. J., and Deadman, P. (2003). Multi-agent systems for the simulation of land-use and land-cover change: a review. Ann. Assoc. Am. Geogr. 93, 314–337. doi:10.1111/1467-8306.9302004
Song, X. N., Zhu, X. H., Li, X. T., and Li, X. H. (2010). A landscape ecological analysis of the change and drive pattern in the middle shiyang river valley. Remote Sens. Land and Resour.
Trevisan, D. P., Bispo, P. D. C., Almeida, D., Imani, M., Moschini, L. E., and Eduardo Moschini, L. (2020). Environmental vulnerability index: an evaluation of the water and the vegetation quality in a Brazilian Savanna and Seasonal Forest biome. Ecol. Indic. 112, 106163. doi:10.1016/j.ecolind.2020.106163
Veerle, V. E., and Andreas, A. C. (2023). Theories in landscape ecology. An overview of theoretical contributions merging spatial, ecological and social logics in the study of cultural landscapes. Landsc. Ecol. 38 (12), 4033–4064. doi:10.1007/s10980-023-01736-5
Vetrova, N. M., Ivanenko, T. A., Sadykova, G. E., and Sudjeva, D. V. (2020). On the assessment of the environmental ecological state in coastal cities. IOP Conf. Ser. Mater. Sci. Eng. 913 (5), 052035. doi:10.1088/1757-899x/913/5/052035
Wang, H., Liu, X., Zhao, C., Chang, Y., and Zang, F. (2021). Spatial-temporal pattern analysis of landscape ecological risk assessment based on land use/land cover change in Baishuijiang National nature reserve in Gansu Province, China. Ecol. Indic. 124, 107454. doi:10.1016/j.ecolind.2021.107454
Wei, O., Skidmore, A. K., Toxopeus, A. G., and Hao, F. (2010). Long-term vegetation landscape pattern with non-point source nutrient pollution in upper stream of Yellow River basin. J. Hydrology 389 (3-4), 373–380. doi:10.1016/j.jhydrol.2010.06.020
Wei, Z., Li, Z., Jian, L., Li, C., Li, Z., and Yang, Y. (2013). Pollution characteristics and potential ecological risk assessment of heavy metals in the lake wetlands in the Yellow River valleys of Ningxia. Chin. Agric. Sci. Bull.
Xie, H., Liu, L., Li, B., and Zhang, X. (2006). Spatial autocorrelation analysis of multi-scale land-use changes: a case study in Ongniud Banner, Inner Mongolia. Acta Geogr. Sin. 61 (4), 389–400. doi:10.1016/S1004-4132(06)60027-3
Xie, H. L., and Li, B. (2004). A study on indices system and assessment criterion of ecological security for city. J. Beijing Normal Univ. Sci. 40 (5), 705–710.
Xin, F. Q., Chang, M. L., and Yan, Z. (2003). Changes of pan evaporation in the recent 40 years over the yellow River Basin. J. Nat. Resour.
Xin, S., and Ye, Q. I. (2007). Dynamic assessment of ecological carrying capacity of yellow River Basin in Qinghai province. Chin. J. Ecol. 26 (3), 406–412.
Yan, X. U., Junfengamp, G., and Yongnian, G. (2011). Landscape ecological risk assessment in the Taihu region based on land use change. J. Lake Sci. 23, 642–648. doi:10.18307/2011.0422
Yan, Y., Yang, L., Wang, W., Fang, H., and Zhuang, Q. (2020). Analysis of spatial-temporal variation of landscape ecological risk and its terrain gradient in Ili valley.
Zhang, D., Guo, Y., Rutherford, S., Qi, C., Li, X., Wang, P., et al. (2019). The relationship between meteorological factors and mumps based on Boosted regression tree model. Sci. Total Environ. 695, 133758. doi:10.1016/j.scitotenv.2019.133758
Zhang, Q., Zhang, Z., Shi, P., Singh, V. P., and Gu, X. (2017). Evaluation of ecological instream flow considering hydrological alterations in the Yellow River basin, China. Glob. Planet. Change 160, 61–74. doi:10.1016/j.gloplacha.2017.11.012
Keywords: landscape ecological risk assessment, boosted regression tree model, influencing factor, land-use/land-cover change, Yellow River basin
Citation: Yan J, Yao X, Li Q, Song M, Li J, Li G, Qi G, Qiao H, Gao P and Zhang M (2024) Ecological risk assessment and influencing factor analysis of the Yellow River basin based on LUCC and boosted regression tree. Front. Environ. Sci. 12:1465475. doi: 10.3389/fenvs.2024.1465475
Received: 16 July 2024; Accepted: 04 September 2024;
Published: 26 September 2024.
Edited by:
Erhan Sener, Süleyman Demirel University, TürkiyeReviewed by:
Beata Calka, Military University of Technology in Warsaw, PolandMurat Akten, Süleyman Demirel University, Türkiye
Copyright © 2024 Yan, Yao, Li, Song, Li, Li, Qi, Qiao, Gao and Zhang. This is an open-access article distributed under the terms of the Creative Commons Attribution License (CC BY). The use, distribution or reproduction in other forums is permitted, provided the original author(s) and the copyright owner(s) are credited and that the original publication in this journal is cited, in accordance with accepted academic practice. No use, distribution or reproduction is permitted which does not comply with these terms.
*Correspondence: Jixuan Yan, eWFuaml4dWFuZEBzaW5hLmNvbQ==
 Jixuan Yan
 Xiangdong Yao1
 Qiang Li