- 1College of Rural Revitalization, Fujian Agriculture and Forestry University, Fuzhou, China
- 2Multifunctional Agricultural Application Research Institute, Fujian Agriculture and Forestry University, Fuzhou, China
- 3Institute of Agricultural Economy and Science Information, Fujian Academy of Agricultural Sciences, Fuzhou, China
- 4College of JunCao Science and Ecology, Fujian Agriculture and Forestry University, Fuzhou, China
The increasing demand for tea has resulted in the swift expansion of tea plantations, leading to significant alterations in the local ecosystem. This has garnered considerable attention. However, research on rationally modifying land use structures (LUSs) in specialized tea regions to achieve a balance with ecosystem services (ESs) and enhance their synergistic effects remains limited. In this study, we quantified the values of water yield (WY), soil conservation (SC), carbon storage (CS), and habitat quality (HQ) by the InVEST model, utilized K-means clustering to categorize the LUSs of the village areas in Anxi County from 2010 to 2020, and then investigated the influences of the LUSs on the ESs by the improvement of the constraint line tool, according to which we utilized the ecosystem services trade-off degree (ESTD) and the Pearson correlation coefficient to explore the trade-offs and synergies among ecosystem services. The findings indicated that: (1) LUSs in Anxi County are tea garden structure (TS), forest land-tea garden structure (FTS), and construction land-cropland-tea garden structure (CCTS); (2) In LUSs, to achieve a balance among WY, SC, CS, and HQ, the dominant land use proportions were as follows: 0.5 for tea plantations in TS; a range of 0.55–0.6 for forest land and 0.05–0.1 for tea plantations in FTS; and CCTS, 0.25–0.3 for built-up land, 0–0.1 for cropland, and 0.2 for tea plantations; (3) The trade-offs and synergies of ESs vary across different LUSs. The synergy is particularly evident in FTS. Increasing the quantity of forest area is helpful in enhancing the synergy of ESs. This study offers an analysis of the effect of LUSs on ESs and their interconnections in specialized tea planting regions. It serves as a valuable insight into informing urban planning for future land usage and ecological conservation efforts.
1 Introduction
Land use connects human activities and interactions within natural ecosystems (Lang and Song, 2019). For many types of ecosystems, like grasslands (Schirpke et al., 2017), woodlands (Delphin et al., 2016), agricultural lands (Wu et al., 2018), and dry lands (Peng et al., 2018), protecting ESs requires good land use planning and the right land use structures (LUSs). It has been shown that natural factors like changes in climate, topography, soil composition, and vegetation, as well as human activities like urbanization, farming, animal husbandry, and efforts to restore ecosystems, all have an effect on ecosystem services (Arevalo et al., 2011; Chen et al., 2020; Huang et al., 2021; Jiang et al., 2022; Kucharik et al., 2000; Sannigrahi et al., 2020; Zeng et al., 2023; Zhang et al., 2022). While earlier research has come up with ways to improve the provision of ecosystem services by keeping important factors within certain limits (Biao et al., 2022), these methods usually have an indirect effect on how land is used instead of putting in place direct method. Real changes in land use relate to the impacts of different types of land use structures (Liang et al., 2021), and its immediate ramifications on ecosystem services remain insufficiently examined. This knowledge gap consequently restricts the capacity of policymakers to formulate efficacious strategies for land conservation and management.
In the realm of agricultural production, tea emerges as a significant cash crop whose global cultivation expansion poses new challenges to ecosystem services (Li et al., 2023a; Li et al., 2023b). The critical question of effectively governing specialized tea planting regions to foster sustainable ecosystem development has garnered widespread attention. The integration of 3S technology in the study of ecosystem services has spurred scholars to focus more intensively on the long-term, regional, and dynamic changes of ecosystem services, emphasizing aspects such as trade-offs and synergies, regional discrepancies, and clustering characteristics (Huang J. et al., 2023; Liu et al., 2023a; Liu et al., 2023c; Yang et al., 2024; Zhang et al., 2023). Scholars have widely used correlation analysis (Li and Luo, 2023; Tan et al., 2024), cluster analysis (Huang F. et al., 2023), and other multivariate analysis methods to explore the different relationship characteristics among ecosystem services. They have also used geographical detectors (Liao et al., 2024; Zuo et al., 2023), principal component analysis (Silva et al., 2024), and scenario simulation (Fang et al., 2023; Liu et al., 2023c) to further explore the driving factors, formation mechanism, and future development prediction of ecosystem service tradeoff synergy. Myriad factors influence interactions between variables in complex ecological processes, often displaying a distribution akin to scattered clouds (Blackburn et al., 1992; Cade and Guo, 2000). Therefore, researchers use the constraint line method to outline the limiting effects of various factors on response variables in complex ecosystems (Hao et al., 2017; Liu et al., 2023d; Qiao et al., 2019). Current studies on ES in tea plantations mainly focus on quantifying the ES (Liu et al., 2021; Shui et al., 2017; Sohel et al., 2015), the interaction of ES (Wang et al., 2023), and the influencing factors of ES (Feng and Sunderland, 2023; Jiang et al., 2023a; Li et al., 2023b), the spatial pattern (Li X. et al., 2023), and other related studies. However, the research on directly adjusting the land use structure of specialized tea planting regions to promote the balance of ecosystem services and enhance its synergy effect is insufficient. On the research scale, relevant studies primarily highlight the spatial pattern and internal relationships of ESs at the county, township, grid, and other levels. Given that the village area is the smallest unit for implementing ecological protection in China’s territorial spatial planning (Chen and Xu, 2022), policymakers find it more convenient to implement policies there. Therefore, it is necessary to clarify the impact of different land use structures on ecosystem services in specialized tea planting regions at the village scale to provide more accurate reference information for tea garden ecosystem balance and sustainable agricultural management.
China is globally recognized as the leading country in tea production and marketing (Jiang et al., 2023b). Anxi County, known as the “Hometown of Chinese Oolong Tea,” consistently holds the top position among China’s major tea-producing counties in terms of tea production. The tea trade is a crucial economic sector in Anxi County (Xiao et al., 2018; Zeng et al., 2013), making it a prime example of specialized tea planting regions. Based on the above background, this study concentrates on Anxi County as the study region and the village as the study scale. It measures the values of four key ecosystem services—water yield (WY), soil conservation (SC), carbon storage (CS), and habitat quality (HQ)—in the study area from 2010 to 2020 using the InVEST tool. The study also classifies the land use structure in the study region using K-means clustering. Furthermore, it investigates the influence of LUSs on ESs by improving the constraint line. The trade-off and synergies among the ESs are then measured quantitatively using the ESTD model and Pearson correlation coefficient. This study aims to provide a scientific theoretical basis in similar areas worldwide through in-depth research and understanding of the effects of land use structure on ecosystem services in specialized tea planting regions, which is important for realizing the harmonious coexistence of ecological protection and agricultural development. Specifically, the main research objectives are (1) to identify LUSs in specialized tea areas through cluster analysis, (2) to determine the proportion of dominant land balancing the four ESs in different LUSs using improved constraint lines, and (3) to explore the trade-offs/synergies of ecosystem services in specialized tea areas.
2 Materials and methods
2.1 Study area
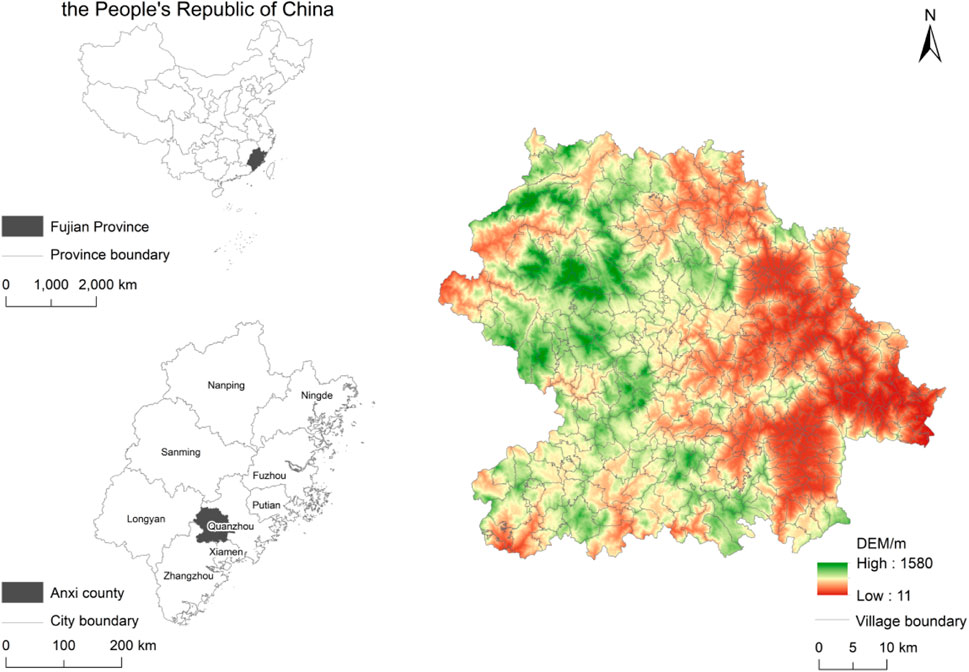
Anxi County is situated in the southeastern region of Fujian Province, within Quanzhou City. It is positioned on the outskirts of the Xiamen-Zhangquan Economic Circle, providing it with a notable geographical advantage. Anxi County’s latitude ranges from 24°50′ to 25°26′N, while its longitude spans from 117°35′ to 118°17′E. The topography of the county inclines from the northwest to the southeast, with higher elevation in the northwest and lower elevation in the southeast (Figure 1). The eastern region is characterized by a relatively low elevation and is predominantly covered by hills. In contrast, the western region is characterized by higher elevations and is dominated by medium and low mountains. The soil is mostly acidic red soil and yellow soil, which is suitable for tea planting. Anxi has a temperate and moist environment, with 1,850 h of average annual sunshine, a median yearly temperature ranging from 16°C to 22°C, and an annual rainfall level of 1,400–2,000 mm. These circumstances provide optimal light and humidity for the cultivation of tea plantations. Anxi County is divided into 15 towns and nine townships. As of the end of 2020, the county had a resident population of over 1,027,000. More than 70% of the population resides in rural areas, which contributes to a plentiful workforce for the tea business. In the same year, the county’s GDP amounted to 74.763 billion yuan, with a per capita GDP of 74.391 yuan. The tea industry, as a pillar industry, accounted for 37.45% of the county’s total output value and was the primary sort of revenue for local farmers. Using Anxi County as the study area has typical representative significance among specialized tea areas.
2.2 Data resource
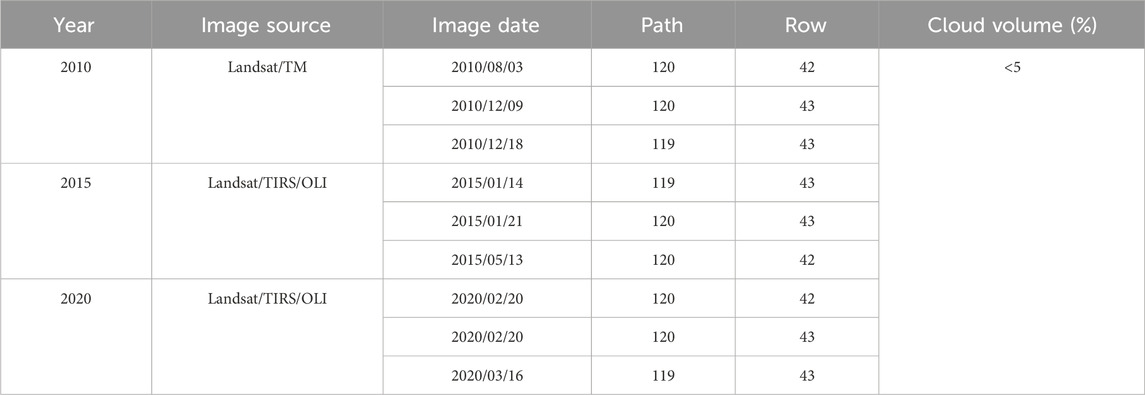
The research area’s remotely sensed imaging data were principally acquired from Landsat/TM/TIRS/OLI, retrieved on 16 September 2022, and provided by Geospatial Data Cloud (http://www.gscloud.cn). Table 1 displays a total of nine image data points obtained from three different time periods (2010, 2015, and 2020) due to variations in satellite shooting angle and other factors. Image splicing, cropping, and correcting techniques are employed to manipulate the image data from each time period. The data is then turned into a true color display using a band combination. Finally, it is compared with the accurate historical image data from Google Earth Pro. Following visual interpretation, on-site verification, and calibration, the study area was divided into nine land categories using the maximum likelihood method. These categories, based on the Classification Standard of Land Use Status (GB/721010-2017) and research requirements, include woodland, shrub, grassland, cropland, tea garden, orchard, building land (settlement, industrial and mining land, and town), mudflat, and water body. The classification accuracy for these periods was 87.63%, 86.92%, and 88.32%, respectively, which fulfilled the research requirements. Non-remote sensing image data sources are shown in Table 2.
2.3 Land use structure identification
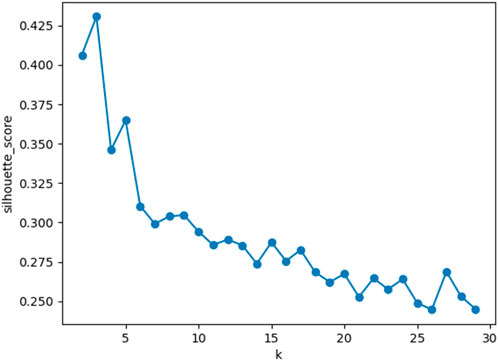
At present, the research scale of the ecosystem in Anxi County, a specialized tea area, is more integrated into the scale of the township or grid, while the study of the village domain as the smallest administrative unit is few. There are 468 village-level administrative units in Anxi County, with an area ranging from 851 km2 to 605,450 km2, with an average area of 63,874 km2. In this study, the number of clusters was determined by calculating and visualizing contour coefficients in Python (Figure 2), and the K-means clustering method of SPSS 26.0 was used to divide village areas into different structural categories according to the land cover ratio of forest, cropland, shrubs, grassland, waters, construction land, mudflat, tea garden, and orchard.
2.4 Quantifying ecosystem services
2.4.1 Water yield (WY)
WY of the research region represents the region’s water supply capacity. The WY module of the InVEST model is computed using the water balance principle and takes into account plant cover, land use, terrain, soil texture, among other relevant aspects. The primary equation works as below Equation 1:
Where:
2.4.2 Soil conservation (SC)
SC is determined by potential soil erosion and actual soil erosion. In this study, a modified general soil loss equation (
The formula:
2.4.3 Carbon storage (CS)
The CS component of the InVEST model categorizes the ecosystem service of carbon storage into four parts: above-ground carbon storage, subsurface carbon storage, soil carbon storage, and carbon storage of deceased organic matter (Zhang et al., 2021). Based on this module, this study calculates the carbon storage of the basin, and the formula is as follows Equation 3:
In this formula:
2.4.4 Habitat quality (HQ)
In order to evaluate the habitat quality of Anxi County, the researchers utilized the habitat quality module of the InVEST model, which can provide insights into the regional biodiversity state (Gong et al., 2019b). The assessment of habitat quality was conducted using the following formula Equation 4:
In this formula:
2.5 The constraint effect of LUSs on ESs
Constraint lines are a well-established tool for examining the relationship between ESs and the influence of geographical factors. They effectively describe how limiting variables affect response variables in the constraint process (Hao et al., 2017). At present, the parameter method, scatter cloud grid method, quantile regression method, and quantile partitioning method are the primary approaches to creating constraint lines (Wang et al., 2022). Local Outlier Factor (LOF) is a density-based local outlier factor anomaly detection algorithm, which is the most representative method among the outlier detection methods, which determines the anomalies by comparing the locally reachable densities between the sample points and their nearest neighbors (Breunig et al., 2000). This study used the LOF algorithm to identify the abnormal data points in a set of standardized dispersed points. Segment the dispersed cloud into sections based on the x-axis value range. Determine the maximum value inside each interval as the boundary point and use these boundary points to fit every constraint line. Utilizing Origin 2021 software, conduct a simulation to derive the ideal constraint line by considering the form and efficiency for fit (R2) for the dispersed cloud. Take the average value of the village as the ES value. Analyze the form of the constraint line to identify the line shape and choose the function that most closely matches it.
2.6 Trade-offs and synergies of ES
Ecosystem services trade-off degree (ESTD) can better clarify the relationship among services (Zhang et al., 2020). On the dynamic time scale, the calculation method of Gong was referred to and improved (Gong et al., 2019a), so that
Where,
3 Results
3.1 Spatial distribution of land use structure
The LUSs of specialized tea planting locations were classified into three categories using K-means clustering (Figure 3): tea plantation structure dominated by tea plantations (TS), forest tea plantation structure dominated by forest land (FTS), and mixed tea plantation structure dominated by construction land and cropland (CCTS). Aside from the tea garden, the presence of additional land classes like bushes, orchards, and construction land is relatively low. This indicates that the main function of this area is tea growing. In FTS, forest land accounted for more than 38%, and forest land was the main feature. In other land types of CCTS, although most of the proportion is lower than that of construction land and cropland, there are certain distributions in various proportions, showing the diversity of this type of land use.
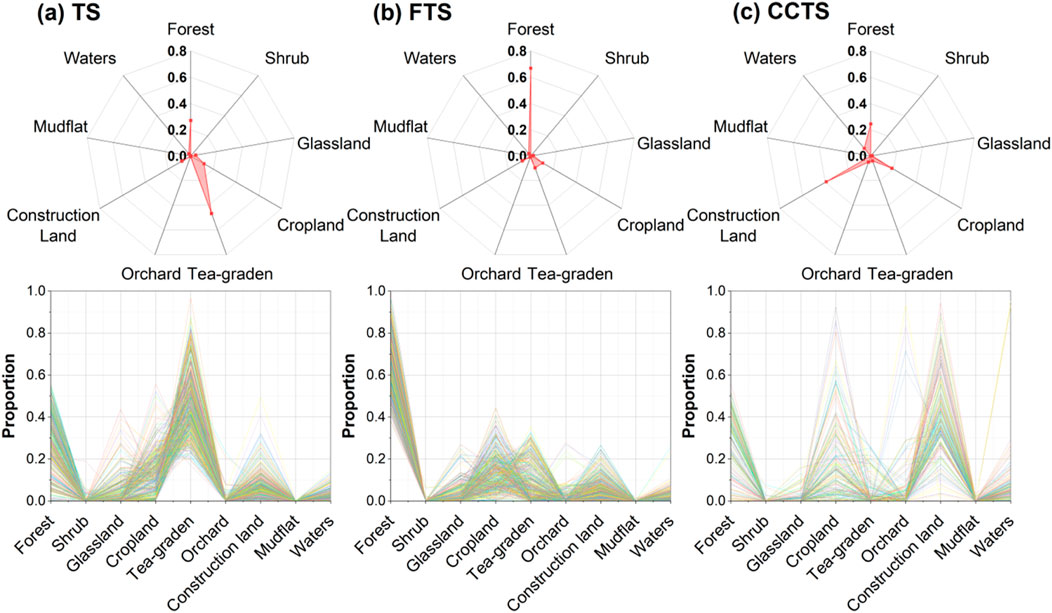
Figure 3. Land use components (line chart) and cluster centers (radar chart) of the three land structure types. Tea plantation structure (TS); Forest tea garden structure (FTS); The mixed tea garden structure mainly consists of construction land and cropland (CCTS). (A) TS. (B) FTS. (C) CCTS.
In the 10 years from 2010 to 2020, the land use structure of Anxi County has changed obviously. Overall, there was a substantial increase in the share of tea plantation lands across all three types of land (Figure 4). This could be attributed to Anxi County’s financial growth strategy, which focuses on establishing itself as a specialized tea-producing region. In terms of various LUSs, the number of villages in TS remained stable at 159, most of which are located in the county’s western and central regions. Furthermore, the movement in TS mostly occurred from the northern region to the center and southern regions of the county since these areas have a more level topography that is suitable for tea cultivation. The FTS saw a decline in the number of settlements from 253 to 251. Nevertheless, there was a concurrent increase in forest area, indicating the successful execution of afforestation and forest conservation strategies, especially in the elevated and undulating areas of the northern and western regions. Simultaneously, CCTS is mostly dispersed throughout the western and southern regions, characterized by generally level topography. As a result of the fast progress of urbanization in the previous decade, the count of CCTS has risen from 56 to 58 villages. Although there has been an increase in the amount of land used for building, there has been a major decline in the amount of land used for agriculture.
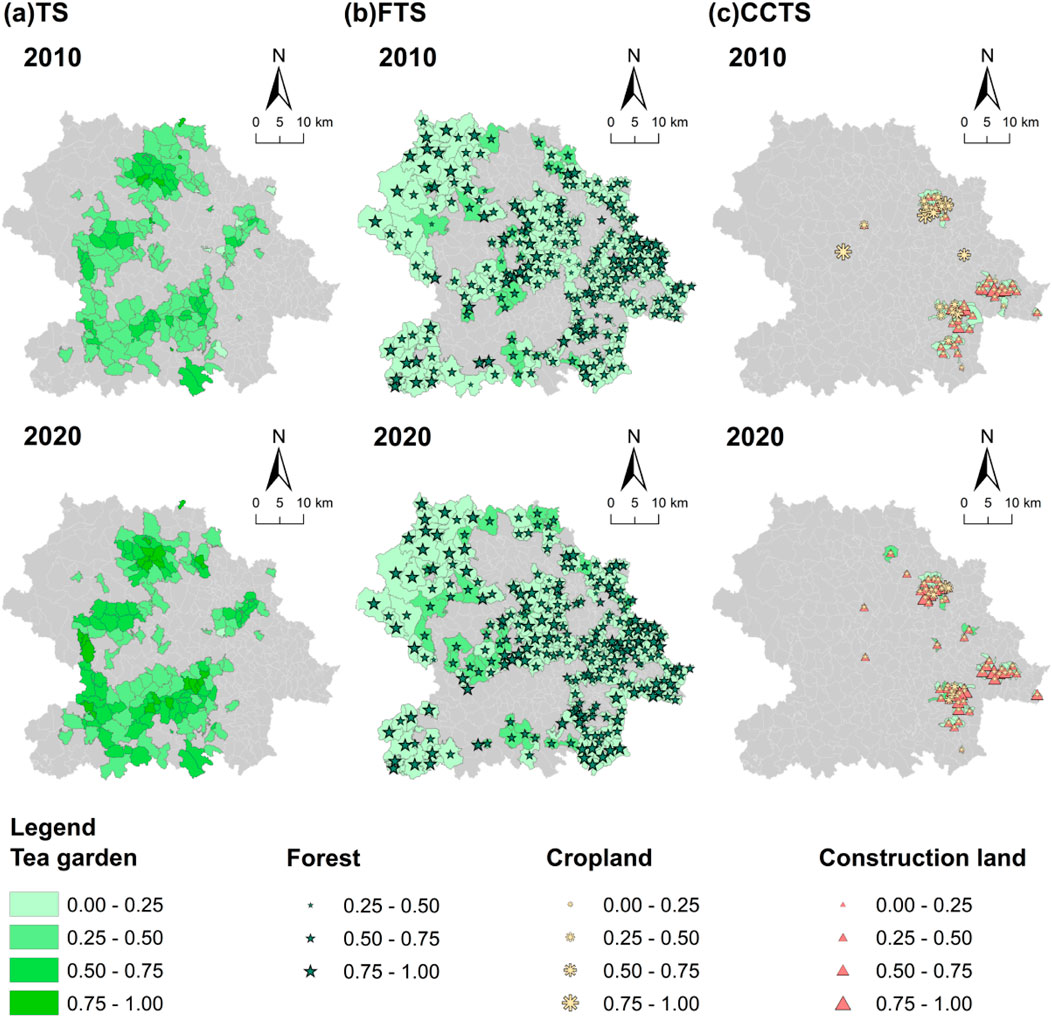
Figure 4. Comparison of village LUSs in Anxi County from 2010 to 2020. (A) Tea plantation structure (TS); (B) Forest tea garden structure (FTS); (C) The mixed tea garden structure mainly consists of construction land and cropland (CCTS).
There is a mutual conversion between TS, FTS, and CCTS. The quantitative transformation of LUSs in Anxi County mainly occurs between FTS and TS, and the transformation from FTS to TS (Figure 5). Due to the requirements of specialized tea area economic development mainly occurring around township centers, the transformation from TS to FTS mainly occurs in the steep terrain suitable for forest planting in the north and central regions. Subsequently, there is a mutual conversion between CCTS and FTS. The conversion from CCTS to FTS primarily occurs in the south, while the conversion from FTS to CCTS mainly occurs at the junction of Anxi County. Human activities are more frequent and greatly affected, resulting in more villages converting to CCTS.
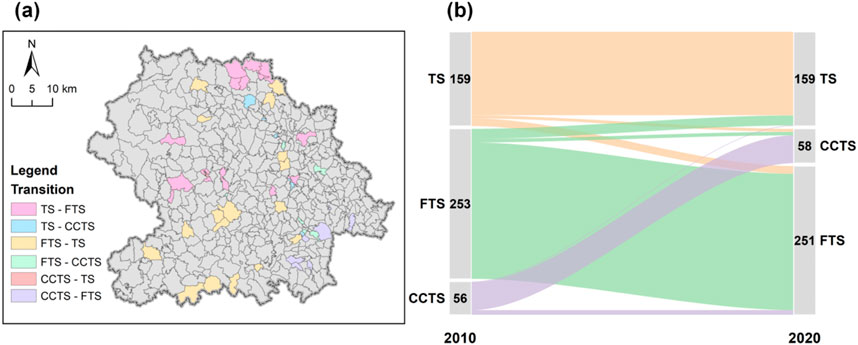
Figure 5. Transformation of village land use structure in Anxi County during 2010–2020. (A) Location of village land use structure change, (B) Sankey diagram of land use structure transformation during 2010–2020.
3.2 Constraint effect of LUSs on ESs
The restrictions of the LUSs on WY are less evident than those on CS, SC, and HQ (Figure 6), based on the contours of the constraint lines and boundary values. In TS, SC, CS, and HQ are hump curves, and WY are double hump curves. The TS can more effectively harmonize the four ES when the tea plantings are at a ratio of 0.5. CS and HQ peaked when the proportion of tea plantings was smaller (0.35–0.4). Out of the TS, SC exhibits the greatest value when the proportion of tea plantations is 0.5. While WY grew and then gradually fell as the fraction of tea plantations reached 0.75, SC, CS, and HQ steadily decreased as the proportion of tea plantations continued to rise.
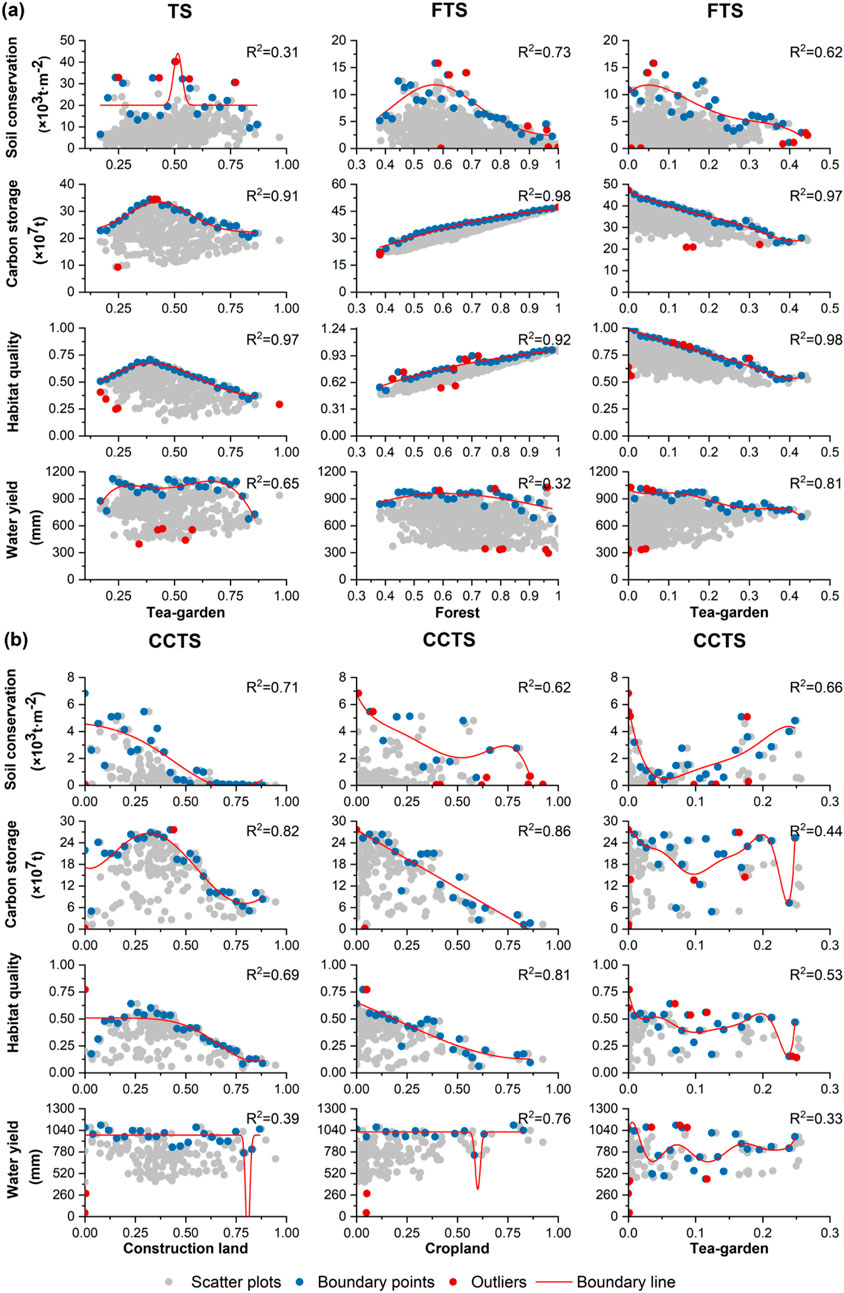
Figure 6. Constraint effect of prevalent land use ratio of three LUSs on ESs (P < 0.01). Y-axis, ecosystem service; X-axis, ratio of principal land utilization type in village. (A) Tea plantation structure (TS) and Forest tea garden structure (FTS); (B) The mixed tea garden structure primarily considers construction land and cropland (CCTS).
In the forest land occupation curve of FTS, the constraint line for SC is a hump curve, the constraint line for CS and HQ is close to positive linear, and the constraint line for WY is a flat convex wave curve. When the forest land proportion falls within the range of 0.55–0.6, the equilibrium of the 4 ES may be improved. If the forest land proportion is smaller than 1, CS and HQ exhibit an increase as the forest land proportion increases. Within the tea garden’s possession curve, the constraint line of SC is a convex wave curve, the constraint line of CS and HQ is nearly negative linear, and the constraint line of WY is a flat semi-convex wave. When the proportion of tea garden is between 0.05 and 0.1, the relationship between ES can be better balanced.
In CCTS, SC is nearly negative linear, CS is a hump curve, HQ is a convex wave curve and WY is a negative hump curve. SC is a semi-concave curve, CS and HQ are close to negative linear, and WY is a negative hump curve. In the possession constraint line of the tea garden, SC a is concave wave curve, CS and HQ are the semi-concave wave curves, and WY is a three-peak curve. The land use composition of mixed structure is the most complex and has multiple constraints. The balance of the four ecosystem services is satisfactory when the proportion of building land, farmland, and tea garden is between 0.25 and 0.3, 0 and 0.1, and 0.2, respectively.
3.3 Ecosystem service trade-offs and synergies changes under various LUSs
The trade-offs and synergies that happen when ecosystem services change over time in the research region from 2010 to 2020 are shown in Figure 7. Only WY-SC and HQ-CS have clear synergies, and the area is pretty big. The four remaining pairings of ESs exhibit significant trade-offs, with synergistic effects primarily observed in the central and western regions. When comparing the entirety of Anxi County, there were noticeable difference in the trade-offs among ESs based on various LUSs (Figure 8). In the field of TS, the majority of ESs exhibit a significant trade-off connection, particularly in WY-CS. The trade-offs and synergistic interactions among ESs in FTS are stronger. The synergistic region between WY-SC and HQ-CS, characterized by a high degree of synergy, exceeds 90%. Additionally, the region of the trade-off between the other four ESs is above 80%. Within CCTS, the synergistic effects between WY-SC and HQ-CS accounted for 91% and 84%, respectively, which is significantly larger than the corresponding trade-offs. However, the trade-offs among other ESs were not significantly distinct from the synergies in terms of their area.
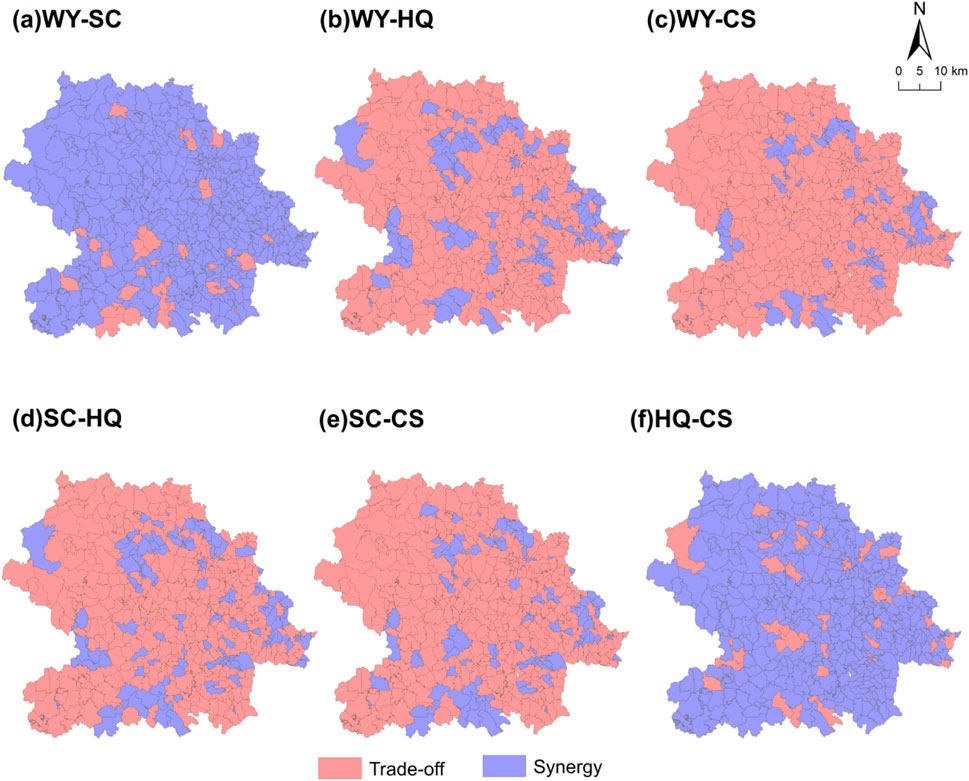
Figure 7. Spatial pattern of trade-offs and synergies among ecosystem service pairs in Anxi County from 2010 to 2020. (A) WY-SC. (B) WY-HQ. (C) WY-CS. (D) SC-HQ. (E) SC-CS. (F) HQ-CS.
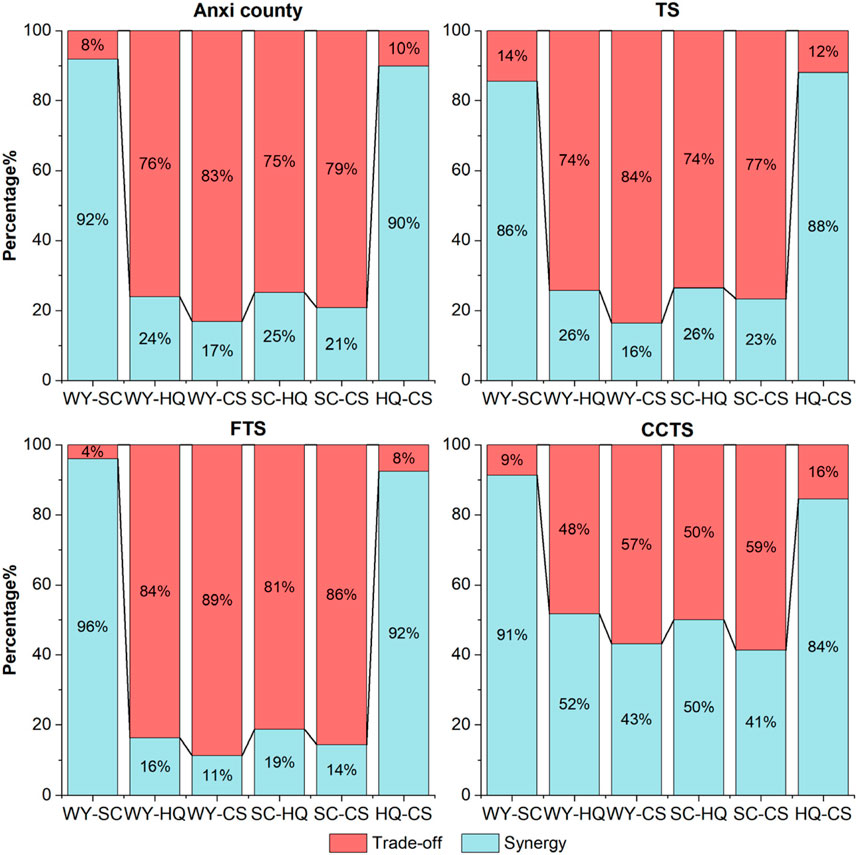
Figure 8. Area proportion of trade-offs and synergies among ecosystem service pairs in Anxi County from 2010 to 2020.
Figure 9 illustrates the correlation among each ecosystem service in 2010, 2015, and 2020 from a static perspective. From 2010 to 2020, the WY-SC and HQ-CS in Anxi County exhibited a synergistic relationship, whereas the remaining pairs of ESs showed a trade-offs relationship. Additionally, the correlation coefficients for all ecosystem service pairs passed the significant test with a p value below 0.001. Among the variables, the correlation coefficient between WY-SC declined from 0.52 to 0.47, indicating a weaker synergistic link. However, there was an increase in the trade-offs among HQ-WY and HQ-SC and a slowdown in the trade-offs among CS-WY and CS-SC. In terms of various LUSs, the relationship of TS to each ecosystem service is significant, and it is consistent with the trade-offs synergistic results in the Anxi County study. The interdependence between WY-SC was significantly diminished compared to the total county level, whereas the level of the interaction among ESs in this area was generally low. In FTS, only WY-SC and HQ-CS were considerably greater than 0.001 in 2000, 2010, and 2020, but the synergistic effect was higher than that of the whole Anxi County, and the synergistic effect between the ecosystem service pairs was stronger. In CCTS, it was shown that only two out of the six pairs of ecosystem services were at a significance level of 0.001 in 2000, 2010, and 2020. However, the trade-offs across ecosystem services were more pronounced, particularly in WY-HQ.
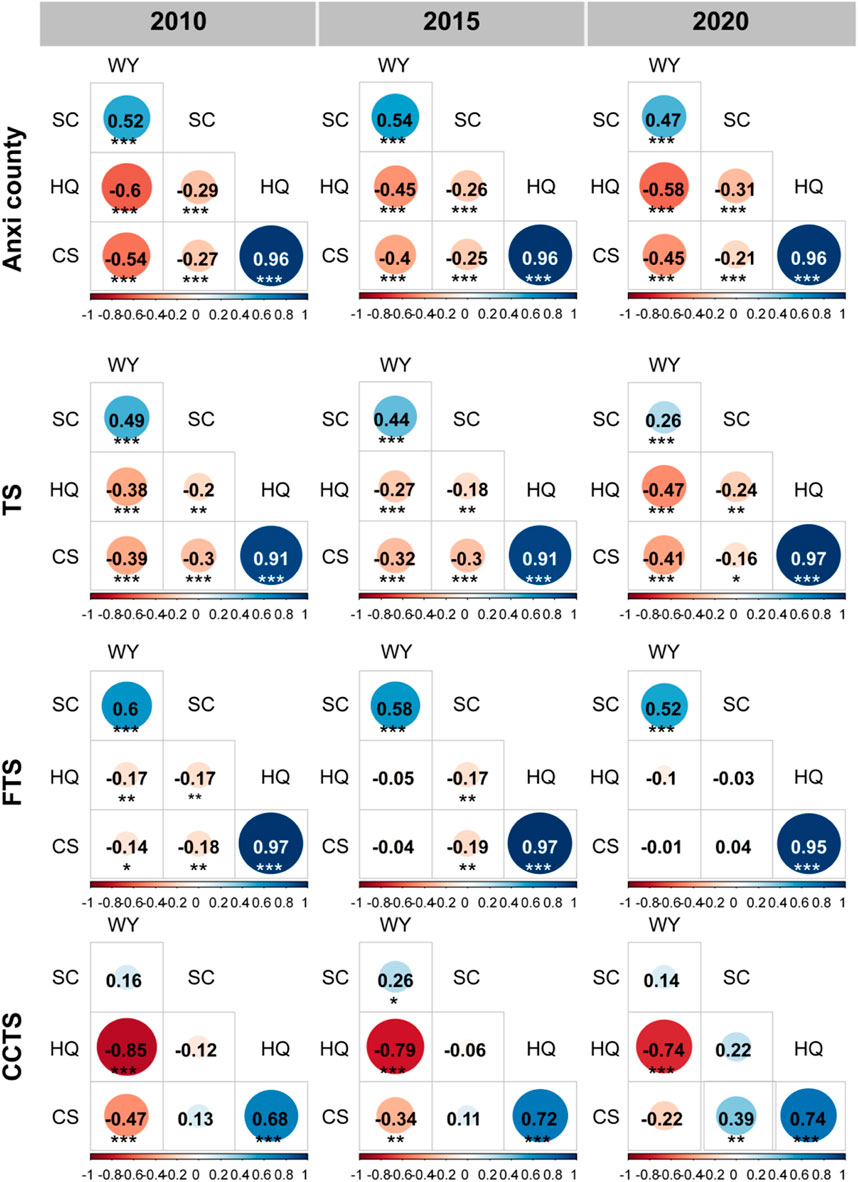
Figure 9. Correlation between ES pairs in Anxi County and different LUSs in 2010, 2015, and 2020 (*p < 0.05; **p < 0.01; ***p < 0.001).
4 Discussion
4.1 Transformation of land use structure
This study utilizes K-means clustering to classify LUS (Figure 3), a method commonly employed in ecosystem service partitioning (Gao et al., 2019; Li X. et al., 2023) and therefore this study suggests that this attribute-value-based approach is also applicable to the spatial domain. In addition, to guarantee the dependability of the clustering outcomes, the silhouette coefficient was employed to ascertain the optimal number of K-means clusters. Aside from geographical limitations, the land-use composition in a village is significantly shaped by macro-policy regulations, resulting in changes to the land use structure (Li et al., 2013). Anxi County is committed to becoming a renowned tea-producing county in China by focusing on the tea business and establishing a comprehensive development pattern that encompasses the entire industrial chain. This strategic approach has resulted in significant economic growth in the region. Anxi County has consistently held the top position among the major tea-producing counties in China since 2009, achieving numerous national milestones in tea plantation development, tea production, total value of tea-related products, tea industry workforce, number of beneficiaries, per capita income derived from tea, and overall completeness of the tea industry chain. Until 2023, the value of tea-related products has reached 36.2 billion yuan (Zhang and Li, 2022). As a result of Anxi County’s strong progress in the tea business, the proportion of tea gardens in the county has increased dramatically, with the greatest concentration found in TS.
In 2009, the Anxi County Government released the “Hundred Tea Plantation Hills Planting and Greening Planning Opinions” and subsequently implemented the “Tea to Forest” policy. This policy aimed to convert ecologically vulnerable areas, low mountains, and abandoned tea plantations into forested areas. Valuable tree species were planted in these tea hills to promote greening efforts in the tea plantations. The objective is to enhance the establishment of ecological tea plantations, ranging from a single model to the original ecological model, with the aim of efficiently managing soil erosion in the area and fostering the sustainable growth of tea production (Hong et al., 2024). Therefore, we noticed a decline in the quantity of FTS, but there was a rise in the percentage of forested regions. This indicates that tea plantations are undergoing a shift towards a more ecologically sustainable model.
Between 2010 and 2020, Anxi County experienced tremendous socio-economic development and urbanization, resulting in notable alterations in land use patterns. The growing need for construction land, fueled by industrial, commercial, residential, and transportation requirements, results in the growing area of construction land and the decline of cropland. This tendency aligns with the documented rise in the number of Comprehensive City and County Traffic Studies (CCTS), demonstrating the effect of urbanization on modifications in land utilization. Li found a similar situation in the Hexi region (Li Y. et al., 2023).
4.2 Constraint effects of LUSs on ESs
In this study, we try to determine the optimal land fraction that may effectively balance ecosystem services using a constraint line. This will directly aid in the development of land use optimization at the village level. Previous studies often employ the quantile division method to analyze the impact of ESs constraints. However, within this study, we use village as the study scale, which has a significantly smaller number of scattered points compared to those derived from raster data. Hence, the LOF approach is employed to detect outliers. Next, partition the distribution of an independent variable on the X-axis into several intervals and designate the highest value inside each interval as the boundary point for the constraint line. Afterwards, the curve is fitted accordingly. In comparison to the quantile division method, this process is better suited for situations with little data. What is more, it can further focus the discrete point below the limiting line, resulting in a better visualization of the feature between LUS and ESs.
The alteration in the trajectory of the constraint line seen in Figure 6 indicates that the ecosystem services is limited by modifications in land utilization within the land use structure, a majority of which may be corroborated by prior research. For instance, the average SC value in the TS is larger than that of other land use structures. In the CCTS, the SC value increases as the proportion of tea plantations increases due to the deep root system of tea plants, which firmly holds the soil and aids in soil retention (Shrestha and Thapa, 2015). Within CCTS, the SC value diminishes as built-up land and cropland expand. This indicates that the erosion of human-made surfaces and agricultural land surpasses the erosion of natural vegetation. (Fang, 2017). TS and CCTS have lower average CS than FTS (Li et al., 2023a). HQ falls when the proportion of tea gardens, building land, and cropland grows. However, in the case of forested area, the HQ increases in the FTS. This suggests that forests have a remarkable ability to maintain high HQ (Baixue et al., 2021). Yang also found in their study that the impact of land utilization structure on WY was not of statistical significance (Yang et al., 2021), which aligns with the findings of our study. Wang observed that forested regions had a greater capacity to generate surface runoff than agricultural regions on flat terrain, particularly in places with steeper slopes. Nevertheless, the simulation of the InVEST model did not accurately capture this topographic effect (Wang et al., 2018). As a consequence, InVEST model may overestimate the WY in flat areas, leading to a deviation of its results from the actual situation. Surprisingly, the SC value of FTS decreased as the ratio of tea gardens increased. The shift in a consistent pattern occurs due to distinct primary variables on each side of the thresholds. (Hao et al., 2017). It may be because FTS is mostly distributed on the higher slopes of Anxi County, and soil erosion on the steep slopes has become serious due to unscientific cultivation by tea farmers (El Kateb et al., 2013; Jiang et al., 2023a).
4.3 Changes in ecosystem service trade-offs and synergies in different LUSs
This study, according to the ESTD and Pearson correlation coefficients, examined the trade-offs and synergistic links between ecosystem services at specialized tea planting locations by combining the outcomes of land use structure categorization and ecosystem service quantification. The findings indicated that the trade-offs and synergistic effects among ESs differed across various LUSs. Specifically, temporally, HQ-WY, HQ-SC, CS-WY, and CS-SC exhibited significant trade-offs in the FTS in 2010, but these became insignificant by 2020. Furthermore, CS-SC was insignificant in the CCTS in 2010, but became significantly synergistic by 2020. From a spatial distribution perspective, the linkages between the four ESs in the FTS were primarily characterized by trade-offs, while the trade-offs observed in the CCTS were less pronounced compared to the synergies observed in the four ecosystem services. The research on the Loess Plateau also identified variations in the trade-offs and synergistic interactions among ESs based on various LUSs (Ding and Jian, 2024).
In terms of trade-offs effect, our findings indicate that the majority of significant relationships in TS were trade-offs. It is possible that the restricted diversity of vegetation in monoculture crops may amplify the trade-offs between ecosystem services, which aligns with previous studies (Feng et al., 2020; Power, 2010). The study found that there were stronger synergistic linkages in the SC-WY and CS-HQ of the FTS, indicating that forest vegetation s essential for enhancing the provision of ecosystem services. The abundance of forested areas in the FTS can augment the variety of plant communities, hence amplifying synergies in the HQ-CS. This promotes the relationships among various ESs and augments the resilience of the ecosystem. These findings align with Wang’s research (Wang et al., 2023). The most significant trade-offs were observed for HQ-WY in the CCTS. This could be attributed to the CCTS being situated in the low-elevation region of Anxi County, which is densely populated and experiences frequent human activities. The growth of urban areas causes a decline in vegetation cover and surface evapotranspiration, leading to an increase in water production. Simultaneously, the degradation of vegetation negatively impacts habitat quality. In their study on the Loess Plateau, Liu discovered that the trade-offs among HQ-WY is most pronounced in the well-developed urban sections of the two urban agglomerations. Furthermore, they observed that the extent of this trade-off diminishes as the amount of urbanization lowers (Liu et al., 2023b). Over time, the synergies effect of WY-SC diminished dramatically. This could be attributed to anthropogenic activities, such as land conversion and intensification, which modify ecological processes and disrupt the natural interconnections between ecosystem services. Furthermore, because ecosystem service interactions vary in strength and effects depending on land use structure, it is necessary to implement more focused land management and regulation.
4.4 Implications for urban land use and ecological protection planning
The results of this study provide critical insights into how LUSs in specialized tea-growing regions, like Anxi County, can inform broader urban planning and ecological conservation efforts. As rapid urbanization continues in many regions, including rural and peri-urban areas, it becomes increasingly important to integrate lessons learnt from the agricultural sector—particularly tea cultivation—into urban land use planning and ecological sustainability strategies. This is especially relevant as urban expansion often leads to significant alterations in ESs, including habitat degradation, reduced carbon storage, and water regulation challenges (Xie et al., 2020).
The identified trade-offs and synergies among key ESs in specialized tea-growing regions can inform urban land use policies aimed at balancing economic development and environmental protection (Wang et al., 2023). This study finds that the expansion of tea plantations in TS exacerbates the trade-offs between services such as HQ and CS. This has a cautionary effect for urban planners: single land use type expansion (e.g., extensive residential or industrial zones) can lead to the same kinds of ES trade-offs, such as reduced biodiversity, greater soil erosion, and lower overall resilience to climate change. Instead, urban planners can draw from the FTS, where synergies between ecosystem services are most pronounced. In urban settings, increasing the proportion of forested and green areas can mitigate the negative impacts of urban development by promoting HQ, CS, and WY.
The constraint line analysis used in this study to identify optimal land use proportions could be applied to urban planning scenarios. This tool can help urban planners determine the most appropriate ratios of built-up areas, green spaces, and conservation zones, balancing development needs with the preservation of ecosystem services such as CS and HQ. For example, planning the distribution of urban forests, parks, and mixed-use developments could follow the proportional strategies suggested for tea plantations and forests in this study.
The results of this study have direct implications for policy frameworks aimed at integrating agriculture, urban development, and ecosystem conservation. Policymakers could leverage the insights from this study to develop zoning regulations that limit the dominance of any single land use type. For instance, policies could promote the integration of forest patches within urban and agricultural zones to enhance ecosystem service synergies. Furthermore, local governments could use the ESTD model applied in this study to assess the potential trade-offs of large-scale development projects, ensuring that urban expansion does not come at the cost of critical ecosystem functions. In summary, the findings from this study can significantly inform urban planning and ecological conservation strategies. By understanding the balance of land use structures and their impacts on ecosystem services in tea-growing areas, urban planners and policymakers can design more sustainable, resilient, and ecologically balanced urban landscapes that support long-term environmental and socio-economic wellbeing.
5 Conclusion
This study utilized Anxi County as a case study to quantitatively evaluate the changes in land use structure and the relationships among ecosystem services in specialized tea planting regions. Expanding on this study, the research determined the ideal ratio of dominating land uses in these structures and proposed specific improvement solutions designed for specialized tea locations. The main discoveries are expressed as follows:
(1) Between 2010 and 2020, tea garden, forest land, and construction land in Anxi County have changed significantly. Anxi County, known for its specialisation in tea production, has had a land use structure consisting of three distinct types throughout the previous decade: a single structure (TS) and two mixed structures (FTS and CCTS). Out of the three categories, the tea garden proportion increased, the number of TS stayed the same, the number of FTS fell, and the number of CCTS increased.
(2) The variation in the proportion of dominant land uses within the LUSs will impact the constraint effect between the LUSs and ESs. The constraint line approach can be utilized to determine the ratip of dominant land utilization in order to attain harmonization among the four ESs. The dominant land use proportions of the four ESs in TS, CTS, and CTS are 0.5 (tea garden), 0.55–0.6/0.05–0.1 (forest land/tea garden), and 0.25–0.3/0–0.1/0.2 (construction land/cropland/tea garden).
(3) There are variations in the trade-offs and synergies of ecosystem services in different land use structures. Most of the significant relationships in Anxi County, TS, are trade-offs. In FTS, the synergies among SC-WY and CS-HQ are the most evident, while HQ-WY in CCTS exhibits the most obvious trade-off. The varying results under different land use structures highlight the importance of a meticulous approach to land management and protection. As far as specialized tea areas are concerned, the proportion of forest land should be increased, ecological tea gardens should be built, and ecosystem synergy should be improved.
This study aims to establish an analytical framework for assessing the proportion of dominant land use structures and identifying the trade-offs and synergistic relationships between multiple ecosystem services, from a land use perspective. The findings of this study can provide valuable insights for land use planning and the mitigation of ecosystem service trade-offs. Nevertheless, the trade-off synergistic relationships can vary across different scales, and our investigation solely focused on the trade-off synergistic relationships at the village scale. In future research, we can analyze the trade-offs and synergies between different regions at various levels to gather additional empirical evidence for the sustainable development of regional ecosystems.
Data availability statement
The original contributions presented in the study are included in the article/supplementary material, further inquiries can be directed to the corresponding authors.
Author contributions
JB: Conceptualization, Formal Analysis, Investigation, Software, Validation, Visualization, Writing–original draft. WL: Conceptualization, Data curation, Methodology, Resources, Validation, Writing–review and editing. JZ: Writing–review and editing. SF: Conceptualization, Funding acquisition, Project administration, Supervision, Writing–review and editing. LM: Conceptualization, Funding acquisition, Project administration, Supervision, Writing–review and editing.
Funding
The author(s) declare that financial support was received for the research, authorship, and/or publication of this article. This work was supported by the following programs: Joint Project on Innovation Strategy Research in Fujian Province (2023R0147), Key Project of New Think Tank in Fujian Province (24MZKB38), Research on Tea Industry Economy and Cultural Creativity (K152005A08), Research on Scientific and Technological Integration and Mechanisms of “Industrial Small Courtyard” in Modern Agriculture with Special Characteristics (K8120K01a).
Conflict of interest
The authors declare that the research was conducted in the absence of any commercial or financial relationships that could be construed as a potential conflict of interest.
Publisher’s note
All claims expressed in this article are solely those of the authors and do not necessarily represent those of their affiliated organizations, or those of the publisher, the editors and the reviewers. Any product that may be evaluated in this article, or claim that may be made by its manufacturer, is not guaranteed or endorsed by the publisher.
References
Arevalo, C. B., Bhatti, J. S., Chang, S. X., and Sidders, D. (2011). Land use change effects on ecosystem carbon balance: from agricultural to hybrid poplar plantation. Agric. Ecosyst. Environ. 141 (3-4), 342–349. doi:10.1016/j.agee.2011.03.013
Baixue, W., Weiming, C., and Shengxin, L. (2021). Impact of land use changes on habitat quality in Altay region. J. Resour. Ecol. 12 (6), 715–728. doi:10.5814/j.issn.1674-764x.2021.06.001
Biao, Z., Yunting, S., and Shuang, W. (2022). A review on the driving mechanisms of ecosystem services change. J. Resour. Ecol. 13 (1), 68–79. doi:10.5814/j.issn.1674-764x.2022.01.008
Blackburn, T. M., Lawton, J. H., and Perry, J. N. (1992). A method of estimating the slope of upper bounds of plots of body size and abundance in natural animal assemblages. Oikos 65, 107–112. doi:10.2307/3544892
Breunig, M. M., Kriegel, H.-P., Ng, R. T., and Sander, J. (2000). LOF: identifying density-based local outliers, 93–104.
Cade, B. S., and Guo, Q. (2000). Estimating effects of constraints on plant performance with regression quantiles. Oikos 91 (2), 245–254. doi:10.1034/j.1600-0706.2000.910205.x
Chen, W., Chi, G., and Li, J. (2020). The spatial aspect of ecosystem services balance and its determinants. Land Use Policy 90, 104263. doi:10.1016/j.landusepol.2019.104263
Chen, Y., and Xu, F. (2022). The optimization of ecological service function and planning control of territorial space planning for ecological protection and restoration. Sustain. Comput. Inf. Syst. 35, 100748. doi:10.1016/j.suscom.2022.100748
Delphin, S., Escobedo, F., Abd-Elrahman, A., and Cropper, W. (2016). Urbanization as a land use change driver of forest ecosystem services. Land Use Policy 54, 188–199. doi:10.1016/j.landusepol.2016.02.006
Ding, X., and Jian, S. (2024). Synergies and trade-offs of ecosystem services affected by land use structures of small watershed in the Loess Plateau. J. Environ. Manag. 350, 119589. doi:10.1016/j.jenvman.2023.119589
El Kateb, H., Zhang, H., Zhang, P., and Mosandl, R. (2013). Soil erosion and surface runoff on different vegetation covers and slope gradients: a field experiment in Southern Shaanxi Province, China. Catena 105, 1–10. doi:10.1016/j.catena.2012.12.012
Fang, H. (2017). Impact of land use change and dam construction on soil erosion and sediment yield in the black soil region, northeastern China. Land Degrad. Dev. 28 (4), 1482–1492. doi:10.1002/ldr.2677
Fang, L., Liu, Y., Li, C., and Cai, J. (2023). Spatiotemporal characteristics and future scenario simulation of the trade-offs and synergies of mountain ecosystem services: a case study of the dabie mountains area, China. Chin. Geogr. Sci. 33 (1), 144–160. doi:10.1007/s11769-023-1330-8
Feng, Q., Zhao, W., Hu, X., Liu, Y., Daryanto, S., and Cherubini, F. (2020). Trading-off ecosystem services for better ecological restoration: a case study in the Loess Plateau of China. J. Clean. Prod. 257, 120469. doi:10.1016/j.jclepro.2020.120469
Feng, Y., and Sunderland, T. (2023). Feasibility of tea/tree intercropping plantations on soil ecological service function in China. Agronomy 13 (6), 1548. doi:10.3390/agronomy13061548
Gao, J., Yu, Z., Wang, L., and Vejre, H. (2019). Suitability of regional development based on ecosystem service benefits and losses: a case study of the Yangtze River Delta urban agglomeration, China. Ecol. Indic. 107, 105579. doi:10.1016/j.ecolind.2019.105579
Gong, J., Liu, D., Zhang, J., Xie, Y., Cao, E., and Li, H. (2019a). Tradeoffs/synergies of multiple ecosystem services based on land use simulation in a mountain-basin area, western China. Ecol. Indic. 99, 283–293. doi:10.1016/j.ecolind.2018.12.027
Gong, J., Xie, Y., Cao, E., Huang, Q., and Li, H. (2019b). Integration of InVEST-habitat quality model with landscape pattern indexes to assess mountain plant biodiversity change: a case study of Bailongjiang watershed in Gansu Province. J. Geogr. Sci. 29, 1193–1210. doi:10.1007/s11442-019-1653-7
Hao, R., Yu, D., and Wu, J. (2017). Relationship between paired ecosystem services in the grassland and agro-pastoral transitional zone of China using the constraint line method. Agric. Ecosyst. Environ. 240, 171–181. doi:10.1016/j.agee.2017.02.015
Hong, X., Peng, Q., Zheng, R., Lin, W., Fan, S., and Su, K. (2024). Evaluating the spatial evolution of the eco-economy harmony in Anxi county, China, based on ecosystem services value. Sustainability 16 (4), 1491. doi:10.3390/su16041491
Huang, F., Zuo, L., Gao, J., Jiang, Y., Du, F., and Zhang, Y. (2023). Exploring the driving factors of trade-offs and synergies among ecological functional zones based on ecosystem service bundles. Ecol. Indic. 146, 109827. doi:10.1016/j.ecolind.2022.109827
Huang, J., Zheng, F., Dong, X., and Wang, X.-C. (2023). Exploring the complex trade-offs and synergies among ecosystem services in the Tibet autonomous region. J. Clean. Prod. 384, 135483. doi:10.1016/j.jclepro.2022.135483
Huang, L., Ning, J., Zhu, P., Zheng, Y., and Zhai, J. (2021). The conservation patterns of grassland ecosystem in response to the forage-livestock balance in North China. J. Geogr. Sci. 31, 518–534. doi:10.1007/s11442-021-1856-6
Jiang, M., Jiang, C., Huang, W., Chen, W., Gong, Q., Yang, J., et al. (2022). Quantifying the supply-demand balance of ecosystem services and identifying its spatial determinants: a case study of ecosystem restoration hotspot in Southwest China. Ecol. Eng. 174, 106472. doi:10.1016/j.ecoleng.2021.106472
Jiang, W., Guo, P., Lin, Z., Fu, Y., Li, Y., Kasperkiewicz, K., et al. (2023a). Factors influencing the spatiotemporal variation in the value of ecosystem services in Anxi County. Heliyon 9 (8), e19182. doi:10.1016/j.heliyon.2023.e19182
Jiang, W., Su, B., and Fan, S. (2023b). Spatial disequilibrium and dynamic evolution of eco-efficiency in China’s tea industry. Sustainability 15 (12), 9597. doi:10.3390/su15129597
Kucharik, C. J., Foley, J. A., Delire, C., Fisher, V. A., Coe, M. T., Lenters, J. D., et al. (2000). Testing the performance of a dynamic global ecosystem model: water balance, carbon balance, and vegetation structure. Glob. Biogeochem. Cycles 14 (3), 795–825. doi:10.1029/1999gb001138
Lang, Y., and Song, W. (2019). Quantifying and mapping the responses of selected ecosystem services to projected land use changes. Ecol. Indic. 102, 186–198. doi:10.1016/j.ecolind.2019.02.019
Li, W., Geng, J., Bao, J., Lin, W., Wu, Z., and Fan, S. (2023). Analysis of spatial and temporal variations in ecosystem service functions and drivers in Anxi County based on the InVEST model. Sustainability 15 (13), 10153. doi:10.3390/su151310153
Li, W., Geng, J., Bao, J., Lin, W., Wu, Z., and Fan, S. (2023). Spatial and temporal evolution patterns of habitat quality under tea plantation expansion and multi-scenario simulation study: Anxi County as an example. Land 12 (7), 1308. doi:10.3390/land12071308
Li, X., Meng, X., Ji, X., Zhou, J., Pan, C., and Gao, N. (2023). Zoning technology for the management of ecological and clean small-watersheds via k-means clustering and entropy-weighted TOPSIS: a case study in Beijing. J. Clean. Prod. 397, 136449. doi:10.1016/j.jclepro.2023.136449
Li, Y., Liu, W., Feng, Q., Zhu, M., Yang, L., Zhang, J., et al. (2023). The role of land use change in affecting ecosystem services and the ecological security pattern of the Hexi Regions, Northwest China. Sci. Total Environ. 855, 158940. doi:10.1016/j.scitotenv.2022.158940
Li, Y., and Luo, H. (2023). Trade-off/synergistic changes in ecosystem services and geographical detection of its driving factors in typical karst areas in southern China. Ecol. Indic. 154, 110811. doi:10.1016/j.ecolind.2023.110811
Li, Y.-R., Liu, Y.-S., Long, H.-L., and Wang, J.-Y. (2013). Local responses to macro development policies and their effects on rural system in China’s mountainous regions: the case of Shuanghe Village in Sichuan Province. J. Mt. Sci. 10, 588–608. doi:10.1007/s11629-013-2544-5
Liang, X., Guan, Q., Clarke, K. C., Chen, G., Guo, S., and Yao, Y. (2021). Mixed-cell cellular automata: a new approach for simulating the spatio-temporal dynamics of mixed land use structures. Landsc. Urban Plan. 205, 103960. doi:10.1016/j.landurbplan.2020.103960
Liao, Q., Li, T., and Liu, D. (2024). Evolutionary patterns and influencing factors of relationships among ecosystem services in the hilly red soil region of Southern China. Environ. Monit. Assess. 196 (4), 360. doi:10.1007/s10661-024-12521-5
Liu, J., Pei, X., Zhu, W., and Jiao, J. (2023a). Understanding the intricate tradeoffs among ecosystem services in the Beijing-Tianjin-Hebei urban agglomeration across spatiotemporal features. Sci. Total Environ. 898, 165453. doi:10.1016/j.scitotenv.2023.165453
Liu, J., Wang, H., Tang, B., Hui, L., Zhang, W., Zhang, L., et al. (2023b). Analysis of temporal and spatial dynamics of ecosystem services and trade-offs/synergies during urbanization in the Loess Plateau, China. Land 12 (12), 2136. doi:10.3390/land12122136
Liu, S., Yao, X., Zhao, D., and Lu, L. (2021). Evaluation of the ecological benefits of tea gardens in Meitan County, China, using the InVEST model. Environ. Dev. Sustain. 23, 7140–7155. doi:10.1007/s10668-020-00908-6
Liu, Y., Yuan, X., Li, J., Qian, K., Yan, W., Yang, X., et al. (2023c). Trade-offs and synergistic relationships of ecosystem services under land use change in Xinjiang from 1990 to 2020: a Bayesian network analysis. Sci. Total Environ. 858, 160015. doi:10.1016/j.scitotenv.2022.160015
Liu, Y., Zhang, C., and Zeng, H. (2023d). Constraint effects among several key ecosystem service types and their influencing factors: a case study of the Pearl River Delta, China. Ecol. Indic. 146, 109883. doi:10.1016/j.ecolind.2023.109883
Ma, S., Wang, L.-J., Zhu, D., and Zhang, J. (2021). Spatiotemporal changes in ecosystem services in the conservation priorities of the southern hill and mountain belt, China. Ecol. Indic. 122, 107225. doi:10.1016/j.ecolind.2020.107225
Peng, J., Liu, Y., and Tian, L. (2018). Integrating ecosystem services trade-offs with paddy land-to-dry land decisions: a scenario approach in Erhai Lake Basin, southwest China. Sci. Total Environ. 625, 849–860. doi:10.1016/j.scitotenv.2017.12.340
Power, A. G. (2010). Ecosystem services and agriculture: tradeoffs and synergies. Philosophical Trans. R. Soc. B Biol. Sci. 365 (1554), 2959–2971. doi:10.1098/rstb.2010.0143
Qiao, J., Yu, D., Cao, Q., and Hao, R. (2019). Identifying the relationships and drivers of agro-ecosystem services using a constraint line approach in the agro-pastoral transitional zone of China. Ecol. Indic. 106, 105439. doi:10.1016/j.ecolind.2019.105439
Sannigrahi, S., Zhang, Q., Joshi, P., Sutton, P. C., Keesstra, S., Roy, P., et al. (2020). Examining effects of climate change and land use dynamic on biophysical and economic values of ecosystem services of a natural reserve region. J. Clean. Prod. 257, 120424. doi:10.1016/j.jclepro.2020.120424
Schirpke, U., Kohler, M., Leitinger, G., Fontana, V., Tasser, E., and Tappeiner, U. (2017). Future impacts of changing land-use and climate on ecosystem services of mountain grassland and their resilience. Ecosyst. Serv. 26, 79–94. doi:10.1016/j.ecoser.2017.06.008
Shrestha, G., and Thapa, R. B. (2015). Tea pests and pesticide problems and integrated management. J. Agric. Environ. 16, 188–200. doi:10.3126/aej.v16i0.19852
Shui, W., Chen, Y., Su, Z., and Fan, S. (2017). Agricultural ecosystem services function value evaluation under the influence of specialized tea planting: a case study in Anxi, Fujian Province. Acta Ecol. Sin. 37 (10), 3311–3326. doi:10.5846/stxb201602070268
Silva, J., Santos, J., Ribeiro, P., Marta-Pedroso, C., Magalhães, M., and Moreira, F. (2024). A farming systems approach to assess synergies and trade-offs among ecosystem services. Ecosyst. Serv. 65, 101591. doi:10.1016/j.ecoser.2023.101591
Sohel, M. S. I., Mukul, S. A., and Burkhard, B. (2015). Landscape׳ s capacities to supply ecosystem services in Bangladesh: a mapping assessment for Lawachara National Park. Ecosyst. Serv. 12, 128–135. doi:10.1016/j.ecoser.2014.11.015
Tan, F., Lu, Z., and Zeng, F. (2024). Study on the trade-off/synergy spatiotemporal benefits of ecosystem services and its influencing factors in hilly areas of southern China. Front. Ecol. Evol. 11, 1342766. doi:10.3389/fevo.2023.1342766
Wang, C., Shang, S., Jia, D., Han, Y., Sauvage, S., Sánchez-Pérez, J.-M., et al. (2018). Integrated effects of land use and topography on streamflow response to precipitation in an agriculture-forest dominated northern watershed. Water 10 (5), 633. doi:10.3390/w10050633
Wang, C., Tang, C., Fu, B., Lü, Y., Xiao, S., and Zhang, J. (2022). Determining critical thresholds of ecological restoration based on ecosystem service index: a case study in the Pingjiang catchment in southern China. J. Environ. Manag. 303, 114220. doi:10.1016/j.jenvman.2021.114220
Wang, C., Zhao, M., Xu, Y., Zhao, Y., and Zhang, X. (2023). Ecosystem service synergies promote ecological tea gardens: a case study in fuzhou, China. Remote Sens. 15 (2), 540. doi:10.3390/rs15020540
Williams, J., Renard, K., and Dyke, P. (1983). EPIC: a new method for assessing erosion's effect on soil productivity. J. Soil Water Conserv. 38 (5), 381–383.
Wischmeier, W. H., and Smith, D. D. (1958). Rainfall energy and its relationship to soil loss. Eos, Trans. Am. Geophys. Union 39 (2), 285–291.
Wu, X., Wang, S., Fu, B., Liu, Y., and Zhu, Y. (2018). Land use optimization based on ecosystem service assessment: a case study in the Yanhe watershed. Land Use Policy 72, 303–312. doi:10.1016/j.landusepol.2018.01.003
Xiao, Z., Huang, X., Zang, Z., and Yang, H. (2018). Spatio-temporal variation and the driving forces of tea production in China over the last 30 years. J. Geogr. Sci. 28, 275–290. doi:10.1007/s11442-018-1472-2
Xie, H., Zhang, Y., Choi, Y., and Li, F. (2020). A scientometrics review on land ecosystem service research. Sustainability 12 (7), 2959. doi:10.3390/su12072959
Yang, J., Xie, B., Zhang, D., and Tao, W. (2021). Climate and land use change impacts on water yield ecosystem service in the Yellow River Basin, China. Environ. Earth Sci. 80 (3), 72. doi:10.1007/s12665-020-09277-9
Yang, Y., Yuan, X., An, J., Su, Q., and Chen, B. (2024). Drivers of ecosystem services and their trade-offs and synergies in different land use policy zones of Shaanxi Province, China. J. Clean. Prod. 452, 142077. doi:10.1016/j.jclepro.2024.142077
Zeng, J., Cui, X., Chen, W., and Yao, X. (2023). Impact of urban expansion on the supply-demand balance of ecosystem services: an analysis of prefecture-level cities in China. Environ. Impact Assess. Rev. 99, 107003. doi:10.1016/j.eiar.2022.107003
Zeng, X., Lu, H., Campbell, D. E., and Ren, H. (2013). Integrated emergy and economic evaluation of tea production chains in Anxi, China. Ecol. Eng. 60, 354–362. doi:10.1016/j.ecoleng.2013.09.004
Zhang, B., Zheng, L., Wang, Y., Li, N., Li, J., Yang, H., et al. (2023). Multiscale ecosystem service synergies/trade-offs and their driving mechanisms in the Han River Basin, China: implications for watershed management. Environ. Sci. Pollut. Res. 30 (15), 43440–43454. doi:10.1007/s11356-023-25248-6
Zhang, H., Jiang, C., Wang, Y., Zhao, Y., Gong, Q., Wang, J., et al. (2022). Linking land degradation and restoration to ecosystem services balance by identifying landscape drivers: insights from the globally largest loess deposit area. Environ. Sci. Pollut. Res. 29 (55), 83347–83364. doi:10.1007/s11356-022-21707-8
Zhang, X., Xie, H., Shi, J., Lv, T., Zhou, C., and Liu, W. (2020). Assessing changes in ecosystem service values in response to land cover dynamics in Jiangxi Province, China. Int. J. Environ. Res. Public Health 17 (9), 3018. doi:10.3390/ijerph17093018
Zhang, Y., and Li, X. (2022). Protecting traditional agricultural landscapes by promoting industrial integration development: practices from Important Agricultural Heritage Systems (IAHS) sites in China. Land 11 (8), 1286. doi:10.3390/land11081286
Zhang, Z., Peng, J., Xu, Z., Wang, X., and Meersmans, J. (2021). Ecosystem services supply and demand response to urbanization: a case study of the Pearl River Delta, China. Ecosyst. Serv. 49, 101274. doi:10.1016/j.ecoser.2021.101274
Keywords: ecosystem services, land use structure, specialized tea planting regions, village scale, trade-offs and synergies
Citation: Bao J, Li W, Zhu J, Fan S and Mao L (2024) Impacts of land use structures on ecosystem services relationships within specialized tea planting regions: a case study of Anxi County. Front. Environ. Sci. 12:1464490. doi: 10.3389/fenvs.2024.1464490
Received: 14 July 2024; Accepted: 23 September 2024;
Published: 03 October 2024.
Edited by:
Sérgio António Neves Lousada, University of Madeira, PortugalReviewed by:
Yongsheng Wang, Chinese Academy of Sciences (CAS), ChinaLilei Zhou, Chongqing Jiaotong University, China
Copyright © 2024 Bao, Li, Zhu, Fan and Mao. This is an open-access article distributed under the terms of the Creative Commons Attribution License (CC BY). The use, distribution or reproduction in other forums is permitted, provided the original author(s) and the copyright owner(s) are credited and that the original publication in this journal is cited, in accordance with accepted academic practice. No use, distribution or reproduction is permitted which does not comply with these terms.
*Correspondence: Shuisheng Fan, c2h1aXNoZW5nQGZhZnUuZWR1LmNu; Liyu Mao, bXk2ODZAZmFmdS5lZHUuY24=
 Jingling Bao
 Wen Li2,3
 Jieru Zhu