- 1School of Water Resources and Hydropower Engineering, North China Electric Power University, Beijing, China
- 2Chongqing Surveying and Design Institute Co., Ltd. of Water Resources, Electric Power and Architecture, Chongqing, China
- 3Key Laboratory for Water and Sediment Sciences of Ministry of Education, School of Environment, Beijing Normal University, Beijing, China
- 4School of Environment, Beijing Normal University, Beijing, China
Hydropower plants with a small installed capacity, which are widely distributed in mountainous areas with abundant rainfall and steep rivers, play an important role in resolving energy problems in remote rural areas. These plants are a crucial source of clean electricity generated from water power. Harnessing local water resources not only helps alleviate energy shortages, but also reduces reliance on fossil fuels, contributing significantly to China’s national goals of achieving peak carbon emissions and carbon neutrality. This study investigates the carbon footprint of the Huangshadong Reservoir Project in Chongqing, China. The entire life cycle of the hydropower plant is assessed, including the preparation, construction, operation and maintenance, and demolition phases. The uncertainty was evaluated using the error propagation method. Following analysis, suggestions for carbon footprint reduction measures were proposed. Results showed that the total carbon footprint and the carbon intensity of the Huangshadong Reservoir Project over its entire life cycle are 33,148.29 t CO2e and 417.75 g CO2e/kWh, respectively. Of the total carbon footprint, the preparation phase, construction phase, operation and maintenance phase, and demolition phase account for 0.04%, 67.06%, 26.2%, and 6.7%, respectively. It means that the requirement for cement during the construction phase represents an important contribution to the entire life cycle carbon footprint of a small hydropower plant. As an integrated water conservancy project, the carbon intensity of the Huangshadong Reservoir Project is higher than that of medium-sized and large hydropower plants. However, its carbon intensity is lower than the emission factor of fossil power plants. The research results provide reference for both planning and construction of small hydropower plants and low-carbon development of rural hydraulic engineering.
1 Introduction
At the 75th session of the United Nations General Assembly in September 2020, the Chinese government proposed that China should achieve peak carbon emissions and carbon neutrality. At the Leaders’ Summit of the 15th Conference of the Parties to the Convention on Biological Diversity (COP15) in 2022, the strategies to achieve these goals were outlined. One important component of these strategies is to accelerate the adjustment and optimization of China’s industrial and energy structures by vigorously developing renewable energy sources such as hydropower. This has the potential to achieve nearly 90% of the reduction in carbon emissions (Nasir et al., 2022). According to statistics from China’s National Energy Administration, the total installed hydropower capacity in China accounted for 16.1% of the national total by 2022 (Ministry of Ecology and Environment of the People's Republic of China, 2023). Although volatile, hydropower represents the mainstay of renewable energy generation. Small hydropower plants with a total installed capacity of less than 5 MW provide a source of clean renewable energy and are an important means of resolving water resources, irrigation, and electricity problems (Nautiyal et al., 2020). By the end of 2021, China had 42,785 small hydropower plants in operation, representing a total installed capacity of 76.409 GW and accounting for almost 25% of the national total installed hydropower capacity. Therefore, small hydropower plants developed in accordance with local conditions provide an important foundation for the green and low-carbon transformation of energy sources to achieve the peak carbon emissions target.
Hydropower plants generate energy by using clean water to produce electricity (Gao et al., 2022), but their reservoirs can be a source of greenhouse gas (GHG) emissions (Miller et al., 2019). The Intergovernmental Panel on Climate Change (IPCC) assesses the environmental impact of different GHGs by analyzing the contribution of a given mass of a GHG to global warming and by measuring the global warming potential (GWP) of each GHG. It also assigns a value of 1 to CO2 and converts the emissions of different GHGs into CO2 equivalent (CO2e) by multiplying the GHG emissions by the GWP (IPCC, 2019). Carbon footprint analysis is one method of characterizing the total amount of GHG emissions generated directly and indirectly. This analysis typically considers the acquisition of raw materials through the manufacturing, transport, distribution, usage, and disposal stages. Life cycle assessment (LCA) allows the environmental impacts of products to be analyzed throughout their whole life cycle, from production and use to disposal and recycling (Pang et al., 2015). It can be used to account for the carbon footprint, including P-LCA from process analysis, EIO-LCA from input–output analysis, and hybrid life cycle assessment methods (Suh et al., 2004).
LCA studies have shown that the size and location of a hydropower plant have substantial impacts on its carbon footprint, and suggest that the carbon emission coefficient of large- and medium-sized plants tends to be lower than that of small plants (Gaudard et al., 2014). The carbon emission coefficient of the Xiluodu hydropower plant in China, with a total installed capacity of 12.6 GW, is 7.6 g CO2e/kWh (Li et al., 2017), and the carbon emission coefficient of the Itaipu hydropower plant in Brazil, with a total installed capacity of 14 GW, is 4.33 g CO2e/kWh (Ribeiro and Da Silva, 2010). These values contrast markedly with the carbon emission coefficients of 251.35 g CO2e/kWh for the Outer Ring Bridge Barrage Hub hydropower plant in China (total installed capacity: 0.9 MW) and 74.79 g CO2e/kWh for a small hydropower plant in India (total installed capacity: 2 MW) (Varun and Bhat, 2012; Zou and Liu, 2020). For the same installed capacity, the carbon emission coefficient of a dam-type hydropower plant is higher than that of a run-of-river hydropower plant. For example, the coefficient of the Guanyinyan dam-type hydropower plant in China is 28.4 g CO2e/kWh (Pang et al., 2015), whereas that of the Mae Pai run-of-river hydropower plant in Thailand is 16.28 g CO2e/kWh (Suwanit and Gheewala, 2011). Moreover, the carbon emission coefficient in warm and dry areas is smaller than that in hot and humid areas (Li et al., 2023). In addition, the impact on the carbon footprint of factors such as the land submerged by reservoirs must be considered to produce an accurate assessment of the carbon footprint of hydropower plants (Nautiyal and Goel, 2020).
Previous studies on the carbon footprint of existing hydropower plants mainly focused on the power generation function, often overlooking other critical components that contribute to the overall environmental impact. While power generation is a central aspect of hydropower plants, the construction and operation of plants have significant environmental and ecological impacts, as does the deployment of the necessary equipment and machinery (Nautiyal and Goel, 2020; Zhang et al., 2015). However, few studies have comprehensively investigated the carbon footprint of small hydropower plants. Under the dual goals of achieving peak carbon emissions and carbon neutrality, study on the carbon footprint of electrical energy generation is essential, and it will be necessary to undertake more comprehensive and detailed LCA studies of larger hydropower plants in the future. This study accounted the carbon footprint of a small hydropower plant (Huangshadong Reservoir Project in China). The LCA method was adopted to assess the carbon footprint of the project in the four phases of preparation, construction, operation and maintenance, and demolition. The carbon footprint inventory and GHG emissions were quantitatively assessed over the entire life cycle of the Huangshadong Reservoir Project. Following comparison of the carbon emissions of a traditional gravity dam with small hydropower plants, this study proposed carbon reduction pathways and suggestions to provide theoretical reference for the development and management of hydropower in China.
2 Materials and methods
2.1 Description of projects
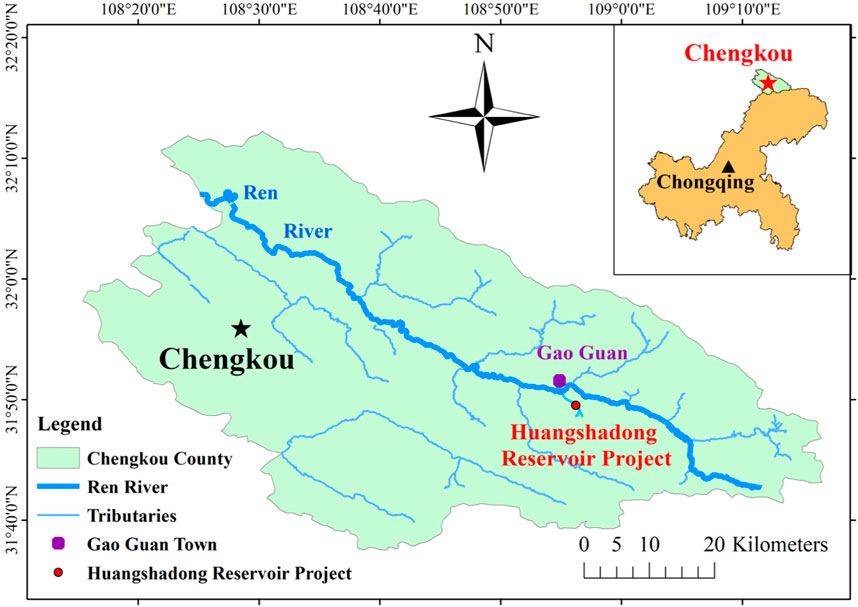
The Huangshadong Reservoir Project is on Daibai Creek, which is a first-class tributary of the Ren River on the left bank of Gao Guan Town in Chengkou County (Chongqing Municipality, China) (Figure 1). Construction began in 2018 and was completed in 2021. The hydropower plant was commissioned in 2022 with an as-is base year of 2015 and a design level year of 2030.
The project consists of three parts: the reservoir hub project, the irrigation project, and the power plant. The dam of the Huangshadong Reservoir Hub Project is a buried rock–mixed cement gravity dam with an axial length of 147.8 m, a crest height, and a maximum height of 51.6 m. The total capacity of the reservoir is 735,000 m3. The reservoir has capacity of 611,000 m3 below the normal storage level of 1,054.0 m, a dead level of 1,036 m with a dead capacity of 144,000 m3, and an adjustable capacity of 467,000 m3. The irrigation project consists of a water supply and an irrigation project, using pipeline water transmission with total length of 4,240 m. The construction of this project can add 3.147 km2 of irrigated area, improve the irrigated area of 0.133 km2, and provide 1.31 × 10⁶ m3 of irrigation water, 1.552 × 10⁶ m3 of water for towns and villages, and 9 × 10⁶ m3 of water for rural livestock and human beings annually. The installed capacity of the hydropower plant is 1.26 MW, and the average power generation for many years is expected to be 2,645 MW h. The Huangshadong Reservoir Project is a water conservancy project that considers the comprehensive benefits of water supply, irrigation, and electrical power generation.
2.2 Life cycle assessment method (LCA)
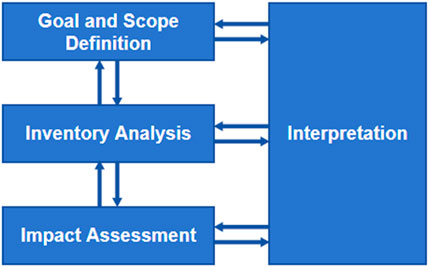
This study applied the LCA method to account for the carbon footprint of the Huangshadong Reservoir Project. The complete process includes the definition of the goal and scope, life cycle inventory analysis, impact assessment, and interpretation of the results (Figure 2). These four parts are mutually interactive and the results are obtained through continuous feedback.
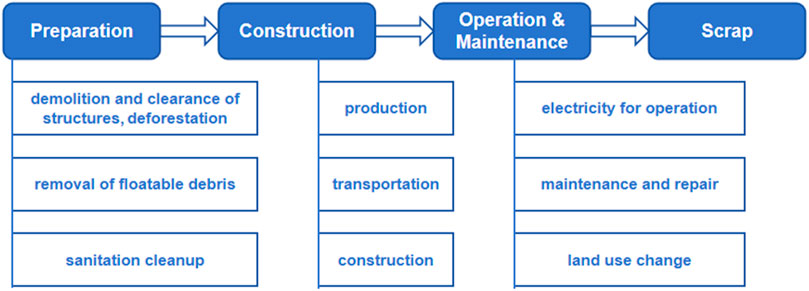
The boundary range is first determined (Figure 3), and then the carbon footprint inventory is collected and accounted according to the four phases of the entire life cycle of the small hydropower plant according to this range. In the specific accounting process, for different products in each phase in combination with their production processes, the carbon emission coefficients derived using the P-LCA and EIO-LCA methods can be selected from the Chinese Life Cycle Database (CLCD) and other related studies. In this study, the carbon footprint analyses were conducted using the carbon emission coefficient method with the following formula:
where E is the carbon footprint of the product, Qi is the quantity or intensity data for substance or activity i, and Ci is the carbon emission coefficient per unit intensity of substance or activity i.
Equation 1 corresponds to the following specific formulas for calculating the carbon footprint at different stages. The carbon footprint formula for the preparation stage is in Equation 2.
where E1 is the carbon footprint in the preparation stage, Wi is the quantity or cost of activity i, and Fi is the carbon emission factor corresponding to activity i.
The carbon footprint of the construction stage is the sum of the production stage, transportation stage and construction stage. The specific formula is in Equation 3.
where E2 is the carbon footprint of the construction stage, Wi is the usage or cost of material or equipment i, Fi is the carbon emission factor of material or equipment i, Fj is the carbon emission factor of transportation machinery j, Mk,j is the total weight of goods k transported by transportation machinery j, mj is the carrying capacity of transportation machinery j, xk is the distance over which goods k are transported, v is the traveling speed of the transportation machinery, Wr is the consumption of energy r (electricity, diesel fuel, gasoline), and Fr is the carbon emission factor of energy r.
The carbon footprint of the operation and maintenance phase considers both the operation and maintenance of the hydropower plant and the land use changes. These components correspond to the consumption of energy and materials and the difference between the GHG fluxes of the land use before and after the construction of the hydropower plant, respectively. The formulas are in Equation 4.
where E3 is the carbon footprint of the operation and maintenance phase, Wi is the consumption of material or energy i, Fi is the carbon emission factor of material or energy i, Eafter is the carbon footprint after the construction of the hydroelectric power plant, Ebefore is the carbon footprint before the construction of the hydroelectric power plant,
Further calculations of the carbon footprint inventory (unit: g CO2e/kWh) were performed to obtain the GHG emission coefficients of the hydropower plant over its entire life cycle. Thus, the carbon footprints of different power generation methods could be compared to evaluate their potential environmental impacts.
2.3 Uncertainty evaluation
In this study, uncertainty was assessed by means of error propagation and Monte Carlo simulation. The former is suitable for scenarios in which the data are relatively independent or have clear representable correlation, whereas the latter is more suitable for scenarios with a large number of uncertainty data, Gaussian distribution, and an algorithm that has a complex function. The error propagation method can be better adapted to carbon footprint accounting by multiplying the product intensity data (AD) with the carbon emission coefficient (EC), and the data were considered mutually independent in this study. Therefore, the original error propagation method was adapted to not focus on the difference between carbon emission years, but to reflect only the error between the base year and the current year in the process of quantifying parameter uncertainty. Thus, the uncertainty in the carbon footprint accounting process of a small hydropower plant was assessed by combining the data uncertainty as the overall uncertainty.
To address the causes of uncertainty in each data item during the carbon footprint accounting process for the Huangshadong Reservoir Project, the uncertainty in each data item was quantified and the quantified value was located within the 95% confidence interval of the point estimate. The specific formulas used for calculating and combining the overall inventory uncertainty are given in Equation 5.
where
3 Results
By applying the LCA method, the total life cycle carbon emissions of the Huangshadong Reservoir Project were calculated, which included the carbon footprint during the four phases of project development: preparation, construction, operation and maintenance, and demolition.
3.1 Preparation phase carbon footprint
The preparation phase includes the demolition and clearance of structures, deforestation, removal of floatable debris, and sanitation cleanup. The clearance of structures in the Huangshadong Reservoir Project involved the dismantling of small bridges and utility poles, and the removal of floatable debris included shrubs and brushwood, which is similar to the content of deforestation; therefore, the carbon emission coefficient corresponding to deforestation was borrowed for the calculation. The carbon emission coefficients for the deforestation and sanitation cleanup processes were obtained using the EIO-LCA method, and the calculations were based on the exchange rate of China Yuan (CNY) under the standard of the benchmark year 2015 for this small hydropower plant. The carbon footprint inventory for the preparation phase is listed in Table 1.
3.2 Construction phase carbon footprint
For the construction phase, carbon accounting was conducted collectively for the hub, power station, and pipeline engineering components. Hub engineering included water-retaining structures, spillway structures, intake towers, and management buildings, among which the river dam comprises a C15 rubble concrete gravity dam. The power plant engineering, located approximately 1.5 km from the reservoir dam site, consists of the main and auxiliary buildings, outdoor substation fields, tailrace culverts, and factory flood walls. The pipeline engineering required steel pipes with total length of 4.24 km.
3.2.1 Production phase carbon footprint
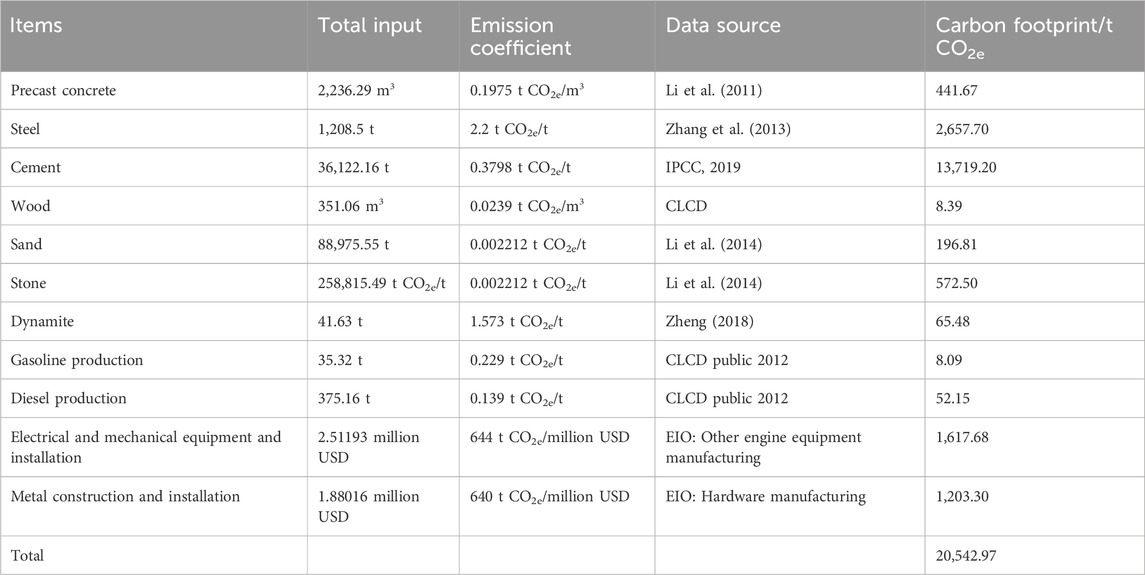
The materials and equipment of each part were categorized, and carbon emission coefficients similar to the production processes of the products in the research project were selected as the carbon emission coefficients for these products. The accounting of materials conducted using the PA-LCA method mainly analyzed their production processes. Because it is difficult to specifically divide the electromechanical equipment and metal structures into products, the EIO-LCA method was used for accounting. Details of the quantity of categorized materials and equipment, carbon emission parameters and sources, and carbon footprint are listed in Table 2.
3.2.2 Transport phase carbon footprint
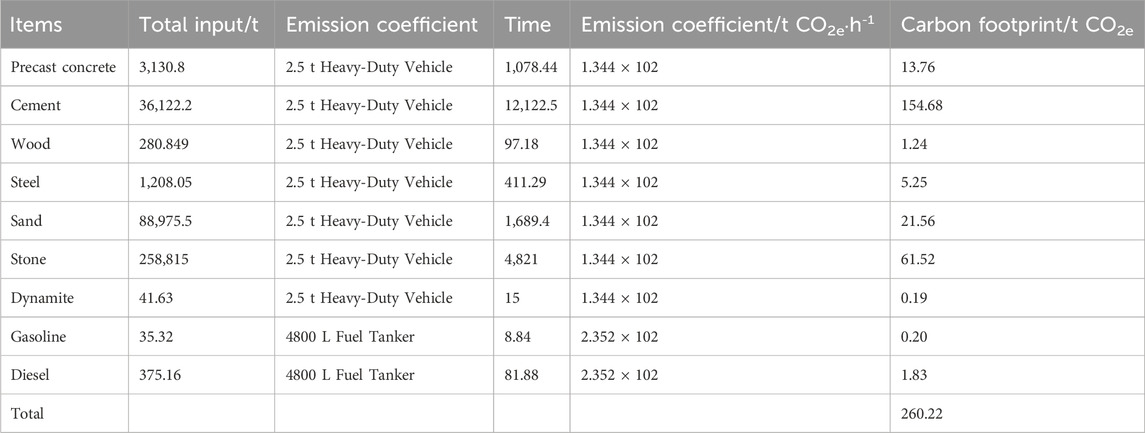
The sand and stone required for this project were mined locally, and the transportation distance was 1.8 km to the dam site area, 3.4 km to the hydropower plant site, and 6.0 km to the water conveyance pipeline. The necessary steel reinforcement, cement, and fuel were purchased in the county town, which is approximately 43.0, 41.5, and 36.0 km from the project dam site, hydroelectric power plant, and water conveyance pipeline, respectively. Assuming that the transport vehicles comprised 2.5-t payload trucks and 4800-L tankers with a 50-km/h average speed, the fuel consumption rates are 4 and 7 kg/h, respectively. Given that all transport is one-way, the carbon emissions from the return trips of empty trucks and tankers can be ignored. Based on a fuel carbon emission coefficient of 3.19 t CO2e/t, the carbon emission coefficient for the transportation machinery can be determined. The carbon footprint inventory for the transport phase is presented in Table 3.
3.2.3 Construction phase
Electricity and diesel fuel were the main types of energy consumed during the construction phase. The carbon footprint inventory for this phase is presented in Table 4.
3.3 Operation and maintenance phase carbon footprint
The normal operating period of this project is 30 years, with the price level year of 2030. During the operation of the power plant, electricity is consumed by the building and road lighting systems, landscape lighting engineering, and lighting and air conditioning supporting recreational and living facilities. The maintenance and repair include equipment repair, purchase of building materials, and their transportation. The hydropower plant consumed an average of 18,516 kWh of electricity annually during its operation, totaling 555,480 kWh over 30 years. The carbon footprint for maintenance and repairs was calculated using the EIO-LCA method, assuming an exchange rate of 1 CNY to 0.15848 United States dollars under the standard of the price level year of 2030.
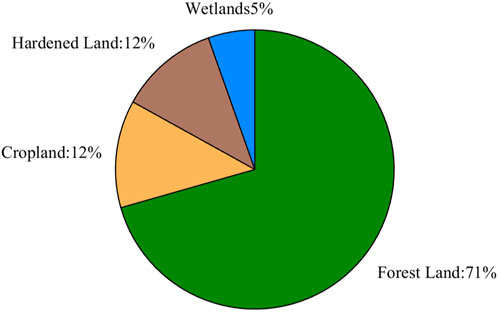
Prior to construction of the hydropower plant, the expropriated land included cropland, wetlands, forest land, and hardened surfaces, totaling an area of 48,726.67 m2. The proportions of these various land use types are shown in Figure 4. The carbon emissions determined for each land use type before construction of the hydropower plant are listed in Table 5.
After the construction of the hydropower plant, the original expropriated land use types were transformed into the water area formed by reservoir impoundment and hardened surfaces occupied by the construction of the hydropower plant and other buildings. Based on the reservoir water level capacity curve, the reservoir area at the normal impoundment level of 1,054 m, i.e., 37,200 m2, was used as the area of land use change.
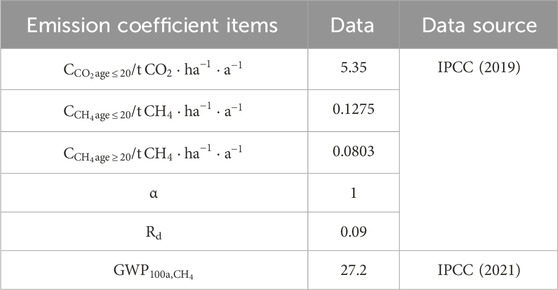
In accordance with the IPCC guidelines for national GHG inventories, the GHG emissions from the reservoir water storage were considered over a 20 year inundation period. The CO2 emissions associated with a reservoir mainly occur during the initial phase of water storage and typically last less than 20 years. Methane (CH4) in a reservoir is primarily produced from sediments under anaerobic conditions, and the calculation formula is in Equation 6.
where
The relevant parameters and sources of the carbon footprint calculation for the Huangshadong Reservoir Project are listed in Table 6, and the carbon footprint inventory of the operation and maintenance phase of a small hydropower plant is presented in Supplementary Table 1.
3.4 Demolition phase carbon footprint
Owing to the small number of demolished hydropower plants both domestically and internationally, there is limited research on the carbon footprint associated with the demolition of a hydropower plant, and it is currently difficult to accurately quantify the carbon footprint for this phase. Therefore, with reference to Hertwich et al. (2015), this study estimated the carbon footprint for this phase at 10% of the carbon footprint of the construction phase.
3.5 Life cycle carbon footprint and GHG emission factors
Summation of the carbon footprints of the above phases produced an entire life cycle carbon footprint of 33,148.29 t CO2e for the Huangshadong small hydropower plant (Figure 5). Of this, the preparation phase accounts for 14.22 t CO2e (representing 0.04% of the total life cycle emissions), the construction phase accounts for 22,228.03 t CO2e (representing 67.06% of the total life cycle emissions), the operation and maintenance phase accounts for 8,683.24 t CO2e (representing 26.2% of the total life cycle emissions), and the demolition phase accounts for 2,222.8 t CO2e (representing 6.7% of the total life cycle emissions).
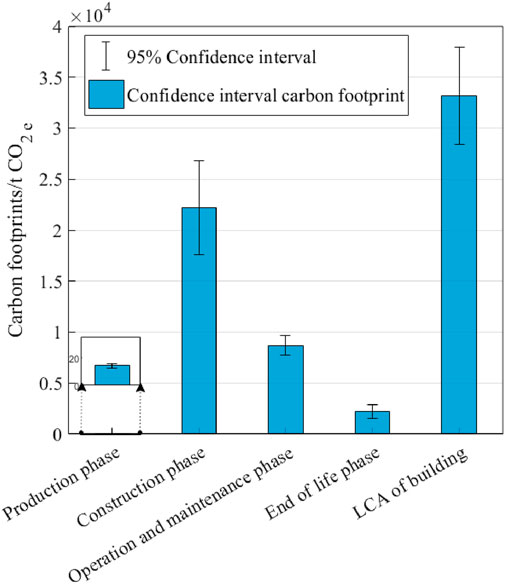
Figure 5. Carbon footprints in different life cycle phases of the Huangshadong small hydropower plant.
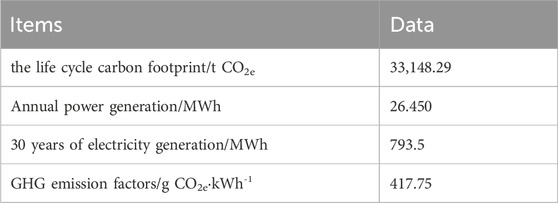
The carbon intensity, i.e., the life cycle GHG emission factor (LCE), of hydropower plants is used to compare the carbon emissions of various power generation methods. The LCE represents the carbon footprint generated per unit of power generation during the life cycle of a power plant, i.e., the ratio of the carbon footprint of the entire life cycle of a power plant to the power output during its operation. The GHG emission coefficient (carbon footprint per unit power generation) of the Huangshadong Reservoir Project is presented in Table 7.
3.6 Uncertainty analysis
Uncertainty assessment was conducted separately for each of the four phases of the entire life cycle of the Huangshadong small hydropower plant. The uncertainty of intensity data is mainly due to errors, including those in statistical data, material categorization, and unit conversion. The intensity data for each sub-product were obtained from statistical data in the engineering report, which is highly reliable. Because it is impossible to verify the material statistics provided in the hydropower station reports, it was assumed that their uncertainty is 1%. For data that have undergone material categorization and unit conversion, the uncertainty is given directly in a more subjective manner. Because the carbon footprint of the demolition phase was estimated, its uncertainty was determined with reference to Du (2017).
The uncertainty of the carbon emission coefficient stems from the selection of the emission factor. For a single material carbon emission coefficient selection, assuming its probability distribution function is symmetrical, a 95% confidence interval is selected and the uncertainty is 2.5%; for materials with multiple carbon emission coefficient choices, their probability distribution functions are asymmetric. It is necessary to specify the upper and lower limits of the confidence interval separately, and to then take the larger value of the upper and lower limits to construct an approximately symmetrical interval to obtain the uncertainty, as shown in Supplementary Table 2. Based on the uncertainty, the calculated carbon footprint values for each phase of the Huangshadong Reservoir Project are shown in Figure 5. By improving the life cycle GHG emission coefficient of the Huangshadong small hydropower plant to 417.75 g CO2e/kWh, the carbon footprint within a 95% probability interval is estimated to be between 357.64 and 477.86 g CO2e/kWh.
3.7 Impact evaluation
In this study, the life cycle carbon footprint of the Huangshadong small hydropower plant was determined at 33,148.29 t CO2e, with the distribution of the carbon footprint of each phase as shown in Figure 6A.
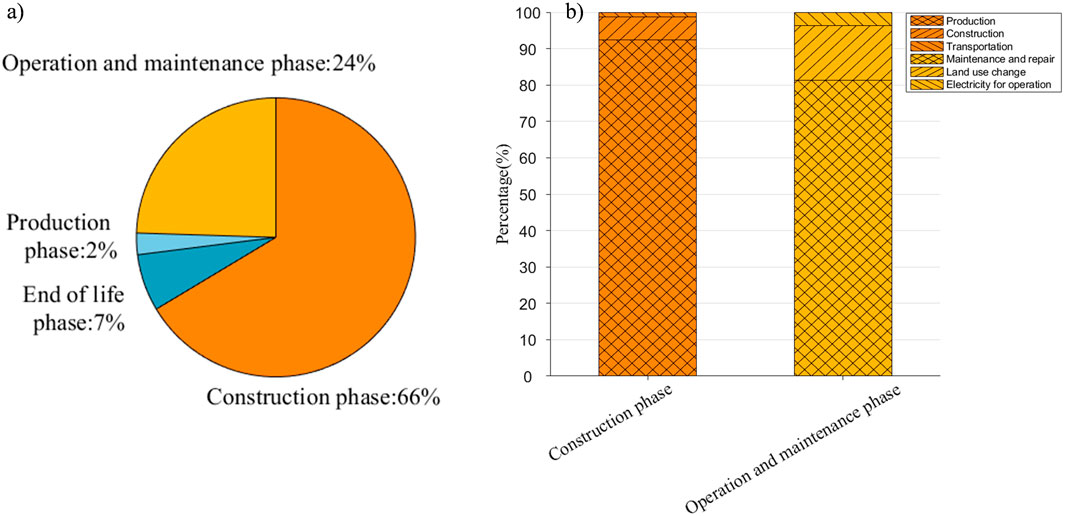
Figure 6. (A) Proportion of carbon footprint associated with different life cycle phases; (B) proportion of carbon footprint produced during the construction phase and the operation and maintenance phase.
The carbon footprint contribution of the construction phase and of the operation and maintenance phase was 67.06% and 26.2%, respectively, and these phases were the main contributors to the carbon footprint of the small hydropower project. More than 90% of the carbon footprint during the construction phase (Figure 6B) was generated by consumption of materials in the construction process. As is evident from Table 2, the production and manufacturing of cement and steel represent the main sources of carbon emissions associated with the building materials. Overall, 81% of the carbon footprint during the operation and maintenance phase (Figure 6B) was attributable to the large carbon footprint generated by the upstream production process, whereas 15% was attributable to the net GHG fluxes generated by land use change; thus, reservoir land use change is not a major factor in the life cycle carbon footprint. The carbon footprint of the preparation and demolition phases was considered relatively small, i.e., 0.04% and 6.71%, respectively.
4 Discussion
4.1 Comparison of carbon emissions
The LCE value of the Huangshadong Reservoir Project determined in this study is 417.75 g CO2e/kWh, which is lower than the range for the LCE of fossil fuel power generation recommended by the United States Energy Information Administration for coal-fired power generation (939–984 g CO2e/kWh), oil-fired power generation (757–816 g CO2e/kWh), and gas-fired power generation (534–635 g CO2e/kWh). This confirms the cleaner attributes of the Huangshadong Reservoir Project compared with those of thermal power generation.
The linear relationship between the total 180 installed hydropower capacity globally and the LCE value was obtained through regression analysis (Figure 7). With increase in installed capacity, the carbon footprint of hydropower per unit electricity generated decreases. Moreover, the LCE value of a small hydropower plant is generally larger than that of medium or large hydropower plants. Therefore, the carbon footprint value per unit electricity generation for the entire life cycle of the hydropower plant considered in this study is larger than that of large hydropower plants.
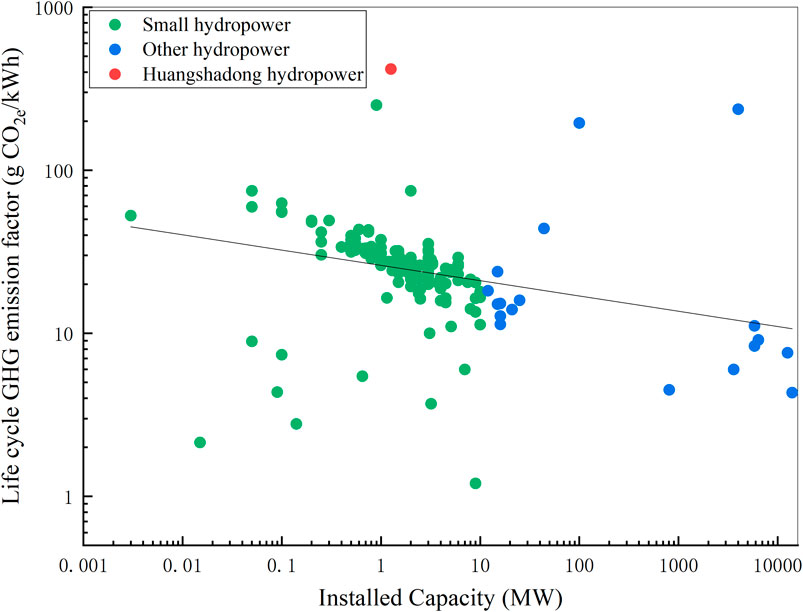
Figure 7. Distribution of installed hydropower capacity against LCE values from global datasets. Data plotted in the figure are provided in the supplementary materials. We classified the collected global hydropower carbon footprint datasets into two categories: small hydropower plants and large hydropower plants. The red circle in the figure shows the Huangshadong Reservoir Project. We analyzed the general relationship between the installed capacity and the LCE value of hydropower plants under a 95% confidence interval for the overall data.
There is a relationship between the duration of operation of a hydropower plant and its LCE value (Figure 8). When the operation time is < 80 years, the LCE value exhibits overall decline with increase in operation time; when the operation time is > 80 years, the LCE exhibits overall stabilization with increase in operation time. Therefore, the carbon footprint value per unit electricity generation throughout the entire life cycle of the hydropower plant considered in this study is larger than that of other hydropower plants with longer operation time.
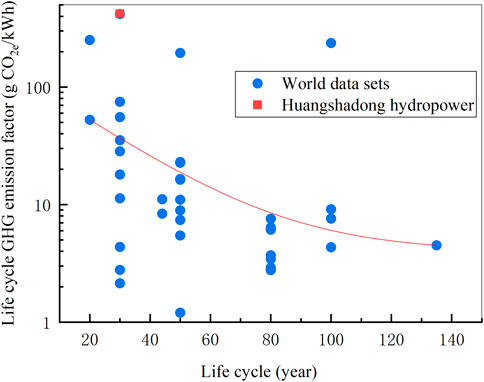
Figure 8. Distribution of hydropower running time versus LCE value from global datasets. The fitted relationship between the hydroelectric power plant operating time and the LCE value is established at the 95% confidence interval.
4.2 Comparative analysis
The Huangshadong Reservoir Project considered in this study has an installed capacity of 1.26 MW, which is approximately 0.4% of the overall average installed capacity of 302 MW in the global hydropower carbon footprint accounting datasets. The small installed capacity means that the hydropower plant is underutilized, resulting in small annual electricity generation, and the set operation time is only 30 years. These two factors together result in an LCE value for the Huangshadong Reservoir Project that is approximately 14 times that of the average (29.8 g CO2e/kWh) in the global datasets.
The other influencing factors that led to the large value of the calculated LCE of the Huangshadong Reservoir Project are analyzed in the following: The Huangshadong Reservoir Project is a gravity dam with high consumption of construction materials, especially cement, which results in large carbon emissions. In contrast, other small hydropower projects such as those in Thailand (Suwanit and Gheewala, 2011), Switzerland (Varun et al., 2009), and Wales (Gallagher et al., 2015a; 2015b) are mostly run-of-river small hydropower projects that do not need dams to store floodwater; therefore, the reduced consumption of construction materials greatly reduces the carbon footprint of those projects. Investigation of different deployment options for the Nuozhadu hydropower plant (Zhang et al., 2015) revealed that an earth and rockfill dam would reduce CO2 emissions by approximately 24.7% compared with those of a concrete gravity dam. For the Guanyinyan hydropower plant in China, which has a masonry arch dam, the carbon emission coefficient of cement consumption was only 11.02 g CO2e/kWh during the construction process (Pang et al., 2015), which is 6.4% of that associated with the cement consumption of the Huangshadong Reservoir Project, i.e., 172.89 g CO2e/kWh. Therefore, the selection of the gravity dam for the Huangshadong Reservoir Project was one of the main reasons for the large final LCE value. This study considered the carbon footprint of both the entire water supply and the maintenance and repair of the power plant, including the carbon emissions indirectly generated by damage to the ecosystem. Compared with the LCE of the Zhikong hydropower plant that also considers the reduction in neighboring ecosystem services in the carbon footprint accounting process, the LCE of the Huangshadong Reservoir Project of 195 g CO2e/kWh is high (Zhang and Xu, 2015), which reflects the more comprehensive consideration of the system boundary of the entire life cycle carbon footprint accounting. Finally, the Huangshadong Reservoir Project, as an integrated water conservancy project, also has the functions of water diversion and agricultural irrigation. The carbon footprint accounting of hydropower projects currently fails to show the comprehensive benefits of hydropower, and only considers the entire life cycle carbon emissions in relation to the benefit of power generation, which leads to this large LCE value in the final calculation.
5 Conclusion
In this study, the carbon footprint of the small hydropower plant of the Huangshadong Reservoir Project was accounted for in the preparation, construction, operation and maintenance, and demolition phases using the entire LCA method. The uncertainty assessment of the accounting results was performed using the error propagation method. The results revealed that the total carbon footprint of the entire life cycle of the Huangshadong Reservoir Project is 33,148.29 t CO2e. The construction phase contributed the largest proportion (67.06% of the total), followed by the operation and maintenance phase (26.2%), the demolition phase (6.7%), and the preparation phase (0.04%). The large amount of cement used in the process of project construction made a substantial contribution to the entire life cycle carbon footprint. The entire life cycle LCE was calculated as 417.75 (357.64–477.86) g CO2e/kWh, which is lower than the recommended range of the LCE for fossil power plants. While it is still higher compared with large- and medium-sized hydropower plants or similar small hydropower projects. However, the Huangshadong Reservoir Project is mainly used for water diversion and irrigation, and it has only generated power for a short time; therefore, the calculation of its carbon emission value based on power generation efficiency was high. Through the comparison of different emission reduction schemes, the emission reduction suggestions associated with this type of project were proposed.
Data availability statement
The raw data supporting the conclusions of this article will be made available by the authors, without undue reservation.
Author contributions
CT: Conceptualization, Funding acquisition, Project administration, Writing–original draft. YL: Formal Analysis, Methodology, Writing–original draft. PW: Data curation, Formal Analysis, Methodology, Writing–original draft. JF: Data curation, Investigation, Writing–review and editing. SZ: Conceptualization, Funding acquisition, Project administration, Supervision, Writing–review and editing. YY: Validation, Writing–review and editing. HL: Writing–review and editing. ST: Data curation, Investigation, Writing–review and editing.
Funding
The author(s) declare that financial support was received for the research, authorship, and/or publication of this article. This study was supported by the National Key Research and Development Program of China (No. 2022YFC3202005), National Natural Science Foundation of China (No. 52209086), Fundamental Research Funds for the Central Universities (No. 2023MS072), and Key Laboratory for Water and Sediment Sciences of Ministry of Education (No. SS202302).
Conflict of interest
Authors JF and ST were employed by Chongqing Surveying and Design Institute Co., Ltd.
The remaining authors declare that the research was conducted in the absence of any commercial or financial relationships that could be construed as a potential conflict of interest.
Publisher’s note
All claims expressed in this article are solely those of the authors and do not necessarily represent those of their affiliated organizations, or those of the publisher, the editors and the reviewers. Any product that may be evaluated in this article, or claim that may be made by its manufacturer, is not guaranteed or endorsed by the publisher.
Supplementary material
The Supplementary Material for this article can be found online at: https://www.frontiersin.org/articles/10.3389/fenvs.2024.1462571/full#supplementary-material
References
Cai, X., Wang, M., and Fu, B. (2010). Analysis of carbon emission and energy saving and emission reduction measures of residential buildings. J. Disaster Prev. Mitig. Eng. (S1), 428–431. doi:10.3969/j.issn.1672-2132.2010.z1.088
Du, H. L. (2017). Carbon footprint of typical hydro-projects in Jinsha river. Master's thesis. Chongqing: Chongqing Institute of Green and Intelligent Technology Chinese Academy of Sciences.
Gallagher, J., Styles, D., McNabola, A., and Williams, A. P. (2015a). Current and future environmental balance of small-scale run-of-river hydropower. Environ. Sci. Technol. 49 (10), 6344–6351. doi:10.1021/acs.est.5b00716
Gallagher, J., Styles, D., McNabola, A., and Williams, A. P. (2015b). Life cycle environmental balance and greenhouse gas mitigation potential of micro-hydropower energy recovery in the water industry. J. Clean. Prod. 99, 152–159. doi:10.1016/j.jclepro.2015.03.011
Gao, J., Zhao, J., Hou, P., and Wang, H. (2022). Effects of ENSO on hydrological process and hydropower across the lancang-mekong river basin. River 1, 172–188. doi:10.1002/rvr2.25
Gaudard, L., Romerio, F., Dalla Valle, F., Gorret, R., Maran, S., Ravazzani, G., et al. (2014). Climate change impacts on hydropower in the Swiss and Italian Alps. Sci. Total. Environ. 493 (1), 1211–1221. doi:10.1016/j.scitotenv.2013.10.012
Hertwich, E. G., Gibon, T., Bouman, E. A., Arvesen, A., Suh, S., Heath, G. A., et al. (2015). Integrated life-cycle assessment of electricity-supply scenarios confirms global environmental benefit of low-carbon technologies. J. Proc. Natl. Acad. Sci. U. S. A. 112 (20), 6277–6282. doi:10.1073/pnas.1312753111
IPCC (2006). Guidelines for national greenhouse gas inventories. Available at: https://www.ipcc-nggip.iges.or.jp/public/2019rf/index.html.
IPCC (2019). Refinement to the 2006 IPCC guidelines for national greenhouse gas inventories. Geneva, Switzerland: IPCC. Available at: https://www.ipcc-nggip.iges.or.jp/public/2019rf/index.html.
IPCC (2021). Sixth assessment report: climate change 2021: the physical science basis. Geneva, Switzerland. Available at: https://www.ipcc.ch/report/sixth-assessment-report-working-group-i/.
Li, X., Wang, S., Kong, X., and Zhang, Z. (2011). Life cycle environmental impact assessment of ready-mixed concrete. J. Civ. Eng. 44 (01), 132–138. doi:10.15951/j.tmgcxb.2011.01.020
Li, X., Yang, F., Zhu, Y., and Gao, Y. (2014). An assessment framework for analyzing the embodied carbon impacts of residential buildings in China. Energy Build. 85, 400–409. doi:10.1016/j.enbuild.2014.09.051
Li, Y., Qin, Y., Yang, L., Li, Z., and Lu, L. (2023). Estimation and analysis of carbon emission from large and medium-sized reservoirs in the upper reaches of the Yangtze River: based on the IPCC National Greenhouse Gas Inventory Guide. J. Lakes Sci. 35 (01), 131–145. doi:10.18307/2023.0108
Li, Z., Du, H., Xiao, Y., and Guo, J. (2017). Carbon footprints of two large hydro-projects in China: life-cycle assessment according to ISO/TS 14067. Renew. Energy 114, 534–546. doi:10.1016/j.renene.2017.07.073
Liu, L., Liu, Y., Wen, X., and Wang, Y. (2008). CH4 emission flux of artificial coniferous forest in red soil. J. Plant Ecol. 32 (2), 431–439. doi:10.3773/j.issn.1005-264x.2008.02.022
Lou, Y., Li, Z., and Zhang, T. (2004). Effect of different utilization methods on the CO2 discharge of red soil. J. Ecol. 24 (5), 978–983. doi:10.3321/j.issn:1000-0933.2004.05.018
Lu, L. (2009). Methane fluxes and their controlling factors from several land use types soils in three gorges area, China. Huazhong Agricultural University. Master's thesis.
Miller, B. L., Chen, H., He, Y., Yuan, X., and Holtgrieve, G. W. (2019). Magnitudes and drivers of greenhouse gas fluxes in floodplain ponds during drawdown and inundation by the three gorges reservoir. J. Geophys. Res. Biogeosciences 124 (8), 2499–2517. doi:10.1029/2018JG004701
Ministry of Ecology and Environment of the People's Republic of China (2023). Notice on doing a good job in the management of greenhouse gas emission reporting for enterprises in the power generation sector in 2023-2025. Available at: https://www.mee.gov.cn/xxgk2018/xxgk/xxgk06/202302/t20230207_1015569.html.
Nautiyal, H., and Goel, V. (2020). Sustainability assessment of hydropower projects. J. Cleaner. Produ. 265, 121661.
Nasir, J., Javed, A., Ali, M., Ullah, K., and Kazmi, S. A. A. (2022). Capacity optimization of pumped storage hydropower and its impact on an integrated conventional hydropower plant operation. Appl. Energy 323, 119561. doi:10.1016/j.apenergy.2022.119561
Pang, M., Zhang, L., Wang, C., and Liu, G. (2015). Environmental life cycle assessment of a small hydropower plant in China. Int. J. Life Cycle Assess. 20 (6), 796–806. doi:10.1007/s11367-015-0878-7
Ribeiro, F. D. M., and Da Silva, G. A. (2010). Life-cycle inventory for hydroelectric generation: a Brazilian case study. J. Clean. Prod. 18 (1), 44–54. doi:10.1016/j.jclepro.2009.09.006
Suh, S. (2004). Functions, commodities and environmental impacts in an ecological–economic model. Ecol. Econ. 48 (4), 451–467. doi:10.1016/j.ecolecon.2003.10.013
Suh, S., Lenzen, M., Treloar, G. J., Hondo, H., Horvath, A., Huppes, G., et al. (2004). System boundary selection in life-cycle inventories using hybrid approaches. Environ. Sci. Technol. 38 (3), 657–664. doi:10.1021/es0263745
Suwanit, W., and Gheewala, S. H. (2011). Life cycle assessment of mini-hydropower plants in Thailand. Int. J. Life Cycle Assess. 16 (9), 849–858. doi:10.1007/s11367-011-0311-9
Varun, P. R., and Bhat, I. K. (2012). Life cycle greenhouse gas emissions estimation for small hydropower schemes in India. Energy 44 (1), 498–508. doi:10.1016/j.energy.2012.05.052
Varun, P. R., Bhat, I. K., and Prakash, R. (2009). LCA of renewable energy for electricity generation systems—a review. Renew. Sustain. Energy Rev. 13 (5), 1067–1073. doi:10.1016/j.rser.2008.08.004
Zhang, J., and Xu, L. (2015). Embodied carbon budget accounting system for calculating carbon footprint of large hydropower project. J. Clean. Prod. 96, 444–451. doi:10.1016/j.jclepro.2013.10.060
Zhang, S., Pang, B., and Zhang, Z. (2015). Carbon footprint analysis of two different types of hydropower schemes: comparing earth-rockfill dams and concrete gravity dams using hybrid life cycle assessment. J. Clean. Prod. 103, 854–862. doi:10.1016/j.jclepro.2014.06.053
Zhang, Y., Wang, J., and Liu, F. (2013). Carbon footprint of iron and steel production process--A case study of Nanjing Iron and Steel Union Co Ltd. J. Environ. Sci. 33 (04), 1195–1201. doi:10.13671/j.hjkxxb.2013.04.023
Zhao, Z., Zhang, L., Kang, W., Tian, D., Xiang, W., Yan, W., et al. (2011). Characteristics of CO2 flux in a Chinese fir plantation ecosystem in huitong county, hunan province. J. For. Sci. 47 (11), 6–12. doi:10.11707/j.1001-7488.20111102
Zheng, Q. (2018). Study on carbon footprint evaluation in the construction stage of hydropower project. Dalian University of Technology. Master's thesis.
Keywords: small hydropower plant, life cycle assessment (LCA), carbon footprint, clean energy, hydropower development
Citation: Tang C, Leng Y, Wang P, Feng J, Zhang S, Yi Y, Li H and Tian S (2024) Study on carbon emissions of a small hydropower plant in Southwest China. Front. Environ. Sci. 12:1462571. doi: 10.3389/fenvs.2024.1462571
Received: 17 July 2024; Accepted: 23 October 2024;
Published: 08 November 2024.
Edited by:
Lei Wang, Chinese Academy of Sciences (CAS), ChinaReviewed by:
Tianan Deng, Hong Kong Polytechnic University, SAR ChinaHe-Xiang Yan, Tongji University, China
Copyright © 2024 Tang, Leng, Wang, Feng, Zhang, Yi, Li and Tian. This is an open-access article distributed under the terms of the Creative Commons Attribution License (CC BY). The use, distribution or reproduction in other forums is permitted, provided the original author(s) and the copyright owner(s) are credited and that the original publication in this journal is cited, in accordance with accepted academic practice. No use, distribution or reproduction is permitted which does not comply with these terms.
*Correspondence: Shanghong Zhang, emhhbmdzaDkyOEAxMjYuY29t
 Caihong Tang
 Yiling Leng
 Pengyu Wang1
 Shanghong Zhang
 Yujun Yi
 Hui Li