 Xinhao Zheng
 Yuexin Chen
- 1Beijing Police College, Beijing, China
- 2Faculty of Business and Management, Asia Pacific University of Technology and Innovation, Kuala Lumpur, Malaysia
Introduction: Gross Domestic Product (GDP) is the most well-known and widely used measure of a country’s economic health. However, GDP fails to account for the depletion of natural resources and the environmental damage that occurs in the pursuit of economic growth, leading to an incomplete and potentially misleading picture of a nation’s well-being. To address this shortcoming, Green GDP (GGDP) is proposed as a more comprehensive indicator that incorporates environmental factors into the economic assessment. This study builds on extensive literature reviews, internationally accepted GGDP accounting methods, and scholarly research to propose a new GGDP calculation model that better reflects a country’s sustainable development.
Methods: The proposed GGDP model is divided into two main components: natural resource loss and environmental pollution loss. Each component is further broken down into primary factors that are condensed into 13 sub-criteria reflecting a country’s capacity for sustainable development. Principal Component Analysis (PCA) is utilized to identify the most representative factors from these sub-criteria and to analyze the relationships among GGDP, these factors, and global mean temperature. Additionally, the Integrated Environmental Sustainability Index (IESI) is used to develop a global temperature mitigation prediction model, which considers the impacts of epidemics, sea and land temperatures, and variations in climate across different regions.
Results: The analysis shows a 74% probability that positive GGDP growth correlates with temperature changes over a 50-year period, indicating that economic activities measured by GGDP are linked to climate change. The GGDP model reveals significant differences between global GDP and Green GDP, with the latter growing at a much slower rate. This slower growth of Green GDP is primarily due to the declining share of GDP from natural resource-dependent activities, which has fallen from 90% in the 1970s to 80% in 2020. This trend underscores the increasing gap between traditional economic growth and sustainable development, suggesting that as countries continue to rely on natural resources, their overall ecological efficiency declines, environmental pressures increase, and the potential for long-term sustainable development diminishes.
Discussion: The findings demonstrate that all factors within the GGDP model are proportional to global temperature, underscoring the significant impact that natural resource utilization and pollution emissions have on economic growth and climate change. The study further evaluates global sustainable development by considering both economic and environmental perspectives. Using Brazil as a case study, the model is applied to assess the values of each component within the GGDP framework, providing a comprehensive analysis of the country’s sustainable development challenges and potential solutions. This approach establishes a method for assessing sustainable development that can be adapted for use in other countries, offering a path forward for integrating environmental considerations into economic policies.
1 Introduction
1.1 Background
Gross Domestic Product (GDP) is a well-known and widely used indicator of a country’s economic wellbeing (Bazan, 1997; Nordhaus, 2006; World Bank, 2011). It determines a country’s purchasing power and access to loans, incentivizing nations to propose policies and initiatives that boost their GDPs. The monetary value of final goods and services produced within a country’s borders during a specific time period is used to calculate GDP. This approach, however, is flawed because it prioritizes current production over the need to conserve resources for the future. For example, a country with vast forest reserves could boost its GDP by felling trees and producing more wooden furniture, causing significant environmental damage (see Figure 1). Similarly, harvesting more fish to boost GDP could cause irreversible damage to fish stocks with no consequences (Lan et al., 2002).
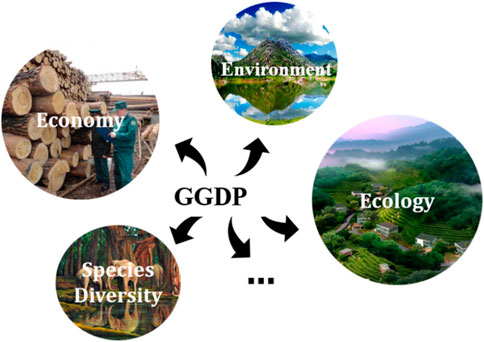
Figure 1. GGDP related natural factors.
Economic health has traditionally been measured by Gross Domestic Product (GDP), a metric that captures the market value of all final goods and services produced within a country in a given period (Smith, 1993; Krugman and Wells, 2009). However, GDP has been criticized for its inability to account for environmental degradation, social wellbeing, and the sustainability of economic growth (Costanza et al., 1997; Jackson, 2009). As a result, there is a growing consensus among economists and policymakers that a more comprehensive measure of economic performance is needed, one that incorporates environmental and social factors: the Green Gross Domestic Product (Green GDP) (Pearce and Turner, 1991; Hamilton and Clemens, 1999). Green GDP changes the standard GDP by integrating environmental prices and advantages, such as contamination reduction, source exhaustion, and modifications in ecological quality (Arrow et al., 1996; Dasgupta, 2013). This method acknowledges that economic activity is not separated from the natural environment and that lasting advancement calls for a balance in between financial development and environmental management (Rockström et al., 2009; Stiglitz et al., 2009). The idea of Green GDP has actually been getting grip recently, with a number of countries and international organizations exploring its execution (United Nations, 2013; World Bank, 2014). Studies have shown that incorporating ecological factors into financial measurement can lead to more informed policy decisions and a better understanding of the true costs and benefits of economic activities (Dawson and Graham, 2007; Field et al., 2014). The National Accounts - Analysis of Main Aggregates (2024) highlights the importance of integrating environmental factors into economic indicators to provide a more accurate representation of a country’s financial health.
1.2 Literature review
1.2.1 Concept of green GDP
The traditional Gross Domestic Product (GDP), while a reliable measure of economic activity, has consistently stopped working to capture the adverse surfaces associated with ecological injury and resource usage (Hamilton and Clemens, 1999). The development of the Eco-friendly GDP idea addresses this gap by integrating ecological and social aspects into financial assessments, using a more alternative view of a nation’s financial wellness (Costanza et al., 1997; Neumayer, 2003). This approach straightens with the broader globalmovement in the direction of lasting advancement, as supported by the Stiglitz Payment (Stiglitz et al., 2009) which highlights the relevance of taking into consideration environmental and social wellness in financial performance measurement.
The incorporation of all-natural capital and ecological services in financial evaluation is a critical component of the. Eco-friendly GDP structure (Daily, 1997). This not only gives a much more exact depiction of real worth of economic tasks but also urges policies that protect and maintain the environment for future generations (United Nations, 2013). The World Bank (2014) has actually resembled this belief, highlighting the demand for economic indicators that represent the ecological prices and advantages of advancement tasks.
1.2.2 Applications of Green GDP
The practical application of Environment-friendly GDP in policy-making is essential for steering economies toward sustainable development. As discussed by Li and Lin (2017), the incorporation of Eco-friendly GDP into policy decisions is crucial for fostering ecological sustainability without undermining economic growth. Lenaerts and Tagliapietra (2022) further emphasize that green GDP plays a vital role in shaping policies that promote green economic practices, including the adoption of eco-friendly financial policies and the development of green financial instruments. These measures are pivotal in driving sustainable economic strategies that align with both environmental and economic goals.
On the global stage, Green GDP functions as an important tool for comparing ecological performance and encouraging collective initiatives to attend to global ecological challenges (United Nations, 2013). The World Bank (2014) has played a considerable function in promoting Eco-friendly GDP as a system for assessing the. environmental implications of economic activities across different countries, thereby influencing international environmental administration and the international fostering of lasting methods.
1.2.3 Quantification of green GDP
Accurate quantification of Environment-friendly GDP necessitates the growth of advanced methods with the ability of valuing natural resources and eco-friendly solutions, and accountancy for contamination and resource deficiency costs (Dasgupta, 2013). The United Nations’ System of Environmental-Economic Audit (SEEA) represents a major innovation, providing a standard strategy to incorporating ecological metrics right into economic audit (United Nations, 2013). This structure is essential to the calculation of Eco-friendly GDP and its reliable utilization in policy formulation and decision-making processes.
The introduction of sophisticated computational designs, such as neural networks, has actually additionally boosted the metrology of Green GDP. Zhu et al. (2023) have shown the potential of these designs in forecasting environmental impacts and improving the precision of Environment-friendly GDP calculations. Such modeling techniques are essential for getting insights into the lasting ecological effects of economic tasks and for developing sustainable economic policies that secure the earth’s ecological communities.
2 Global temperature impact prediction model based on GGDP
Today, numerous scholars on the planet have actually recommended an approach to determine GGDP. Therefore, by comparing the benefits and disadvantages and performance of different well-known methods, this paper initially selects a major index that can change GDP to determine the economic health of a country and combines the existing data to put forward the last accounting approach of GGDP (Deng, 2002).
2.1 Method comparison
Currently known methods are.
2.1.1 Accounting for resource consumption
An example of a model that accounts for resource consumption in green GDP calculations is the “Adjusted Net Savings” (ANS) indicator developed by the World Bank (Nordhaus, 2006).
GDP is gross savings, PCD is depreciation of physical capital and NRD is depletion of natural resources.
2.1.2 Ecological footprint model
An example of a model that uses the ecological footprint method to estimate green GDP is the “Ecological Footprint” developed by the Global Footprint Network (World Bank, 2011) is the total land area, average productivity and is biocapacity. Biocapacity is a measure of an ecosystem’s ability to produce resources and absorb waste (Bazan, 1997).
2.1.3 Inclusive Wealth Index IWI
The Inclusive Wealth index considers not only traditional economic indicators such as GDP, but also the country’s natural, human and productive capital. Natural capital includes the country’s natural resources, such as forests, minerals and water. Human capital refers to the skills and knowledge of the population, while productive capital includes the infrastructure and equipment used for production. IWI is calculated as follows: represent production capital, human capital and natural capital respectively. P is the social (shadow) price of all kinds of capital.
2.2 Establishment of sustainable development evaluation method based on energy analysis
Energy sustainable indices (ESI) reflect the sustainable development capability of ecological economic system. Only on the premise of improving unit social and economic benefits and controlling unit comprehensive environmental pressure can the level of sustainable development be improved. The higher the ESI value is, the better the sustainability is. Referring to previous studies (Xu, 2012), only when ESI value is lower than 1 can the socio-economic development be good, and the state of eco-economic system be sustainable. When ESI value is higher than 10, the socio-economic development is poor and sustainable development cannot be guaranteed. The improvement of ESI is to fully consider the emission and waste in the calculation process of ESI (Lan et al., 2002). For the impact of waste on sustainable development, the ratio of waste to renewable energy value is added to make the evaluation results more consistent with the actual situation. The specific calculation formula is as follows (World Bank, 2011): ImprovedESI.
Where IESI is an energy sustainable index; EYR is energy yield; ELR is the environmental load rate; EWR is the ratio of waste to renewable energy value.
2.3 Model building
By comparing the advantages and disadvantages of the three methods, and combining with the international common green GDP accounting method, we summarized the following equation: R + E is the cost of environmental damage. R is the loss of natural resources; E is the loss of environmental pollution. After consulting relevant literature and materials, we found several representative factors to further refine the two. Among them, resource loss R includes mineral energy loss, land resource loss, water resource loss, etc., while environmental pollution loss E mainly refers to environmental pollution caused by economic development, including wastewater, waste gas, solid waste, noise pollution, etc. The details are shown in the following Figure 2.
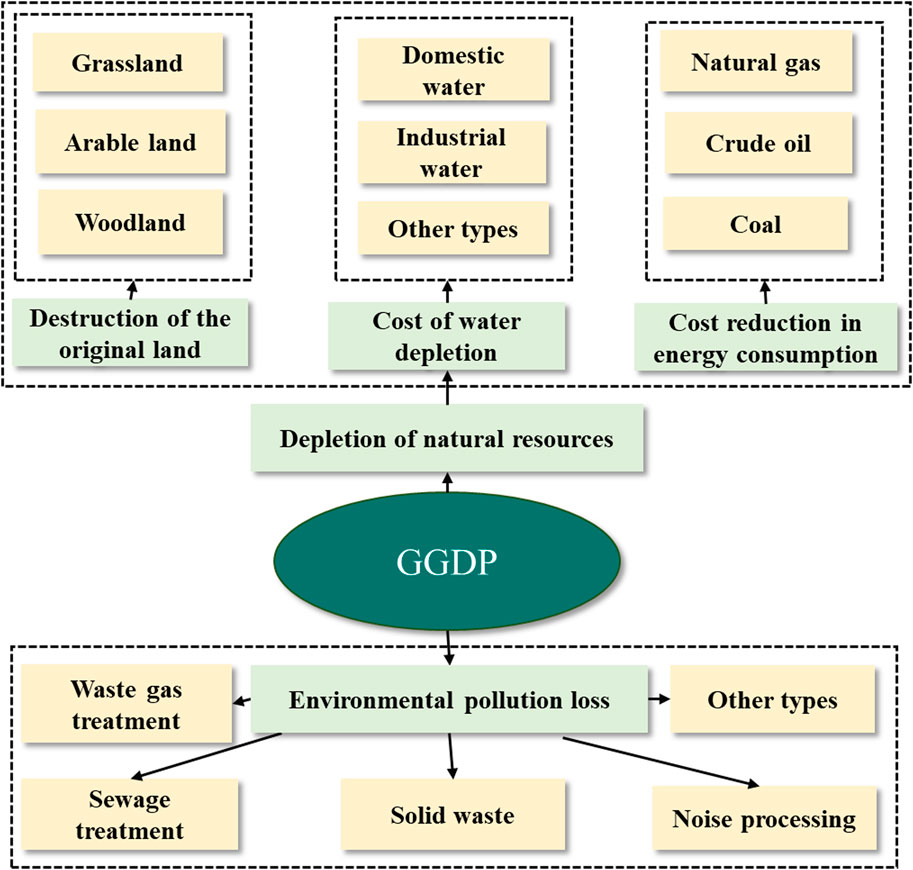
Figure 2. Land use change from primary forest.
In the second part A: The main consideration is the depletion of different land LD, water resources consumption WRC and energy consumption EC.
In the second part E: We consider the main components: sewage treatment ST, greenhouse gas damage, and solid waste damage SWD.
For CO2 emissions, we still need to consider the presence of carbon dioxide uptake by forests, so we need to consider net CO2 emissions that do not participate in the carbon cycle. The diagram Figure 3 is shown below.
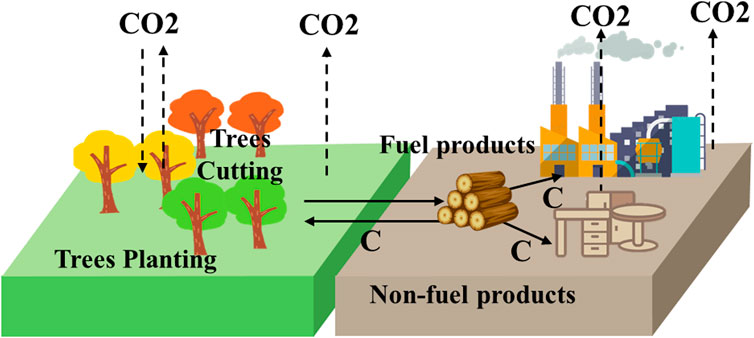
Figure 3. Map of carbon cycle in forest systems (Forests and Forest Products).
2.4 Data processing
2.4.1 The cost of destruction of the original land and the new value of restoration
This section consists of three parts: arable land, woodland and grassland. First of all, according to the international statistical yearbook respectively calculate the value of three types of table, and then determine the price of the unit area of cultivated land, woodland, grassland, take the average, and finally use the unit price of the resource multiplied by the area of the resource, that is, the value of the resource. Namely: land consumption cost = Σ changes in land surface prices average prices of such land in the same year (World Bank, 2011).
2.4.2 Calculation of the cost of water depletion
Water resources include domestic water and industrial water. The annual water consumption of each type is multiplied by the unit price of the same type of water in the same year, and the sum of the two is the cost of water resources consumption reduction. That is, water consumption reduction cost = Σ annual water consumption of different nature average price of water of that nature in that year.
2.4.3 Cost reduction in energy consumption
Firstly, three indices—coal, crude oil, and natural gas—are selected. Energy costs are calculated by multiplying the annual consumption of each energy source by its respective unit price for that year. The total energy consumption cost is then determined by summing the average costs of these indices. Thus, the cost of energy consumed is calculated as the sum of the annual consumption of various energy sources multiplied by the average price of these resources for the year (Kureski et al., 2020).
2.4.4 Carbon dioxide carbon neutralization
In the realm of waste gas treatment, carbon dioxide is identified as the principal greenhouse gas due to its profound impact on global temperature and its capacity to serve as a representative indicator for other atmospheric pollutants (United Nations Statistics Division, 2007). The financial cost associated with the treatment of CO2 emissions is calculated by multiplying the annual quantity of CO2 emissions by the carbon pricing metrics provided by the World Bank. The aggregate expenditure is thus derived from this calculation.
2.4.5 Sewage and solid waste calculation and treatment
The cost of treating sewage and solid waste is determined by multiplying the annual quantity of each type of waste by its corresponding unit treatment price. The total waste disposal cost is obtained by summing these individual costs. Therefore, the formula for waste disposal cost is: the sum of (annual amount of each type of waste average unit price for that type in that year).
3 GGDP global temperature mitigation forecast model based on IESI
This chapter constructs a GGDP global temperature mitigation forecast optimization model based on IESI, used to synthesize various natural resource-related factors and describe their correlation with global temperature and GGDP.
3.1 Correlation analysis
After determining the proportion of GDP attributed to each factor of resource loss (R) and environmental pollution (E), the correlations between these factors, GGDP, and global temperature were calculated. Spearman’s rank correlation coefficient was used to estimate the correlation between variables X and Y. This method describes the correlation between variables through a monotone function. If the sets of values for the two variables do not contain duplicate elements, the correlation coefficient (ρ) between them can reach +1 or −1, indicating a perfect monotone relationship (Wallace, 2000). Figure 4 below illustrates these correlations.
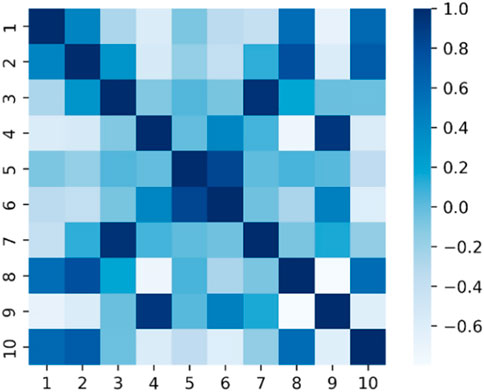
Figure 4. Correlation analysis hotspot map.
3.2 Principal factor selection
Using principal component analysis (PCA), 14 secondary factors were initially screened and reduced to four principal factors based on their distinct characteristics. Table 1 presents the results of this screening process, showing the loadings of each factor and their contribution to the principal components. Additionally, Figure 5 provides a visual representation of the variance explained by these principal factors, highlighting their significance in the overall analysis.
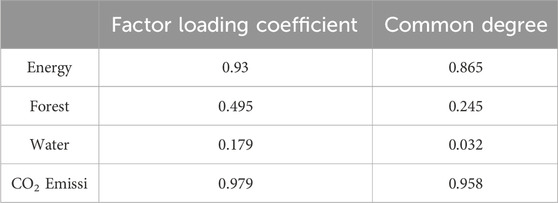
Table 1. Factor load coefficient table.
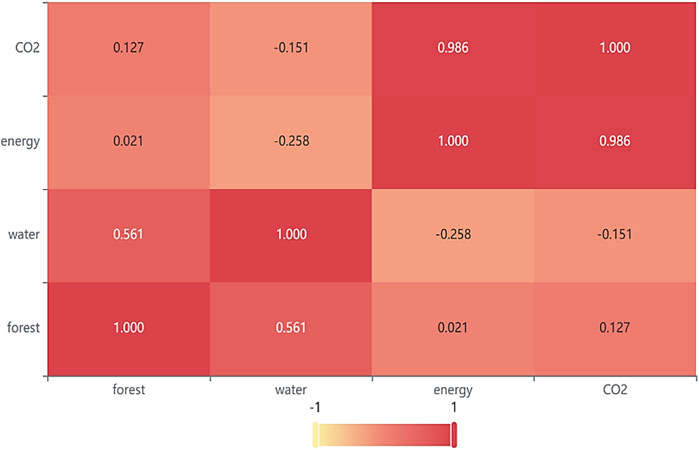
Figure 5. Correlation coefficient heat map.
As shown in the table and figure above, there is no significant correlation among the four selected factors, indicating that these factors can be used as main variables for further analysis.
Additionally, a grey model was constructed to further validate the correlation and accuracy of these main factors. The results of this validation, including the predicted and observed values, are summarized in Table 2. This table highlights the strong correlation and accuracy of the grey model in confirming the significance of the identified principal factors.

Table 2. Grey model construction.
Based on the data presented in the table, the posterior difference ratio is calculated to be 0.117, which signifies a high degree of model accuracy. The analysis indicates that all stage ratios of the original sequence are within the range of 0.962–1.04, affirming the suitability of the original sequence for developing a grey prediction model (Deng, 2002). Additionally, the model’s average relative error of 0.99% reflects an excellent fit.
3.3 Numerical solution of model
In the initial phase, calculations for each factor were conducted based on the preliminary model. The parameters utilized in these calculations are elucidated in Table 3 below. This table provides a comprehensive overview of the key parameters, including their values and the assumptions made during the modeling process.
Table 3. Model parameters of Tien Shan.
During the process of model refinement, it became evident that some variables had a negligible impact on GGDP. Therefore, factors contributing less than 2% were systematically excluded from the analysis. The four predominant factors retained include energy consumption, carbon dioxide emissions, water resource utilization and wastewater treatment (consolidated as a single factor), and the use of woodland and agricultural land. The refined model is presented in Figure 6.

Figure 6. Decadal variations in sea surface temperature from 1990 to 2020.
As illustrated in the graph, among the four factors, total energy consumption exerts the most significant influence on GGDP, with carbon dioxide emissions following closely. Consequently, it is imperative to conduct further research to delve deeper into the relationship between these two factors and their effects on global temperature.
3.4 Considerations of ocean temperature
Oceans cover about 71 percent of the Earth’s surface. In the global carbon cycle, oceans play a significant role in absorbing carbon dioxide compared to land, making them a better indicator of CO2’s impact on air temperature. Consequently, the effect of carbon dioxide on sea temperature is the primary focus. The global distribution and regional variation of sea surface temperature (SST) are illustrated in Figure 7 using historical monthly average data from January 1990 to December 2020, combined with statistical methods.
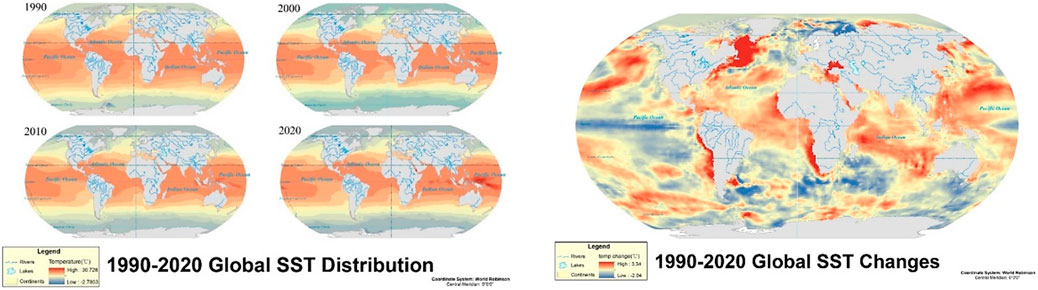
Figure 7. Decadal distribution of sea surface temperature from 1990 to 2020 (left) and the change of the difference distribution of SST in 1990–2020 (right).
The two figures above illustrate the characteristics and variations in global SST from 1990 to 2020, further confirming the hypothesis. As a result, it is necessary to separately analyze the regression averages of carbon dioxide’s impact on sea temperature and land temperature.
3.5 Results presentation and description
The analysis reveals significant relationships between Green GDP (GGDP), Gross Domestic Product (GDP), and global temperature changes. Figure 8 illustrates these relationships, showing how variations in GDP and GGDP correspond with changes in global temperature. This diagram highlights the critical interactions between economic growth and environmental impact, serving as a visual foundation for understanding the broader implications of the study’s findings.
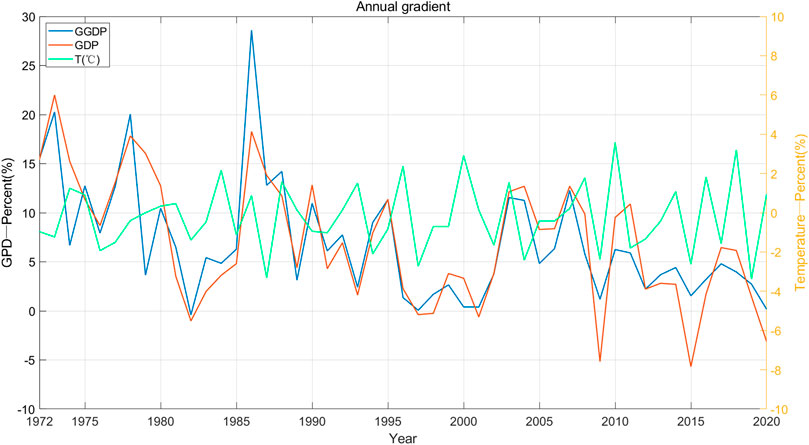
Figure 8. Diagram illustrating the relationship between green GDP (GGDP), gross domestic product (GDP), and temperature.
As depicted in the graph, there is a discernible upward trend in global average temperatures, while both GDP and GGDP exhibit slight declines. This analysis suggests that an increase in global average temperature is associated with a reduction in GDP and GGDP. Specifically, a 4-degree Celsius rise in average temperature is projected to lead to a 1 percentage point decrease in GDP and a 1.4 percentage point decrease in GGDP. Figure 9 illustrates the interrelationship between carbon dioxide levels, energy consumption, and global temperature, reinforcing the connection between rising CO2 emissions and global warming.
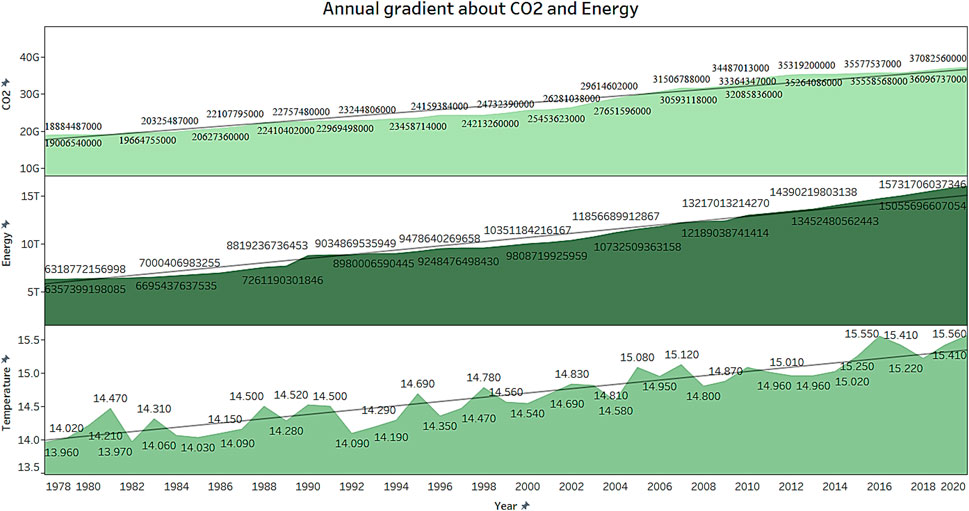
Figure 9. The interrelationship between carbon dioxide levels, energy consumption, and global temperature.
Extensive research on the macroeconomic impacts of temperature on human activities has identified several factors that contribute to productivity losses as temperatures rise. These factors include:
Human Health: Elevated temperatures can have detrimental effects on human health, resulting in a higher incidence of heart disease in developed nations such as the United States, as well as increased mortality rates from vector-borne diseases like dengue fever and malaria in developing countries.
Labor Productivity: Higher temperatures generally decrease labor productivity.
People are more prone to making mistakes and performing poorly in hot conditions.
Increased temperatures are likely to escalate human conflicts, thereby disrupting normal economic activities.
These findings substantiate the validity of the established model in predicting the global impact of climate change. Figure 10 provides a forecast of GGDP and global mean temperature based on the analysis, indicating the expected economic consequences of ongoing temperature increases. Consequently, GGDP emerges as a robust and comprehensive metric for assessing a nation’s economic health.
1. Since 1970, global land temperatures have been steadily rising. Additionally, ocean temperatures are projected to increase over the next 20 years.
2. Over the years, there has been a consistent upward trend in energy consumption, carbon dioxide emissions, and global mean temperatures. This trend indicates a strong positive correlation between global mean temperature and the primary natural resource factors considered in GGDP.
3. Excessive carbon dioxide emissions have a profound impact on global climate change. Projections indicate that CO2 emissions will continue to rise annually, consistent with the trend of global warming and the increasing disparity between GGDP and GDP. Therefore, mitigating excessive CO2 emissions is critical for addressing global warming.
4. The increase in CO2 concentration leads to significant changes in global temperatures across various regions. Additionally, alterations in precipitation patterns are expected to cause approximately a 10% fluctuation in water resources in different regions. Notably, the absolute value of the correlation coefficient between energy consumption and global mean temperature is higher and more significant.
Figure 10. GGDP global mean temperature forecast According to the analysis and the figure above.
These findings validate the established model’s efficacy in predicting the global impact of climate mitigation efforts. Consequently, GGDP can be effectively utilized as a primary indicator of a country’s economic health.
4 Robustness evaluation of GGDP model
4.1 Analysis and results of global carbon GGDP accounting
To comprehensively understand and analyze the interrelationship between various indicators within GGDP and traditional GDP, this study calculates the ratio of each indicator to GDP. Furthermore, it assesses the average annual differential between GDP and GGDP from 1990 to 2010. The comparative analysis is illustrated in Figure 11.
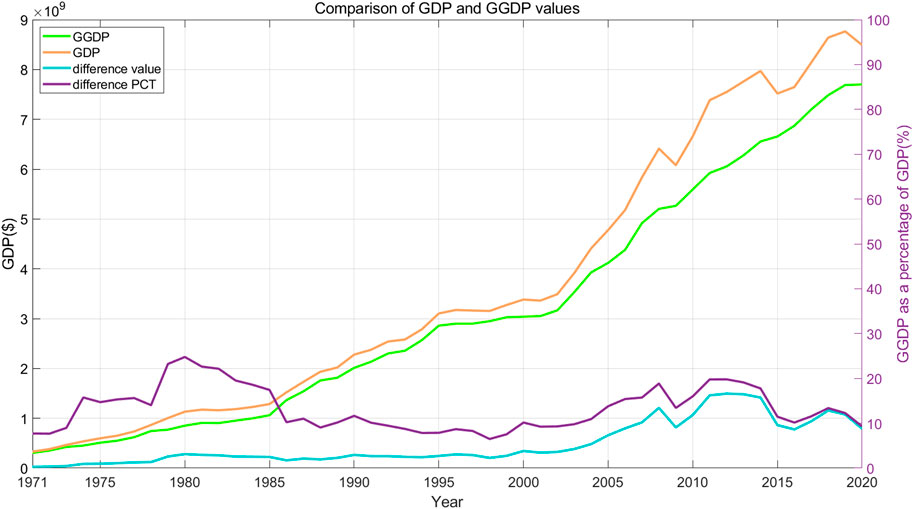
Figure 11. Comparative analysis of economic health as measured by GDP and GGDP from 1970 to 2020, including the differential values.
Global sustainable development is assessed through the dual lenses of economic performance and environmental impact. An evaluation framework grounded in energy theory has been developed to gauge global sustainability. The findings from this system reveal the following insights.
4.1.1 Green GDP and total GDP growth
Both Green GDP and total GDP have exhibited continuous growth over the observed period. However, the growth rate of Green GDP is markedly slower compared to that of total GDP. This discrepancy implies that an economic development model heavily dependent on natural resource consumption exacerbates the divergence between GDP and Green GDP, thereby impeding sustainable development.
4.1.2 Natural resource consumption and pollution
The annual consumption and pollution of natural resources have shown a persistent upward trend, while overall ecological efficiency has progressively declined. The rapid pace of economic development has resulted in increased energy consumption, urban expansion, heightened ecological pressure, and a reduced capacity for sustainable development.
4.2 Comparison between green GDP (GGDP) and traditional GDP
1. Enhanced Comprehensiveness: Green GDP incorporates environmental considerations and resource utilization, offering a more holistic view of the environmental impacts of economic development.
2. Increased Sustainability: By elucidating the interconnections between economic growth and the natural environment, Green GDP facilitates the alignment of economic progress with environmental stewardship, thereby advancing sustainable development.
3. Greater Accuracy: Green GDP provides a more precise measurement of the interplay between economic activities and environmental resource consumption, offering a robust foundation for informed policy-making.
4. Green GDP elucidates the specific environmental repercussions of economic development, thereby aiding in the cultivation of public awareness and fostering a greater commitment to environmental sustainability. The following framework, as illustrated in Figure 12, provides a more complete and accurate representation of GGDP, capturing its multifaceted impact on both the economy and the environment.
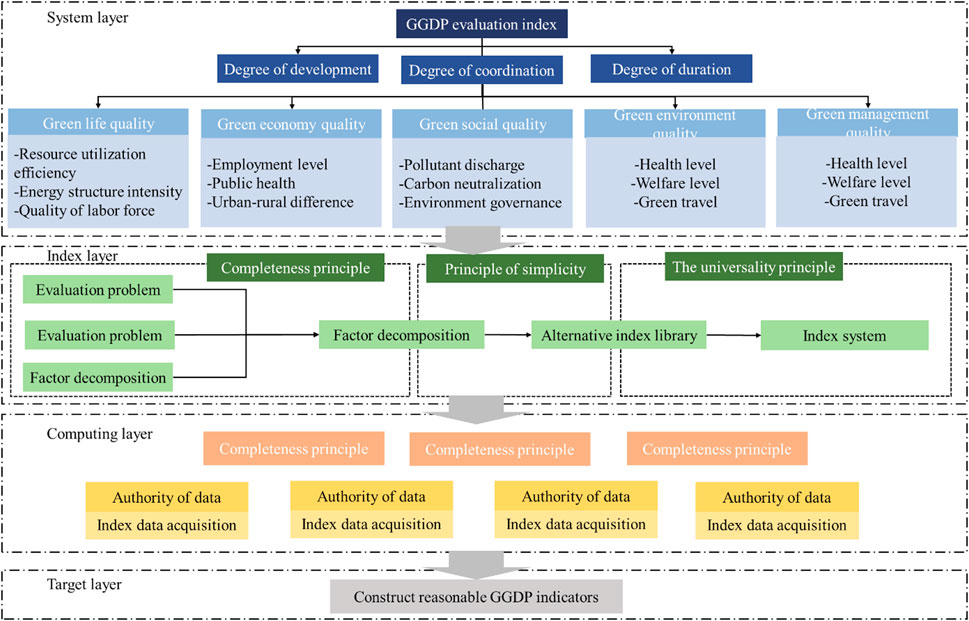
Figure 12. The structure of green GDP (GGDP).
However, our research also revealed that Green GDP has some disappointing features.
5 An analysis of green GDP (GGDP) in Brazil
At present, Brazil’s economic growth and development are significantly reliant on its natural resources. The trends in employment growth within Brazil reveal two notable characteristics:
1. A swift increase in trade-related agricultural employment, which is classified as non-agricultural employment, representing 10.2% of the total employment in 2011 (Kureski et al., 2020).
2. The predominance of the tertiary sector as the main driver of employment growth, comprising 74.2% of non-agricultural employment in the same year.
The current GDP calculations for Brazil do not incorporate the consumption of natural resources or the environmental degradation costs, potentially leading to adverse long-term impacts on the country’s economic stability and health.
Considering Brazil’s heavy dependence on natural resources, this section examines the effects of variations in CO2 concentration, temperature, humidity, and other environmental factors on Brazil’s GGDP and GDP over the past 5 decades. It also discusses how these environmental changes might influence the economy and highlights specific observable modifications.
5.1 Development of the GGDP accounting model for Brazil
The development of the GGDP accounting model for Brazil involves a detailed comparison between traditional GDP and Green GDP (GGDP) metrics. Figure 13 illustrates the comparison of GDP and GGDP for Brazil, highlighting the differences in economic evaluation when environmental factors are taken into account. This analysis provides insights into the impact of environmental resource utilization on Brazil’s economic performance and demonstrates the added value of incorporating GGDP into national accounting.
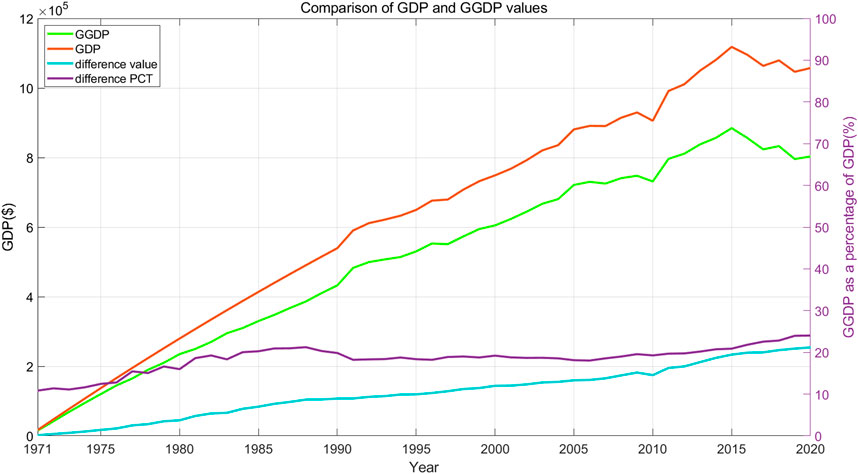
Figure 13. Comparison of GDP and GGDP and analysis of their differences.
The graph provides a comparative analysis of GGDP and GDP. The blue line represents GGDP, the orange line signifies GDP, the yellow line indicates the difference between the two, and the purple line illustrates the ratio of GGDP to GDP. The declining proportion of GGDP relative to GDP indicates an increasing exploitation of natural resources, suggesting a trend towards intensified environmental exploitation for developmental purposes over time.
During the periods 2005–2010 and 2015–2020, both Brazil’s GDP and Green GDP indices experienced declines. Specifically, in the first period, GDP and GGDP decreased by $1.292*105 trillion and $1.462*105 trillion, respectively, coinciding with an excessive utilization of forest resources. In the second period, GDP and GGDP declined by $69.2 billion and $78.3 billion, respectively, which correlated with the over-exploitation of water and forest resources. Figure 14 illustrates the contribution of each factor to the GGDP ratio, highlighting how resource use impacts GGDP.
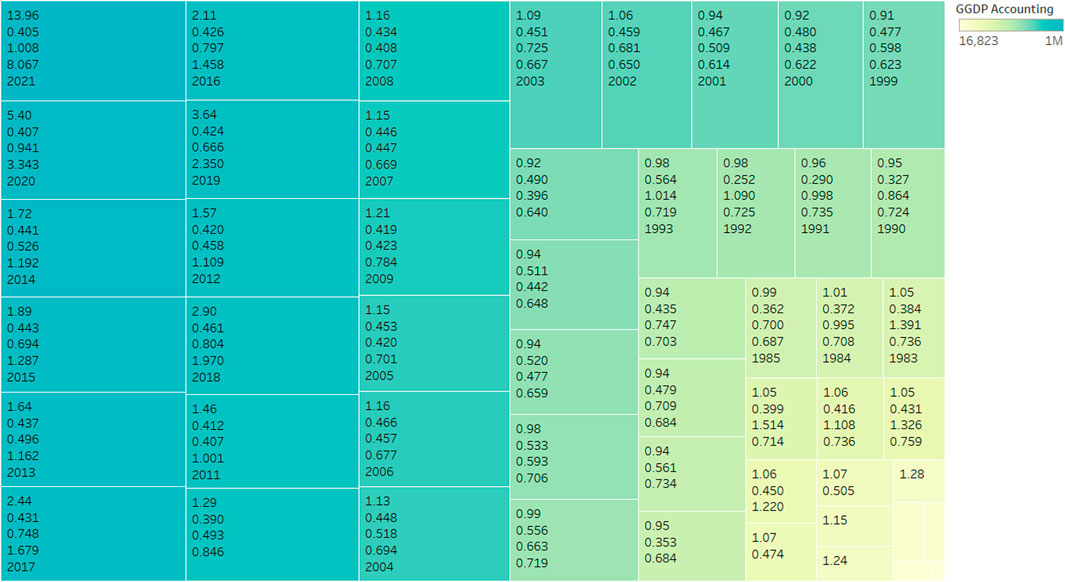
Figure 14. The contribution of each factor to the GGDP ratio.
Overall, the ratio of the monetary value of natural resources to GDP exhibited a slight increase, whereas the ratio of the monetary value of environmental resources to GDP remained relatively stable. Notably, the ratio of the monetary value of imported resources to GDP rose rapidly, surpassing the ratio of environmental resources after 2006. Figure 15 provides further detail on the contribution of each primary factor to GDP and the evolution of resource value, emphasizing the significant role of resources such as coal, crude oil, and plant foods in Brazil’s economic growth.
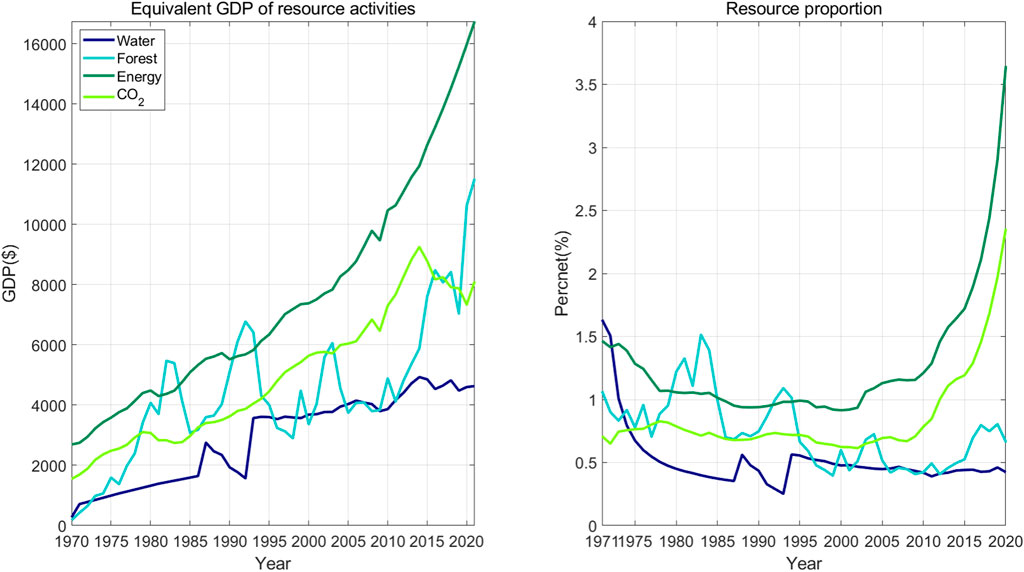
Figure 15. The contribution of each primary factor to GDP and the evolution of resource value.
These observations suggest that the decline in Brazil’s Green GDP index is closely linked to the consumption of imported resources. Additionally, it emphasizes the pivotal role that resources such as coal, crude oil, and plant foods play in Brazil’s economic growth, substantially influencing the nation’s lasting economic growth trajectory (Wallace, 2000; Xu et al., 2005).
The graph defines the 4 consider our version that may influence GDP: variants in water resources, woodland land area, power use and usage, and CO2 discharges. In time, it comes to be evident that carbon dioxide discharges and energy consumption exert the most considerable effect on GGDP growth, with a steady rise in consumption degrees.
Overall, Brazil’s energy efficiency has actually been on a decline, while the environmental tons proportion has actually been climbing, indicating installing ecological pressures resulting from the country’s economic growth. Simultaneously, the Power Sustainability Index (ESI) and the Improved Energy Sustainability Index (Improved ESI) have actually shown a decreasing trend from 1970 to 2020. These indices show a regular pattern, carefully lining up with the growth trend of energy performance (Xu et al., 2024).
Between 2010 and 2015, ESI worths were especially high, both going beyond 10, signifying inadequate total lasting advancement in Brazil during this period. Nonetheless, the ESI and Improved ESI values went down below 10 in 2013 and 2011, specifically, and further reduced to 3.848 and 2.225 by 2019. This suggests an enhancement in Brazil’s lasting growth methods and suggests a potential change in the direction of even more lasting advancement methodologies.
5.2 Findings and analysis
5.2.1 Soybean production:
As one of the globe’s leading producers and merchants of soybeans, Brazil’s financial growth is considerably bolstered by this industry. Nonetheless, the manufacturing of soybeans is a significant vehicle driver of deforestation, causing damaging ecological repercussions such as loss of biodiversity and increased greenhouse gas exhausts. Subsequently, mitigating carbon dioxide emissions is essential for fostering GDP development. For Brazil to efficiently take on the GGDP structure, it needs to lower its dependence on unsustainable farming practices, such as monoculture, and transition to even more lasting agricultural techniques that secure and restore all-natural ecosystems.
5.2.2 Amazon rainforest
Brazil nurtures a substantial part of the Amazon rainforest, which supplies necessary community services, including carbon sequestration, water policy, and biodiversity preservation. The deterioration of this jungle positions lasting dangers to the nation’s economic wellness and overall wellness (United Nations Statistics Division, 2010). To execute the Inclusive Wealth Index (IWI), Brazil has to focus on the conservation and repair of all-natural communities, especially the Amazon rainforest, and invest in sustainable land-use techniques that enhance the country’s natural funding.
5.2.3 Energy sustainability indices
The Energy Sustainability Index (ESI) and the Improved Energy Sustainability Index (Improved ESI) have shown a continuous decline, reaching values of 3.848 and 2.225, respectively, by 2019. Figure 16 illustrates these trends, highlighting the significant drop in these indices over time. These indices, which integrate financial and eco-friendly sustainable development research, underscore the immediate demand for Brazil to boost its sustainable development practices. Enhancing these practices is crucial for aligning economic growth with environmental preservation, ensuring long-term sustainability.
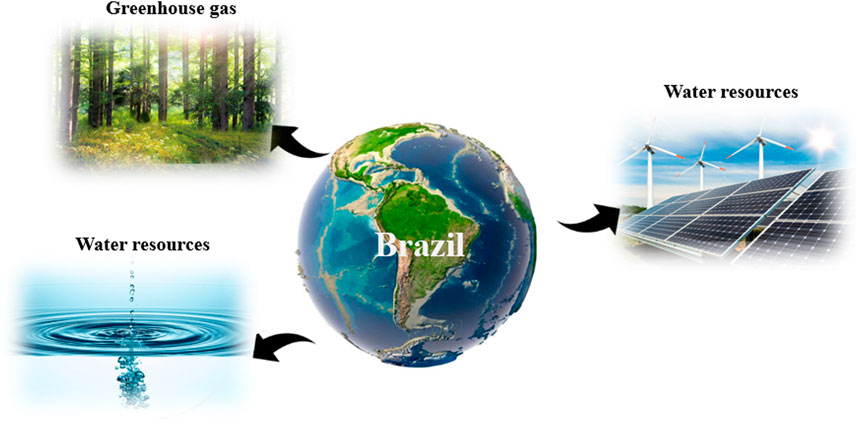
Figure 16. The main types of natural resources that affect the GGDP of Brazil.
Must Brazil take on the GGDP index as the major step of financial wellness, it will demand a change in economic policies in the direction of more sustainable advancement methods, emphasizing the conservation and repair of natural environments. Although this transition may demand substantial short-term investments, it holds the potential for fostering more sustainable and resilient economic growth in the long term, yielding benefits for both current and future generations.
6 Conclusion
Over the past 50 years, there has been a 74% probability that the growth rate of Green GDP (GGDP) is positively correlated with temperature change. Utilizing the GGDP calculation model, we can analyze the development patterns and discrepancies between global GDP and green GDP, as well as examine the relationship between ecological efficiency, GGDP, and global average temperature. Although both green GDP and total GDP have shown continuous growth, the growth rate of green GDP is markedly slower, with its proportion decreasing from 90% in the 1970s to 80% in 2020. This decline highlights that an economic development model heavily reliant on natural resources has exacerbated the gap. Projected future CO2 emissions are expected to increase annually, aligning with the trends of global warming and the expanding gap between GGDP and GDP. Hence, reducing excessive carbon dioxide emissions is crucial to mitigating global warming. The model we have developed aids in decision-making by allowing the control of parameters and variables to predict outcomes under different scenarios across various countries, demonstrating its wide applicability. Furthermore, by analyzing and modeling historical data, we can forecast future trends and developmental directions. This analysis underscores the profound benefits of GGDP for both individual countries and the global community, showcasing its potential as a valuable tool in promoting sustainable economic growth and environmental stewardship.
Data availability statement
The raw data supporting the conclusions of this article will be made available by the authors, without undue reservation.
Author contributions
XZ: Funding acquisition, Investigation, Project administration, Resources, Software, Supervision, Writing–original draft. YC: Conceptualization, Data curation, Formal Analysis, Methodology, Validation, Visualization, Writing–review and editing.
Funding
The author(s) declare that no financial support was received for the research, authorship, and/or publication of this article.
Conflict of interest
The authors declare that the research was conducted in the absence of any commercial or financial relationships that could be construed as a potential conflict of interest.
Publisher’s note
All claims expressed in this article are solely those of the authors and do not necessarily represent those of their affiliated organizations, or those of the publisher, the editors and the reviewers. Any product that may be evaluated in this article, or claim that may be made by its manufacturer, is not guaranteed or endorsed by the publisher.
References
Arrow, K., Bolin, B., Costanza, R., Dasgupta, P., Folke, C., Holling, C. S., et al. (1996). Economic growth, carrying capacity, and the environment. Environ. Dev. Econ. 1 (1), 104–110. doi:10.1017/s1355770x00000413
Costanza, R., and Daly, H. E. (1992). Natural capital and sustainable development. Conserv. Biol. 6 (1), 37–46. doi:10.1046/j.1523-1739.1992.610037.x
Costanza, R., D’arge, R., De Groot, R., Farber, S., Grasso, M., Hannon, B., et al. (1997). The value of the world’s ecosystem services and natural capital. Nature 387 (6630), 253–260. doi:10.1038/387253a0
Dawson, G., and Graham, J. (2007). The economics of climate change: the stern review, Economic Issues. Institute of Economic Affairs.
Deng, J. (2002). Grey prediction and grey decision. Wuhan: Huazhong University of Science and Technology Press.
Field, C. B., Barros, V. R., Mach, K. J., and Mastrandrea, M. D. (Eds.). (2014). Climate change 2014: Impacts, Adaptation, and Vulnerability. Part A: Global and Sectoral Aspects. Contribution of Working Group II to the Fifth Assessment Report of the Intergovernmental Panel on Climate Change. Cambridge University Press. doi:10.1017/CBO9781107415379
Hamilton, K., and Clemens, M. (1999). Genuine savings rates in developing countries. World Bank Econ. Rev. 13 (2), 333–356. doi:10.1093/wber/13.2.333
Kureski, R., Moreira, V. R., and Veiga, C. P. D. (2020). Agribusiness participation in the economic structure of a Brazilian region: analysis of GDP and indirect taxes. Rev. Econ. Sociol. Rural 58. doi:10.1590/1806-9479.2020.207669
Lan, S., Pei, Q., and Hong-fang, L. U. (2002). Eco-economic system emergy analysis. Beijing. Chemical Industry Press.
Lenaerts, K., and Tagliapietra, S. (2022). The global quest for green growth: an economic policy perspective. Sustainability 14 (9), 5555.
Li, K., and Lin, B. (2017). Economic growth model, structural transformation, and green productivity in China. Appl. Energy 187, 489–500.
National Accounts - Analysis of Main Aggregates (2024). Methodology for data estimation. Available at: https://unstats.un.org/unsd/snaama/Introduction.asp.
Neumayer, E. (2003). Weak versus strong sustainability: exploring the limits of two opposing paradigms. Weak versus strong sustainability: exploring the limits of two opposing paradigms.
Nordhaus, W. D. (2006). The “stern review” on the economics of climate change. National Bureau of Economic Research Working Paper Series, 12741.
Pearce, D. W., and Turner, R. K. (1991). Economics of natural resources and the environment. Am. J. Agric. Econ. 73 (1), 122–129. doi:10.2307/1242904
Rockström, J., Steffen, W., Noone, K., Persson, Å., Chapin, F. S., Lambin, E. F., et al. (2009). A safe operating space for humanity. Nature 461 (7263), 472–475. doi:10.1038/461472a
Stiglitz, J. E., Sen, A. K., and Fitoussi, J.-P. (2009). Report by the commission on the measurement of economic performance and social progress.
United Nations Statistics Division (2007). CO2 emissions in 2007. Available at: https://unstats.un.org/unsd/environment/air_co2_emissions.htm.
United Nations Statistics Division (2010). Forest area. Available at: https://unstats.un.org/unsd/environment/forestarea.htm.
Wallace, J. S. (2000). Increasing agricultural water use efficiency to meet future food production. Agric. Ecosyst. and Environ. 82 (1), 105–119. doi:10.1016/s0167-8809(00)00220-6
World Bank (2011). The changing Wealth of nations: measuring sustainable development in the new millennium. World Bank. Publ. 47 (2), 286–288. doi:10.1596/978-0-8213-8488-6
Xu, Y., Yu, Z., Liu, C., Hu, Y., Zhang, J., Liu, J., et al. (2024). Variability in soybean yield responses to elevated atmospheric CO2: insights from non-structural carbohydrate remobilisation during seed filling. Plant Physiology Biochem. 213, 108802. doi:10.1016/j.plaphy.2024.108802
Xu, Z., Zhang, G., and Wang, Y. (2005). Response of grassland ecosystem to climate change and CO2 concentration increase. Chin. J. Appl. Meteorology 16 (3), 11–19.
Keywords: GGDP, global temperature prediction model, sustainable development, environmental pollution loss, resource consumption
Citation: Zheng X and Chen Y (2024) A better strategy: using green GDP to measure economic health. Front. Environ. Sci. 12:1459764. doi: 10.3389/fenvs.2024.1459764
Received: 04 July 2024; Accepted: 19 August 2024;
Published: 12 September 2024.
Edited by:
Guoxiang Li, Nanjing Normal University, ChinaReviewed by:
Natavan Namazova, Azerbaijan Technical University, AzerbaijanYixin Dai, Nanjing University of Finance and Economics, China
Copyright © 2024 Zheng and Chen. This is an open-access article distributed under the terms of the Creative Commons Attribution License (CC BY). The use, distribution or reproduction in other forums is permitted, provided the original author(s) and the copyright owner(s) are credited and that the original publication in this journal is cited, in accordance with accepted academic practice. No use, distribution or reproduction is permitted which does not comply with these terms.
*Correspondence: Yuexin Chen, VFAwNzkyODJAbWFpbC5hcHUuZWR1Lm15
†These authors have contributed equally to this work and share first authorship