
94% of researchers rate our articles as excellent or good
Learn more about the work of our research integrity team to safeguard the quality of each article we publish.
Find out more
ORIGINAL RESEARCH article
Front. Environ. Sci. , 23 January 2025
Sec. Water and Wastewater Management
Volume 12 - 2024 | https://doi.org/10.3389/fenvs.2024.1458153
This article is part of the Research Topic Biological Contaminants of Concern in Water and Wastewater: An Environmental Health Perspective View all 15 articles
 Joshua A. Steele1*
 Adriana González-Fernández1
 John F. Griffith1*Darcy Ebentier McCargar2†Sierra Wallace2†
 Kenneth C. Schiff1
Inflow and infiltration are well-known issues for sanitary sewer collection systems, but exfiltration is understudied and rarely empirically quantified. The goal of this study is to estimate the potential human fecal contribution from wastewater exfiltration from sanitary sewers to stormwater in an urban watershed with separate sanitary sewer and storm sewer systems. This study uses newly developed techniques to empirically measure sanitary sewage exfiltration, then compares these exfiltration rates to human fecal pollutant loading in stormwater runoff from multiple urban catchments without other sources of human inputs (i.e., no septic systems, no homeless encampments, no reported sanitary sewer overflows) to estimate the amount of exfiltrated sewage that reaches stormwater. The human-specific genetic marker HF183, which is highly concentrated in raw sewage, was used as a surrogate for human fecal pollution and was measured in nearly every stormwater sample collected. We extrapolated measured exfiltration to the entire 419 km2 watershed and estimated up to 4.25 × 10⁶ L exfiltrate each day. This is 0.6% of the average daily volume of sewage treated in this sewer collection system and is similar in scale to exfiltration allowed by design standards. Based on ratios of exfiltration loading predictions vs. stormwater loading measurements, the proportion of exfiltrated human fecal load that is estimated to be transported via subsurface pathways (i.e., the subsurface transfer coefficient, STC) to stormwater in the studied catchments is 8.27 × 10⁻⁵ (95% CI: 6.30 × 10⁻⁵ to 1.37 × 10⁻⁴). Human fecal pollution loads from exfiltration via subsurface transfer during a storm event were calculated to be 1.5 × 10¹³ (95% CI: 1.79 × 10¹² to 3.59 × 10¹³) HF183 gene copies per storm. This estimate is similar in scale to the measured mass loading estimates in stormwater for the studied watershed and comparable to independently-measured tracers of sewage. Future work is needed to better understand subsurface transport mechanisms of exfiltrated sewage and to test this approach, and the assumptions used, in other watersheds and sewer systems.
Urban sanitary sewer collection systems have well-characterized issues with inflow and infiltration, particularly during wet weather (Beheshti et al., 2015; Crawford et al., 1999). Infiltration has been estimated to increase wastewater collection system flows by as much as 35% (Staufer et al., 2012; Karpf et al., 2011). Because of the large costs associated with treating non-sewage flows, management programs to upgrade sewer collection systems and private laterals to prevent infiltration and inflow are seen worldwide. In contrast, exfiltration, which typically has smaller volumes, has received less attention.
If urban stormwater can infiltrate urban sanitary sewer collection systems, then a reasonable question would be whether raw sewage could exfiltrate urban collection systems, especially when it is not raining and water tables are low. Researchers have demonstrated that exfiltration occurs regularly in sewer systems throughout the world using a variety of approaches to attempt to quantify exfiltration rates (see Rutsch et al., 2008; Nguyen et al., 2021 for reviews) and the subsequent impacts on shallow groundwater or nearby surface waters (Ellis et al., 2004; Lee et al., 2015, Roehrdanz et al., 2017). For example, Sercu et al. (2009), (2011) demonstrated the occurrence of sewage exfiltration, and that the subsequent inflow to nearby storm drains impacted microbial water quality of nearby creeks and beaches. Delesantro et al. (2022) identified urban sanitary sewer exfiltration as the likely cause of increased nutrient loading to streams. Nguyen and Venohr (2021) used modeled nutrient pollution in urban surface waters and estimated that sewage exfiltration could account for a substantial proportion of nitrate and phosphate loads. Delesantro et al. (2024) showed subsurface storm flows and baseflows mobilized multiple sources of nutrient loading to streams areas of moderate development intensity.
Exfiltration and subsequent transport to surface waters requires multiple steps and is dependent on a variety of factors. First, sewage volume and any associated contaminants must exit the subsurface pipe. The factors that control this exfiltration include the frequency and magnitude of pipe defects, size of the pipe, pipe material of construction including joint materials, quality of construction including backfill material, soil type, in-pipe flow rates, and groundwater height (Selvakumar et al., 2010). Second is subsurface transport of the exfiltrated sewage and associated pollutants, which is controlled by shallow groundwater movement, soil type, and proximity to storm drainage systems or surface waters (Selvakumar et al., 2010, Roehrdanz et al., 2017).
In spite of numerous advancements, researchers continue to encounter challenges bridging the gap between small-scale pipe measurements of exfiltration and extrapolation to watershed (or larger) scale (e.g., Nguyen et al., 2021). Small scale pipe measurements are most frequently made ex situ in the laboratory with the advantage of full control over the variables that could affect exfiltration (e.g., Vollertson and Hvitved-Jacobsen, 2003; Nguyen et al., 2021; Nguyen and Venohr, 2021). Subsequently, many researchers have relied on modeling techniques to scale up these small scale measurements to watershed or larger scales, even extending to national levels (Karpf and Krebs, 2005; Held et al., 2006). However, as demonstrated by Wolf et al. (2006), discrepancies in exfiltration rates arise between small scale estimates, large scale models, and empirical data, presenting a persistent challenge in accurately extrapolating exfiltration dynamics. At the watershed scale, researchers mapping buried streams and sewer infrastructure using a high spatial resolution GIS model found sewer stream interactions were common and up to 70% of streams within a city were at risk of sewer leakage, but did not directly measure exfiltration (Hopkins and Bain, 2018). Researchers recently have made progress bridging these gaps between modeling efforts and in situ groundwater measurements using a GIS based model to predict areas of sewage exfiltration across a city and then demonstrating that this was a source of microbial and chemical pollution to the shallow groundwater (Lee et al., 2015, Roehrdanz et al., 2017).
Within a watershed, if sewage exfiltrates from a given pipe, this phenomenon could potentially act as a mechanism for surface water pollution in semi-arid urban systems where groundwater tables are low and sanitary sewer and storm drainage systems are typically separate. Sanitary sewer exfiltration could allow for the build-up of sewage in areas outside of the sewer pipe, which would then be mobilized in subsequent storm events and transported to storm drainage systems or other surface waters. This is illustrated in the diagram showing the multiple points of exfiltration that can build up to be mobilized when subsurface flow increases during rainstorms (Figure 1). Selvakumar et al. (2010) identified that the southwestern United States could be especially prone to this scenario where most urban sanitary sewer systems are above groundwater tables. This would be consistent with the widespread presence of human fecal markers in arid urban watersheds (Noble et al., 2003) regardless of land use or storm characteristics (Tiefenthaler et al., 2011).
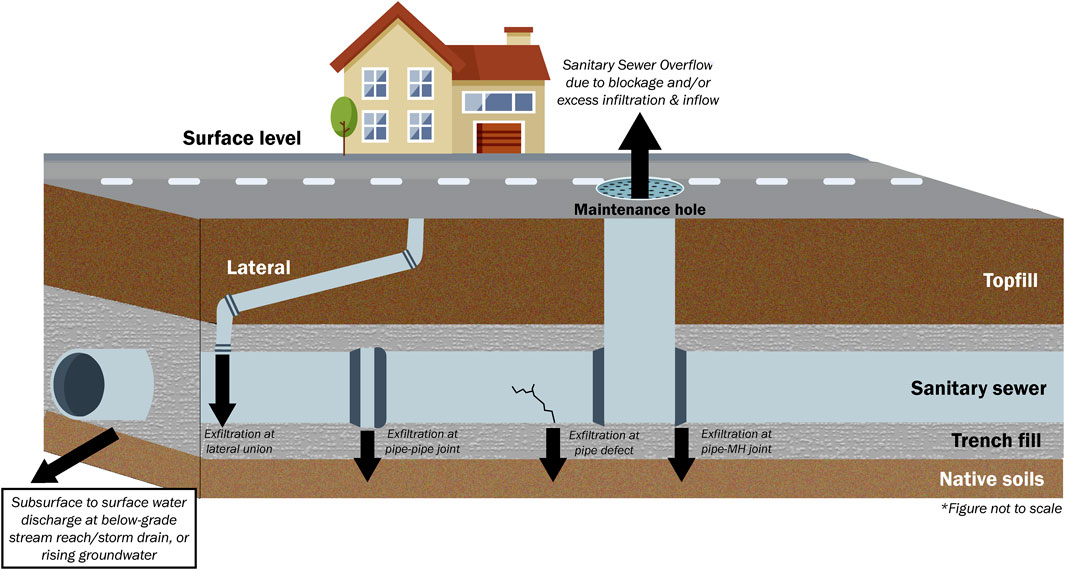
Figure 1. Diagram showing the basic concept of sewage exfiltration in this study. There are multiple examples of locations in sewer lines where sewage can exfiltrate. The exfiltrated sewage would accumulate in the soils prior to being transported to surface waters or storm drains by subsurface flow during rain or due to rising groundwater. See Nguyen et al., 2021 or Delesantro et al., 2024 for diagrams showing potential transport pathways to groundwater, storm drains, rivers, or creeks.
The goal of this study is to estimate the potential human fecal contribution from wastewater exfiltration from sanitary sewers to stormwater in a semi-arid urban watershed with separate sanitary sewer and storm sewer systems. Our objective is to extrapolate localized in situ measurements of wastewater exfiltration to the watershed scale and to place it in the context of estimates of total fecal pollution mass loading in the watershed, specifically on its contribution to stormwater contamination. We utilize the human-specific genetic marker Bacteroides HF183 as a surrogate for human fecal pollution (Boehm et al., 2013). We focus on wet weather, as previous studies have consistently shown widespread prevalence of human fecal markers during such periods (Steele et al., 2018, Sauer et al., 2011).
This project had four integrated study design elements to link exfiltration from sanitary sewers to watershed-scale estimates of human fecal loading in stormwater runoff: (1) empirically measure exfiltration in situ to quantify volume loss, (2) estimate the HF183 mass loading from exfiltration volume loss, (3) empirically measure HF183 in stormwater runoff from small urban catchments to estimate subsurface transfer rates, (4) extrapolate human fecal pollutant loads from predicted exfiltration and subsurface transfer rates to the entire watershed.
This study was conducted in the 419 km2 lower San Diego River Watershed (SDR) (Figure 2). Roughly 72% of the lower watershed is urbanized with the major land use being single family or multi-family residential. This waterbody is subject to a Total Maximum Daily Load (TMDL) based on exceedances of fecal indicator bacteria water quality standards (RWQCB 2010).
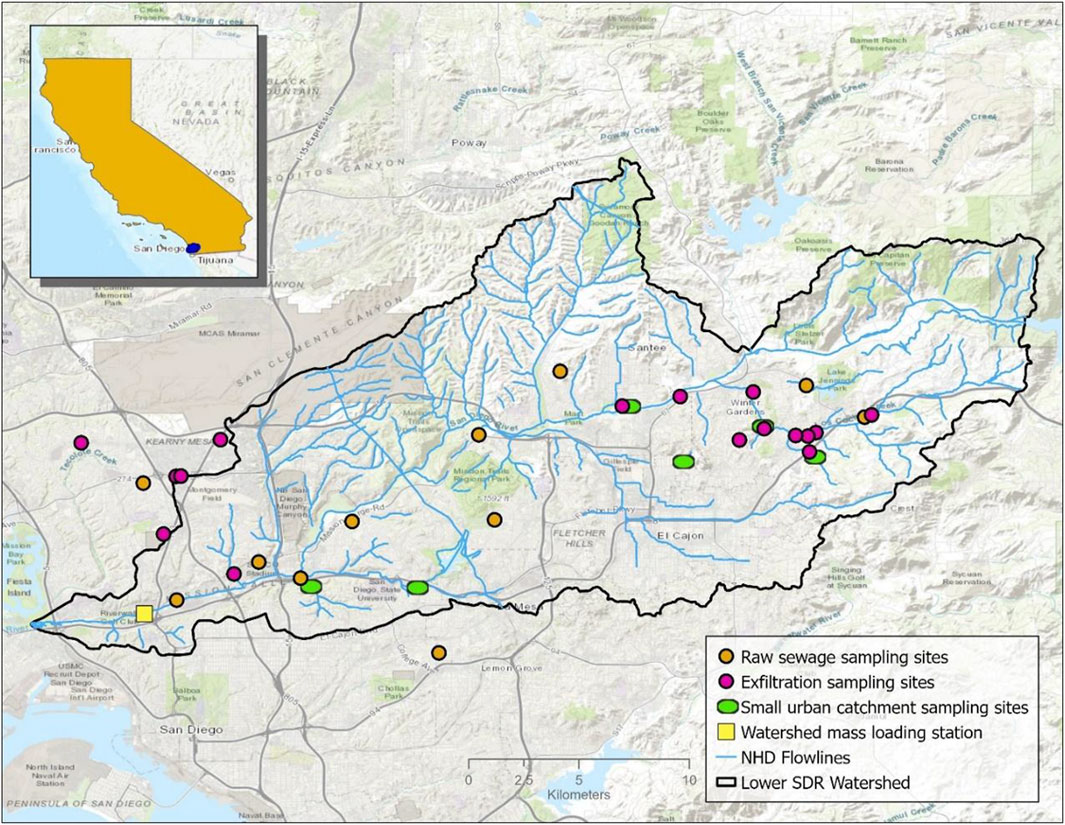
Figure 2. Map of the San Diego River watershed, including locations of raw sewage, exfiltration, and small urban catchment sampling.
There are 1736 km of public sanitary sewer gravity lines servicing this watershed and conveys an average of 665 million liters of sewage per day. The most common sewer line diameter (70.4%) is 203.2 mm (i.e. 8 inches) with 90.9% between 152.8 and 304.8 mm (6–12inches; SanDAG Regional Data Warehouse). Approximately 138,510 developed parcels of which 94.2% are connected to the public sanitary sewer system via (mostly private) laterals. The remaining 5.8% of parcels utilize onsite wastewater treatment systems (OWTS or septic systems) and are isolated in the upper reaches of the watershed. There is no recycled water distribution system in this watershed.
Thirty year average annual rainfall in the watershed ranges from 26.2 cm near the coast to 27.7 cm inland. Most of this rainfall occurs between October and April, with the greatest precipitation occurring in February and March. Flows at the USGS (United States Geological Survey) gaging station at Fashion Valley (station 11023000, https://waterdata.usgs.gov/monitoring-location/11023000)– the most downstream on the SDR (river km 10) - can increase from <0.03 m3s−1 to >300 m3s−1 in less than a day when storms occur. There are no major dams in this section of the SDR.
The empirical measurements of exfiltration are described in Griffith et al. (2024). Briefly, this method simulates typical in-pipe flows for collector pipes roughly 8- to 10-inches inside diameter. After isolating a section of sewer pipe utilizing inflatable or mechanical plugs and employing a sewer diversion, potable water is introduced at a constant flow rate in the upstream maintenance hole until the pipe is approximately one-third full and then the volume is recovered at the downstream maintenance hole using vacuum pumps. Sodium hypochlorite solution is added during the priming run and then the water is dechlorinated utilizing sodium thiosulfate prior to test runs. The volume is measured prior to starting the experiment and then measured at the end of experiment. Volume loss is the difference between the volume at the beginning and end of the experiment. Flow meters are used to ensure the pipe is never surcharged or pressurized, and video cameras or fluorescent dye is used to ensure the plugs do not leak. This experiment is repeated six times at each site achieving a measurement sensitivity of approximately 1 L (0.25 gallons) volume loss. Typically, 4,200 L (ca. 1,100 gallons) are used during each experimental run, which takes 0.75–1 h. Pipes of various materials (e.g., clay, polyvinyl chloride (PVC), lined pipe, i.e., cured in place pipe (CIPP) and RIBLOC) and ages (<1 year to 75 years) were tested.
There were six small urban catchments sampled for this portion of the study (Figure 1, See Supplementary Material for catchment characteristics and sampling inventory). Catchment areas were approximated using a combination of desktop delineation based on previous drainage area delineations, desktop delineations, and field verification. Some small catchments are co-located or upstream of major MS4 outfalls with existing drainage area delineations. Where existing delineations were available, these were leveraged (SanDAG regional data warehouse). Counts of parcels were approximated by superimposing catchment area over parcel maps. Where partial parcels overlapped with the catchment boundaries, they were included if more than 50% of the parcel was inside the boundary.
Each catchment consisted of almost entirely single- or multi-family residential land uses and had no other known sources of human fecal contamination present other than sanitary sewer exfiltration or private lateral exfiltration (Supplementary Tables SI1, SI2 Each catchment was between 3.6 and 31.2 ha (9 and 77 acres) with between 23 and 324 property parcels. The age of homes ranged from 20 to 70 years old and public sanitary sewer pipes were made of vitreous clay (VC) or PVC or plastic. Land use within the catchments was primarily low to medium intensity developed land with except for SDR-203A which was primarily scrubland (Supplementary Table SI2). Each catchment was sampled between 2 and 4 storm events totaling 19 site-events over the two-year sampling campaign.
Sampling consisted of locations where flow could be rated and measured using a combination of weirs, flumes, pressure transducers and/or area-velocity meters. Flow was measured using stage-discharge relationships, stage-velocity measurements, or both. Stage measurements were made using either a Sigma 950 Submerged AV sensor bubbler (Hach, Loveland, CO) or Onset HOBO level logger pressure transducer (Onset Computer Co., Bourne, MA). Velocity measurements were made using a Hach acoustic Doppler sensor (Hach, Loveland, CO). To provide calibration checks for continuous flow estimates, instantaneous flow estimates were collected manually at multiple points throughout storm events, to the extent feasible. Instantaneous flow was estimated using the area velocity method; stage was estimated using visual observations and/or staff gauge measurements, and velocity measurements were collected using a handheld Marsh McBirney meter. Field sampling consisted of 10 L flow-weighted samples collected from 15 min subsamples for 6 h or until flow ceased. 6 h conforms with holding time criteria for fecal indicator bacteria analysis. If storm flows lasted longer than 6 h, then a second six-hour flow-weighted composite was collected. Samples were collected using Teflon tubing connected to a peristaltic pump. All parts that touched the sample were pre-cleaned prior to field deployment and equipment blanks were collected. Field blanks were collected during every storm. Additionally, precipitation data were collected at 1-min intervals from the County of San Diego ALERT gauge network (https://www.sdcfcd.org/content/sdc/sdcfcd/data.html) during each monitored storm event.
Raw sewage was collected in sanitary sewer pipes at 30 sites in the City of San Diego and the County of San Diego as described in Schiff et al. (2024) (2024, Appendix D) and Steele et al., in review. Briefly, pipes were accessed via sewer maintenance holes, sterilized PVC plastic tubing (Nalgene, United States) attached to a support pole and connected to a peristaltic pump (Masterflex I/P, Avantor, United States) was used to collect the sewage into sterile, rinsed polypropylene bottles, stored on ice in the dark, and transported to the laboratory for processing.
All samples collected during small catchment sampling and sewage sampling were analyzed for HF183 and biofilm microbial communities. Once delivered to the laboratory, 100 mL portions of the well-mixed water samples were filtered through 0.4-micron polycarbonate membranes to collect bacteria, then flash frozen in liquid nitrogen and stored at −80°C prior to DNA extraction.
Frozen filters were processed in batches using commercially available DNA extraction kits (PowerSoil Pro Kit, Qiagen, MD, United States). DNA extraction followed the methods developed by Cao et al. (2017), Steele et al. (2018) and Steele et al., in review. Briefly, frozen filters were placed into sterile 2 mL plastic tubes preloaded with glass beads. A lysis buffer was added and the tubes were placed on an Omni BeadRuptor 24 (Omni International, GA, United States) at maximum speed for 2 min. The extraction then proceeded according to the manufacturer’s instructions. DNA was eluted from the spin column in 100 μL of elution buffer. Aliquots of eluted sample DNA were stored at −80°C until they were analyzed by droplet digital PCR.
Negative extraction controls (NECs) containing only a lysis buffer in addition to a lysis buffer and control DNA (e.g., halophile or salmon testes DNA) were processed for every extraction in the same manner as the samples. These served to check for contamination from the laboratory or from other samples during the extraction of bacterial DNA from stormwater filters.
Human-associated Bacteroidales (HF183) were measured via the use of a droplet digital PCR assay following previously published protocols (Cao et al., 2017; Steele et al., 2018). Samples were measured in replicate, using at least 20,000 droplets for an absolute quantification of HF183. Field and equipment blanks were 100% nondetectable for HF183. Filtration controls were also 100% nondetectable.
This study employs a set of calculations to extrapolate measured exfiltration rates from sewer pipes to a watershed-wide estimate of human fecal contamination from sewage exfiltration from an urban sewer system. Through empirical measurements of volume loss from the sanitary sewer pipe and HF183 concentrations measured in raw sewage across the watershed from a previous study (Steele et al., in review), we determined the mass of HF183 exiting the pipe alongside volume loss, as described in Equations 1, 2.
Volume loss per day was calculated according to Equation 1:
where:
Vd = Daily volume loss from exfiltration measured in situ (L/day)
Vl = Volume loss from exfiltration measured in situ (L/km-sec)
L = Length of pipe (km)
Fp = Proportion of the sewer system that is able to exfiltrate (estimated at 0.75)
td = Duration of time the sewer pipe is flowing each day (sec/day)
Note that Fp is an estimate based on expert judgement.
HF183 mass loading from exfiltration was calculated according to Equation 2:
where:
ME = Estimated mass of HF183 from sanitary sewer exfiltration (gene copies)
Vd = Volume loss from exfiltration measured in situ (L/day)
Ds = Days of accumulation prior to storm event
Ctot = Concentration of HF183 at time t (gene copies/L)
Acknowledging the continuous flow of sewage and limited survival HF183 outside the gut, we refined our loading estimates by integrating accumulation and die-off dynamics until reaching equilibrium. Informed by die-off rates identified through a literature review, we augmented the exponential decay model (first-order decay equation after Zimmer-Faust et al., 2017 who measured the decay of HF183 in sediments and soils, Equation 3), to accommodate concentration increase over time based on the decay rate constant over the specified period. The decay rate (k) was 0.6983 per day (with a reported range of 0.96 to 0.5 per day).
First-order decay equation:
where:
Ct = Concentration of HF183 at time t (gene copies per L)
C0 = Initial concentration of HF183 in sewage (gene copies per L)
k = Decay constant (per day)
t = Time point (days)
Implementation of this model was facilitated using R, allowing for iterative computation of the HF183 concentration for each day within a loop. Each iteration considers the previous day’s concentration and the accumulation rate determined by the decay rate constant according to Equation 4. HF183 concentration in exfiltrated sewage, considering both the decay rate in soils and accumulation over time was calculated according to Equation 4:
where:
Ct = Concentration of HF183 at time t (gene copies per L) Equation 3
C0 = Initial concentration of HF183 in sewage (gene copies per L)
k = Decay constant (per day)
t = Time point (days) from 1 to n (n = 6)
Sampling small urban catchments enabled the derivation of a subsurface transfer coefficient to estimate the fraction of exfiltrated HF183 mobilized into stormwater. This estimation relied on comparing HF183 loads from storm events to those from exfiltration. The formulas detailing these calculations are provided below in Equations 5, 6.
Average HF183 mass loading from small urban catchments was calculated according to Equation 5:
where:
MR = Flow—weighted, per storm mean mass of HF183 from small catchments (gene copies)
Fw = Flow-weighted mean HF183 concentration in stormwater (gene copies per L)
Vs = Storm volume (L)
N = Number of storms
Calculation of the subsurface transfer coefficient estimating the fraction of the exfiltrated HF183 load from pipes within the small catchments (Equation 2) that is mobilized into stormwater during storm events at small catchments (Equation 4) was calculated according to Equation 6:
Note that the STC is unitless as it is a ratio of HF183 mass estimated to reach the stormwater in the small catchments over the total HF183 mass calculated to be exfiltrated in the small catchments.
Combining these variables allowed us to extrapolate human fecal loading to the entire watershed, as outlined in Equation 7. This extrapolation enabled us to extend our findings beyond the sampled locations, providing a broader understanding of fecal contamination distribution and dynamics throughout the watershed.
Human fecal pollutant loads were extrapolated to the entire watershed utilizing Equation 7:
Mw = Mass of HF183 in watershed streams and rivers per storm (gene copies)
Vl = Volume loss from exfiltration measured in situ (L/km-sec)
L = Length of pipe section (km)
Fp = Proportion of the sewer system exfiltrating
td = Duration of time the sewer pipe is flowing each day (sec/day)
Ctot = Concentration of HF183 considering accumulation and decay over time (gene copies/L)
Ds = Days of accumulation prior to storm event (days)
STC = Subsurface transfer coefficient
The 95% CI for the human fecal pollutant load (Mw) was calculated using a pooled standard deviation taking the square root of the sum of the variance weighted by the sample size for each variable.
A sensitivity analysis was performed to gauge the influence of input variables on the mass loading estimate. Initially, a dataset was generated comprising randomly sampled combinations of input variables falling within predetermined ranges (Supplementary Table SI3). Subsequently, Spearman rank correlation coefficients were used to examine the relationships between the change in the HF183 mass loading estimate and the change in each input variable. A tornado diagram provided a visual representation of the mass loading estimate’s sensitivity to variations in each input variable. Furthermore, multiple linear regression analysis was conducted to ascertain the proportion of variance explained by each input variable.
Volume loss measured in situ from sanitary sewer pipes in the SDR watershed in a prior study (Griffith et al., 2024) was used for the loading calculations. Volume loss ranged from 9.18 × 10⁻³ to 1.25 × 10⁻¹ L per second per kilometer pipe length across 20 different pipe segments (Figure 3). There was no significant difference in volume loss between pipe materials or pipe age based on two-way ANOVA (p = 0.31 and p = 0.50, respectively). Therefore, we used an average volume loss across all 20 pipe segments of 3.78 × 10⁻² (SD = 2.70 × 10⁻²) L per second per kilometer for estimating exfiltration (Vl, Equation 1). Assuming all 1736 km of sewer pipe in the SDR watershed were exfiltrating every minute of every day, which is an obvious over-estimation, we estimate approximately 2.5 × 10³ L of volume loss per km per day (4.25 × 10⁶ L total when multiplied across all sewer pipes) from exfiltration in this watershed. We assume, based on expert opinion from sewer operators, that only a proportion (ca.75%) of the system would be able to exfiltrate because there is no flow in the pipe due to daily fluctuations in sewer use or because of infiltration (Vd, Equation 1).
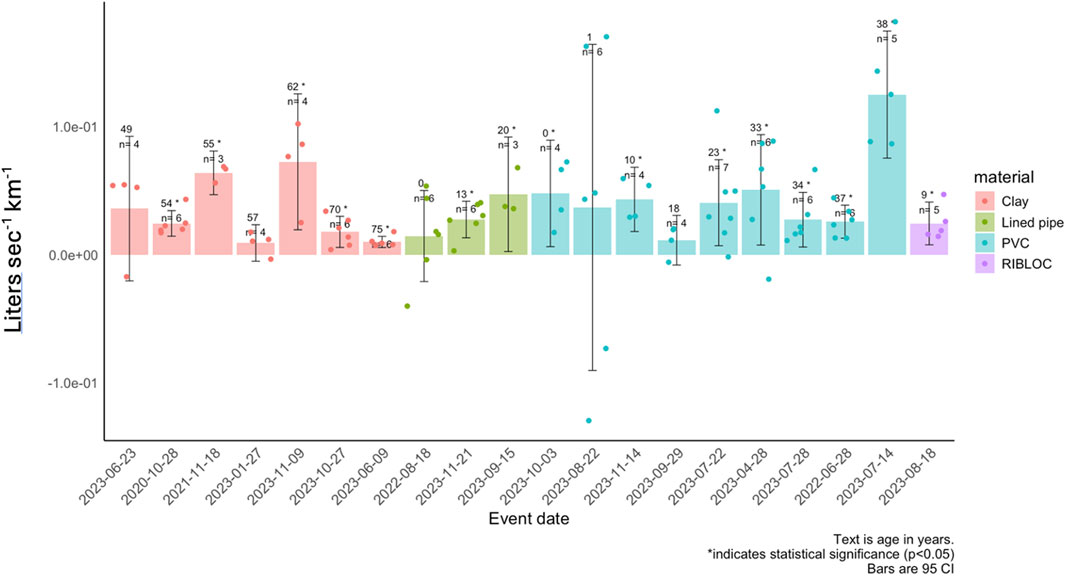
Figure 3. Measurements of volume loss per second per kilometer of sewer pipe in 20 different pipe segments of different pipe materials (lined pipe or cured in place pipe, RIBLOC or spiral wound lining, clay, or polyvinyl chloride or PVC). Bars represent average volume loss, dot symbols represent individual replicate measurements per segment, n = number of replicate measurements per pipe segment, number above bar is the age of the pipe segment in years since installation. Error bars are 95% confidence intervals. * indicates volume loss is significantly different from zero. Data from Griffith et al. (2024).
The HF183 concentrations in raw sewage ranged from 1.31 × 10⁶–3.25 × 10⁸ HF183 gene copies per 100 mL across the 30 sites sampled in the SDR watershed (Figure 4). This range of concentration includes multiple seasons, multiple years (2019–2021), multiple pipe materials (clay, PVC, and lined pipe), and multiple pipe ages (0.02–75 years). The geometric mean HF183 concentration in raw sewage used for calculating the mass of HF813 exfiltrating was 5.05 × 10⁷ (95% CI: 3.25 × 10⁷ to 7.85 × 10⁷) HF183 gene copies per 100 mL (C0, Equation 3).
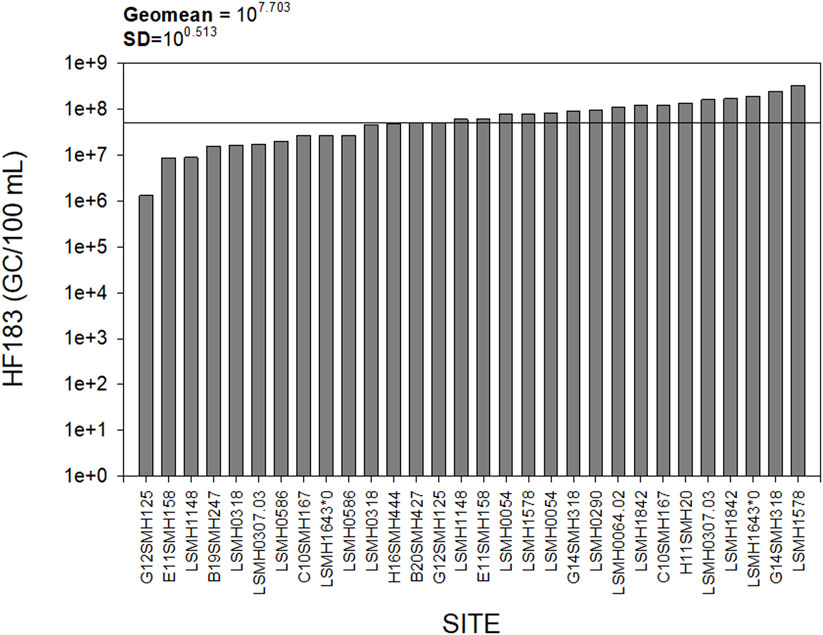
Figure 4. Concentration of HF183 gene copies/100 mL in raw sewage samples from the San Diego River watershed collected between 2019 and 2021. Data from Steele et al. (in review).
An estimated 2.86 × 10¹⁵ (SD = 1.08 × 10⁷) HF183 gene copies exfiltrate from the sanitary sewers in the SDR every day based on volume loss and raw sewage concentrations. Accounting for the proportion (ca. 25%) of the sewer system that is not able to exfiltrate, and decay of HF183 after 7 days of exfiltration, an estimated 1.80 × 10¹⁷ (SD = 2.56 × 10⁶) HF183 gene copies are available for sub-surface mobilization when rainstorms occur in the region (
The geometric mean of flow-weighted mean HF183 concentrations ranged from 1.06 × 10² to 1.05 × 10⁶ gene copies per liter across the six small urban catchments (Figure 5A). Results indicated this range of concentrations were not correlated to rainfall depth, intensity, or antecedent rainfall (data not shown). Site 0951 had the greatest flow-weighted mean concentration and site 1085 had the lowest flow-weighted mean concentration. At five site events (24%), HF183 concentrations were below the limit of quantification (estimated at 50 gene copies/100 mL). These low HF183 concentrations were not consistently found at one site, but occurred at four different catchments. Like HF183 concentrations, the geometric mean HF183 loading per storm event was variable among sites and storms in the small urban catchments (Figures 5B, C). The HF183 loading among catchments ranged from 9.01 × 10⁷ to 2.06 × 10¹¹ gene copies per storm event, with additional variability due to differences in flow and total runoff volume. The geometric mean HF183 loading across all catchments was 1.49 × 10⁹ gene copies per storm event (95%CI: 5.95 × 10⁸ to 2.29 × 10⁹).
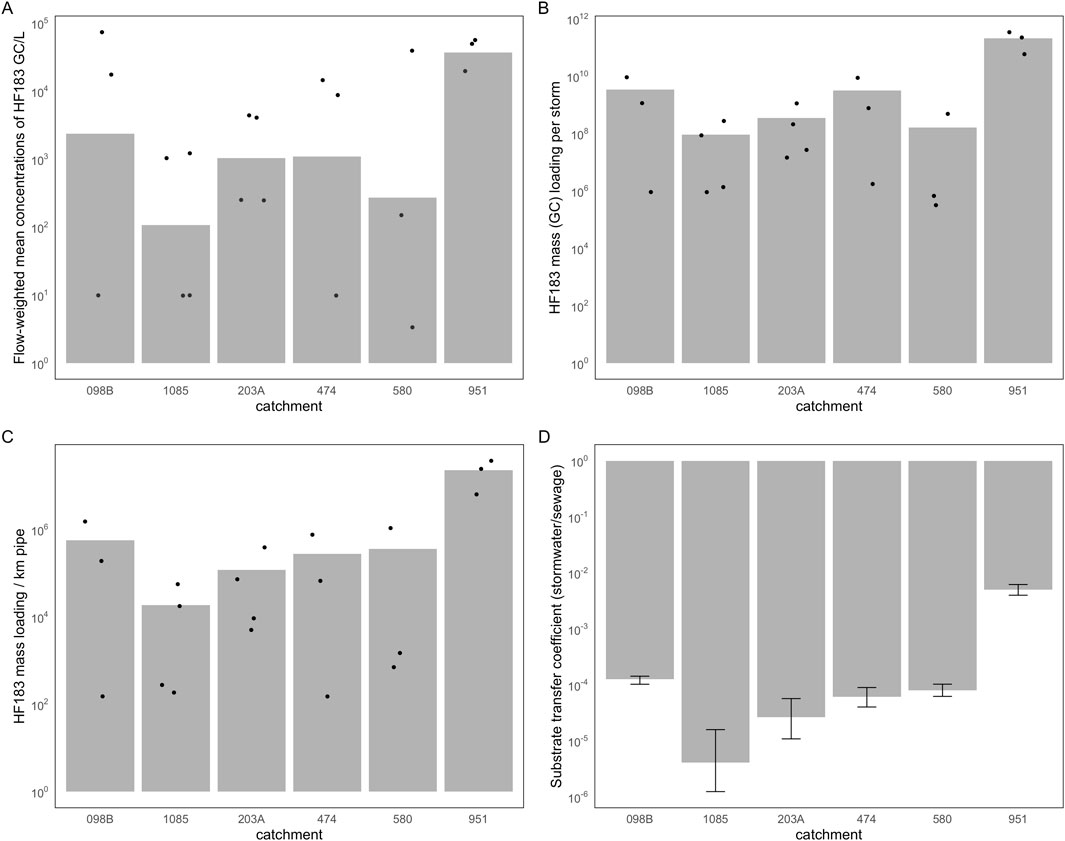
Figure 5. Results from small urban catchment site samples for (A) flow-weighted mean concentration per storm event, (B) HF183 mass loading per storm event, (C) HF183 mass loading per storm event normalized by the length of sewer pipe in each catchment, and (D) the calculated subsurface transfer coefficient per storm event. The subsurface transfer coefficients are calculated as the ratio of measured stormwater HF183 load per storm event to predicted HF183 load per storm event from sanitary sewer exfiltration within the catchment.
The geometric mean of the subsurface transfer coefficient (STC, Equation 6) across all six catchments was 8.27 × 10⁻⁵ (95% CI: 3.3 × 10⁻⁵ to 1.27 × 10⁻⁴) (Figure 5D). This key metric was comparable among four of the six catchments ranging from 4.08 × 10⁻⁶ to 7.90 × 10⁻⁵ per storm event. Two catchments (951 and 098B) had greater subsurface transfer coefficients at 4.98 × 10⁻³ and 1.26 × 10⁻⁴, respectively. The catchment above site 0951 had substantially greater HF183 concentrations, HF183 loading, and HF183 loading per km sewer pipe. We note that this catchment had the greatest number of parcels, was one of the older developments measured, and had a reported sewage spill within the last 10 years. The catchment above site 098B had the third highest number of parcels and had no reported sewage spills. These two catchments had the second most and third most km of sewer pipe (Supplementary Table SI1).
Based on the measured sanitary sewer exfiltration volume loss, the concentration of HF183 in raw sewage, the decay rate of HF183 in soils, and the subsurface transfer coefficient, we estimate 1.49 × 10¹³ gene copies per storm event (95% CI: 1.79 × 10¹² to 3.59 × 10¹³ gene copies per storm event) are discharged from the entire watershed. With an average of 10 storms annually, we estimate 1014 gene copies are discharged each wet season.
Sensitivity analysis indicated the most important factors controlling our estimates of human fecal loading from exfiltration was empirical measurements of volume loss and the subsurface transfer coefficient (Figure 6). These each accounted for the greatest proportion of the variation in the HF183 loading estimate: subsurface transfer coefficient accounted for 32% and volume loss accounted for 31% of the variance in the sensitivity analysis. After the subsurface transfer coefficient and volume loss variables, the next most important variable was the estimate of the proportion of sewer pipe miles that was not exfiltrating (i.e., were infiltrating or had no flow). The least sensitive variables were the HF183 concentration in raw sewage and the HF183 decay rate, which each accounted for <1% of the variability in our sensitivity analysis.
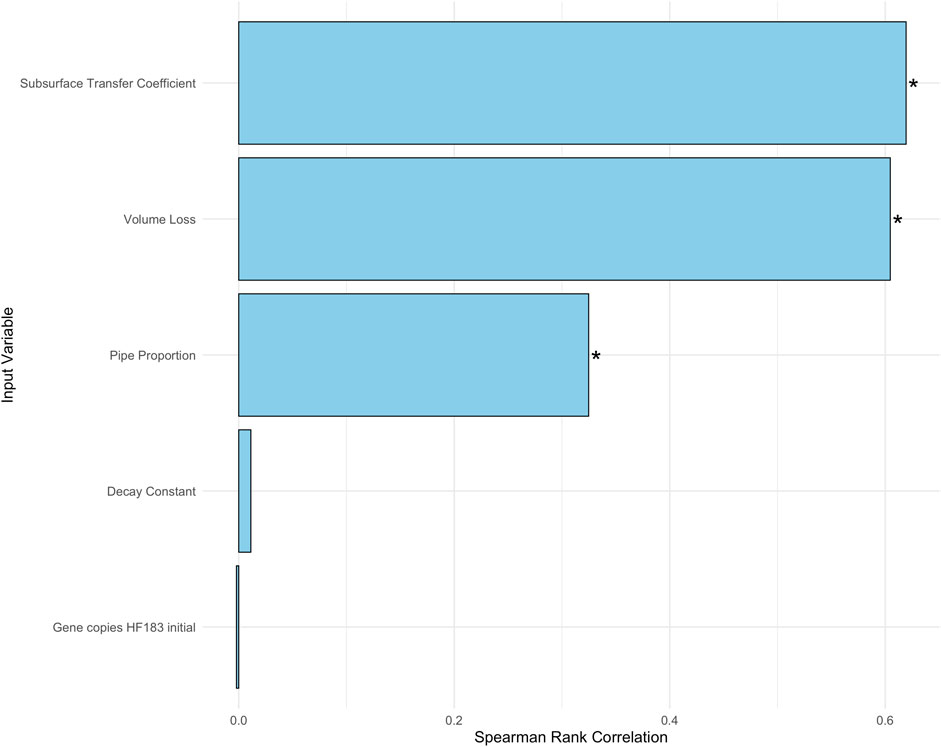
Figure 6. Tornado plot indicating the relative influence of the different variables used to estimate end of the watershed HF183 loading from sanitary sewer exfiltration. The greater the correlation, the greater the influence on the loading estimate. Asterisks denote that Spearman rank correlations are significant.
The estimate of 1013 HF183 gene copies per storm event aligns well with the estimate of HF183 mass loading at the end of the watershed. The mass loading at the end of the watershed was measured to be 1012–1015 HF183 gene copies per storm event across 25 site-events of various sizes, durations, and antecedent dry periods (Schiff et al., 2024).
This study successfully used empirical exfiltration rates and extrapolated the subsurface transport of exfiltrated sewage to stormwater runoff in a municipal separate storm sewer system at a watershed scale. The result was that exfiltration could possibly account for a substantial proportion of the human fecal pollution–as measured by the human genetic marker HF183 – in the San Diego River watershed during wet weather (Schiff et al., 2024). These results are substantiated by the presence of microbial community analysis of sanitary sewer biofilms (Steele et al. in review) which revealed a persistent but dilute sewer community signature in stormwater and chemical markers of sewage such as caffeine/sucralose ratios which were found to increase during storm events (Pinongcos et al., 2022).
Our estimates of HF183 mass loading from the SDR due to sanitary sewer exfiltration and subsurface transport were within the range of estimated mass loading in stormwater at the bottom of the watershed. However, sanitary sewer exfiltration is one of multiple potential sources of HF183 during wet weather. A comparable level of HF183 loading during wet weather is estimated from sanitary sewer overflows (Zimmer-Faust et al., 2021). The sanitary sewer overflow data are based on reported overflows that purportedly reached receiving waters (https://www.waterboards.ca.gov/water_issues/programs/sso/sso_map/sso_priv.html https://www.waterboards.ca.gov/water_issues/programs/sso/sso_map/sso_pub.html). Delesantro et al. (2024) also found that in highly developed areas there was substantial contribution of wastewater derived nitrogen from both surface and subsurface flows. Another potential source of human fecal pollution in the SDR is people experiencing homelessness, a widespread phenomenon along the river corridor. However, studies of HF183 loading during storm events from defecation by people experiencing homelessness are estimated to be at least one to two orders of magnitude lower than what is estimated via exfiltration (Hinds et al., 2024).
There are many potential sources of error in the estimation of human fecal loading from exfiltration. Our sensitivity analysis examined the influence of uncertainty in the measured exfiltration rate. Sources of uncertainty included the exfiltration volume loss, concentration of HF183 in raw sewage, the decay rate of HF183 after exiting the sewer pipe in the subsurface zone, the subsurface transport coefficient, and the proportion of the sewer system (a that is exfiltrating. Of these, exfiltration volume loss had the greatest impact on HF183 loading. Intuitively, even small changes in volume loss when extrapolated to hundreds of miles of sewer collection system will greatly influence mass loading calculations. As noted in Griffith et al. (2024) the use of potable water, may have resulted in an increased measured rate of exfiltration compared to what may have been observed using sewage. However, the presence of sewage material and colmation layer in pipes for the in situ empirical measurements of exfiltration likely attenuated this difference. The accuracy of exfiltration rates should be refined as this new measurement technology is implemented more broadly (Griffith et al., 2024), but the exfiltration rates measured during this study (3.78 × 10⁻² L per s-km) were within the range of exfiltration rates empirically measured by other researchers and estimated from modeled leakage rates (10−9–10 L per s-km) (Nguyen et al., 2021). This rate also corresponds to a rate of 2.5 × 10³ L of volume loss per km per day, similar to the ASTM standard for hydrostatic testing of vitrified clay pipes 3.76 × 10³ L volume loss per km per day (for 203.2 mm diameter pipes; ASTM C1901-03a, 2022). Application of this approach to estimating watershed-wide exfiltration outside of the original study area will necessarily be subject to the uncertainties inherent to the location and the method for measuring or estimating exfiltration.
The proportion of pipe exfiltrating had the third greatest impact on the sensitivity analysis. This is notable because it was a value that was primarily based on expert opinion of the sewer treatment plant operators. It was assumed that a substantial portion of the sewer pipes would not be flowing for 6 h a day or were not able to exfiltrate due to external circumstances. There is also support for 75% of the system being able to exfiltrate in the literature (e.g., Ellis et al., 2004). Detailed flow measurements or modeling in the collection system could refine this number to ground-truth this assumption.
A noteworthy case study from the exfiltration measurements is that CIPP lining of pipes with known defects can reduce or stop exfiltration. Our study measured statistically significant volume loss in a 54-year old clay pipe. This section of pipe was subsequently lined using CIPP technology. Re-testing of the newly lined pipe resulted in no statistically significant volume loss. We assume but are not certain that the volume loss we did measure in other CIPP lined pipes, which were between 13–20 years old, resulted from either improper installation, subsequent defects, material deterioration with age, or perhaps losses in the non-lined portions of the test segment (i.e., at the pipe maintenance hole junctions).
Exfiltration in other studies indicate that subsurface contributions from the sanitary sewer system regularly occur. Ellis et al. (2004) estimated that 75% of the sanitary sewer system in small Prague catchments experienced exfiltration. Roehrdanz et al. (2017) found increased levels of the artificial sweetener acesulfame, tryptophan-like fluorescent dissolved organic matter, nitrate, and a stable isotope of water (δ18O) – which are all indicators of raw sewage–in shallow groundwater from a small urban community in California. Delesantro et al. (2022) demonstrated that the hydrogeomorphic position of sewer pipes was a primary contributor to catchment wastewater derived nitrogen loading and that nitrogen loading was more sensitive to flow when pipes were in wet areas of the landscape, suggesting that subsurface flow paths and groundwater table depth drives loading from pipes to streams. Moreover, the strength of the association between exfiltration probability and indicators of wastewater increased when multiple pipe attributes, distance weighting, and groundwater flow direction were considered. Rieckermann et al. (2005) used multiple tracers and estimated as much as 10% of the sewage volume exfiltrated into shallow groundwater in a study from Switzerland. This study estimated as much as 0.6% of the daily average sewage volume exfiltrating where it could be mobilized by shallow groundwater. This low percentage is partly due to the high volume of sewage that is conveyed though this system. Differences in infrastructure, geology, topography, and hydrologic conditions between the San Diego River watershed and studies performed in other locations (e.g., the east coast of the United States or Europe) likely also account for the differences between our exfiltration rates and previous studies.
While the empirical evidence points to exfiltration as a potentially large source of human fecal pollution in the SDR, the exact mechanisms of subsurface transport are not known. In the SDR watershed, 76% of sewer pipe segments are within 100 m of a storm drain or waterbody and 36% are within 7 m of a storm drain or waterbody (Supplementary Figure S1). Ellis et al. (2004) notes that exfiltration is a function of hydrostatic head and backfill material, and that the rate of exfiltration can change over time. Vollertson and Hvitved-Jacobsen (2003) indicated that exfiltration rates can be initially high but reach steady state within an hour. Our study utilized multiple runs to measure exfiltration cumulatively lasting up to 6 h of flow. Rutsch et al. (2008) discusses the importance of the colmation layer (a layer of organic rich particles), sediment, and biofilm that can clog cracks and joint separations, to accurately model exfiltration. Since we utilized in situ pipes for empirical measurements of exfiltration, much of the sediment, biofilm, and colmation layer were likely present. But exactly how exfiltrated sewage can accumulate in the subsurface, and then get mobilized either by rising groundwater, transported downgradient until reaching surface waters, or infiltrating storm drains remains an area of future research for the San Diego River watershed (Figure 1).
This project did not address public health risk of exfiltrated sewage, but other projects have demonstrated an increase in public health risk during wet weather. Arnold et al. (2017) conducted an epidemiology study in San Diego and found an increased risk of highly credible gastrointestinal illness in those entering the ocean during or immediately following a rainstorm compared to those not entering the ocean. Soller et al. (2017) confirmed these findings using a quantitative microbial risk assessment (QMRA) based on the work of Steele et al. (2018) who measured human specific genetic markers as well as human pathogens in wet weather runoff from the San Diego River.
While we estimated human fecal loading from exfiltration during wet weather, dry weather does not appear to be a substantial source of fecal loading in the San Diego River. Schiff et al. (2023) conducted multiple surveys of the San Diego River during dry weather, including immediately after a storm and again at the end of the wet season, and HF183 was infrequently quantified. Where HF183 was quantified, surface and not subsurface contributions were identified as the likely source.
In this study we extrapolated empirical measurements of sewage exfiltration to a 419 km2 watershed and estimated a daily rate of 2.5 × 10³ L per kilometer per day. A human fecal pollution load of 1.5 × 10¹³ (95% CI: 1.79 × 10¹² to 3.59 × 10¹³) HF183 gene copies per storm was calculated from the exfiltration rate, the proportion of sewer pipes that were exfiltrating, the decay rate of HF183, and the proportion of exfiltrated sewage that reaches storm drains, streams, and rivers. This human fecal pollution load was similar in scale to the measured human fecal pollution mass loading estimates in stormwater for this watershed and comparable to independently-measured tracers of sewage. We note that this is the first application based on this empirical measurement of exfiltration and recommend additional testing in other systems and geographies to help refine the estimates used in the calculations. Refinements to the measurements, including improved understanding of sewage flow and empirical measurements with artificial sewage would help improve the estimates. We also recommend future studies on refining the understanding of subsurface transport mechanisms of exfiltrated sewage.
The datasets presented in this study can be found in online repositories. The names of the repository/repositories and accession number(s) can be found in the article/Supplementary Material.
JS: Conceptualization, Data curation, Formal Analysis, Investigation, Methodology, Supervision, Validation, Visualization, Writing–original draft, Writing–review and editing. AG-F: Data curation, Formal Analysis, Investigation, Methodology, Validation, Visualization, Writing–review and editing. JG: Conceptualization, Investigation, Methodology, Project administration, Resources, Supervision, Writing–review and editing. DE: Data curation, Investigation, Methodology, Writing–review and editing. SW: Data curation, Investigation, Methodology, Writing–review and editing. KS: Conceptualization, Formal Analysis, Funding acquisition, Investigation, Methodology, Project administration, Resources, Supervision, Visualization, Writing–original draft, Writing–review and editing.
The author(s) declare that financial support was received for the research, authorship, and/or publication of this article. This project was partially funded by the City of San Diego, County of San Diego, Padre Dam Municipal Water District, City of El Cajon and City of La Mesa under County of San Diego Contract 563356.
The authors are grateful for the guidance of the project Technical Review Committee; Martha Tremblay, Patricia Holden, Sandra McLellan, John Izbicki, Mia Mattioli, Jennifer Wolch. The authors are grateful for the partnership and collaboration with the collection system professionals at the City of San Diego, County of San Diego, Padre Dam Municipal Water District, and City of La Mesa including Daniel Carter, Jeff Van Every, Margaret Llagas, Terrell Powell, Bradley Burns, Sean Willis, Gary Harris, Ted Kautzman, Jimmy Vargas, and Daniel Lockhart. The authors appreciate discussions and suggestions provided by Steve Jepsen. The authors are grateful for the project Steering Committee.
Authors DE and SW were employed by WSP.
The remaining authors declare that the research was conducted in the absence of any commercial or financial relationships that could be construed as a potential conflict of interest.
All claims expressed in this article are solely those of the authors and do not necessarily represent those of their affiliated organizations, or those of the publisher, the editors and the reviewers. Any product that may be evaluated in this article, or claim that may be made by its manufacturer, is not guaranteed or endorsed by the publisher.
The Supplementary Material for this article can be found online at: https://www.frontiersin.org/articles/10.3389/fenvs.2024.1458153/full#supplementary-material
Arnold, B. F., Schiff, K. C., Ercumen, A., Benjamin-Chung, J., Steele, J. A., Griffith, J. F., et al. (2017). Acute illness among surfers after exposure to seawater in dry-and wet-weather conditions. Am. J. Epidemiol. 186 (7), 866–875. doi:10.1093/aje/kwx019
ASTM Standard C1091-03a (2022). Standard test method for hydrostatic infiltration testing of vitrified clay pipe lines. West Conshohocken, PA: ASTM International.
Beheshti, M., Sægrov, S., and Ugarelli, R. (2015). Infiltration/inflow assessment and detection in urban sewer system. Vann 01, 24–34. Available at: https://vannforeningen.no/wp-content/uploads/2015/01/Beheshti.pdf.
Boehm, A. B., Van De Werfhorst, L. C., Griffith, J. F., Holden, P. A., Jay, J. A., Shanks, O. C., et al. (2013). Performance of forty-one microbial source tracking methods: a twenty-seven lab evaluation study. Water Res. 47 (18), 6812–6828. doi:10.1016/j.watres.2012.12.046
Cao, Y., Anderson, G. L., Boehm, A. B., Holden, P. A., Jay, J. A., and Griffith, J. F. (2017) “Determination of DNA-based fecal marker aging characteristics for use in quantitative microbial source tracking,” in Technical report 978. Southern California coastal water research project. Available at: http://ftp.sccwrp.org/pub/download/DOCUMENTS/TechnicalReports/978_DNA_FecalMarkerAgingQuantMicrobialSourceTracking.pdf.
Crawford, D., Eckley, P. L., and Pier, E. (1999). Methods for estimating inflow and infiltration into sanitary sewers. J. Water Manag. Model., R204–R217. doi:10.14796/JWMM.R204-17
Delesantro, J. M., Duncan, J. M., Riveros-Iregui, D., Blaszczak, J. R., Bernhardt, E. S., Urban, D. L., et al. (2022). The nonpoint sources and transport of baseflow nitrogen loading across a developed rural-urban gradient. Water Resour. Res. 58 (7), e2021WR031533. doi:10.1029/2021wr031533
Delesantro, J. M., Duncan, J. M., Riveros-Iregui, D., Whitmore, K. M., and Band, L. E. (2024). High frequency monitoring and nitrate sourcing reveals baseflow and stormflow controls on total dissolved nitrogen and carbon export along a rural-urban gradient. Water Resour. Res. 60. doi:10.1029/2023wr036750
Ellis, J. B., Revitt, D. M., Blackwood, D. J., and Gilmour, D. J. (2004). “Leaky sewers: assessing the hydrology and impact of exfiltration in urban sewers,” in Hydrology: science and practice for the 21st century (London, England: British Hydrological Society) 2, 266–271.
Griffith, J. F., Steele, J. A., Gonzalez-Fernández, A., and Schiff, K. C. (2024). Towards quantifying exfiltration from in situ sanitary sewer pipes. Front. Environ. Sci. doi:10.3389/fenvs.2024.1458146
Held, I., Wolf, L., Eiswirth, M., and Hötzl, H. (2006). “Impacts of sewer leakage on urban groundwater: review of a case study in Germany,” in Urban groundwater management and sustainability (Netherlands: Springer), 189–204.
Hinds, J. B., Garg, T., Hutmacher, S., Nguyen, A., Zheng, Z., Griffith, J., et al. (2024). Assessing the defecation practices of unsheltered individuals and their contributions to microbial water quality in an arid, urban watershed. Sci. Total Environ. 920, 170708. doi:10.1016/j.scitotenv.2024.170708
Hopkins, K. G., and Bain, D. J. (2018). Research Note: mapping spatial patterns in sewer age, material, and proximity to surface waterways to infer sewer leakage hotspots. Landsc. Urban Plan. 170, 320–324. doi:10.1016/j.landurbplan.2017.04.011
Karpf, C., Hoeft, S., Scheffer, C., Fuchs, L., and Krebs, P. (2011). Groundwater infiltration, surface water inflow and sewerage exfiltration considering hydrodynamic conditions in sewer systems. Water Sci. Technol. 63 (9), 1841–1848. doi:10.2166/wst.2011.388
Karpf, K., and Krebs, P. (2005). Application of a leakage model to assess exfiltration from sewers. Water Sci. and Technol. 52 (5), 225–231. doi:10.2166/wst.2005.0137
Lee, D. G., Roehrdanz, P. R., Feraud, M., Ervin, J., Anumol, T., Jia, A., et al. (2015). Wastewater compounds in urban shallow groundwater wells correspond to exfiltration probabilities of nearby sewers. Water Res. 85, 467–475. doi:10.1016/j.watres.2015.08.048
Nguyen, H. H., Peche, A., and Venohr, M. (2021). Modelling of sewer exfiltration to groundwater in urban wastewater systems: a critical review. J. Hydrology 596, 126130. doi:10.1016/j.jhydrol.2021.126130
Nguyen, H. H., and Venohr, M. (2021). Harmonized assessment of nutrient pollution from urban systems including losses from sewer exfiltration: a case study in Germany. Environ. Sci. Pollut. Res. 28, 63878–63893. doi:10.1007/s11356-021-12440-9
Noble, R. T., Weisberg, S. B., Leecaster, M. K., McGee, C. D., Dorsey, J. H., Vainik, P., et al. (2003). Storm effects on regional beach water quality along the southern California shoreline. J. Water Health 1 (1), 23–31. doi:10.2166/wh.2003.0004
Pinongcos, F., Mladenov, N., Calderon, J., Verbyla, M. E., Kinoshita, A. M., Gersberg, R., et al. (2022). Chemical and microbial markers for discriminating sanitary sewer contamination in coastal, urban streams. ACS ES&T Water 2, 1747–1759. doi:10.1021/acsestwater.2c00265
Rutsch, M., Rieckermann, J., Cullmann, J., Ellis, J. B., Vollertsen, J., and Krebs, P. (2008). Towards a better understanding of sewer exfiltration. Water Res. 42 (10-11), 2385–2394. doi:10.1016/j.watres.2008.01.019
Rieckermann, J., Borsuk, M., Reichert, P., and Gujer, W. (2005). A novel tracer method for estimating sewer exfiltration. Water. Resour. 41. doi:10.1029/2004wr003699
Roehrdanz, P. R., Feraud, M., Lee, D. G., Means, J. C., Snyder, S. A., and Holden, P. A. (2017). Spatial models of sewer pipe leakage predict the occurrence of wastewater indicators in shallow urban groundwater. Environ. Sci. Technol. 451, 1213–1223. doi:10.1021/acs.est.6b05015
Sauer, E. P., VandeWalle, J. L., Bootsma, M. J., and McLellan, S. L. (2011). Detection of the human specific Bacteroides genetic marker provides evidence of widespread sewage contamination of stormwater in the urban environment. Water. Res. 45, 4081–4091. doi:10.1016/j.watres.2011.04.049
Schiff, K. C., Griffith, J. F., Steele, J. A., and Gonzalez-Fernandez, A. (2024) “Summary of technical research: quantifying sources of human fecal pollution in the lower San Diego River Watershed,” in Technical report 1380. Southern California coastal water research project. Costa Mesa, CA.
Schiff, K. C., Griffith, J. F., Steele, J. A., and Zimmer-Faust, A. G. (2023). Dry and wet weather survey for human fecal sources in the San Diego River Watershed. Water 15, 2239. doi:10.3390/w15122239
Selvakumar, A., Field, R., Burgess, E., and Amick, R. (2010). Exfiltration in sanitary sewer systems in the US. Urban Water J. 1 (3), 227–234. doi:10.1080/15730620410001732017
Sercu, B., Van De Werfhorst, L. C., Murray, J. L., and Holden, P. A. (2011). Sewage exfiltration as a source of storm drain contamination during dry weather in urban watersheds. Environ. Sci. and Technol. 45 (17), 7151–7157. doi:10.1021/es200981k
Sercu, B., Werfhorst, L. C. V. D., Murray, J., and Holden, P. A. (2009). Storm drains are sources of human fecal pollution during dry weather in three urban southern California watersheds. Environ. Sci. Technol. 43, 293–298. doi:10.1021/es801505p
Soller, J. A., Schoen, M., Steele, J. A., Griffith, J. F., and Schiff, K. C. (2017). Incidence of gastrointestinal illness following wet weather recreational exposures: harmonization of quantitative microbial risk assessment with an epidemiologic investigation of surfers. Water Res. 121, 280–289. doi:10.1016/j.watres.2017.05.017
Staufer, P., Scheidegger, A., and Rieckermann, J. (2012). Assessing the performance of sewer rehabilitation on the reduction of infiltration and inflow. Water Res. 46 (16), 5185–5196. doi:10.1016/j.watres.2012.07.001
Steele, J. A., Blackwood, A. D., Griffith, J. F., Noble, R. T., and Schiff, K. C. (2018). Quantification of pathogens and markers of fecal contamination during storm events along popular surfing beaches in San Diego, California. Water Res. 136, 137–149. doi:10.1016/j.watres.2018.01.056
Steele, J. A., McCargar, D. E., Wallace, S., Zimmer-Faust, A. G., Langlois, K., Griffith, M. L., et al. In review. Application of a microbial community sequencing approach to identify contamination from sewers in an urban watershed. Environ. Pollut.
Tiefenthaler, L. L., Stein, E. D., and Schiff, K. C. (2011). Levels and patterns of fecal indicator bacteria in stormwater runoff from homogenous land use sites and urban watersheds. J. Water Health 9, 279–290. doi:10.2166/wh.2010.056
Vollertson, J., and Hvitved-Jacobsen, T. (2003). Exfiltration from gravity sewer: a pilot scale study. Water Sci. Technol. 47 (4), 66–76. doi:10.2166/wst.2003.0223
Wolf, L., Eiswirth, M., and Hötzl, H. (2006). Assessing sewer–groundwater interaction at the city scale based on individual sewer defects and marker species distributions. Environ. Geol. 49, 849–857. doi:10.1007/s00254-006-0180-x
Zimmer-Faust, A., Schiff, K., and Nguyen, D. (2021). Quantify sources of human fecal contamination loading to the San Diego river, technical memorandum, task 8A: compiling and analyzing existing data for sanitary sewer overflow events. Rep. Prep. San Diego River Investigative Order Steer. Comm. South. Calif. Coast. Water Res. Proj. Costa Mesa, CA, 28.
Zimmer-Faust, A. G., Thulsiraj, V., Marambio-Jones, C., Cao, Y., Griffith, J. F., Holden, P. A., et al. (2017). Effect of freshwater sediment characteristics on the persistence of fecal indicator bacteria and genetic markers within a Southern California watershed. Water Res. 119, 1–11. doi:10.1016/j.watres.2017.04.028
Keywords: sewer exfiltration, municipal separate storm sewer systems, sewer pipes, HF183, decay rates, flow-weighted loading
Citation: Steele JA, González-Fernández A, Griffith JF, Ebentier McCargar D, Wallace S and Schiff KC (2025) Extrapolating empirical measurements of wastewater exfiltration from sanitary sewers to estimate watershed-scale fecal pollution loading in urban stormwater runoff. Front. Environ. Sci. 12:1458153. doi: 10.3389/fenvs.2024.1458153
Received: 02 July 2024; Accepted: 10 December 2024;
Published: 23 January 2025.
Edited by:
Vivek Pulikkal, Civil and Environmental Consultants, Inc., Charlotte, United StatesReviewed by:
Joseph Delesantro, The Pennsylvania State University (PSU), United StatesCopyright © 2025 Steele, González-Fernández, Griffith, Ebentier McCargar, Wallace and Schiff. This is an open-access article distributed under the terms of the Creative Commons Attribution License (CC BY). The use, distribution or reproduction in other forums is permitted, provided the original author(s) and the copyright owner(s) are credited and that the original publication in this journal is cited, in accordance with accepted academic practice. No use, distribution or reproduction is permitted which does not comply with these terms.
*Correspondence: Joshua A. Steele, am9zaHVhc0BzY2N3cnAub3Jn; John F. Griffith, am9obmdAc2Njd3JwLm9yZw==
†Present address: Darcy Ebentier McCargar, Rick Engineering, San Diego, CA, United States
Sierra Wallace, Rick Engineering, San Diego, CA, United States
Disclaimer: All claims expressed in this article are solely those of the authors and do not necessarily represent those of their affiliated organizations, or those of the publisher, the editors and the reviewers. Any product that may be evaluated in this article or claim that may be made by its manufacturer is not guaranteed or endorsed by the publisher.
Research integrity at Frontiers
Learn more about the work of our research integrity team to safeguard the quality of each article we publish.