
94% of researchers rate our articles as excellent or good
Learn more about the work of our research integrity team to safeguard the quality of each article we publish.
Find out more
ORIGINAL RESEARCH article
Front. Environ. Sci. , 23 September 2024
Sec. Environmental Informatics and Remote Sensing
Volume 12 - 2024 | https://doi.org/10.3389/fenvs.2024.1448601
 Mohamed Gouda1Mohamed Abu-hashim1Attyat Nassrallah1Mohamed N. Khalil1,2Ehab Hendawy3Fahdah F. benhasher4
 Mohamed S. Shokr5*
 Mohamed A. Elshewy6
 Elsayed said Mohamed3,7
Introduction: Mapping soil organic carbon (SOC) with high precision is useful for controlling soil fertility and comprehending the global carbon cycle. Low-relief locations are characterized by minimal variability in traditional soil-forming elements, such as terrain and climatic conditions, which make it difficult to reflect the spatial variation of soil properties. In the meantime, vegetation cover makes it more difficult to obtain direct knowledge about agricultural soil. Crop growth and biomass are reflected by the normalized difference vegetation index (NDVI), a significant indicator. Rather than using conventional soil-forming variables.
Methods: In this study, a novel model for predicting SOC was developed using Landsat-8 Operational Land Imager (OLI) band data (Blue (B), Green (G), Red (R), and Near Infrared (NIR), NDVI data as the supporting variables, and Artificial Neural Networks (ANNs). A total of 120 surface soil samples were collected at a depth of 25 cm in the northeastern Nile Delta near Damietta City. Of these, 80% (96 samples) were randomly selected for model training, while the remaining 24 samples were used for testing and validation. Additionally, Gaussian Process Regression (GPR) models were trained to estimate SOC levels using the Matern 5/2 kernel within the Regression Learner framework.
Results and discussion: The results demonstrate that both the ANN with a multilayer feedforward network and the GPR model offer effective frameworks for SOC prediction. The ANN achieved an R2 value of 0.84, while the GPR model with the Matern 5/2 kernel achieved a higher R2 value of 0.89. These findings, supported by visual and statistical evaluations through cross-validation, confirm the reliability and accuracy of the models.
Conclusion: The systematic application of GPR within the Regression Learner framework provides a robust tool for SOC prediction, contributing to sustainable soil management and agricultural practices.
Soil organic carbon (SOC) is essential for both food security and mitigating the effects of climate change due to, carbon sequestration (Lal, 2004; Lal, 2019; Li et al., 2020). In an international context, determining which land use/cover types may offer the best opportunity for C sequestration to mitigate increases in greenhouse gas concentrations or where soils are most vulnerable to C losses requires a solid understanding of the global SOC mass and its spatial distribution (Köchy et al., 2015). The United Nations Food and Agriculture Organization (FAO) took the initiative to declare 2015 the “International Year of Soils.” Fossil fuel combustion releases 9.0 GtC annually into the atmosphere; this is where the term “4 per thousand” (Minasny et al., 2017) came from. The programme calls for the advancement of agronomic research to raise global soil organic matter (SOM) stocks by 4 per 1,000 annually during the COP 21 conference (Chenchouni and Neffar, 2022). Farmers and scientists agree that one of the main markers of soil quality is SOC. SOC is thought to be the primary carbon store on Earth, accounting for around 58% of the structure of organic matter (OM) (Allory et al., 2019; Gomez et al., 2020). According to estimates, there may be up to three times as much carbon as there is in the atmosphere (Houghton, 2007). With this perspective, the hypothesis that increasing SOC content derives from increased organic matter input into the medium is still in place (Lal, 2019). Higher OM concentrations may enhance soil fertility because they store and release nutrients (Raiesi, 2021), stabilize the physical structure and other factors (Fontana et al., 2023). The technique of reflectance spectroscopy has gained increasing prominence in evaluating SOC (Gholizadeh et al., 2021) as an alternative to laboratory practices that require longer times for analysis and the use of reagents that are significantly harmful (Sithole et al., 2018). Quantitative evaluations of SOC and its administration are required to comprehend its pivotal function in the global C cycle (Viscarra Rossel et al., 2019). Hyperspectral remote sensing (HRS) has made it possible to detect soil elements and indirectly forecast soil qualities by analyzing the electromagnetic radiation reflected by a sample’s surface, using physical parameters like reflectance factors (ρ) (Benedet et al., 2020; Sun et al., 2018). Soil spectroscopy can serve as a foundation for additional soil identification and recognition using satellite remote data. To create map models that accurately reflect the spatial differentiation of target soil properties at the field level, laboratory or in-situ field spectrometry data is used to calibrate the models before moving on to satellite data for the most informative wavelengths (Chinilin et al., 2023). In response to the demand for sustainable development, remote sensing (RS) methods in the 400–2,500 nm Visible–Near Infrared–Shortwave Infrared (VNIR–SWIR) area could help more quickly, affordably, and directly estimate key indicators for soil monitoring needs (Angelopoulou et al., 2019).
From a methodological perspective, various soil properties, including pH, organic carbon, electrical conductivity, texture, nitrate-nitrogen, available phosphorus, exchangeable potassium, cation exchange capacity, exchangeable calcium, and exchangeable aluminium, can be distinguished using analytical methods based on changes in specific reflectance (in the visible range from 400 to 700 nm, and in the Near Infrared range from 700 to 2,500 nm (Islam et al., 2003; Rossel et al., 2006). Measurement and monitoring techniques that are both practical and economical are necessary for a quantitative evaluation of changes in the quantity and composition of SOC that may result from alterations in the types of land use and tillage practices. When dealing with multiple samples, the typical analytical processes can be exceedingly costly and time-consuming (Poppiel et al., 2022). Tracking changes in the environment and agriculture has been made easier with the use of remote sensing in recent years (Jiménez-Lao et al., 2020; Li et al., 2020; Overpeck et al., 2011; Pavlovic et al., 2024). The system uses a variety of platforms and sensors, including satellite constellations and unmanned aerial systems (UAS), to collect data. This data is then processed using sophisticated algorithms, many of which are used in the fields of machine learning (ML) and deep learning (DL).
In recent years, ML and DL have been extensively used in various fields to extract and predict information from high-resolution aerial and satellite imagery. For example, in agriculture, they are utilized for crop monitoring, disease detection, and yield prediction. In urban planning, they help in mapping land use, analyzing infrastructure, and monitoring urban growth. In environmental science, these networks aid in tracking deforestation, assessing natural disaster impacts, and studying climate change (Orusa et al., 2024). Furthermore, ML and DL are instrumental in estimating vegetation health, vegetation land cover, fractional vegetation cover, and soil properties (Khanal et al., 2018; Gao et al., 2020). Particularly for agricultural applications where the interactions are complicated and multivariate, multiple regression and machine learning models hold great potential to produce more accurate predictions than those produced by standard regression approaches (Farbo et al., 2024).
ML includes a range of algorithms capable of modeling and predicting SOC using input data like soil properties, climate variables, and remote sensing indices. Key algorithms include: a) Gaussian Process Regression (GPR) is a non-parametric, Bayesian method that models complex, nonlinear relationships and provides uncertainty estimates, useful for risk assessment and decision-making. b) Support Vector Machines (SVM) is a supervised learning model for classification and regression, effective in SOC prediction by separating data into classes or predicting continuous values. Random Forests (RF): An ensemble method that builds multiple decision trees, robust against overfitting and suitable for high-dimensional data (Adeniyi et al., 2024; Mahmoudzadeh et al., 2020) DL is a subset of ML, uses neural networks with multiple layers to learn data representations. The ability of deep neural networks to learn complex patterns from large datasets makes them invaluable for extracting meaningful insights from high-resolution imagery DL excels in SOC estimation by capturing intricate patterns and nonlinear relationships in large datasets. Key DL architectures include: a) Multilayer Feed forward Networks (MLFNs), which automatically learn relevant features from data, handling large, diverse datasets and improving prediction accuracy (Parvizi and Heshmati, 2015), b) Convolutional Neural Networks (CNNs) is Ideal for spatial data like remote sensing images, CNNs extract spatial features for SOC prediction (Kattenborn, et al., 2021), c) Recurrent Neural Networks (RNNs): Suitable for sequential data, RNNs capture temporal dependencies, useful for analyzing time-series data of soil and climate variables (Grossberg, 2013).
The development of a SOC model using ANNs apply a sophisticated machine learning approach to predict SOC levels based on various soil and environmental factors. ANNs consist of interconnected neurons that process inputs through non-linear functions, enabling the modeling of complex relationships within the data (Figure 1). The model is trained on extensive datasets, including soil properties and climatic conditions, where the network adjusts its weights to capture underlying patterns in the data. The advantage of ANNs lies in their ability to handle non-linear relationships, which are challenging for traditional algorithms. Techniques like backpropagation are used during training to minimize prediction errors, while cross-validation ensures model robustness and generalizability. The ANN’s performance is evaluated using metrics and visual tools, demonstrating its accuracy and utility in SOC prediction, aiding in sustainable soil management.
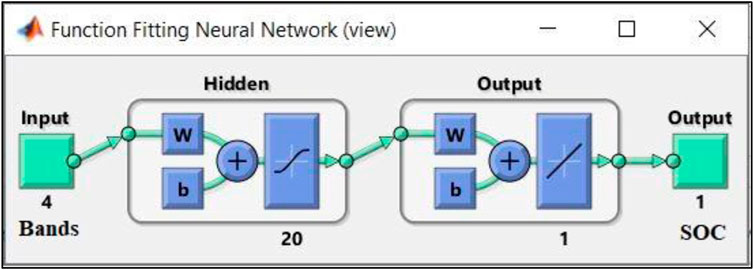
Figure 1. The architecture of the artificial neural network.
Through the application of various ML approaches, Wang et al. (2019) attempted to apply ML techniques to estimate SOC stock in the semi-arid region with an emphasis on assessing the effect of taking seasonal fractional cover into account on model performance. On their dataset, the random forest (RF) method yielded the best results, with an R2 of 0.47. The evaluation of soil parameters has also benefited from advancements in instrumental engineering and proximal soil sensing, particularly soil spectroscopy (Rossel et al., 2006). To characterize the soil and the consequences of its management, the amount of organic carbon in the soil across a wide region must be quantified (Ribeiro et al., 2021). Based on the correlation of environmental factors (NDVI, annual precipitation, average temperature, and moisture index), Wang et al. (2019) evaluated the SOC geographical distribution using a weighted regression technique. These therefore demonstrate that robust statistical links are produced between significant topographic variance and significant changes in climate and other SOC-related environmental variables. To improve our understanding of and management of SOC for the benefit of all humanity, we need to develop effective and efficient ways for continuous global SOC monitoring (Pavlovic et al., 2024). Regrettably, conventional methods used to track SOC are frequently labor-intensive, expensive, and unworkable (Mäkipää et al., 2008). To get what might be considered “ground truth” data, these processes involve thorough soil collection, additional laboratory testing, and considerable data processing (Ellert et al., 2007).
In this work, we used Landsat OLI imagery, to ascertain the SOC in the in the northeastern part of the Nile Delta, Egypt. To accomplish this, we trained and validated our models using a dataset of satellite images and related SOC values obtained by field sampling. This was done using ML and DL approaches.
The study area spans the catchment basin in the northeastern part of the Nile Delta, next to Damietta City. Geographical coordinates are 31° 20′00° to 31° 27′00`` North in latitude and 31° 34 30`` to 31° 41 30 East in longitude (Figure 2A). The study area covers 10,763 ha and is characterized by a variety of land uses, such as croplands, urban areas, bare soils, and water bodies, which include all of the local streams, as shown in Figure 2B. This region has a Mediterranean climate, with seasonal and sporadic rainfall that mostly falls during the winter. Based on records from the Climatic Data of Port Said Meteorological Station, historical rainfall data for January (TMS, 1986–2020) indicates an average of 125 mm based on information from the Port Said Meteorological Station’s Climatic Data. The region’s maximum recorded temperature was 36°C, while the average temperature was 21.4°C. Landsat8OLI (15/10/2023) was used to create a satellite image of the research area with a spatial resolution of 30 m. A 30-m resolution digital elevation model (DEM) was acquired from publicly available data, specifically from the Shuttle Radar Topography Mission (SRTM). The majority of the study area’s geology is made up of Nile silt deposits. Next come sand dunes that have stabilized, sand dunes that deposits of sabkha and undifferentiated quaternary materials (Egypt, 1987). Damietta is located in the arid zone, with an aridity index (the annual P/annual ET) of 0.07, in accordance with the UNESCO categorization of arid lands (MAB, 1979). The temperature and moisture regimes in soils are thermic and aridic, respectively, according to soil classification, there is just one soil order—Entisols—which has three suborders: aquents, psamments, and fluvents (El-Gammal et al., 2014).
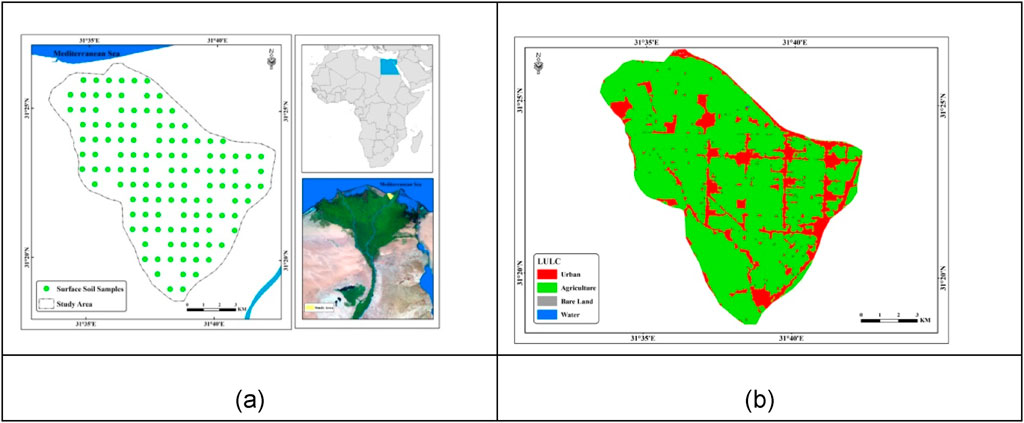
Figure 2. (A) Location of research area and spatial distribution of soil samples; (B) LULC of study area.
A total of sixty soil samples were gathered at a depth of 25 cm during October/2023, representing a variety of land uses and soil types. The precise location of every sampling station was ascertained using a small, hand-held GPS device. Soil samples were air-dried, ground until they could be passed through a 2 mm sieve, and then kept in plastic bags at a temperature of about 4°C until analysis. The dichromate oxidation method was used to assess SOC in accordance with the Walkley and Black method (Schumacher, 2002). Sodium hexametaphosphate was used as a dispersant during the mechanical examination of the soil samples, in compliance with the international procedure (Rowell, 2014).
A Landsat 8 OLI image was downloaded from the U.S. Geological Survey (USGS) on15/10/2023.It is distinguished by15 m panchromatic band and 30 m multi-spectral spatial resolutions with nine spectral bands. After removing the thermal bands, the images underwent georectification using UTM coordinates. The scenes we have chosen has no cloud cover and consists of six atmospherically corrected bands in surface reflectance (SR) data from the Vis, NIR, and Shortwave Infrared (SWIR) regions: B2 (450–510 nm), B3 (530–590 nm), B4 (640–670 nm), B5 (850–880 nm), B6 (1,570–1,650 nm), and B7 (2,110–2,290 nm). The process of mosaicking theimages involved fusing several images together to create a single composite image inside of a dereferenced output mosaic (Mohamed et al., 2020). We were able to determine the best adjustments for Normalized Difference Vegetation Index (NDVI) (de Castro Padilha et al., 2020) The FLAASH module was then used to atmospherically correct OLI image, and depending on the panchromatic band, the visible and NIR bands’ spatial resolution was resampled to 15 m depending on the panchromatic band (Mohamed et al., 2020). The data were converted to surface reflectance after being calibrated to spectral radiance (Rukun, 1999). Lastly, a selective mask of the non-analysis zone was applied in order to preserve only the pixels with the bare soil (Bouasria et al., 2020). This study focuses on the Blue (B), Green (G), Red (R), and Near Infrared (NIR) bands to develop a predictive model for SOC.
Predicted SOC% values were interpolated using ordinary kriging. The OK geostatistical model predicts the value of a given SOC% at an un-sampled site using a set of statistical methods. Using normal QQPlots and the histogram tool, the data’s normal distribution pattern was examined. The trend analysis served as a SOC check.
The kriging estimator method’s general Equation 1 is as follows (Otto et al., 2018; Biswas and Si, 2013).
Based on observed data (Z(xi)), weights of measured values (λi) within a particular distance, and the number of predicted values (n) inside specific neighbor samples, the predicted value Z(x0) is estimated.
Based on the simulated red and NIR reflectance, this dimensionless index, as presented in Equation 2, indicates the existence and density of vegetation may discriminate between different agricultural characteristics within a field, such as plant height and yield. (Tucker, 1977; Leon et al., 2003).
Vegetation and soil properties showed a substantial association, according to the NDVI (Demattê et al., 2017). In this work, we looked at the NDVI’s spatial variability to see whether the SOC content that came from machine learning was in line with the NDVI’s rise.
ML is transforming the prediction and management of SOC, crucial for soil health and agriculture. By using diverse datasets (soil properties, climate, land use, remote sensing), ML algorithms can accurately predict SOC levels. Techniques like Gaussian process regression, neural networks, and support vector machines effectively model SOC dynamics, revealing patterns traditional methods might miss. ML also helps create detailed SOC maps for targeted soil conservation. Integrating ML with geospatial tech allows continuous monitoring and real-time SOC predictions, supporting adaptive management strategies. This enhances soil health, carbon sequestration, and sustainable agriculture amid climate change.
To systematically address challenges such as predicting SOC using ML, a structured workflow is essential. This process typically involves the following steps:1. Access and Load Data: Gather and import relevant datasets, such as remote sensing imagery and soil samples. 2. Preprocess Data: Clean, normalize, and transform the data to ensure consistency and quality. 3. Derive Features: Extract key variables (e.g., spectral indices, topographical attributes) that influence SOC. 4. Train Models: Use these features to train ML models, optimizing parameters to minimize prediction error. 5. Iterate to Find the Best Model: Evaluate multiple models to identify the most accurate one through techniques like cross-validation. 6. Integrate the Best-Trained Model into a Production System: Deploy the best model into a production system for continuous SOC prediction. By following this systematic workflow, ML can effectively address the complexities of SOC prediction, enabling accurate and scalable solutions to environmental monitoring challenges. The following flowchart (Figure 3) explains the systematic ML workflow for tackling challenges, especially in predicting SOC.

Figure 3. Flowchart explains the systematic machine learning workflow.
A Gaussian Process (GP) characterizes a distribution over functions, essentially producing a finite set of random variables that adhere to a joint Gaussian distribution. Gaussian Process Regression (GPR) is a non-linear regression technique that employs non-parametric Bayesian modeling. It accounts for the variance within the dataset and optimizes the marginal likelihood during the training phase, utilizing a scaled anisotropic Gaussian kernel function (Pérez-Planells et al., 2015; Van Wittenberghe et al., 2014). The relationship between the input variable (B-variables) and the output variable (SOC) (Equation 3):
Where
Scaled anisotropic Gaussian kernel function (Equation 4):
Where
GPR is particularly adept at identifying critical features of the input variables (Williams and Rasmussen, 2006) and assessing the relative importance of different bands or parameters within the predictive model. This capability allows for the determination of key input variables associated with SOC sequestration, ranking them by their contribution to the model’s optimization. Through this process, GPR can effectively prioritize the most influential SOC predictors, thereby enhancing the accuracy and efficiency of the resulting model. The development of a SOC model using GPR algorithms involves employing sophisticated statistical and ML techniques to accurately estimate SOC levels from various soil and environmental variables. This process begins with the use of specialized software, such as the Regression Learner, which is designed to streamline the creation, training, and evaluation of regression models. The software facilitates comprehensive dataset management, allowing for the systematic selection of relevant features and the definition of validation protocols. The Regression Learner automates the training of multiple regression models, including GPR, enabling the identification of the most appropriate model type for the SOC prediction (Elshewy et al., 2024). GPR is particularly advantageous in this context due to its capability to manage non-linear relationships and provide uncertainty estimates, making it a robust choice for dealing with complex environmental datasets.
The development of a SOC model using ANNs involves employing a sophisticated ML approach to predict SOC levels based on various soil and environmental factors. ANNs consist of interconnected units called neurons, which are linked by weighted connections that transmit information. Each neuron processes inputs through complex, non-linear functions to generate outputs, allowing the network to model intricate relationships within the data. The ANN learns by adjusting the weights of the connections between neurons through training on this data, where known input and output variables (e.g., soil characteristics and corresponding SOC levels) are provided. This training enables the network to understand the underlying relationships between the inputs and the target SOC levels, capturing patterns that are often difficult to model using traditional algorithmic methods. The significant advantage of using ANNs in SOC modeling is their ability to handle complex, non-linear relationships that are typically challenging to define with conventional algorithms. During the training phase, the ANN iteratively updates its weights to minimize prediction errors, utilizing techniques like backpropagation. Once trained, the ANN can accurately predict SOC levels for new data, providing a powerful tool for soil management and agricultural planning.
There are various models of ANN technique, including multilayer feedforward network, radial basis network, generalized regression network, probabilistic networks, etc (Ahmed et al., 2023). In this study, a multilayer feedforward network option was chosen to create a SOC model, because it has good representative capabilities. ANNs were created by the MATLAB program using the neural network tool (nftool). As a training function, the TRAINLM function built into MATLAB was used, which trains the ANN using the well-known Levenberg-Marquardt algorithm, the TANSIG activation function in all layers and the data interval normalized between [-1; 1] and two hidden layers with 20 neurons were used. The hyperparameters were selected based on extensive experimental work aimed at optimizing model performance, as well as guidance from previous studies. The dataset was randomly divided into 80% for training, 10% for validation, and 10% for testing. During training, the network adjusted based on the error from the training data, while the validation set was used to monitor generalization and halt training when improvements ceased. The test set provided an independent measure of performance. To minimize the error, the Levenberg-Marquardt algorithm was used, which adaptively changes the unknown parameters (weights and biases) between the gradient descent update and the Gauss-Newton update according to Equation 5, until the algorithm reaches a stable state.
Where
where
After the completion of training of GPR algorithms and ANNs, model performance is evaluated using the Standard Deviation (STD) and the determination coefficient (R-squared) (Equations 8–10). STD plays a crucial role in the study as it measures how spread out the predicted SOC values are. By analyzing the STD, we ensure that the predicted values are more tightly clustered around the mean, indicating that the models produce consistent and reliable predictions. These metrics provide insights into the accuracy and reliability of the models. The Standard Deviation measures the dispersion of prediction errors, indicating how much the predicted values deviate from the actual values. The R-squared value, on the other hand, assesses the proportion of variance in the dependent variable that is predictable from the independent variable(s). These performance measures are mathematically represented by specific equations, where (n) denotes the number of data points used in the evaluation process. By analyzing these metrics, one can determine the effectiveness of the created models and their potential applicability to real-world scenarios.
The SOC%'s fundamental statistical data is displayed in the Table 1. The research area’s texture varies from sandy to sand clay loam. Within the research region, the SOC values vary from 0.00 to 1.10 percent, with an average of 0.56% ± 0.257% (Table 1). The highest content of SOC was found in clay loam soil. Under same climatic conditions, SOC levels typically rise with increasing clay and silt content due to increased physicochemical protection (Abdellatif et al., 2023; Li et al., 2022). The NDVI values ranges from 0.1 to 0.94, the regions with high SOC values also had the highest NDVI values (Figure 4A). There is a direct and indirect correlation between soil organic matter and vegetation cover according to the NDVI (Muster et al., 2015). A significant positive correlation has been seen between the NDVI and SOC content (Zhang et al., 2019). The effectiveness of the geostatistical model for each SOC and the performance of ordinary kriging interpolation were evaluated using metrics like the root means square error (RMSE), mean standardized error (MSE), and root means square standardized error (RMSSE) (Otto et al., 2018; Hammam et al., 2022; Mustafa et al., 2024). We used the nugget to sill ratio to assess the spatial dependency (SPD) of SOC. If this ratio is below 0.25, between 0.25 and 0.75, and above 0.75, respectively, the SPD is strong, moderate, and weak (Cambardella et al., 1994). As a result, SOC displayed moderate SPD (0.35). The exponential model was found to be appropriate for SOC as the RMSSE = 1.1 and MSE is close to zero (0.003). The highest values of SOC were found in the west of study area (Figure 4B).
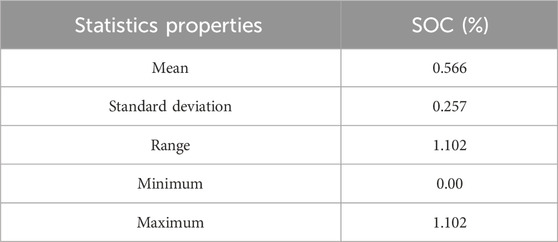
Table 1. Descriptive statistics for the SOC% of the samples.
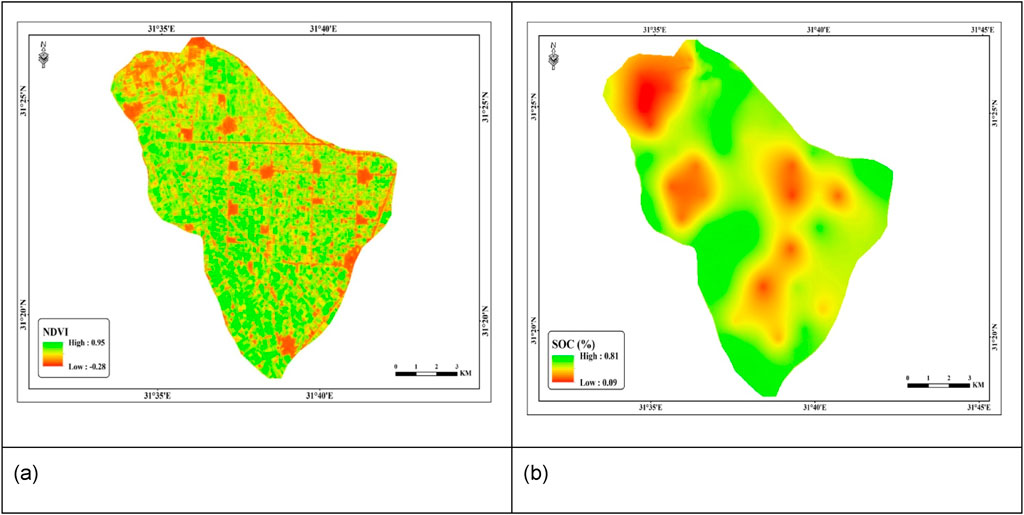
Figure 4. (A) NDVI and, (B) spatial distribution of SOC within investigated area.
The digital numbers ranges corresponding to the locations of the SOC samples and were obtained by processing the satellite image using the ERDAS Envision software, as indicated in Table 2.
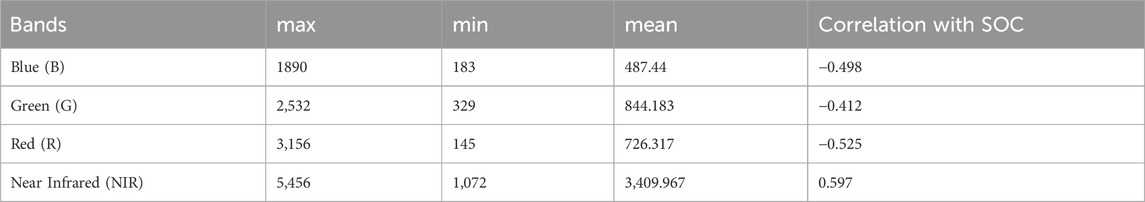
Table 2. Bands statistics.
Using spectral data from the B, G, R, and NIR bands, the study systematically evaluated three scenarios for SOC prediction: pairs of bands, combinations of three bands, and all four bands together. GPR algorithms and ANNs were applied in each scenario to identify the optimal model for characterizing SOC values across the study area (Figure 5).
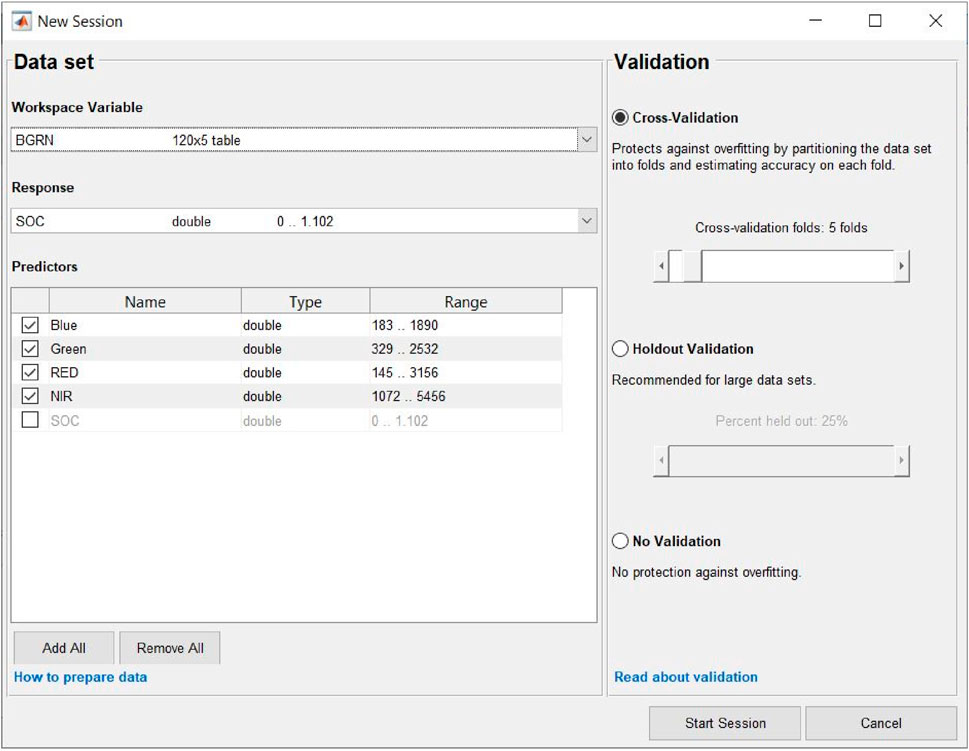
Figure 5. Pick data from the workspace to begin a session.
The study used the Regression Learner application to train Gaussian process regression models for predicting SOC values. Data, including the spectral bands and SOC values, were imported, and independent (bands) and dependent (SOC) variables were defined. A 5-fold cross-validation was applied, with the data split into 80% training, 10% validation, and 10% testing to prevent overfitting and enhance model generalizability. Various Gaussian process models, including Rational Quadratic, Squared Exponential, Matern 5/2, and Exponential, were trained. Model performance was assessed using R2 and standard deviation, and the best model was selected and exported for SOC predictions across the study area.
A multilayer feed-forward neural network was selected for SOC modeling due to its strong representational capabilities. The ANN model featured two hidden layers with 20 neurons each and was trained for at least 1,000 epochs. To prevent overfitting, early stopping was applied, halting training if the validation loss did not improve for 6 consecutive epochs, with the best model saved based on the lowest validation loss. The TANSIG function was used as the transfer function, and the Levenberg-Marquardt algorithm optimized the weights and biases (Figure 6). The model was developed using MATLAB R2019a, with data split into 80% for training, 10% for validation, and 10% for testing. The model’s accuracy was independently assessed during testing.
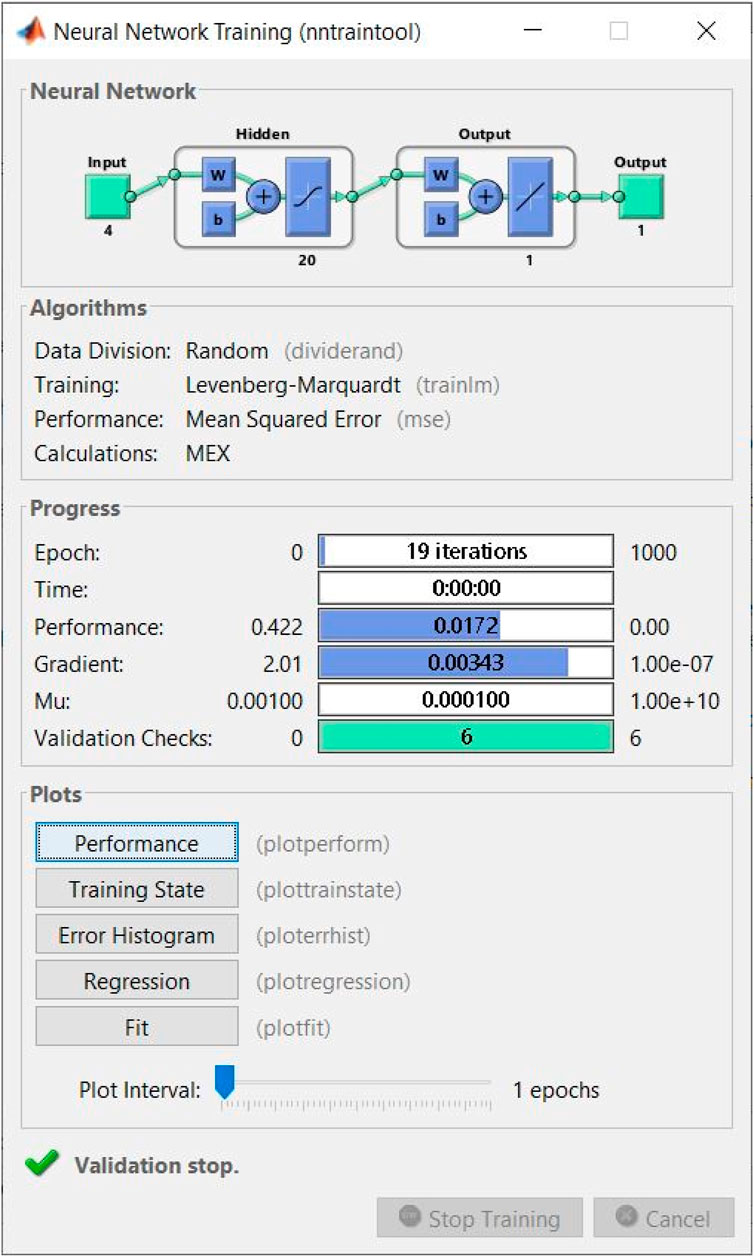
Figure 6. Training window from the MATLAB Neural Network Toolbox.
During the training process, 96 points were randomly selected, while 24 points were used for both validation and testing. Detailed performance metrics and error analyses for these models are provided in Tables 3–5, facilitating a comprehensive comparison and assessment of each modeling approach.
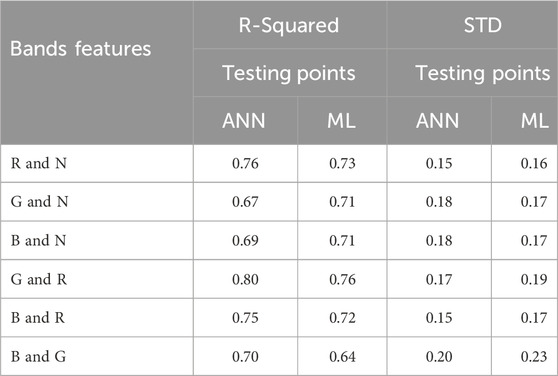
Table 3. Model statistics of the models for the different cases of two bands.
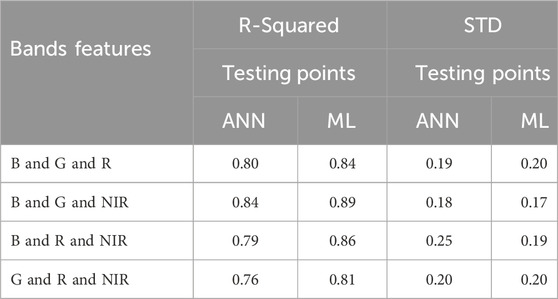
Table 4. Model statistics of the models for the different cases of three bands.
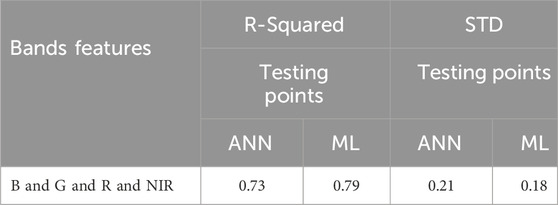
Table 5. Model statistics of the model from the four bands.
The results from Tables 3–5 provide a comprehensive analysis of the performance of ML algorithms in predicting SOC values, highlighting the strengths of Gaussian Process Regression (GPR) with the Matern 5/2 kernel and ANNs. These models were evaluated using different combinations of spectral bands, specifically focusing on two, three, and four-band configurations. The mean R-squared value and STD for all models using GPR are 0.77 and 0.18, respectively. For models employing ANNs, the mean R-squared value and STD are 0.75 and 0.19, respectively. It was observed that models incorporating three bands consistently outperformed those using two or four bands, indicating an optimal balance of information that enhances model accuracy. The mean R-squared values with GPR and ANNs when using three bands are 0.85 and 0.80, respectively. In contrast, using two bands resulted in mean R-squared values of 0.71 and 0.72, while using four bands yielded values of 0.79 and 0.73, respectively.
GPR with the Matern 5/2 kernel demonstrated superior performance in predicting SOC values. This kernel’s smoothness and flexibility allowed it to effectively capture the spatial dependencies and variability inherent in SOC data. GPR’s probabilistic nature provided not only accurate SOC estimates but also quantified the prediction uncertainties, a critical feature for applications in soil science where spatial variability can significantly impact model reliability. Additionally, GPR’s non-parametric approach enabled it to model complex, non-linear relationships between SOC and its covariates without assuming a specific functional form, thereby enhancing its predictive capability. The graphical comparison of predicted versus actual SOC values (Figure 7) when using the B and G and NIR bands with GPR confirmed the model’s high accuracy, illustrating its effectiveness in real-world applications.
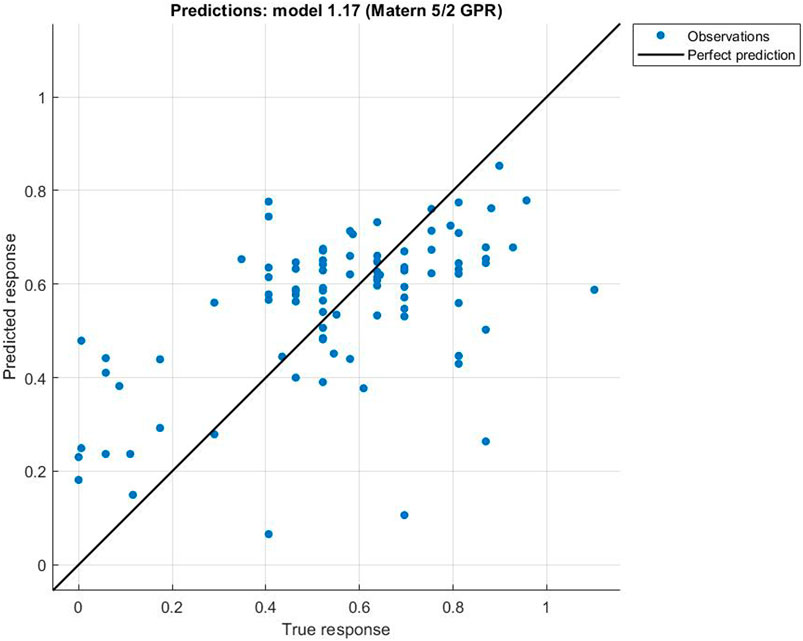
Figure 7. Predicted vs actual plot from the model of B and G and NIR bands.
ANNs, specifically the multilayer feedforward network, also showed strong predictive performance for SOC. While slightly less robust than GPR, ANN effectively captured the non-linear interactions among the variables, providing reliable SOC predictions. The regression charts for the training, validation, and testing processes (Figure 8) demonstrated the ANN model’s ability to generalize well across different datasets, underscoring its potential for SOC prediction. The ANN’s performance was particularly notable when using the same three-band combination (B and G and NIR), reinforcing the conclusion that this band configuration is optimal for SOC modeling.
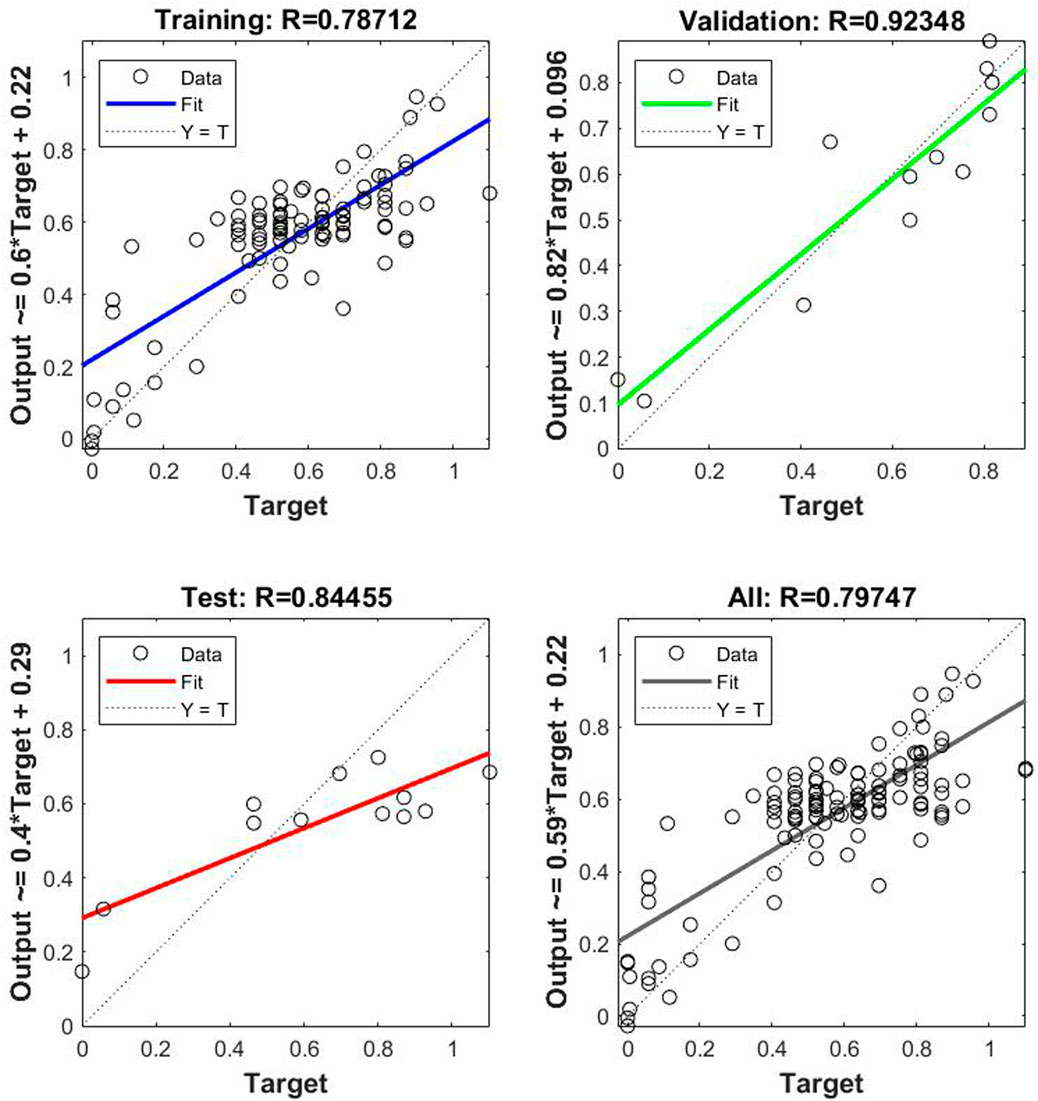
Figure 8. The regression chart for the training, validation, and testing processes from the model of B and G and NIR bands.
In summary, both GPR with the Matern 5/2 kernel and ANN with a multilayer feedforward network present powerful frameworks for SOC prediction, with GPR showing a slight edge due to its probabilistic outputs and ability to handle spatial variability effectively. The use of three bands (B and G and NIR) emerged as the most effective approach, providing the best balance of information for accurate and reliable SOC predictions. The R-squared value achieved with the Matern 5/2 kernel algorithm was 0.89, while the multilayer feedforward network attained an R-squared value of 0.84. These findings have significant implications for soil management and agricultural practices, offering robust tools for enhancing SOC estimation and contributing to sustainable land use strategies.
Comparing and validating the results of using ML and DL to predict SOC values from Landsat-8 satellite bands reveals significant insights into the efficacy of these methodologies. Previous research has established a strong correlation between soil reflectance and its characteristics, such as salt and moisture concentration, mineral composition, and overall moisture content (Bannari et al., 2008). Remote sensing emerges as a highly promising method for cost-effective and global SOC monitoring. However, studies that rely exclusively on satellite imagery have often been limited in scope. In this context, six relevant approaches were compared against the best model developed, which utilizes the blue (B), green (G), and Near Infrared (NIR) bands with the GPR Matern 5/2 kernel model. The methodologies for SOC prediction and mapping across these studies reveal diverse approaches: Our study uses Landsat-8 data, NDVI, and models like ANNs and GPR, achieving R2 values of 0.84 and 0.89, respectively, for accurate SOC modeling. In comparison, another study evaluates visible and Near Infrared (vis–NIR) hyperspectral data, finding proximal data more accurate than remote data through Partial Least Squares Regression (PLSR) (Gomez, et al., 2008). A third study employs EnMAP satellite data with semi-automatic Partial-Least-Squares (PLS) regression, showing slightly lower accuracy compared to airborne data but useful for regional mapping (Steinberg et al., 2016). The fourth article assesses various machine learning algorithms, highlighting Deep Neural Networks (DNN) as the most precise for SOC predictions (Wang et al., 2018). In semi-arid rangelands, high-resolution satellite data, seasonal fractional cover (SFC), and environmental variables used with Random Forest (RF) and Boosted Regression Trees (BRT) improve SOC stock predictions (Emadi et al., 2020). Another study uses Convolutional Neural Networks (CNN) with 10 years of MODIS phenology data, outperforming traditional models like Random Forest (RF) (Yang et al., 2021). Finally, Sentinel-2 time series data combined with Quantile Regression Forest (QRF) and Linear Mixed Effect Models (LMEM) emphasizes the importance of spatial components and optimized mosaicking for accurate SOC mapping (Castaldi et al., 2023). Overall, these studies demonstrate the progression from traditional methods to advanced machine learning and remote sensing techniques in SOC prediction. Descriptive statistics of these approaches, as shown in Table 6, indicate that while various methods have been suggested for determining SOC values from satellite bands, the proposed model with the B and G and NIR bands and the Matern 5/2 kernel stands out as more advanced, accurate, and reliable. This comparative validation underscores the superiority of integrating specific spectral bands and advanced kernel methods in enhancing the predictive accuracy of SOC values from satellite data.
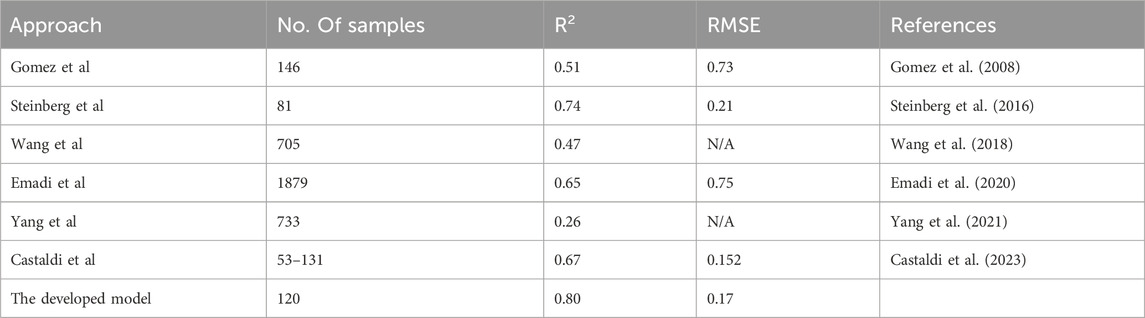
Table 6. Comparison with approaches.
Accurate and swift mapping of SOC is crucial due to its profound environmental implications (Radočaj et al., 2024; van Wesemael et al., 2023). To address this need, a comprehensive map representing SOC values throughout the study area has been generated by integrating remote sensing data and ANNs. This model incorporates data from the blue (B), green (G), and Near Infrared (NIR) spectral bands, in conjunction with the Matern 5/2 kernel model, to produce a detailed digital map of SOC for the study area, as shown in Figure 9. The predicted SOC map for the northeastern Nile Delta, adjacent to Damietta City, is essential for tracking temporal variations in soil carbon. It plays a key role in promoting sustainable land management, contributes to climate change mitigation by enhancing carbon sequestration, and guides policy-making. Furthermore, it offers a critical reference for future research and regional assessments, aligning with Egypt’s broader goals for sustainable development along the northern coast.
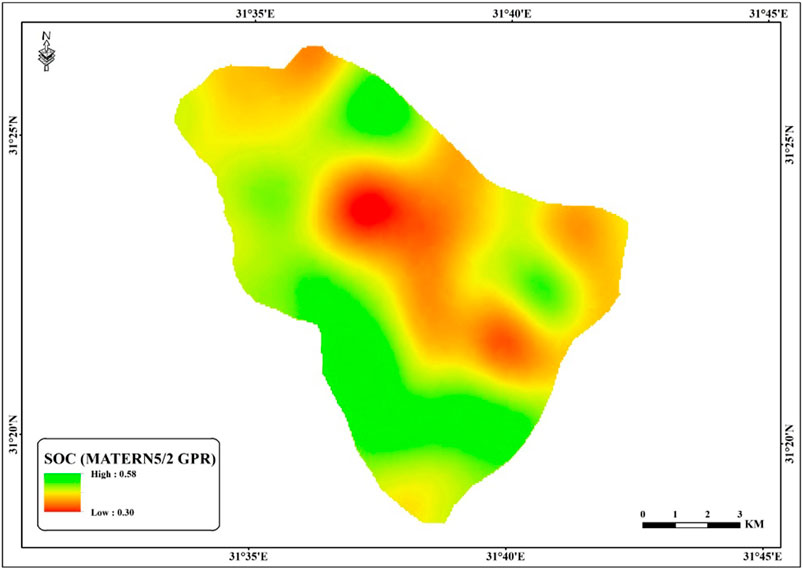
Figure 9. The anticipated digital map of SOC derived from the optimal model.
Due to the high cost and impracticality of generating geographically continuous data, monitoring soil organic carbon (SOC) traditionally relies on labor-intensive soil sampling and laboratory analysis. In this study, we present a novel model for predicting SOC using a combination of ML and remote sensing data from Landsat 8 OLI. Our ML algorithms were trained using data from the northeastern Nile Delta, near Damietta City, based on 120 surface soil samples. All spectral features derived from Landsat 8 OLI, particularly the B, G, R, and NIR bands, were initially employed as inputs for the model.
Specifically, GPR models, including Rational Quadratic, Squared Exponential, Matern 5/2, and Exponential kernels, were developed using the Regression Learner framework. Additionally, a multilayer feedforward neural network trained with the Levenberg-Marquardt algorithm (TRAINLM function) was used to create an SOC model. The findings indicate that both the GPR model with the Matern 5/2 kernel and the artificial neural network (ANN) with a multilayer feedforward structure are effective for SOC prediction, with the GPR model having a slight advantage due to its probabilistic outputs and ability to handle spatial variability. The use of three spectral bands (B, G, and NIR) was found to be the most effective, providing a strong balance of information for accurate and reliable SOC predictions. Comparative analysis of six different approaches against the developed model, which uses the B, G, and NIR bands with the GPR Matern 5/2 kernel, revealed that while numerous methods exist for SOC determination from satellite data, the proposed model is more advanced, accurate, and reliable. This underscores the effectiveness of integrating specific spectral bands with advanced kernel methods for enhanced SOC prediction. Further research should explore other interpolation algorithms within this region and assess the applicability of deep neural networks in other areas of Egypt with varying climates and agro-ecological conditions. Moreover, it is recommended to integrate artificial intelligence with more spatial resolution remote sensing images, such as the Sentinel 2 image, to enhance the geographic interpretation and prediction of SOC. This study marks a significant advance toward global, cost-effective, and efficient SOC monitoring. The successful integration of ML and satellite data for SOC estimation opens new avenues for future research and practical applications in environmental science and land management.
The original contributions presented in the study are included in the article/supplementary material, further inquiries can be directed to the corresponding author.
MG: Formal analysis, Writing-original draft. MA-H: Supervision, Writing–original draft, Writing–review and editing. AN: Supervision, Writing–review and editing. MK: Writing–original draft. EH: Data curation, Formal Analysis, Methodology, Writing–original draft. FB: Project administration, Writing–original draft. MS: Conceptualization, Data curation, Formal Analysis, Investigation, Methodology, Writing–original draft, Writing–review and editing. ME: Conceptualization, Data curation, Formal Analysis, Investigation, Methodology, Resources, Validation, Writing–original draft, Writing–review and editing. EM: Supervision, Writing–original draft, Writing–review and editing.
The author(s) declare that financial support was received for the research, authorship, and/or publication of this article. The authors would like to declare that the funding of the study has been supported by Princess Nourah bint Abdulrahman University Researchers Supporting Project number (PNURSP 2024R675), Princess Nourah bint Abdulrahman University, Riyadh, Saudi Arabia.
The authors would like to thank the National Authority for Remote Sensing and Space Science (NARSS) for funding the field survey and remote sensing work. The authors would like to thank the Soil Science Dept., Faculty of Agriculture, Zigzag Univ., Egypt, for supervising this work and for sample analysis. The authors would like to extend their sincere appreciation to the Princess Nourah bint Abdulrahman University Researchers Supporting Project number (PNURSP 2024R675), Princess Nourah bint Abdulrahman University, Riyadh, Saudi Arabia. This paper was supported by the RUDN University Strategic Academic Leadership Program.
The authors declare that the research was conducted in the absence of any commercial or financial relationships that could be construed as a potential conflict of interest.
All claims expressed in this article are solely those of the authors and do not necessarily represent those of their affiliated organizations, or those of the publisher, the editors and the reviewers. Any product that may be evaluated in this article, or claim that may be made by its manufacturer, is not guaranteed or endorsed by the publisher.
Abdellatif, M. A., Hassan, F. O., Rashed, H. S., El Baroudy, A. A., Mohamed, E. S., Kucher, D. E., et al. (2023). Assessing soil organic carbon pool for potential climate-change mitigation in agricultural soils—a case study fayoum depression, Egypt. Land 12 (9), 1755. doi:10.3390/land12091755
Adeniyi, O. D., Brenning, A., and Maerker, M. (2024). Spatial prediction of soil organic carbon: combining machine learning with residual kriging in an agricultural lowland area (Lombardy region, Italy). Geoderma 448, 116953. doi:10.1016/j.geoderma.2024.116953
Ahmed, H. M., Mohamed, E. A., and Bahaa, S. A. (2023). Evaluating two numerical methods for developing a local geoid model and a local digital elevation model for the Red Sea Coast, Egypt. J. King Saud University-Engineering Sci. 35 (6), 384–392. doi:10.1016/j.jksues.2021.04.004
Allory, V., Cambou, A., Moulin, P., Schwartz, C., Cannavo, P., Vidal-Beaudet, L., et al. (2019). Quantification of soil organic carbon stock in urban soils using visible and near infrared reflectance spectroscopy (VNIRS) in situ or in laboratory conditions. Sci. total Environ. 686, 764–773. doi:10.1016/j.scitotenv.2019.05.192
Angelopoulou, T., Tziolas, N., Balafoutis, A., Zalidis, G., and Bochtis, D. (2019). Remote sensing techniques for soil organic carbon estimation: a review. Remote Sens. 11 (6), 676. doi:10.3390/rs11060676
Bannari, A., Guedon, A. M., El Harti, A., Cherkaoui, F. Z., and El Ghmari, A. (2008). Characterization of slightly and moderately saline and sodic soils in irrigated agricultural land using simulated data of advanced land imaging (EO-1) sensor. Commun. soil Sci. plant analysis 39 (19-20), 2795–2811. doi:10.1080/00103620802432717
Benedet, L., Faria, W. M., Silva, S. H. G., Mancini, M., Demattê, J. A. M., Guilherme, L. R. G., et al. (2020). Soil texture prediction using portable X-ray fluorescence spectrometry and visible near-infrared diffuse reflectance spectroscopy. Geoderma 376, 114553. doi:10.1016/j.geoderma.2020.114553
Biswas, A., and Si, B. C. (2013). Model averaging for semivariogram model parameters. Adv. agrophysical Res. 4, 81–96. doi:10.5772/52339
Bouasria, A., Namr, K. I., Rahimi, A., and Ettachfini, E. M. (2020). “Soil organic matter estimation by using Landsat-8 pansharpened image and machine learning,” in 2020 Fourth International Conference On Intelligent Computing in Data Sciences (ICDS), USA, October 21-22-23, 2020 (IEEE), 1–8.
Cambardella, C. A., Moorman, T. B., Novak, J. M., Parkin, T. B., Karlen, D. L., Turco, R. F., et al. (1994). Field scale variability of soil properties in central Iowa soils. Soil Sci. Soc. Am. J. 58 (5), 1501–1511. doi:10.2136/sssaj1994.03615995005800050033x
Castaldi, F., Koparan, M. H., Wetterlind, J., Žydelis, R., Vinci, I., Savaş, A. Ö., et al. (2023). Assessing the capability of Sentinel-2 time-series to estimate soil organic carbon and clay content at local scale in croplands. ISPRS J. Photogrammetry Remote Sens. 199, 40–60. doi:10.1016/j.isprsjprs.2023.03.016
Chenchouni, H., and Neffar, S. (2022). Soil organic carbon stock in arid and semi-arid steppe rangelands of North Africa. Catena 211, 106004. doi:10.1016/j.catena.2021.106004
Chinilin, A. V., Vindeker, G. V., and Savin, I. Y. (2023). Vis-NIR spectroscopy for soil organic carbon assessment: a meta-analysis. Eurasian Soil Sci. 56 (11), 1605–1617. doi:10.1134/s1064229323601841
de Castro Padilha, M. C., Vicente, L. E., Demattê, J. A., Loebmann, D. G. D. S. W., Vicente, A. K., Salazar, D. F., et al. (2020). Using Landsat and soil clay content to map soil organic carbon of oxisols and Ultisols near São Paulo, Brazil. Geoderma Reg. 21, e00253. doi:10.1016/j.geodrs.2020.e00253
Demattê, J. A., Sayão, V. M., Rizzo, R., and Fongaro, C. T. (2017). Soil class and attribute dynamics and their relationship with natural vegetation based on satellite remote sensing. Geoderma 302, 39–51. doi:10.1016/j.geoderma.2017.04.019
El-Gammal, M. I., Ali, R. R., and Eissa, R. (2014). Land use assessment of barren areas in Damietta Governorate, Egypt using remote sensing. Egypt. J. Basic Appl. Sci. 1 (3-4), 151–160. doi:10.1016/j.ejbas.2014.07.002
Ellert, B. H., Janzen, H. H., VandenBygaart, A. J., and Bremer, E. (2007). Measuring change in soil organic carbon storage. Soil Sampl. methods analysis, 25–38. doi:10.1201/9781420005271
Elshewy, M. A., Mohamed, M. H., and Refaat, M. (2024). Developing a soil salinity model from landsat 8 satellite bands based on advanced machine learning algorithms. J. Indian Soc. Remote Sens. 52 (3), 617–632. doi:10.1007/s12524-024-01841-1
Emadi, M., Taghizadeh-Mehrjardi, R., Cherati, A., Danesh, M., Mosavi, A., and Scholten, T. (2020). Predicting and mapping of soil organic carbon using machine learning algorithms in Northern Iran. Remote Sens. 12 (14), 2234. doi:10.3390/rs12142234
Farbo, A., Trombetta, N. G., de Palma, L., and Borgogno-Mondino, E. (2024). Estimation of intercepted solar radiation and stem water potential in a table grape vineyard covered by plastic film using sentinel-2 data: a comparison of OLS-MLR-and ML-based methods. Plants 13 (9), 1203. doi:10.3390/plants13091203
Fontana, M., Johannes, A., Zaccone, C., Weisskopf, P., Guillaume, T., Bragazza, L., et al. (2023). Improving crop nutrition, soil carbon storage and soil physical fertility using ramial wood chips. Environ. Technol. and Innovation 31, 103143. doi:10.1016/j.eti.2023.103143
Gao, L., Wang, X., Johnson, B. A., Tian, Q., Wang, Y., Verrelst, J., et al. (2020). Remote sensing algorithms for estimation of fractional vegetation cover using pure vegetation index values: a review. ISPRS J. Photogrammetry Remote Sens. 159, 364–377. doi:10.1016/j.isprsjprs.2019.11.018
Gholizadeh, A., Neumann, C., Chabrillat, S., van Wesemael, B., Castaldi, F., Borůvka, L., et al. (2021). Soil organic carbon estimation using VNIR–SWIR spectroscopy: the effect of multiple sensors and scanning conditions. Soil Tillage Res. 211, 105017. doi:10.1016/j.still.2021.105017
Gomez, C., Chevallier, T., Moulin, P., Bouferra, I., Hmaidi, K., Arrouays, D., et al. (2020). Prediction of soil organic and inorganic carbon concentrations in Tunisian samples by mid-infrared reflectance spectroscopy using a French national library. Geoderma 375, 114469. doi:10.1016/j.geoderma.2020.114469
Gomez, C., Rossel, R. A. V., and McBratney, A. B. (2008). Soil organic carbon prediction by hyperspectral remote sensing and field vis-NIR spectroscopy: an Australian case study. Geoderma 146 (3-4), 403–411. doi:10.1016/j.geoderma.2008.06.011
Hammam, A. A., Mohamed, W. S., Sayed, S. E. E., Kucher, D. E., and Mohamed, E. S. (2022). Assessment of soil contamination using gis and multi-variate analysis: a case study in El-Minia Governorate, Egypt. Agronomy 12 (5), 1197. doi:10.3390/agronomy12051197
Houghton, R. A. (2007). Balancing the global carbon budget. Annu. Rev. Earth Planet. Sci. 35 (1), 313–347. doi:10.1146/annurev.earth.35.031306.140057
Islam, K., Singh, B., and McBratney, A. (2003). Simultaneous estimation of several soil properties by ultra-violet, visible, and near-infrared reflectance spectroscopy. Soil Res. 41 (6), 1101–1114. doi:10.1071/sr02137
Jiménez-Lao, R., Aguilar, F. J., Nemmaoui, A., and Aguilar, M. A. (2020). Remote sensing of agricultural greenhouses and plastic-mulched farmland: an analysis of worldwide research. Remote Sens. 12 (16), 2649. doi:10.3390/rs12162649
Kattenborn, T., Leitloff, J., Schiefer, F., and Hinz, S. (2021). Review on convolutional neural networks (CNN) in vegetation remote sensing. ISPRS J. photogrammetry remote Sens. 173, 24–49. doi:10.1016/j.isprsjprs.2020.12.010
Khanal, S., Fulton, J., Klopfenstein, A., Douridas, N., and Shearer, S. (2018). Integration of high resolution remotely sensed data and machine learning techniques for spatial prediction of soil properties and corn yield. Comput. Electron. Agric. 153, 213–225. doi:10.1016/j.compag.2018.07.016
Köchy, M., Hiederer, R., and Freibauer, A. (2015). Global distribution of soil organic carbon–Part 1: masses and frequency distributions of SOC stocks for the tropics, permafrost regions, wetlands, and the world. Soil 1 (1), 351–365. doi:10.5194/soil-1-351-2015
Lal, R. (2004). Soil carbon sequestration impacts on global climate change and food security. science 304 (5677), 1623–1627. doi:10.1126/science.1097396
Lal, R. (2019). Accelerated soil erosion as a source of atmospheric CO2. Soil Tillage Res. 188, 35–40. doi:10.1016/j.still.2018.02.001
Leon, C. T., Shaw, D. R., Cox, M. S., Abshire, M. J., Ward, B., Wardlaw, M. C., et al. (2003). Utility of remote sensing in predicting crop and soil characteristics. Precis. Agric. 4, 359–384. doi:10.1023/a:1026387830942
Li, H., Van den Bulcke, J., Mendoza, O., Deroo, H., Haesaert, G., Dewitte, K., et al. (2022). Soil texture controls added organic matter mineralization by regulating soil moisture—evidence from a field experiment in a maritime climate. Geoderma 410, 115690. doi:10.1016/j.geoderma.2021.115690
Li, J., Pei, Y., Zhao, S., Xiao, R., Sang, X., and Zhang, C. (2020). A review of remote sensing for environmental monitoring in China. Remote Sens. 12 (7), 1130. doi:10.3390/rs12071130
Mahmoudzadeh, H., Matinfar, H. R., Taghizadeh-Mehrjardi, R., and Kerry, R. (2020). Spatial prediction of soil organic carbon using machine learning techniques in western Iran. Geoderma Reg. 21, e00260. doi:10.1016/j.geodrs.2020.e00260
Mäkipää, R., Häkkinen, M., Muukkonen, P., and Peltoniemi, M. (2008). The costs of monitoring changes in forest soil carbon stocks. Boreal Env. Res. 13 (suppl. B), 120–130.
Minasny, B., Malone, B. P., McBratney, A. B., Angers, D. A., Arrouays, D., Chambers, A., et al. (2017). Soil carbon 4 per mille. Geoderma 292, 59–86. doi:10.1016/j.geoderma.2017.01.002
Mohamed, E. S., Baroudy, A. A. E., El-Beshbeshy, T., Emam, M., Belal, A. A., Elfadaly, A., et al. (2020). Vis-nir spectroscopy and satellite landsat-8 oli data to map soil nutrients in arid conditions: a case study of the northwest coast of Egypt. Remote Sens. 12 (22), 3716. doi:10.3390/rs12223716
Mustafa, A. R. A., Abdelsamie, E. A., Mohamed, E. S., Rebouh, N. Y., and Shokr, M. S. (2024). Modeling of soil cation exchange capacity based on chemometrics, various spectral transformations, and multivariate approaches in some soils of arid zones. Sustainability 16 (16), 7002. doi:10.3390/su16167002
Muster, S., Langer, M., Abnizova, A., Young, K. L., and Boike, J. (2015). Spatio-temporal sensitivity of MODIS land surface temperature anomalies indicates high potential for large-scale land cover change detection in Arctic permafrost landscapes. Remote Sens. Environ. 168, 1–12. doi:10.1016/j.rse.2015.06.017
Orusa, T., Viani, A., and Borgogno-Mondino, E. (2024). Earth observation data and geospatial deep learning AI to assign contributions to European municipalities Sen4MUN: an empirical application in Aosta Valley (NW Italy). Land 13 (1), 80. doi:10.3390/land13010080
Otto, S. A., Kadin, M., Casini, M., Torres, M. A., and Blenckner, T. (2018). A quantitative framework for selecting and validating food web indicators. Ecol. Indic. 84, 619–631. doi:10.1016/j.ecolind.2017.05.045
Overpeck, J. T., Meehl, G. A., Bony, S., and Easterling, D. R. (2011). Climate data challenges in the 21st century. science 331 (6018), 700–702. doi:10.1126/science.1197869
Parvizi, Y., and Heshmati, M. (2015). Detection of the effects of management and physical factors on forest soil carbon stock variability in semiarid conditions using parametric and nonparametric methods. J. For. Sci. (Prague). 61, 448–455. doi:10.17221/26/2015-jfs
Pavlovic, M., Ilic, S., Ralevic, N., Antonic, N., Raffa, D. W., Bandecchi, M., et al. (2024). A deep learning approach to estimate soil organic carbon from remote sensing. Remote Sens. 16 (4), 655. doi:10.3390/rs16040655
Pérez-Planells, L., Delegido, J., Rivera-Caicedo, J. P., and Verrelst, J. (2015). Análisis de métodos de validación cruzada para la obtención robusta de parámetros biofísicos. Rev. Teledetección (44), 55–65. doi:10.4995/raet.2015.4153
Poppiel, R. R., da Silveira Paiva, A. F., and Demattê, J. A. M. (2022). Bridging the gap between soil spectroscopy and traditional laboratory: insights for routine implementation. Geoderma 425, 116029. doi:10.1016/j.geoderma.2022.116029
Radočaj, D., Gašparović, M., and Jurišić, M. (2024). Open remote sensing data in digital soil organic carbon mapping: a review. Agriculture 14 (7), 1005. doi:10.3390/agriculture14071005
Raiesi, F. (2021). The quantity and quality of soil organic matter and humic substances following dry-farming and subsequent restoration in an upland pasture. Catena 202, 105249. doi:10.1016/j.catena.2021.105249
Ribeiro, S. G., Teixeira, A. D. S., de Oliveira, M. R. R., Costa, M. C. G., Araújo, I. C. D. S., Moreira, L. C. J., et al. (2021). Soil organic carbon content prediction using soil-reflected spectra: a comparison of two regression methods. Remote Sens. 13 (23), 4752. doi:10.3390/rs13234752
Rossel, R. V., Walvoort, D. J. J., McBratney, A. B., Janik, L. J., and Skjemstad, J. O. (2006). Visible, near infrared, mid infrared or combined diffuse reflectance spectroscopy for simultaneous assessment of various soil properties. Geoderma 131 (1-2), 59–75. doi:10.1016/j.geoderma.2005.03.007
Rukun, L. J. C. A. S. (1999). Analytical methods for soil and agricultural chemistry. Beijing, China: China Agricultural Science and Technology Press.
Schumacher, B. A. (2002). “Methods for the determination of total organic carbon (TOC) in soils and sediments,” in US environmental protection agency, office of research and development (Washington, DC: Ecological Risk Assessment Support Center), 1–23.
Sithole, N. J., Ncama, K., Magwaza, L. S. J. C., and agriculture, e. i. (2018). Robust Vis-NIRS models for rapid assessment of soil organic carbon and nitrogen in Feralsols Haplic soils from different tillage management practices. Comput. Electron. Agric. 153, 295–301. doi:10.1016/j.compag.2018.08.036
Steinberg, A., Chabrillat, S., Stevens, A., Segl, K., and Foerster, S. (2016). Prediction of common surface soil properties based on Vis-NIR airborne and simulated EnMAP imaging spectroscopy data: prediction accuracy and influence of spatial resolution. Remote Sens. 8 (7), 613. doi:10.3390/rs8070613
Sun, W., Zhang, X., Sun, X., Sun, Y., and Cen, Y. (2018). Predicting nickel concentration in soil using reflectance spectroscopy associated with organic matter and clay minerals. Geoderma 327, 25–35. doi:10.1016/j.geoderma.2018.04.019
Tucker, C. J. (1977). Use of near infrared/red radiance ratios for estimating vegetation biomass and physiological status. Greenbelt, Md., United States: NASA/GSFC (No. X-923-77-183).
van Wesemael, B., Chabrillat, S., Sanz Dias, A., Berger, M., and Szantoi, Z. (2023). Remote sensing for soil organic carbon mapping and monitoring. Remote Sens. 15 (14), 3464. doi:10.3390/rs15143464
Van Wittenberghe, S., Verrelst, J., Rivera, J. P., Alonso, L., Moreno, J., and Samson, R. (2014). Gaussian processes retrieval of leaf parameters from a multi-species reflectance, absorbance and fluorescence dataset. J. Photochem. Photobiol. B Biol. 134, 37–48. doi:10.1016/j.jphotobiol.2014.03.010
Viscarra Rossel, R. A., Lee, J., Behrens, T., Luo, Z., Baldock, J., and Richards, A. (2019). Continental-scale soil carbon composition and vulnerability modulated by regional environmental controls. Nat. Geosci. 12 (7), 547–552. doi:10.1038/s41561-019-0373-z
Wang, B., Waters, C., Orgill, S., Gray, J., Cowie, A., Clark, A., et al. (2018). High resolution mapping of soil organic carbon stocks using remote sensing variables in the semi-arid rangelands of eastern Australia. Sci. Total Environ. 630, 367–378. doi:10.1016/j.scitotenv.2018.02.204
Wang, S., Fan, J., Zhong, H., Li, Y., Zhu, H., Qiao, Y., et al. (2019). A multi-factor weighted regression approach for estimating the spatial distribution of soil organic carbon in grasslands. Catena 174, 248–258. doi:10.1016/j.catena.2018.10.050
Williams, C. K., and Rasmussen, C. E. (2006). Gaussian processes for machine learning, 2. Cambridge, MA, USA: Massachusetts Institute of Technology Publishing.
Yang, L., Cai, Y., Zhang, L., Guo, M., Li, A., and Zhou, C. (2021). A deep learning method to predict soil organic carbon content at a regional scale using satellite-based phenology variables. Int. J. Appl. Earth Observation Geoinformation 102, 102428. doi:10.1016/j.jag.2021.102428
Keywords: machine learning, SOC, drylands, landsat 8 OLI, soil management
Citation: Gouda M, Abu-hashim M, Nassrallah A, Khalil MN, Hendawy E, benhasher FF, Shokr MS, Elshewy MA and Mohamed Es (2024) Integration of remote sensing and artificial neural networks for prediction of soil organic carbon in arid zones. Front. Environ. Sci. 12:1448601. doi: 10.3389/fenvs.2024.1448601
Received: 13 June 2024; Accepted: 09 September 2024;
Published: 23 September 2024.
Edited by:
Tommaso Orusa, University of Turin, ItalyReviewed by:
Alessandro Farbo, University of Turin, ItalyCopyright © 2024 Gouda, Abu-hashim, Nassrallah, Khalil, Hendawy, benhasher, Shokr, Elshewy and Mohamed. This is an open-access article distributed under the terms of the Creative Commons Attribution License (CC BY). The use, distribution or reproduction in other forums is permitted, provided the original author(s) and the copyright owner(s) are credited and that the original publication in this journal is cited, in accordance with accepted academic practice. No use, distribution or reproduction is permitted which does not comply with these terms.
*Correspondence: Mohamed S. Shokr, bW9oYW1lZF9zaG9rckBhZ3IudGFudGEuZWR1LmVn
Disclaimer: All claims expressed in this article are solely those of the authors and do not necessarily represent those of their affiliated organizations, or those of the publisher, the editors and the reviewers. Any product that may be evaluated in this article or claim that may be made by its manufacturer is not guaranteed or endorsed by the publisher.
Research integrity at Frontiers
Learn more about the work of our research integrity team to safeguard the quality of each article we publish.