 Klaudia Halászová
 Lenka Lackóová
 Thomas Panagopoulos
- 1Institute of Landscape Engineering, Faculty of Horticulture and Landscape Engineering, Slovak University of Agriculture, Nitra, Slovakia
- 2Faculty of Science and Technology, University of Algarve, Campus de Gambelas, Faro, Portugal
Understanding long-term changes in topography and topsoil grain composition is crucial for the management of agricultural landscapes, especially in areas prone to wind erosion. This study investigates long-term changes in topography and topsoil grain composition within an agricultural landscape in south-western Slovakia. To analyse topographic changes over time, we used high-precision positioning measurements and airborne laser scanning to create digital terrain models (DTM) for the years 2011, 2017 and 2020. To assess changes in soil grain composition, we performed grain size analyses on soil samples collected during three different periods: M1 (1961–1970), M2 (2009–2015) and M3 (2015–2016). Changes in soil texture were evaluated to understand the impact of wind erosion on soil composition. The influence of windbreaks was also analysed by comparing the accumulation and deflation processes. The results showed significant changes in both topography and soil texture over the study period. The DTMs showed marked differences in the accumulation and deflation processes, highlighting areas affected by wind erosion. Comparisons of soil samples showed a shift in dominant soil types from loam and clay loam to silty loam, highlighting the effects of wind erosion. Analysis revealed a decrease in clay and silt content and an increase in sand content, indicating wind-induced soil degradation. The presence of windbreaks played a crucial role in reducing soil erosion by reducing wind speed, promoting soil accumulation and stabilising the landscape up to 80 m windward and 20 m leeward. The study highlights the complex interplay of climate and wind factors in shaping topography and soil properties and emphasises the protective role of windbreaks in agricultural landscapes over time. Our results show that wind erosion significantly alters soil texture, which can affect agricultural productivity. However, windbreaks have proven to be an effective measure in reducing soil erosion and maintaining soil quality.
1 Introduction
Wind erosion is a key geomorphic process that shapes our agricultural landscapes, influences soil quality and affects ecosystem health. Aeolian processes include the effects of wind on a sedimentary surface, including erosion, sand transport and deposition (Durán et al., 2011). Changes in topsoil grain composition are critical (Li et al., 2009) for understanding soil health and erosion dynamics in agricultural landscapes. These changes can significantly affect soil fertility, structure and water-holding capacity, thereby affecting crop productivity. Wind erosion tends to remove finer particles such as silt and clay from the topsoil, leaving behind coarser sand particles, thereby altering soil texture (Lyles and Tatarko, 1986). The redistribution of soil particles by wind can also create heterogeneous soil patterns across a landscape, with some areas accumulating finer sediments, increasing their fertility, while others are depleted (Liu et al., 2020). These changes in grain composition can affect soil physical properties such as porosity, permeability and bulk density (Du et al., 2018). As a result, areas experiencing significant topsoil loss may suffer from increased compaction and reduced root penetration, which can adversely affect plant growth (Duniway et al., 2019). Despite extensive research, knowledge gaps remain regarding the long-term effects and mitigation strategies of wind erosion, particularly in agricultural settings. In the context of an increasingly variable climate with longer dry spells, temperate zones in Europe are now facing increasing concerns about wind erosion (Böhner et al., 2004; Mezősi et al., 2016; Négyesi et al., 2019; Laino and Iglesias, 2024). For example, Slovakia shows a range of susceptibility percentages, suggesting a complex interplay between climate and erosion potential (Borrelli et al., 2016a). Numerous studies (Li et al., 2022; Dahanayake et al., 2024; He and Shao, 2024) have shown that vegetation is the most effective roughness agent in mitigating aeolian erosion by shielding the surface, reducing wind speeds and trapping soil particles (Hong et al., 2020). Windbreaks, shelterbelts, hedgerows, timber strips, tree belts and linear woody features serve as primary components to shape rural landscapes and influence their functionality in variety of ways. For centuries, these structural elements, such as windbreaks and shelterbelts, have been used worldwide to mitigate the effects of wind erosion by significantly reducing wind speed and preventing erosion (Vacek et al., 2018). Land use has a critical influence on wind erosion (Zhou et al., 2020) by affecting vegetation cover and soil roughness, which in turn affect wind flow (Hesp et al., 2019). Topography is also an important factor influencing wind erosion (Zhou et al., 2020), and the long-term wind erosion process can affect the topography of the area. However, few studies have measured and modelled topographic changes in agricultural fields due to wind erosion. Quantifying the transport of soil particles by wind is challenging due to significant temporal and spatial variability in mass fluxes. Typically, erosion and deposition are measured using a mass balance approach, where sediment input and output are calculated at the boundaries of the study area. If input exceeds output, accumulation occurs; if output exceeds input, deflation occurs. A zero balance indicates no net change, meaning only transport with no gain or loss of soil particles (Smyth et al., 2019). The precise measurement and correlation of the two basic processes of soil accumulation and deflation and the resulting topographic change are not yet fully understood (Visser et al., 2004). Incorporating measures of topographic change, such as total volume change and changes in topographic roughness, provides more robust evidence of sediment movement, independent of overall sediment gains or losses within the area of interest (Caster et al., 2024). The influence of wind erosion and topographic context significantly exacerbates the variation in soil properties (Tuo et al., 2023). The use of UAV-based LiDAR and photogrammetry can be used to produce high resolution topographic models in combination with high resolution satellite imagery to quantify sand source areas (Solazzo et al., 2018). Once DEM data are acquired, volumes of small or large dune complexes can be easily calculated using standard GIS software. By performing spatial analysis on DEMs from different dates, morphometric changes over time can be quantified. This approach allows for the reconstruction of volumetric changes in land surfaces caused by different geomorphic processes (Schmid et al., 2022). According to the study (Smyth et al., 2019), wind speed showed a strong correlation with overall topographic change, while vertical wind speed, both up and down, was significantly associated with negative topographic change (erosion). These results emphasise the crucial role of wind dynamics in shaping agricultural landscapes over time. Despite these advances, there are still significant knowledge gaps that need to be addressed, particularly in the long-term monitoring and analysis of changes in topography and topsoil grain composition. Few studies have focused on these aspects, highlighting the need for further research to fully understand the dynamics of wind erosion in agricultural landscapes. This paper aims to address these knowledge gaps by providing a long-term evaluation of topographic, topsoil grain composition changes and the protective effect of single row windbreak in an agricultural landscape using advanced remote sensing techniques and spatial analysis.
2 Material and methods
The study area is located in the south-western part of Slovakia (Figure 1) and is characterised by a continental climate with significant temperature fluctuations throughout the year, with an average of 50 summer days per year. The average annual temperature is 9.8°C. The average annual precipitation is about 600–700 mm. Rainfall is irregular, with higher levels in summer compared to spring and autumn. The average humidity is 80% and there are about 90 days of frost per year. The area also experiences strong winds with high rates of aeolian sediment transport. The average annual wind speed is 3.1 m/s and the maximum wind speed is 17.9 m/s. The total area of the study area is 4637.37 ha and the study area is 22.61 ha.
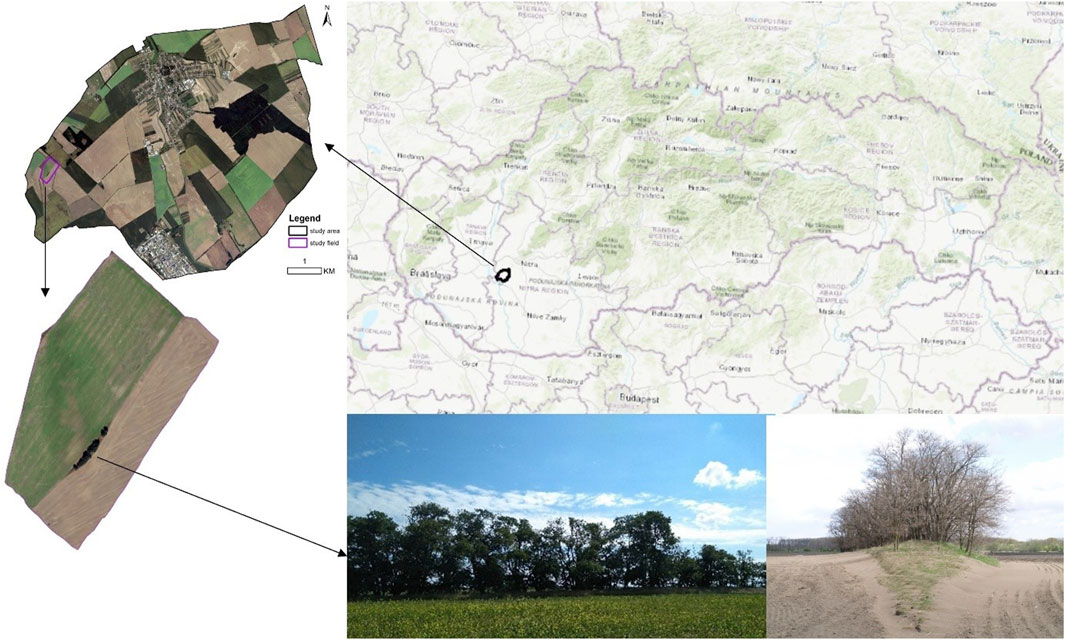
Figure 1. Study area and the study field in district Šaľa, cadastral area Močenok, Slovakia.
2.1 Wind rose diagram and analysis of regional wind regime
The wind regime is a critical factor influencing soil erosion and sediment transport in agricultural landscapes. To better understand the dynamics of wind erosion in Močenok, Šaľa district, Slovakia, we analysed the regional wind regime, including wind speed, direction and seasonal variations. The wind rose diagram (Figure 2) illustrates the frequency and intensity of winds from different directions, based on meteorological data collected over the last 60 years. The wind rose diagram shows that the prevailing winds in Močenok come mainly from the northwest (NW) and north-northwest (NNW) directions. Secondary winds are observed from the east-northeast (ENE) direction. This pattern suggests that the region experiences significant wind activity from the northwest, which affects soil erosion and sediment transport.
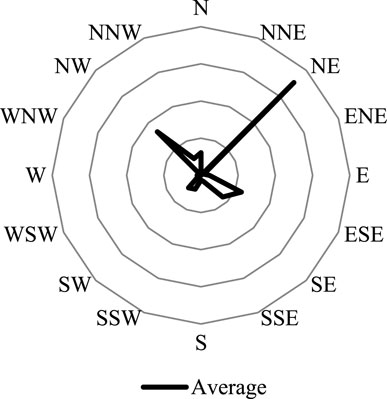
Figure 2. Wind rose diagram - Močenok (1961–2021).
The trend of mean maximum (Umaxmean) and mean (Umean) wind speeds in Močenok from 1961 to 2021 is shown in Figure 3. The Umaxmean shows a significant decrease from the early 1960s until about 1980, after which it stabilizes with some fluctuations. The Umean remains relatively constant throughout the period, indicating that while extreme wind events have decreased over time, the average wind conditions have not changed significantly.
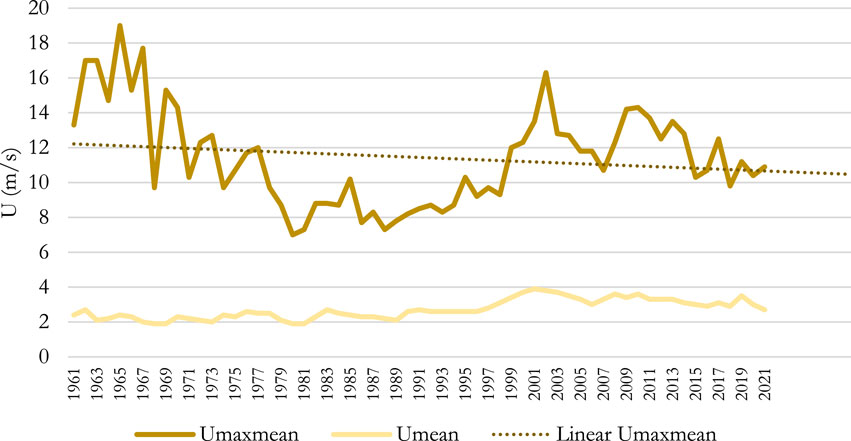
Figure 3. The trends of Umean and Umaxmean frequency in the study area.
According to research of [25], wind erosion events occur in Slovakia when the wind speed exceeds 5 m/s. Figure 4 shows that the frequency of erosive winds (winds exceeding 5 m/s) in Močenok from 1961 to 2021 is relatively low from January to March. From April to June, the frequency gradually increases, peaking in July This high frequency persists through August and September before declining from October onwards, reaching the lowest levels in December.
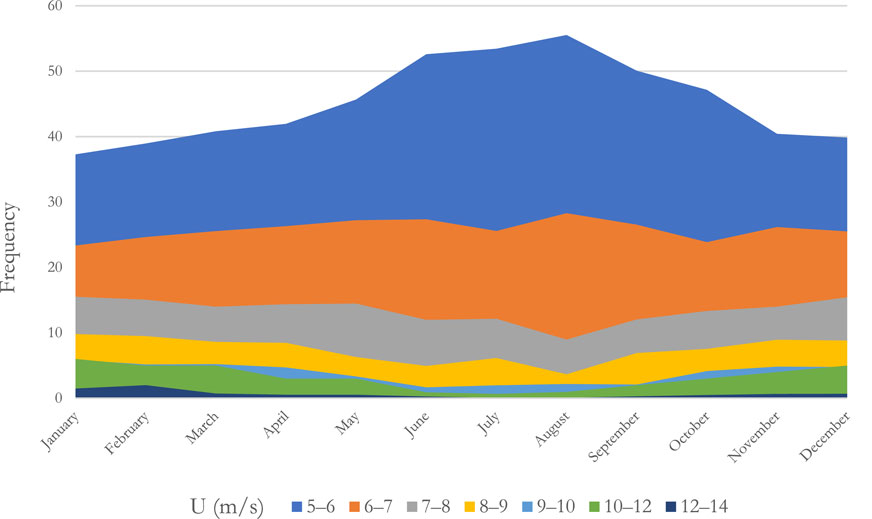
Figure 4. The frequency of monthly erodibility winds occurrence (1961–2021).
2.1.1 Windbreak parameters
The windbreak, which also plays an important role in altering the topography of the study area, is located in the centre of the study area with a length of 140 m, a width of 12–24 m and a height of 7.9–12.6 m. It is a single-row windbreak with 3 zones (herbaceous, shrubby and tree). The main tree and shrub species used in the windbreak are Gleditsia triacanthos, Robinia pseudoacacia, Cormus domestica, Fraxinus excelsior, Prunus avium, Crataegus laevigata, Euonymus verrucosus and Rosa canina. We took detailed photographs of the windbreaks in the autumn of 2011/2012/2017 and 2022. Using these field photographs, we assessed the optical transmittance of linear strips of vegetation using a Python script. This process involved counting black and white pixels in the photographs (Figure 5) and converting these counts into percentages. Based on these percentages, the data were classified into one of three categories (permeable, semi-permeable and non-permeable), all of which were classified as semi-permeable, ranging from 36%–48%.
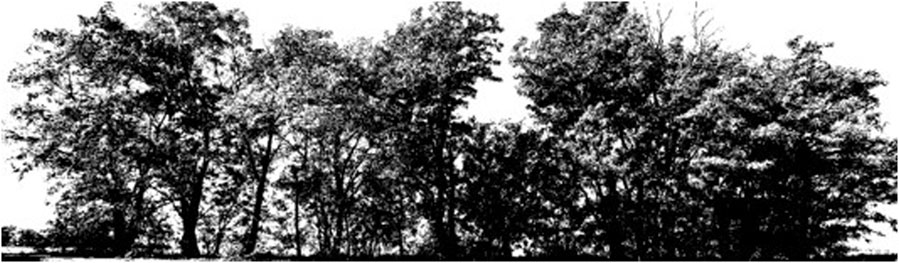
Figure 5. Black and white picture of windbreak.
2.1.2 Soil grain composition
Soil grain composition was analysed throughout the whole study area. The area is typical of predominantly clay, clay loam and clay loam soils (based on USDA soil classification system). The clay content ranges from 7.5% to 24.9%. The dust fraction >30% is also significantly represented. Grain size analyses were performed by comparing 3 temporal patterns of a) M1: 1961–1970 (Balkovič et al., 2010) (M1), b) M2: 2009–2015 (Ballabio et al., 2016) and c) M3: 2015–2016 to evaluate changes in grain size characteristics due to long-term wind erosion in the landscape using GIS analysis. Data generated from the profile of sand and clay content in the A horizon of a selection of probes from the Comprehensive Survey of Agricultural Soils (Balkovič et al., 2010) (a total of 16,264 georeferenced probes) were used to analyse the “historical” grain size composition of soils in the areas of interest. Regression kriging was used for interpolation (Figure 6).
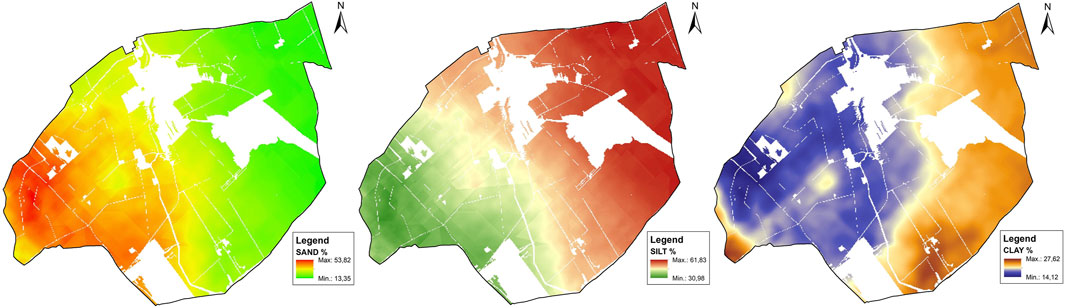
Figure 6. Digital models of sand, silt and clay fractions within study area.
The spatial model from (Ballabio et al., 2016) - European Soil Database mapping is available and can be freely downloaded from the JRC, ESDAC website http://esdac.jrc.ec.europa.eu/content/european-soil-database-derived-data. Sample probes were selected in the study area where we compared changes in sand (2–0.05 mm), silt (0.05–0.002 mm) and clay (<0.002 mm) fractions over the given time periods. Based on these data, sand, silt and clay fraction values were determined for each selected probe using zonal statistics (ArcToolbox - Spatial Analyst Tools - Zonal - Zonal Statistics as Table) in ArcMap 10.2.2. A model of sand and clay distribution was calculated for a grid with a cell size of 20 m.
2.2 Topographic data collection and analysis
In order to determine the height of the study area from the individual measured points (in 2011 and 2020), the Real-Time Kinematic (RTK) Global Navigation Satellite Systems (GNSS) method with connection to the state network SK POS (Slovakia Positioning Service), device FOIF GNSS A30 (high-performance GNSS receiver used for geospatial data collection, which supports multiple satellite constellations) was used. The accuracy characteristics of the determination of the position and height of the detailed points are characterised by the maximum values mp = 0.06 m, mH = 0.10 m. The spatial resolution cell size of the final DTM raster was 1 m. The TIN interpolation method was used. In ArcMap 10 the commands “3D Analyst - TIN management - TIN creation” were used. The TIN model consists of irregular triangular elements centred on points. The data from 2017 were obtained from airborne laser scanning by the Geodetic and Cartographic Institute, Bratislava (Table 1).
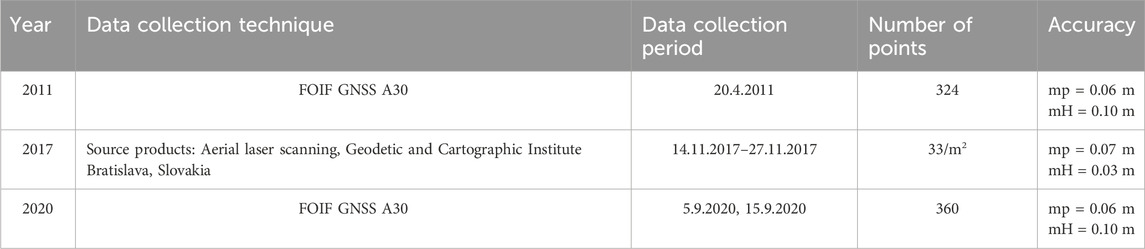
Table 1. Detailed characteristics of the data collection.
To create the regular and comparable grid system we used the geoprocessing tool - Create Fishnet (ArcGIS Pro 3.0.2), which creates a feature class containing a network of rectangular cells. Creating a fishnet requires three basic pieces of information: the spatial extent of the fishnet, the cell size and the rotation angle. We set the cell size to 20 m and the angle to be parallel to the windbreak. In total, the grid system created consisted of 1273 individual cells. A total of 251 points were measured in the field (leeward and upwind of the windbreak) and 71 in the windbreak area (Figure 7).
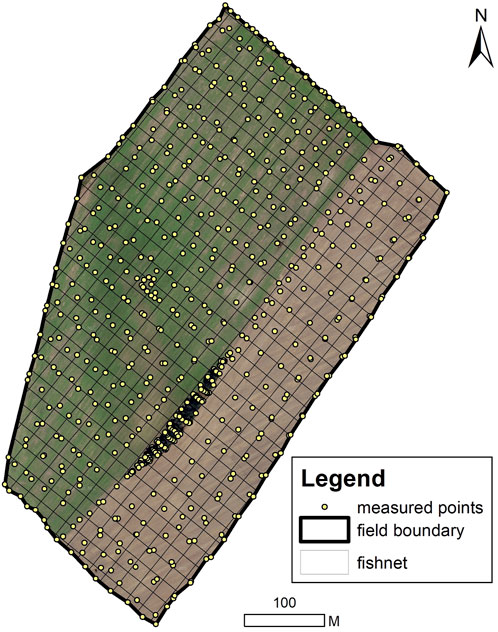
Figure 7. Fishnet with measured points within the study field.
Three-year periods (a) 2011, b) 2017, c) 2020) were used to obtain datasets for the creation of a Digital Model of Terrain (DTM) in the study area (Figure 8).

Figure 8. DTM of the study field in study period (A) 2011, (B) 2017 and (C) 2020.
3 Results
3.1 Spatial analysis of the study area for grain size variation
Spatial grain analysis showed a change in soil type between periods M1 - M2 towards clay loam and silty loam soil types and M2 - M3 towards silty loam soil type (Table 2). Initially, in period M1, the predominant soil type at most sites is loam, with one case of sandy loam. As we progress to period M2, there is a marked introduction of silty clay loam and an increased presence of silty clay loam. The appearance of silty clay loam, which has a higher silt and clay content, is indicative of initial wind erosion processes that loosen finer soil particles. These soils, although cohesive when wet, can become compacted and prone to crusting, increasing their susceptibility to erosion when dry. The emergence of Clay Loam also suggests soil compaction, but with larger clods that can resist erosion better than finer particles. By period M3 the soil type shifts to predominantly silt loam on almost all sites. This shift from more cohesive soils to finer, more erodible soils highlight the progressive impact of wind erosion. Silt loams, with their high silt content and smooth texture, are particularly susceptible to wind erosion when dry and poorly aggregated. The continuous detachment, transport and deposition of soil particles by the wind is likely to have resulted in this significant textural change. These observations are consistent with the nature of wind erosion processes. Initially, the wind detaches soil particles from the surface, with loam showing relative resistance compared to silty loam or sandy loam. Wind transport of these detached particles is more efficient for finer particles such as silt, leading to their accumulation in depositional areas. The increased presence of silt loam by period M3 indicates that continuous wind erosion has progressively broken-down soil aggregates, leaving finer, more resistant particles.
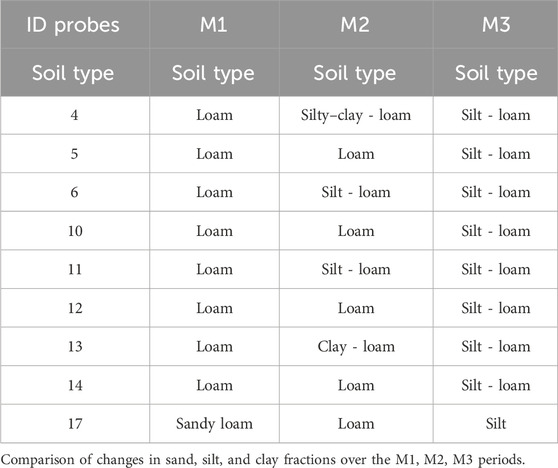
Table 2. The results of soil grain analysis on the M1 (1961–1970), M2 (2009–2015) and M3 (2015–2016) periods.
Using the nine (variations of 3 time periods and 3 soil fractions) spatial models of sand, silt, and clay fractions over M1, M2, and M3 periods in study area it was obtained the percentual change representation of each soil fraction between M1-M2, M2-M3, and M1-M3 periods (Figure 9).
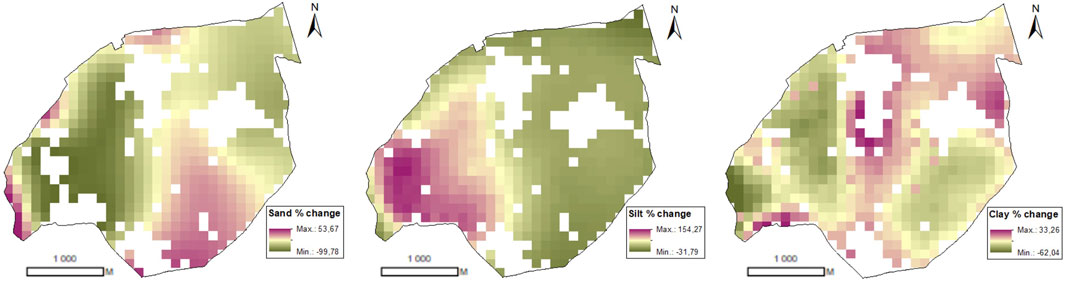
Figure 9. Change of the sand, silt and clay fraction in the study area between M3 (2015–2016) and M1 (1961–1970) periods.
3.1.1 Clay content changes
The percentage change in clay content (Figure 10) between periods M1 and M2 shows significant variability. Approximately 19.01% of the study area experienced a decrease in clay particles of up to 40%. This decrease indicates that these areas were subject to wind erosion which removed clay particles from the soil. Around 80% of the study area experienced an accumulation of clay particles, with increases of up to 60%. This significant increase in clay content suggests that finer particles have been deposited in these areas, probably by wind action. Wind tends to remove lighter, coarser particles, leaving behind or depositing heavier clay particles. The changes in clay content from M2 to M3 also show considerable variation. About 65% of the study area showed a decrease in clay particles of up to 80%. This indicates a significant loss of clay, probably due to continued or increased wind erosion processes. Only 21% of the study area showed an increase in clay content of up to 40%. This reduced rate of accumulation compared to the M1-M2 period suggests a shift in the dynamics of erosion and deposition during this period. The cumulative change in clay content from M1 to M3 shows significant changes. The largest decrease in clay particles, up to 80%, was observed over 65% of the study area. This long-term reduction highlights persistent wind erosion resulting in significant clay loss. Only about 4% of the study area experienced deposition, with increases of up to 20%. This indicates a limited area of clay particle accumulation throughout the period, reinforcing the trend of ongoing erosion.
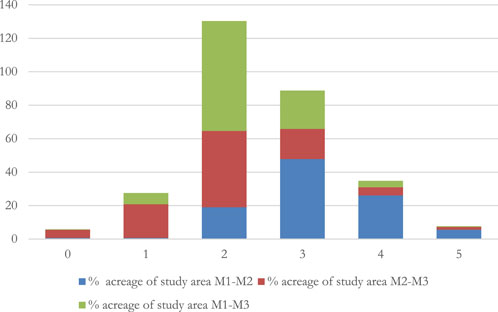
Figure 10. The % change in clay content between M1 (1961–1970), M2 (2009–2015) and M3 (2015–2016) periods (> (−120%) = 0, (120%) – (−80%) = 1, (−80%) – (−40%) = 2, (−40%) – 0% = 3, 0 %– 20% = 4, 20 %– 40% = 5).
3.1.2 Sand content changes
The percentage change in sand content (Figure 11) between periods M1 and M2 shows clear patterns. Approximately 54% of the study area experienced a significant decrease in sand fraction, mostly up to 40%. The significant increases in sand fraction include the 0%–20% and 20%–40% ranges, representing approximately 33% of the study area. These increases indicate areas where sand or fine particles (clay and silt fractions are displaced to these locations) have been deposited by wind action. There was significant sand deposition during this period, indicating active wind erosion processes. The cumulative changes from M1 to M3 show significant decreases in the sand fraction, with 32% of the area showing up to 40% deflation and 33% of the area showing more than 120% deflation. This suggests a continuing trend of sand particle deflation or more likely erosion and redistribution of finer particles in these areas.
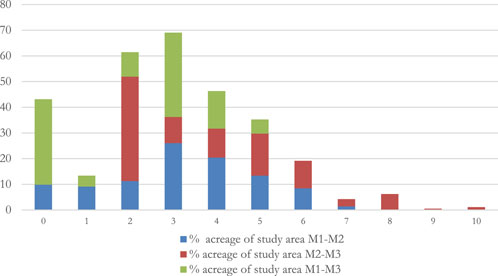
Figure 11. The % change in sand content between M1 (1961–1970), M2 (2009–2015) and M3 (2015–2016) periods (> (−120%) = 0, (120%) – (−80%) = 1, (−80%) – (−40%) = 2, (−40% – 0% = 3, 0% – 20% = 4, 20% – 40% = 5, 40% – 60% = 6, 60% – 80% = 7, 80% – 100%= 8, 100% – 120% = 9, >120% = 10).
3.1.3 Silt content changes
Significant changes in silt content (Figure 12) are observed in 51.68% of the study area with up to 80% deflation. This indicates significant removal of silt particles. Only 16% of the study area shows accumulation of silt particles up to 20%. The percentage change from M2 to M3 varies from a decrease of up to 40% in 27% of the study area to an increase of up to 40% in 59% of the study area. These changes indicate continuous deposition and intensive erosion of silt particles. The cumulative changes show both a decrease (up to 80%) in silt content in about 55% of the study area and an increase (up to 40%) in about 43% of the study area. These trends are indicative of long-term processes favouring the depletion of silt particles in these regions.
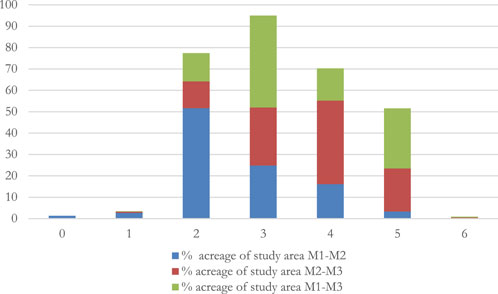
Figure 12. Change in silt content between M1 (1961–1970), M2 (2009–2015) and M3 (2015–2016) periods (> (−120%) = 0, (120%) – (−80%) = 1, (−80%) – (−40%) = 2, (−40%) – 0% = 3, 0% – 20% = 4, 20% – 40% = 5, 40% – 60% = 6).
The observed changes in soil composition reflect dynamic processes influenced by wind erosion. Areas with increased clay content may experience deposition of finer particles or reduced erosion due to the protective effect of vegetation or land management practices. Conversely, areas of increased sand content may be experiencing erosion of finer particles, leaving behind coarser particles. The significant changes in silt content indicate areas where wind erosion favours the removal of these finer particles. The data demonstrate the complex interplay of wind erosion and deposition processes affecting soil composition over time.
3.1.4 Topographic changes
The information obtained from DTM can be interpreted in two ways: visual analysis of the graphical representation or quantitative analysis. Interpretation procedures, together with the visualisation of functions, represent an important goal of terrain modelling in the context of GIS. For each 1 × 1 m2, the value of DTM 2020 and DTM 2017 was subtracted from DTM 2011. This step was carried out using the “3D Analyst tools - Terrain and TIN surface - Surface difference.” This tool calculates the volume difference between two irregular network (TIN) triangles or terrain datasets. The output models of topographic changes are shown in Figure 13. Negative values represent the accumulation process (AP) and positive values the deflation process (DP). Part a) represents the changes within the 8 years (2011–2017). The ratio between AP and DP pixels is 37.36%: 62.63%, which represents an area of 8.44 ha and 14.08 ha respectively; part b) represents the changes over the 4 years (2017–2020). The ratio between AP and DP pixels is 80.84%: 19.16%, representing an area of 18.27 ha and 4.33 ha respectively.
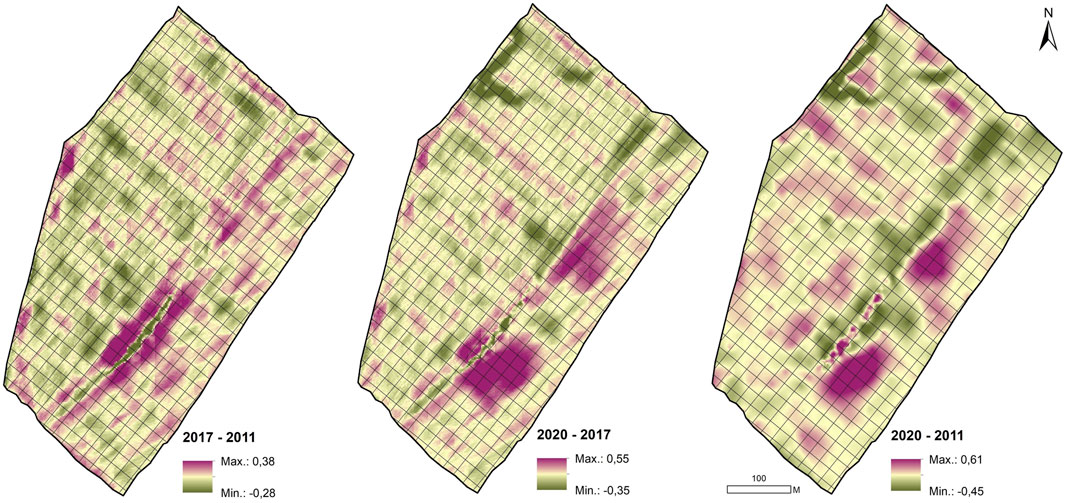
Figure 13. Topographic changes (m) within the study field between (A) 2017–2011 and (B) 2020–2017 (C) 2020–2011.
Figure 14 shows the topographic changes as a combination of the periods 2011–2017 and 2017–2020. The calculation of pixels with values 1 (DP) and 2 (AP) has been multiplied. Results 1 means DP for both periods, 2 as a combination of AP and DP in one of the periods and 4 as AP for both periods. Zones with predominant DP cover 12.64 ha within the whole study period, zones as a combination of accumulation and deflation zones cover 6.62 ha and zone with AP zones cover 3.34 ha.
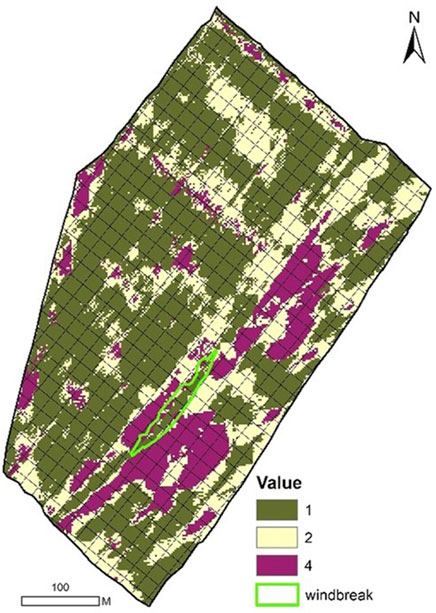
Figure 14. AP a DP zones within the study period.
3.1.5 The impact of the windbreak
The presence of a windbreak significantly influences the spatial distribution of eroded soil particles over time within a study plot (Figure 15). The windbreak plays an important role in reducing soil erosion and promoting AP in its vicinity. The protective effect of the windbreak is clear at about 80 m windward and 20 m leeward. This suggests that the windbreak creates a zone of reduced wind speed, allowing the deposition/accumulation of soil particles. The variability in soil erosion and AP/DP patterns highlights the dynamic nature of wind erosion processes in areas not protected by the windbreak.
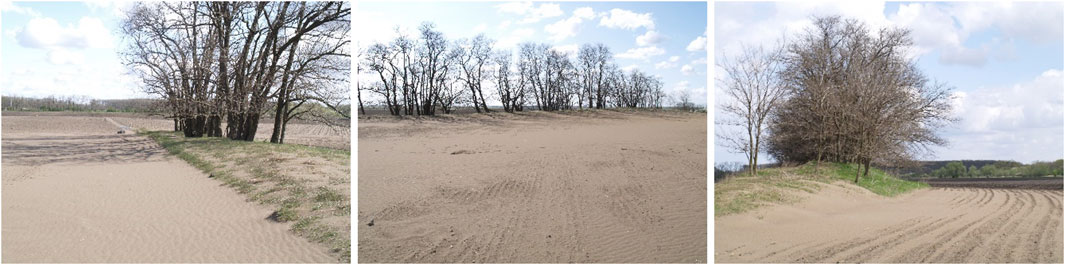
Figure 15. Protection effect of the windbreak during wind erosion event (48.201473, 17.885967).
4 Discussion
Understanding the dynamics of wind erosion and its long-term effects on soil composition and topography is crucial for the sustainable management of agricultural landscapes. This paper considers various aspects of soil particle redistribution, topographic change and the protective capacity of windbreaks. Numerous studies have highlighted the dynamic nature of soil particle redistribution by wind erosion (Dufková, 2007). For example, Li et al. (2007) observed significant changes in soil texture over time, with an increase in the proportion of 250–500 μm particles and a decrease in finer particles (<50 μm and 50–125 μm). Similarly, Lyles and Tatarko (Mielke and Schepers, 1986) documented a significant increase in the proportion of sand particles over a 36-year period due to wind erosion, particularly on medium sandy and sandy soils. Wind erosion causes changes in soil texture that affect how soil particles group together. This is particularly true on loamy soils where cultivation reduces clay into larger aggregates, increasing the risk of particle loss by wind (Colazo and Buschiazzo, 2014). Grain analyses of eroded soil during vertical transport (Li et al., 2007) show that 71.0% of soil particles move in the first 5 cm above the soil surface, and at a height of 0–15 cm this movement increases to 97.01% of total transport. The boundary between particles moving in the form of saltation and particles suspended in the air is approximately 25 cm above the soil surface. Liebig et al. (2024) emphasise the dynamic nature of soil texture across sites, suggesting that soil properties should not be assumed to be static, but rather subject to ongoing change influenced by erosive processes. Research using soil archives, as demonstrated by (Bergh et al., 2022), provides valuable insights into the long-term dynamics of soil change, contributing to our understanding of soil evolution and management practices. The findings of (Leys and McTainsh, 1994; Okin et al., 2001) highlight the detrimental effects of wind erosion on soil fertility, with significant losses of silt, clay and fine sand particles over relatively short periods of time. This ongoing erosion depletes the topsoil, which is rich in nutrients and organic matter, thereby reducing soil fertility and potentially leading to desertification (Tóth et al., 2013). observed changes in the soil surface with field measurements, noting total height changes of 3–4 cm and accumulations of 0.5–2 cm. The average change in soil surface height ranged from −0.7 to −0.97 cm. Using the volumetric method (Urban et al., 2013; Varga et al., 2013) it was found that approximately 14,922 m³ of soil material (5.5 cm in height) was transported during an erosion event, mainly from the edges of the field. Accurate determination of the structural parameters of windbreaks and accurate modelling are essential to evaluate their effectiveness (An et al., 2022). Low porosity fences increase the protection distance, while appropriate planting distances and integration with artificial fences increase the protection efficiency and reduce erosion (He and Shao, 2024). The relationship between optical porosity and structural indices also correlates with windbreak effectiveness (Středová et al., 2012). The effect of windbreaks on wind speed reduction varies considerably, typically ranging from 20 to 35 times the height of the windbreak on the leeward side (Brandle et al., 2004; Janeček et al., 2012). Urban et al. (2013) showed that the content of non-erodible particles was higher on the windward side of the windbreak. A series of studies have highlighted the significant impact of human activities on wind erosion. Zhang et al. (Zhang et al., 2018; Bartkowski et al., 2022) they both found that climate change and human activities are key drivers of wind erosion, with the latter study emphasizing the need to consider the effects of climate change on vegetation. Zhou et al. (2023) further demonstrated the role of residences and roads in intensifying wind erosion, particularly in temperate grassland ecosystems. Webb et al. (2022) provided a comprehensive review of the sensitivity of aeolian processes to anthropogenic land use and management, emphasizing the need for future research to connect wind erosion mitigation to broader land management and air quality objectives. These studies collectively underscore the importance of addressing human activities in efforts to control wind erosion. By integrating advanced remote sensing techniques with spatial analysis, we can improve our understanding of the dynamics of wind erosion and its long-term effects on soil composition and topography. This understanding underlines the critical need for effective wind erosion control measures. Practices such as maintaining vegetation cover, implementing windbreaks and adopting soil management strategies that improve soil structure and stability are essential to mitigate the detrimental effects of wind erosion. Future studies should prioritise the combination of field measurements with remote sensing data to improve our ability to accurately monitor and model soil erosion processes. Research into innovative soil conservation practices and landscape management strategies tailored to specific agro-ecological contexts is essential to mitigate the adverse effects of wind erosion and ensure sustainable agricultural productivity.
5 Conclusion
This study provides key insights into the long-term effects of wind erosion on surface topography, topsoil grain composition, and the protective role of windbreaks in an agricultural landscape. Our spatial analysis revealed significant changes in soil texture and topography over time, emphasizing the ongoing impact of wind erosion. The shift towards finer, more erodible soil particles, particularly the increase in silt loam, indicates continuous soil degradation. Windbreaks were found to be effective in reducing wind speed and promoting soil deposition, highlighting their importance in soil conservation. Overall, our findings underscore the need for sustainable land management practices to mitigate wind erosion and ensure agricultural productivity. Future research integrating field observations with remote sensing will be crucial for advancing our understanding and management of wind erosion.
Data availability statement
The raw data supporting the conclusions of this article will be made available by the authors, without undue reservation.
Author contributions
KH: Conceptualization, Data curation, Formal Analysis, Funding acquisition, Investigation, Methodology, Validation, Writing–original draft, Writing–review and editing. LL: Conceptualization, Data curation, Formal Analysis, Funding acquisition, Investigation, Methodology, Validation, Visualization, Writing–original draft, Writing–review and editing. TP: Formal Analysis, Methodology, Validation, Writing–original draft, Writing–review and editing.
Funding
The author(s) declare that financial support was received for the research, authorship, and/or publication of this article. This research is the result of the projects: VEGA 1/0186/23 Windbreaks in the agricultural landscape - ecological, environmental and economic value of multifunctional structures acting as soil degradation measures; Research on the influence of biotic and abiotic factors on the components of the soil-water-atmosphere-vegetation system, 313011T620, co-financed by the European Regional Development Fund.
Conflict of interest
The authors declare that the research was conducted in the absence of any commercial or financial relationships that could be construed as a potential conflict of interest.
Publisher’s note
All claims expressed in this article are solely those of the authors and do not necessarily represent those of their affiliated organizations, or those of the publisher, the editors and the reviewers. Any product that may be evaluated in this article, or claim that may be made by its manufacturer, is not guaranteed or endorsed by the publisher.
References
An, L., Wang, J., Xiong, N., Wang, Y., You, J., and Li, H. (2022). Assessment of permeability windbreak forests with different porosities based on laser scanning and computational fluid dynamics. Remote Sens. 14 (14), 3331. doi:10.3390/rs14143331
Balkovič, J., Skalský, R., and Nováková, M. (2010). “Priestorový model distribúcie piesku a ílu v ornici poľnohospodárskych pôd Slovenska. Vedecké práce Výskumného ústavu pôdoznalectva a ochrany pôdy,” in Výskumný ústav pôdoznalectva a ochrany pôdy Bratislava.
Ballabio, C., Panagos, P., and Montanarella, L. (2016). Mapping topsoil physical properties at European scale using the Lucas Database. Geoderma 261, 110–123. doi:10.1016/j.geoderma.2015.07.006
Bartkowski, B., Schepanski, K., Bredenbeck, S., and Müller, B. (2022). Wind erosion in European agricultural landscapes: more than physics. People Nat. 5 (1), 34–44. doi:10.1002/pan3.10418
Bergh, E. L., Calderón, F. J., Clemensen, A. K., Durso, L. A., Eberly, J. O., Halvorson, J. J., et al. (2022). Time in a bottle: use of soil archives for understanding long-term soil change. Soil Sci. Soc. Am. J. 86, 520–527. doi:10.1002/saj2.20372
Böhner, J., Riksen, M., Böhner, J., and Gross, J. (2004). “Impact of land use and climate change on wind erosion: prediction of wind erosion activity for various land use and climate scenarios using the WEELS wind erosion model,” in Waldproduktivität-kohlenstoffspeicherung-klimawandel WP-KS-KW view project PADUCO II view project impact of land use and climate change on wind erosion: prediction of wind erosion activity for various land use and climate scenarios using the WEELS wind erosion model (Wageningen: Wageningen Universiteit).
Borrelli, P., Panagos, P., Ballabio, C., Lugato, E., Weynants, M., and Montanarella, L. (2016a). Towards a pan-European assessment of land susceptibility to wind erosion. Land Degrad. Dev. 27, 1093–1105. doi:10.1002/ldr.2318
Borrelli, P., Panagos, P., Ballabio, C., Lugato, E., Weynants, M., and Montanarella, L. (2016b). Towards a pan-European assessment of land susceptibility to wind erosion. Land Degrad. Dev. 27, 1093–1105. doi:10.1002/ldr.2318
Brandle, J. R., Hodges, L., and Zhou, X. H. (2004). Windbreaks in North American agricultural systems. Agrofor. Syst. 61, 65–78. doi:10.1023/b:agfo.0000028990.31801.62
Caster, J., Sankey, J. B., Sankey, T.Ts., Kasprak, A., Bowker, M. A., and Joyal, T. (2024). Do topographic changes tell us about variability in Aeolian sediment transport and dune mobility? Analysis of monthly to decadal surface changes in a partially vegetated and biocrust covered Dunefield. Geomorphology 447, 109021. doi:10.1016/j.geomorph.2023.109021
Colazo, J. C., and Buschiazzo, D. (2014). The impact of agriculture on soil texture due to wind erosion. Land Degrad. Dev. 26 (1), 62–70. doi:10.1002/ldr.2297
Dahanayake, A. C., Webb, J. A., Greet, J., and Brookes, J. D. (2024). How do plants reduce erosion? An eco evidence assessment. Plant Ecol. 225, 593–604. doi:10.1007/s11258-024-01414-9
Du, H., Wang, T., Xue, X., and Li, S. (2018). Modelling of sand/dust emission in Northern China from 2001 to 2014. Geoderma 330, 162–176. doi:10.1016/j.geoderma.2018.05.038
Dufková, J. (2007). Determination of wind erosion next to shelterbelts. Acta Univ. Agric. Silvic. Mendelianae Brunensis 2007 (5), 65–70. doi:10.11118/actaun200755050065
Duniway, M. C., Pfennigwerth, A. A., Fick, S. E., Nauman, T. W., Belnap, J., and Barger, N. N. (2019). Wind erosion and dust from US drylands: a review of causes, consequences, and solutions in a Changing World. Ecosphere 10 (3). doi:10.1002/ecs2.2650
Durán, O., Claudin, P., and Andreotti, B. (2011). On aeolian transport: grain-scale interactions, dynamical mechanisms and scaling laws. Aeolian Res. 3 (3), 243–270. doi:10.1016/j.aeolia.2011.07.006
He, C., and Shao, W. (2024). Numerical simulation of Shelter Effect Assessment for single-row windbreaks on the periphery of Oasis farmland. J. Arid Environ. 222, 105165. doi:10.1016/j.jaridenv.2024.105165
Hesp, P. A., Dong, Y., Cheng, H., and Booth, J. L. (2019). Wind flow and sedimentation in artificial vegetation: field and wind tunnel experiments. Geomorphology 337, 165–182. doi:10.1016/j.geomorph.2019.03.020
Hong, C., Chenchen, L., Xueyong, Z., Huiru, L., Liqiang, K., Bo, L., et al. (2020). Wind erosion rate for vegetated soil cover: a prediction model based on surface shear strength. Catena 187, 104398. doi:10.1016/j.catena.2019.104398
Janeček, M., Dostál, T., Kozlovsky-Dufková, J., Dumbrovský, M., Hůla, J., Kadlec, V., et al. (2012). Erosion control in the Czech Republic—handbook. Prague: Czech University of Life Sciences.
Laino, E., and Iglesias, G. (2024). Multi-hazard assessment of climate-related hazards for European coastal cities. J. Environ. Manag. 357, 120787. doi:10.1016/j.jenvman.2024.120787
Leys, J. F., and McTainsh, G. H. (1994). Soil loss and nutrient decline by wind erosion-cause for concern. Aust. J. Soil Water Conservation 7 (3), 30–40.
Li, H., Yan, Z., Zhang, Z., Lang, J., and Wang, X. (2022). A numerical study of the effect of vegetative windbreak on wind erosion over complex terrain. Forests 13 (7), 1072. doi:10.3390/f13071072
Li, J., Okin, G. S., Alvarez, L., and Epstein, H. (2007). Quantitative effects of vegetation cover on wind erosion and soil nutrient loss in a desert grassland of southern New Mexico, USA. Biogeochemistry 85 (3), 317–332. doi:10.1007/s10533-007-9142-y
Li, J., Okin, G. S., and Epstein, H. E. (2009). Effects of enhanced wind erosion on surface soil texture and characteristics of windblown sediments. J. Geophys. Res. 114, G02003. doi:10.1029/2008JG000903
Liebig, M. A., Calderon, F. J., Clemensen, A. K., Durso, L., Duttenhefner, J. L., Eberly, J. O., et al. (2024). Long-term soil change in the US Great Plains: an evaluation of the Haas soil archive. Agrosystems, Geosciences Environ. 7 (2). doi:10.1002/agg2.20502
Liu, F., Zhang, G. L., Song, X., Li, D., Zhao, Y., Yang, J., et al. (2020). High-resolution and three-dimensional mapping of soil texture of China. Geoderma 361, 114061. doi:10.1016/j.geoderma.2019.114061
Lyles, L., and Tatarko, J. (1986). Wind erosion effects on soil texture and organic matter. J. Soil Water Conservation 41, 191–193.
Mielke, L. N., and Schepers, J. S. (1986). Plant response to topsoil thickness on an eroded loess soil. J. Soil Water Conservation 41 (1), 59–63.
Mezősi, G., Blanka, V., Bata, T., Ladányi, Z., Kemény, G., and Meyer, B. (2016). Assessment of future scenarios for wind erosion sensitivity changes based on ALADIN and REMO regional climate model simulation data. Open Geosci. 8, 465–477. doi:10.1515/geo-2016-0033
Négyesi, G., Lóki, J., Buró, B., Bertalan-Balázs, B., and Pásztor, L. (2019). Wind erosion researches in Hungary—past, present and future possibilities. Hung. Geogr. Bull. 68, 223–240. doi:10.15201/hungeobull.68.3.2
Okin, G. S., Murray, B., and Schlesinger, W. H. (2001). Degradation of sandy arid shrubland environments: observations, process modelling, and management implications. J. Arid Environ. 47 (2), 123–144. doi:10.1006/jare.2000.0711
Schmid, B. M., Williams, D. L., Chong, C.-S., Kenney, M. D., Dickey, J. B., and Ashley, P. (2022). Use of digital photogrammetry and lidar techniques to quantify time-series dune volume estimates of the Keeler Dunes Complex, Owens Valley, California. Aeolian Res. 54, 100764. doi:10.1016/j.aeolia.2021.100764
Smyth, T. A. G., Hesp, P. A., Walker, I. J., Wasklewicz, T., Gares, P. A., and Smith, A. B. (2019). Topographic change and numerically modelled near surface wind flow in a bowl blowout. Earth Surf. Process. Landforms 44 (10), 1988–1999. doi:10.1002/esp.4625
Solazzo, D., Sankey, J. B., Sankey, T.Ts., and Munson, S. M. (2018). Mapping and measuring aeolian sand dunes with photogrammetry and lidar from unmanned aerial vehicles (UAV) and multispectral satellite imagery on the paria plateau, AZ, USA. Geomorphology 319, 174–185. doi:10.1016/j.geomorph.2018.07.023
Středová, H., Podhrázská, J., Litschmann, T., Středa, T., and Rožnovský, J. (2012). Aerodynamic parameters of windbreak based on its optical porosity. Contributions Geophys. Geodesy 42 (3), 213–226. doi:10.2478/v10126-012-0008-5
Tóth, C., Négyesi, G., Lóki, J., Szabó, G., and Buró, B. (2013). Wind and sheet erosion investigations in sample areas in the Nyírség. Adv. Res. Eng. Sci. "ARES" 1 (2), 2347–4130.
Tuo, D., Lu, Q., Wu, B., Li, Q., Yao, B., Cheng, L., et al. (2023). Effects of wind–water erosion and topographic factor on soil properties in the loess hilly region of China. Plants 12, 2568. doi:10.3390/plants12132568
Urban, T., Lackóová, L., Halászová, K., and Streďanský, J. (2013). Wind erosion in the agricultural landscape: the wind erosion equation used in GIS. Wydaw. Uniw. Rol. w Kakowie.
Vacek, Z., Řeháček, D., Cukor, J., Vacek, S., Khel, T., Sharma, R. P., et al. (2018). Windbreak efficiency in agricultural landscape of the central Europe: multiple approaches to wind erosion control. Environ. Manag. 62, 942–954. doi:10.1007/s00267-018-1090-x
Varga, V., Lackóová, L., Streďanský, J., and Urban, T. (2013). Comparison of volumetric and deflametric method with wind erosion equation (WEQ) to determine soil erosion by wind events on selected soil unit/porovnanie volumetrickej s deflametrickej metódy s rovnicou veternej erózie pre určenie pôdnej erózie spôsobenej účinkami vetra na vybraných pôdnych jednotkách. Acta Hortic. Regiotecturae 16 (1), 18–23. doi:10.2478/ahr-2013-0005
Visser, S. M., Sterk, G., and Ribolzi, O. (2004). Techniques for simultaneous quantification of wind and water erosion in semi-arid regions. J. Arid Environ. 59 (4), 699–717. doi:10.1016/j.jaridenv.2004.02.005
Webb, N. P., Edwards, B. L., and Pierre, C. (2022). Wind erosion in anthropogenic environments. Treatise Geomorphol., 301–319. doi:10.1016/b978-0-12-818234-5.00031-6
Zhang, H., Fan, J., Cao, W., Harris, W., Li, Y., Chi, W., et al. (2018). Response of wind erosion dynamics to climate change and human activity in Inner Mongolia, China during 1990 to 2015. Sci. Total Environ. 639, 1038–1050. doi:10.1016/j.scitotenv.2018.05.082
Zhou, Z., Zhang, Z., Zhang, W., Luo, J., Zhang, K., Cao, Z., et al. (2023). The impact of residences and roads on wind erosion in a temperate grassland ecosystem: a spatially oriented perspective. Int. J. Environ. Res. Public Health 20 (1), 198. doi:10.3390/ijerph20010198
Keywords: wind erosion, surface topographic changes, grain composition, windbreak, agricultural landscape, high-precision positioning measurements
Citation: Halászová K, Lackóová L and Panagopoulos T (2024) Long-term evaluation of surface topographic and topsoil grain composition changes in an agricultural landscape. Front. Environ. Sci. 12:1445068. doi: 10.3389/fenvs.2024.1445068
Received: 06 June 2024; Accepted: 23 July 2024;
Published: 06 August 2024.
Edited by:
Ilan Stavi, Dead Sea and Arava Science Center, IsraelReviewed by:
Jianhua Xiao, Chinese Academy of Sciences (CAS), ChinaLihai Tan, Chinese Academy of Sciences (CAS), China
Copyright © 2024 Halászová, Lackóová and Panagopoulos. This is an open-access article distributed under the terms of the Creative Commons Attribution License (CC BY). The use, distribution or reproduction in other forums is permitted, provided the original author(s) and the copyright owner(s) are credited and that the original publication in this journal is cited, in accordance with accepted academic practice. No use, distribution or reproduction is permitted which does not comply with these terms.
*Correspondence: Lenka Lackóová, bGVua2EubGFja29vdmFAdW5pYWcuc2s=