 Tongtong Li1
 Yangyang Wang
 Yanna Xiong
 Lei Wang
- 1Technical Centre for Soil, Agriculture and Rural Ecology and Environment, Ministry of Ecology and Environment, Beijing, China
- 2Bceg Environmental Remediation Co., Ltd., Beijing, China
- 3College of Arts, Shandong Agricultural University, Taian, China
- 4Eco-Environmental Science Center (Guangdong, Hong-Kong, Macau), Ministry of Ecology and Environment, Guangzhou, China
- 5School of Materials and Environmental Engineering, Institute of Urban Ecology and Environment Technology, Shenzhen Polytechnic University, Shenzhen, China
Agricultural non-point source pollution (ANP) had become an important source of water pollution, which seriously restricted the coordinated development of Beijing, Tianjin and Hebei. As the primary agricultural production base in the region of Beijing-Tianjin-Hebei, Hebei had serious ANP. In order to clarify the current status of ANP in Hebei and figure out the main pollution source and areas, ANP load of Hebei from 2000 to 2021 were evaluated by the export coefficient modeling (ECM) and spatial-temporal characteristics were carried out using geographic information system (GIS). In addition, ANP severity and emission characteristics of Hebei in 2021 were evaluated. The results showed that the environmental impact of ANP in southwest area was obviously more serious than that in northeast area of Hebei. Especially, ANP emissions in Hebei showed significant decreasing inflection points in 2007 and 2017, respectively, reaching a minimum by 2021. The TN and TP emissions of ANP in Hebei were 315,026.1 t and 50,323.76 t in 2021, respectively. The contribution of agricultural land, livestock and poultry breeding and rural life to TN and TP emissions were 37%, 34%, 29% and 20%, 61% and 18%, respectively. The ANP pollution mainly came from livestock and poultry breeding in Hebei Province. Based on cluster analysis, cities in Hebei were divided into four types, and the control strategies for ANP environment management were put forward.
1 Introduction
Water pollution seriously affected the safety of drinking water, food, ecology as well as human settlement environment (Wang et al., 2024), which had been considered as one of the bottlenecks of the sustainable development of social and economic development in China. With the gradual effectiveness of industrial, agricultural and urban life point source pollution control measures, agricultural non-point source pollution (ANP), which was more difficult to control, had become another important source of water pollution in China (Ongley, 2004; Xia et al., 2017). ANP referred to the agricultural wastewater quality pollution caused by no fixed pollution discharge point in the process of agricultural production activities, including pesticides, chemical fertilizers, intensive farms, rural domestic sewage, garbage pollution and improper land use, etc. (Liu et al., 2008; Qi et al., 2008; Zhang et al., 2013). The main pollutants included ammonia nitrogen (NH4+- N), chemical oxygen demand (COD), total nitrogen (TN) and total phosphorus (TP) (Chang, 2008). TN and TP were pivotal indicators for assessing the eutrophication status of aquatic systems. Presently, over 60% of China’s lakes were afflicted with eutrophication, and more than half of the nitrogen and phosphorus found in these lakes originated from ANP (Zhang and Xu, 2011; Ghebremichael et al., 2013; Hou et al., 2022). As reported, a staggering 83% of the total nitrogen and 84% of the total phosphorus within the pollution load of the Taihu Lake Basin were attributed to ANP (Wang et al., 2021). This evidence underscored the significant role that nitrogen and phosphorus from ANP played in the degradation of water environmental quality. Accordingly, the current investigation was primarily concerned with the examination of TN and TP as key pollutants in ANP.
ANP was difficult to monitor for the randomness, dispersion, concealment, extensiveness and uncertainty, which was generally analyzed quantitatively with the help of models, such as soil and water assessment tool (SWAT), agricultural non-point source (AGNPS), storm water management model (SWMM), etc. (Worrall and Burt, 1999; Ierodiaconou et al., 2005; Ma et al., 2011). However, the complexity of these models on the demand for parameters and computation hindered their application to some extent (Ding et al., 2010). The export coefficient modeling (ECM) (Worrall and Burt, 1999; Ma et al., 2011) had applicability in the estimation of pollution loads in larger scale watersheds, which assumed that the export coefficients of a single pollution source were the same for a unit quantity (unit area). Compared to mechanistic models about pollutant formation, transport, and transformation processes within a watershed (Wang et al., 2007), ECM was simple and convenient, as it did not rely on extensive observation data to calibrate model parameters. ECM directly established the relationship between regional land use status, etc., and non-point source pollution loads. The data such as land use status was relatively easily available, and few parameters were required, which brought a certain degree of reliability. When observational data was limited, ECM became a feasible approach and had therefore been widely used (Ding et al., 2010). Hebei Province, a significant agricultural entity within China, held a pivotal role in the nation’s agricultural output. This strategic location was crucial for fostering harmonious development among the Beijing, Tianjin, and Hebei regions. To date, there had been a notable absence of long-term, systematic research by scholars on the ANP in Hebei. Consequently, there was an imperative need to delve into the temporal and spatial distribution patterns of nitrogen and phosphorus ANP in Hebei Province.
In this paper, ANP (including TN and TP) emissions of different cities in Hebei from 2000 to 2021 were evaluated through ECM, according to the statistical data of cultivated land area, forest area, livestock and poultry breeding and rural living population, which based on the Rural Statistical Yearbook of Hebei Province the in different years. The Unit area Pollution load factor and the equal standard pollution load index were used to evaluate the environmental impact degree and pollution severity of each city. The key pollution sources of ANP emissions in each city were identified by SPAA cluster analysis and its temporal and spatial characteristics and equivalent pollution load were carried out using geographic information system (GIS). In addition, this research had delineated the critical regions and principal pollution contributors of nitrogen and phosphorus non-point source pollution. Subsequently, the study had advanced targeted and effective strategies for the management of ANP. This study may not only provide a significant example for controlling the ANP of Beijing, Tianjin, and Hebei, but also served as a valuable reference for other regions with similar geographical conditions to carry ECM to estimate ANP.
2 Research methods and data sources
2.1 Study area
Situated across an expanse of 189,000 km2, Hebei Province was geographically positioned between latitudinal coordinates of 36°05′N and 42°40′N, and longitudinal coordinates of 113°27′E to 119°50′E. This province was located within the North China Plain, encircled by the municipalities of Beijing and Tianjin within its inner ring, and bordered by the Bohai Sea to the east. The province’s climate was characterized by a temperate continental monsoon climate with distinct seasons. The hydrological system of Hebei was complex, with numerous rivers belonging to the Haihe and Luanhe river systems. Moreover, key lake wetlands such as Baiyangdian and Hengshui Lake are present, contributing significantly to climate regulation, water conservation, and the maintenance of ecological equilibrium. Hebei Province boasted favorable conditions for both nature and agricultural productivity. The third national land survey in 2021 showed that the cultivated land and forest land in Hebei Province were 60,300 and 64253 km2 respectively (Department of Natural Resources of Hebei Province, 2021). Consequently, it was imperative to identify critical zones and primary sources of ANP concerning TN and TP, and to implement targeted measures to safeguard the aquatic environment.
2.2 The approach of export coefficient modeling
Considering land use classification, combined with the number and distribution of livestock and poultry, and the discharge and treatment of non-point source pollutants by rural residents, the ECM method can accurately estimate the ANP emissions load and evaluate the relationship between land use and lake eutrophication. Its expression was generally written as follows (Ierodiaconou et al., 2005; Ma et al., 2011; Shen et al., 2013):
Where, Lj is the total load of pollutant J in the basin, t/(hm2·a); i is the classification of land, livestock or population in the basin, with n categories; Eij is the output coefficient of pollutant j in class i land, livestock or population; Aj is the area (hm2) of category i land or the number of livestock (head) and population (person); P is the amount of pollutants input by precipitation, t/(hm2·a), and the influence of this item is not considered in this study. Firstly, precipitation primarily contributed to the migration and dispersion of ANP from its source to water bodies. However, this migration and dispersion were also influenced by various factors such as land use patterns, topography, and field management, which significantly complicated the identification of ANP. Moreover, ANP sources were varied, the migration process was intricate and unpredictable, and the pollutants transported by precipitation was relatively small compared to the total amount of pollutants originating from ANP. Consequently, the influence of the rainfall factor was not considered in this paper (Cheng et al., 2018).
The calculation of ECM is to determine the export coefficient value, which is influenced by many factors, mainly including topography, geomorphology, hydrology, climate, land use, soil type, vegetation cover, and human activities. The acquisition of export coefficient can be determined by field monitoring and literature review. The field monitoring method was primarily utilized for fixed-point monitoring in small watersheds, while large-scale or multi-area monitoring can be constraints due to time and financial limitations. In areas with similar geographical conditions, the factors influencing the output coefficient, such as topography, hydrology, climate, and soil type, were approximately equivalent. In view of the fact that there was no test data of output coefficient in Hebei area, the average value of output coefficient of agricultural land in this paper was determined by referring to the research results of other regions under similar natural conditions in China, which referred to Landform, hydrology, climate, soil type, etc. (Cheng et al., 2017; Cheng and Jia, 2017; Hu et al., 2021). The export coefficient of livestock and poultry breeding was determined by the manual of source production and emissions coefficient of livestock and poultry breeding. The export coefficient of rural life was determined by the population export coefficient recommended by the Ministry of Environmental Protection. Classification and value of output coefficients of Hebei province were shown in Table 1.
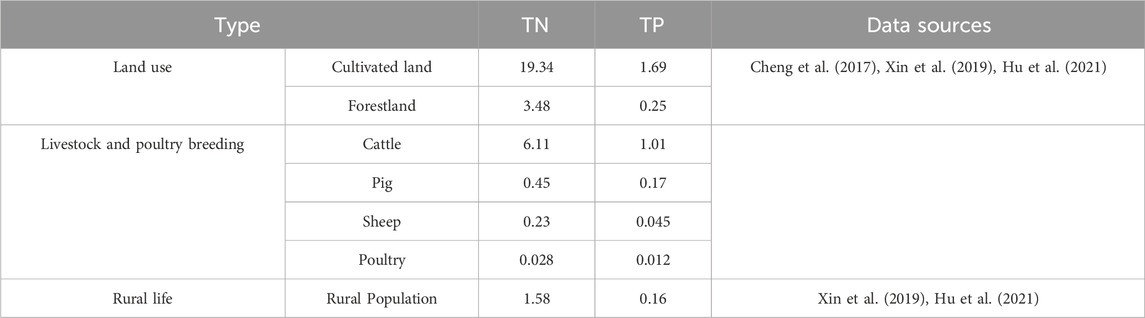
Table 1. Classification and value of output coefficient in Hebei Province [kg/(hm2·a)].
2.3 Pollution degree assessment
2.3.1 The equal standard pollution load index method
The equal standard pollution load index was used to reflect the relative pollution severity of each city, that was, the total equivalent pollution load of a city was divided by the total amount of its water resources. The total equivalent pollution load was the intermediate quality required to dilute all pollutants to the evaluation standard, which represented the degree to which the pollutant emissions concentration exceeded a certain baseline emissions standard. The calculation was based on the following formul as Equations 2, 3 (Li and Shang, 2023; Xu et al., 2023; Yan et al., 2023):
Where:
2.3.2 Unit area pollution load coefficient method
The pollution load coefficient per unit area evaluated the environmental impact of pollutants on a certain province and city (Wang et al., 2021). The calculation was based on the following formul as Equations 4, 5 (Yan et al., 2023):
Where, K is the pollution load coefficient per unit area; qi is the annual discharge per unit area of type i pollution of a city, t/km2; Qi is the annual emissions of the i type of pollution in a certain city, t; Si is the administrative area of a city, km2.
The impact degree of TN and TP on the environment of each city was evaluated according to K value: K < 60, no threat to the environment (Ⅰ level); 60 ≤ K < 80, slightly threatening to the environment (Class II); 80 ≤ K < 100, posing a threat to the environment (Ⅲ level); K ≥ 100, posing a serious threat to the environment (Level IV) (Hou et al., 2022).
2.4 Pollution characteristics identification
Using SPSS software, the TN and TP pollution load of agricultural land, livestock and poultry breeding and rural life were input, and the pollution emissions characteristics were analyzed by hierarchical clustering method. The leading factor of ANP change was the pollution sources that contributed the most to the change of ANP emissions, and the contribution rate was calculated according to the percentage of each pollution sources ANP emissions value in the total ANP emissions value. Using ArcGIS software, the temporal and spatial characteristics of ANP emissions and equivalent pollution load of Hebei province were carried out.
2.5 Data sources
In this study, 11 cities in Hebei Province were selected as the research objects to estimate and analyze the ANP pollution in Hebei Province. Sources of pollution included agricultural land, livestock and poultry farming and rural life pollution. Agricultural land was mainly divided into cultivated land and forest land. Livestock and poultry breeding were divided into cattle, pigs, sheep and poultry. The output coefficients were from the manual of source production and discharge coefficient of livestock and poultry breeding and Ministry of Environmental Protection. The pollutant production data was mainly from Hebei Rural Statistical Yearbook 2000-2021, which was published by Hebei Province Bureau of Statistics. The total water resources data came from Hebei Water Resources Bulletin of each year, which was published by Department of Water Resources of Hebei Province.
3 Results and discussion
3.1 Change and characteristics of ANP emissions
3.1.1 Analysis of ANP emissions change
According to Equation 1, TN and TP emissions generated by cultivated land, forest land, livestock and poultry breeding and rural domestic pollution in Hebei Province from 2000 to 2021 were calculated. The TN and TP emissions in Hebei showed an increasing trend from 2000 to 2006 (Figure 1), then slowly rebounded after a sharp decline in 2007, and began to decline again after 2017, reaching a minimum in 2021.
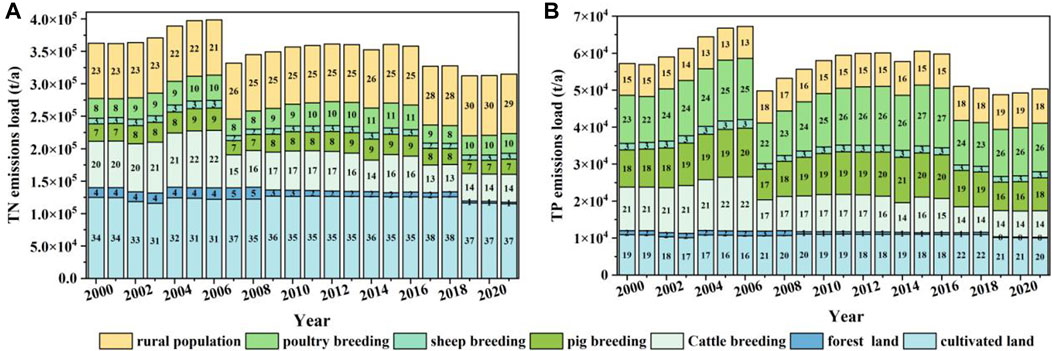
Figure 1. TN (A) and TP (B) emissions of Hebei Province from 2000 to 2021.
As can be seen from Figure 2A, TN emissions were sharply reduced by 16.72% in 2007 compared to 2006, mainly because the contribution of livestock and poultry breeding to TN emissions decreased significantly, especially the number of cattle breeding decreased. The reason might be that in recent years, the number of cattle breeding decreased and the livestock pollution sources had gradually shifted from decentralized breeding to large-scale breeding, which had gradually reduced the pollution output load of livestock and poultry (Sun and Xu, 2013). From 2000 to 2021, the contribution rate of rural population to TN emissions showed an increasing trend, while that of cattle and forest land showed a decreasing trend, and the contribution rate of other pollution sources to TN emissions was basically stable. In summary, agricultural land contributed the most to TN emissions, followed by livestock and poultry breeding, and rural population contributed the least.
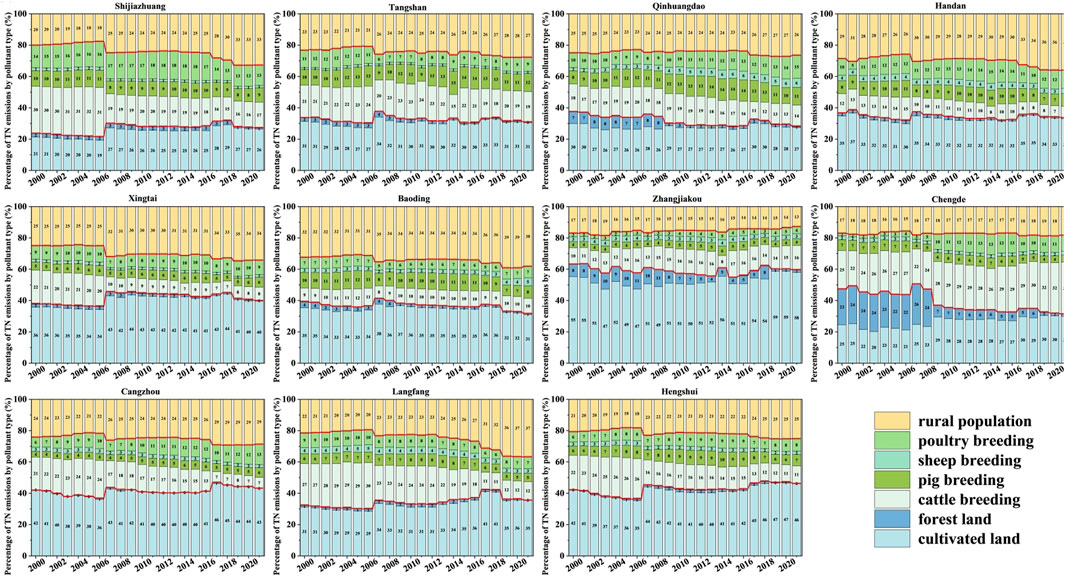
Figure 2. TN emissions of different pollutant types in different cities of Hebei Province from 2000 to 2021.
As seen in Figure 2B, TP emissions decreased even more significantly in 2007, by 25.87% compared to 2006, which also because the contribution of livestock and poultry breeding decreased significantly. In general, livestock and poultry farming contributed the most to TP emissions, contributing more than 58%. The average contribution of rural land and rural population to TP was 20.32% and 15.81% respectively. In livestock and poultry breeding, pig and poultry were the main sources of phosphorus emissions. The main reason was that Hebei was an important livestock production base. With the rapid development of animal husbandry, especially pigs and poultry breeding, large-scale, specialized households and small area breeding had been developed rapidly. However, the construction of livestock waste treatment facilities was relatively backward and the treatment rate of livestock and poultry pollution was low, resulting in the harmless utilization rate of breeding waste was low (Tong et al., 2018). Phosphorus element in feces was not effectively treated and entered into the environment with wastewater and urine, which had an impact on the water supply environment.
3.1.2 Analysis of leading factors of ANP emissions
According to the changes of TN and TP emissions of various pollution sources, the contribution rate of different pollution sources to ANP emissions in Hebei Province from 2000 to 2021 was calculated. The contribution rate of different pollutant types to TN emissions in each city of Hebei Province from 2000 to 2021 was shown in Figure 2. In general, except Zhangjiakou, the contribution rate of rural population to TN emissions in the other 10 cities showed an increasing trend over time, and the growth was most obvious in Langfang, Shijiazhuang and Xingtai. Compared with 2000, the contribution rate of rural population to TN of above three cities in 2021 increased by 70.54%, 62.85% and 37.61%, respectively, which curbing TN growth should focus on reducing rural population pollution. In Chengde, Zhangjiakou, Qinhuangdao and Baoding, the contribution rate of livestock and poultry farming to TN emissions increased gradually over time. Compared with 2000, the contribution rate of livestock and poultry farming to TN of the above four cities increased by 42.25%, 40.32%, 20.45% and 6.91% respectively in 2021, which should focus on reducing the pollution of livestock and poultry farming to curb the growth of TN. In Shijiazhuang, Tangshan, Handan, Xingtai, Cangzhou, Langfang and Hengshui, the contribution rate of livestock and poultry farming to TN emissions gradually decreased over time, and the increase was most obvious in Langfang, Xingtai and Shijiazhuang. Compared with 2000, the contribution rate of livestock and poultry farming to TN of the above three cities’ emissions in 2021 was reduced by 40.46%, 31.18% and 28.36%, respectively. Compared with 2000, the contribution rate of agricultural land to TN decreased in Tangshan, Qinhuangdao, Handan, Baoding, Zhangjiakou and Chengde in 2021, among which Qinhuangdao and Chengde were the most obvious, with a decrease of 25.29% and 33.91%, respectively. By 2021, Shijiazhuang, Tangshan, Qinhuangdao and Chengde cities were dominated by livestock and poultry farming emissions; Xingtai, Zhangjiakou, Cangzhou and Hengshui cities were dominated by agricultural land emissions; Handan, Baoding and Langfang cities were dominated by rural population emissions.
The contribution rate of different pollutant types to TP emissions in each city of Hebei Province was shown in Figure 3. From 2000 to 2021, the leading factors of TP emissions in different cities showed consistency, that was, livestock and poultry farming contributed the most to TP emissions, almost all of which were above 50%. The contribution rate of agricultural land to TP emissions in Xingtai, Chengde, Cangzhou, Langfang and Hengshui was slightly higher than that of rural population. From 2000 to 2021, the contribution rate of rural population to TP emissions in Zhangjiakou was about 10%, the contribution rate of livestock and poultry farming to TP emissions showed an increasing trend, and the contribution rate of rural population to TP emissions showed a decreasing trend. From 2000 to 2021, the contribution rate of rural population to TP emissions in Zhangjiakou was about 10%, the contribution rate of livestock and poultry farming to TP emissions showed an increasing trend, and the contribution rate of rural population to TP emissions showed a decreasing trend. Although agricultural land and rural population had a certain impact on TP emissions, the focus should be on reducing livestock and poultry pollution to curb the growth of TP emissions.
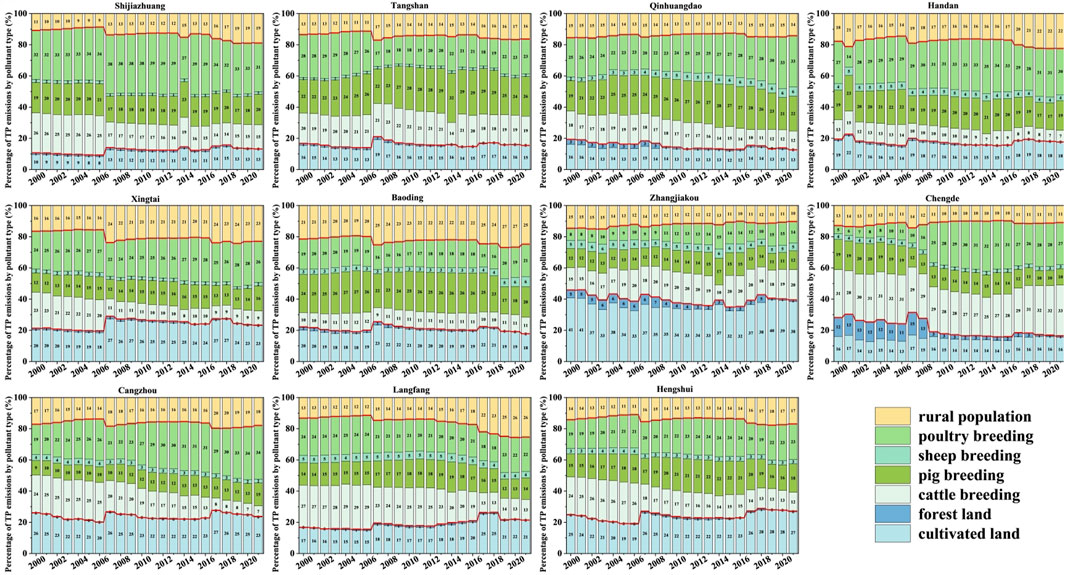
Figure 3. TP emissions of different pollutant types in different cities of Hebei Province from 2000 to 2021.
3.1.3 Analysis of spatial-temporal characteristics of ANP emissions
The TN and TP emissions data from 2000 to 2021 were added into the regional administrative planning map by GIS software, and the spatial distribution map of TN and TP emissions were obtained (Figure 4). The spatial difference of ANP emissions was large and the spatiotemporal variation of TN and TP emissions were consistent, that was TN and TP emissions in the southwest of Hebei Province was generally higher than that in the northeast. The main reason was that the agricultural production scale in Shijiazhuang, Handan, Baoding, and Hengshui in the southwest of Hebei Province was large, including large-scale planting and breeding. Additionally, there was a significant use of chemical fertilizers, pesticides, and agricultural film as inputs (Wang et al., 2010). The problem of drought and water shortage in Hebei had become increasingly prominent. Sewage irrigation had become a means to solve the shortage of agricultural water resources. Sewage irrigation areas were distributed in Baoding, Cangzhou, Shijiazhuang, Handan and other places in the southwest of Hebei. This was consistent with areas where TN and TP emissions were severe. Sewage may contain various microorganisms, suspended solids, fertilizers, pesticides, insoluble solids, and salts, and other pollutants. These pollutants entered the surrounding water through surface runoff. Excessive pollutants in wastewater would aggravate water pollution (Shao et al., 2019). Zhangjiakou, Chengde and Qinhuangdao had the smallest sewage irrigation area. The 2021 Hebei Rural Statistical Yearbook indicated that the primary regions for fertilizer use were still Shijiazhuang, Handan, Baoding, Hengshui, and other locations in southwest Hebei. In agricultural practices, substantial amounts of chemical fertilizers were applied, and the residual nitrogen and phosphorus in the farmlands were washed into surface waters by heavy rains and through agricultural drainage systems. This resulted in an increased concentration of nitrogen and phosphorus in the surface waters, leading to water eutrophication (Schipper et al., 2008).
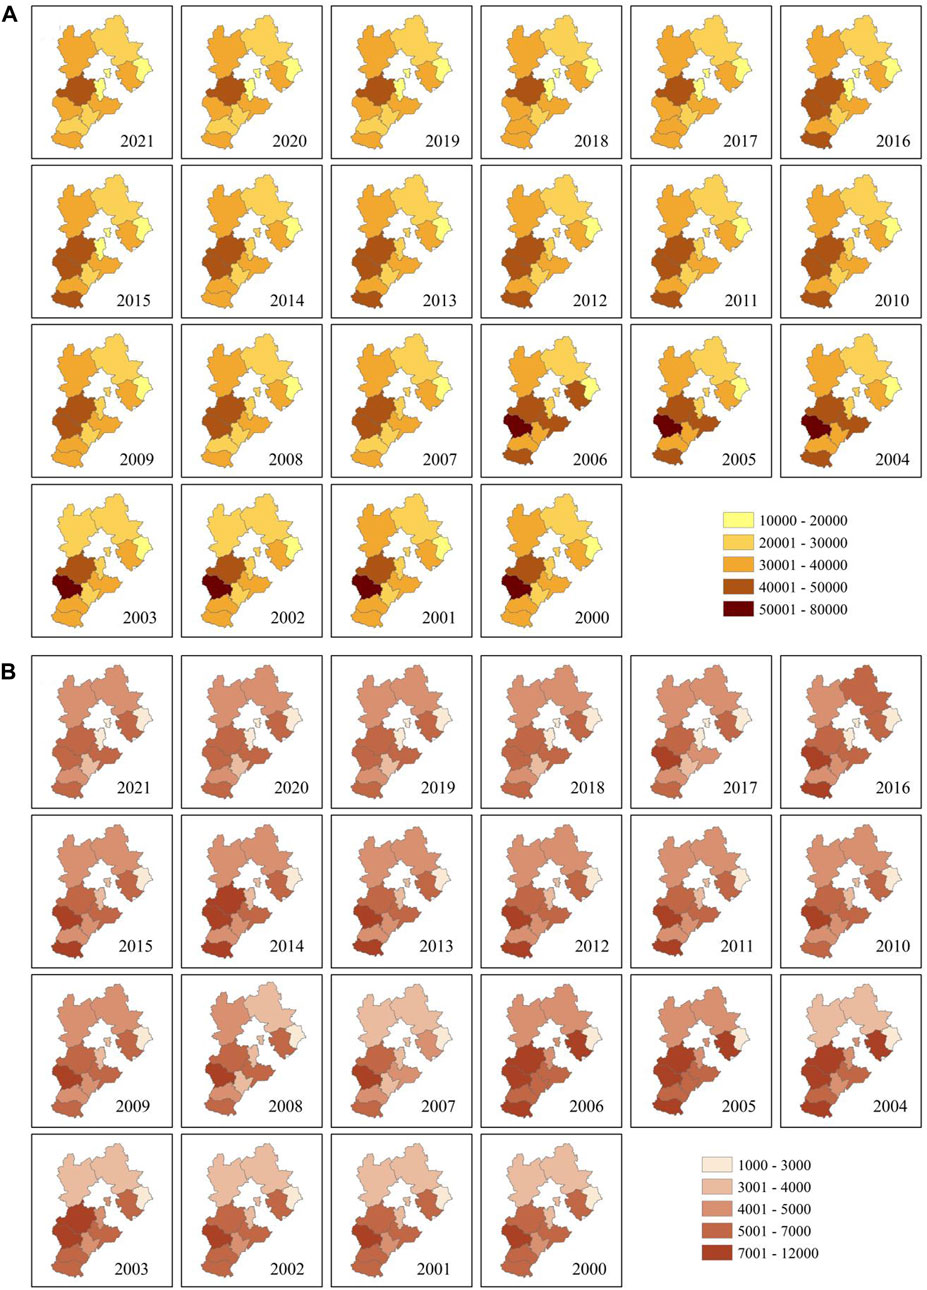
Figure 4. Spatial distribution of (A) TN and (B) TP emissions in Hebei province from 2000 to 2021 (t/a).
From 2000 to 2021, the TN emissions of the six southern cities of Baoding, Shijiazhuang, Xingtai, Handan, Hengshui and Cangzhou accounted for more than 61% of the province, and reached a maximum of 65.3% in 2003. From 2000 to 2013, the TN emissions of Shijiazhuang always ranked first in the province, and the TN emissions of Baoding ranked second in the province. Since 2006, the TN emissions of Shijiazhuang showed a downward trend, especially after 2017, the decline was more obvious. The main reason was that Shijiazhuang and Baoding were the major grain and breeding counties in Hebei Province (Wang and Jin, 2010), and the agricultural output value was high, so the pollution emissions were high. From 2014 to 2021, the TN emissions of Baoding maintained the first place in the province, and the TN emissions of Shijiazhuang dropped to the second place. TN emissions in Qinhuangdao had been the lowest in the province from 2000 to 2021. The TN emissions of all cities in the province decreased significantly since 2007, and the decrease in Shijiazhuang was the most obvious, with a decrease of 28.74% compared with 2006. Compared with 2000, TN emissions in the whole province showed a downward trend, and the decrease rate was the most obvious in Langfang, Shijiazhuang and Xingtai, which were 34.92%, 34.14% and 20.43%, respectively.
From 2000 to 2021, the TP emissions of the six southern cities of Baoding, Shijiazhuang, Xingtai, Handan, Hengshui and Cangzhou accounted for more than 62% of the province, and reached the maximum of 67.0% in 2023. From 2000 to 2021, the TP emission of Shijiazhuang maintained the first place in the province. The TP emissions of Handan from 2006 to 2016 ranked second in the province, and the TP emissions of Baoding in other years ranked second in the province. TP emissions in Qinhuangdao were the lowest in the province from 2000 to 2021. The TP emissions of all cities in the province decreased significantly since 2007, and the decrease in Shijiazhuang was the most obvious, with a decrease of 34.7% compared with 2006. Compared with 2000, TP emissions in the whole province showed a downward trend, and the decrease rate was the most obvious in Langfang, Shijiazhuang and Xingtai, which were 42.54%, 39.42% and 22.21%, respectively.
According to the bulletin on the ecological environment of Hebei Province in 2018, the water quality of the eight major river systems in the province was generally slightly polluted in 2018 (Department of Ecology and Environment of Hebei Province, 2019). Among them, the water quality of Ziya River system was moderately polluted, and the main pollutants were ammonia nitrogen and total phosphorus. Ziya River flowed through Shijiazhuang, Hengshui, Handan and other places, indicating that the ANP emissions in these areas were high, which was consistent with the calculation results in this paper. In summary, the emissions of TN and TP from non-point sources were directly related to the level of local agricultural development. Generally speaking, the higher the level of local agricultural development, the more severe the ANP tended to be. Shijiazhuang, Handan, Baoding, Hengshui and Cangzhou in the southwest of Hebei Province were the key areas for non-point source pollution control.
3.2 ANP emissions and characteristic analysis
3.2.1 Analysis of ANP emissions
As shown in Table 2, the TN emissions of Hebei Province was 315,026.1 t in 2021, among which the emissions from agricultural land, livestock and poultry breeding and rural life accounted for 37%, 34% and 29% respectively. The average value of TN emissions in Hebei Province was 28,638.74 t, and the TN emissions and intensity of Baoding, Shijiazhuang, Handan, Cangzhou, Zhangjiakou, Tangshan and Xingtai were all higher than the average value, indicating that these cities should pay more attention to environmental carrying capacity and sustainable development in the process of industrial development. According to the contribution rates of TN emissions of various pollution sources in Table 2, the sources in different cities differed greatly. Among the above six cities, Cangzhou, Zhangjiakou and Xingtai were dominated by agricultural land, Shijiazhuang and Tangshan were dominated by livestock and poultry breeding, and Handan and Baoding were dominated by rural life, which was mainly related to the agricultural production structure of each city.
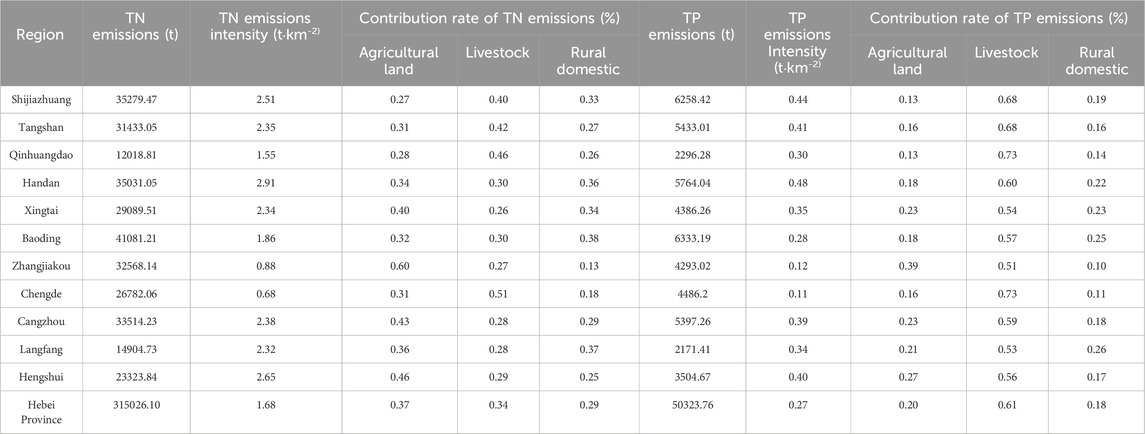
Table 2. ANP emissions and contribution rate of various pollution sources in Hebei Province in 2021.
As shown in Table 2 in 2021, the TP emissions in Hebei Province was 50,323.76 t, and the emissions from agricultural land, livestock and poultry breeding and rural life accounted for 20%, 61% and 18% respectively. The average value of TP emissions in Hebei Province was 4,574.89 t, and the TP emissions and intensity in Baoding, Shijiazhuang, Handan, Tangshan and Cangzhou were all higher than the average value. Combined with the conclusion of TN, the conclusion was similar to that of TN, indicating the consistency of ANP emissions in all cities in Hebei Province. According to the contribution rate of TP emissions of various pollution sources in Table 2, the proportion of emissions from livestock and poultry breeding in each city was more than 50%.
3.2.2 Analysis of ANP unit area pollution load coefficient
According to the analysis results of load coefficient per unit area of Hebei cities in 2021, the spatial distribution of TN and TP in different cities was basically the same (Table 3). In addition to Zhangjiakou and Chengde, the remaining cities posed a certain degree of threat to the environment. The TN and TP pollution in Shijiazhuang, Tangshan, Handan, Xingtai, Cangzhou, Langfang and Hengshui all posed a serious threat to the environment.
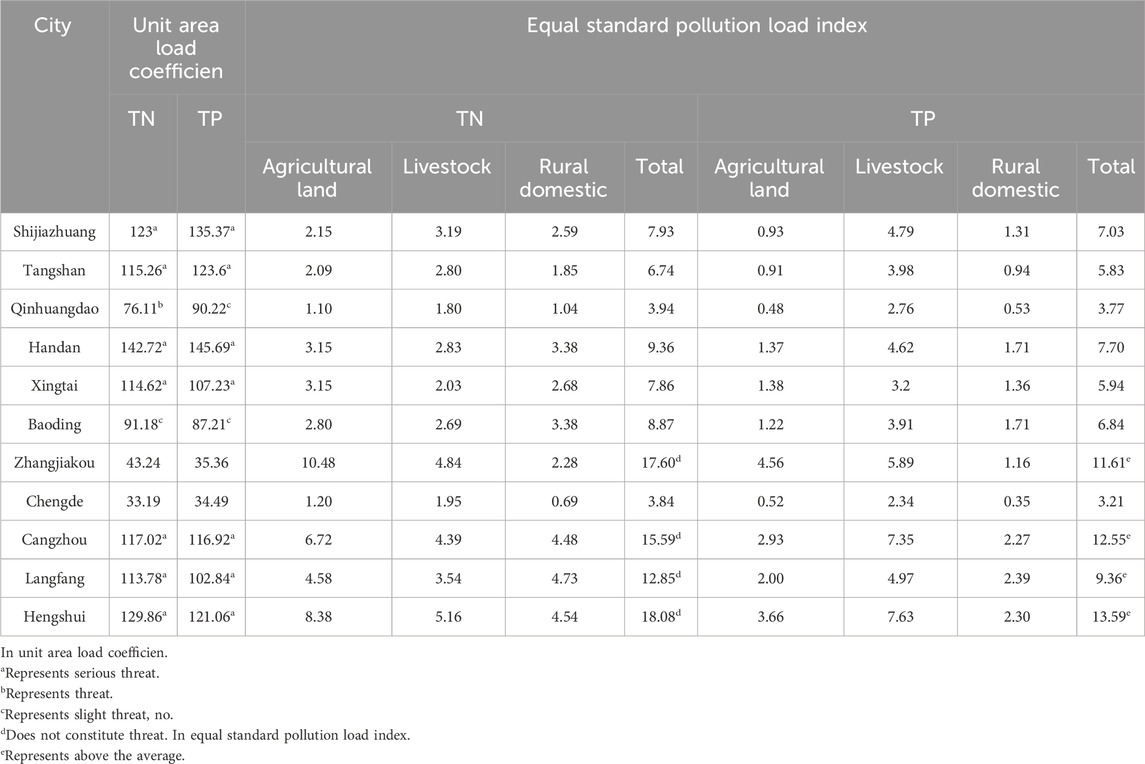
Table 3. ANP unit area load coefficient and its classification and equal standard pollution load index in Hebei Province in 2021.
3.2.3 Analysis of equal standard pollution load index
In 2021, the ranking of equal standard pollution load index of TN and TP in each city was consistent. For the equal standard pollution load index of TN and TP, Hengshui, Zhangjiakou, Cangzhou and Langfang exceeded the national average, and the average value of the above four cities was more than twice that of the other seven cities (Table 3). The emissions and intensity of TN and TP of Xingtai, Shijiazhuang and Tangshan were significantly higher than the average of Hebei, but their equal standard pollution load index was lower than the average of Hebei. It can be seen that abundant water resources played a crucial role in reducing pollution degree. The emissions and intensity of TN and TP in Langfang were lower than the average of Hebei, but the equal standard pollution load index was significantly higher than the average of Hebei, which was directly related to the large total water resources and high water environmental capacity.
3.2.4 Identification of pollution characteristics
According to the results of the cluster analysis of pollution emissions characteristics (Figure 5), cities in Hebei Province were divided into four categories: (1) Zhangjiakou city, where the contribution of agricultural land to ANP was absolutely dominant, had 50.9% of the pollution load of agricultural land and other standards, which was inevitably related to more farmland planting in this region. (2) In the cities where the contribution of livestock and poultry breeding to ANP was absolutely dominant, including Shijiazhuang, Tangshan, Qinhuangdao and Chengde, the proportion of poultry breeding was 53.5%, 54.1%, 59.3% and 61.5%, respectively. (3) The contribution of livestock and poultry breeding to ANP was the main factor, and the proportion of agricultural land was similar to that of agricultural life, including Handan, Xingtai, Baoding and Langfang. (4) The contribution of agricultural land and livestock breeding to ANP was the main factor, and the proportion of livestock breeding was larger in the cities, including Cangzhou and Hengshui. The main source of ANP pollution in Hebei was livestock breeding. It was very important to strengthen the management and pollution control of livestock breeding pollution sources to solve the problem of agricultural non-point source pollution in Hebei.

Figure 5. Equivalent pollution loadings cluster tree diagram.
3.2.5 Analysis of spatial distribution change of ANP equivalent pollution load
In 2000 and 2021, the equivalent pollution load of ANP of Hebei was 64,876,968,344 m3and 56,664,486,813 m3, with the proportion of TN and TP being 55.9% and 44.1% respectively. From west to east, the emissions of equivalent pollution load showed a decreasing trend, which might be due to the large proportion of agriculture in the western region and relatively backward industrial development, while the eastern region was relatively developed in industrialization and rich in water resources, resulting in relatively light ANP pollution. In Hebei, the equivalent pollution load of TN was higher than that of TP, and TN was the main source of ANP pressure. As can be seen from Figure 6, Livestock contributed the most to TP equivalent pollution load, and its contribution rate was significantly higher than that of agricultural land use and rural life in different cities. The contribution rate of different pollutant types to the pollution load of TN and other standards was inconsistent, which was not uniform like TP. The maximum TN and TP equivalent pollution load of Hebei in 2000 and 2021 respectively appeared in Shijiazhuang and Baoding, which were the main areas of ANP pollution. Compared with 2000, the contribution rates of different types of pollutants to TN pollution load of each city had little difference in 2021. The contribution rate of different types of pollutants to the TP load varied greatly, especially the contribution of livestock and poultry breeding to the TP load increased.
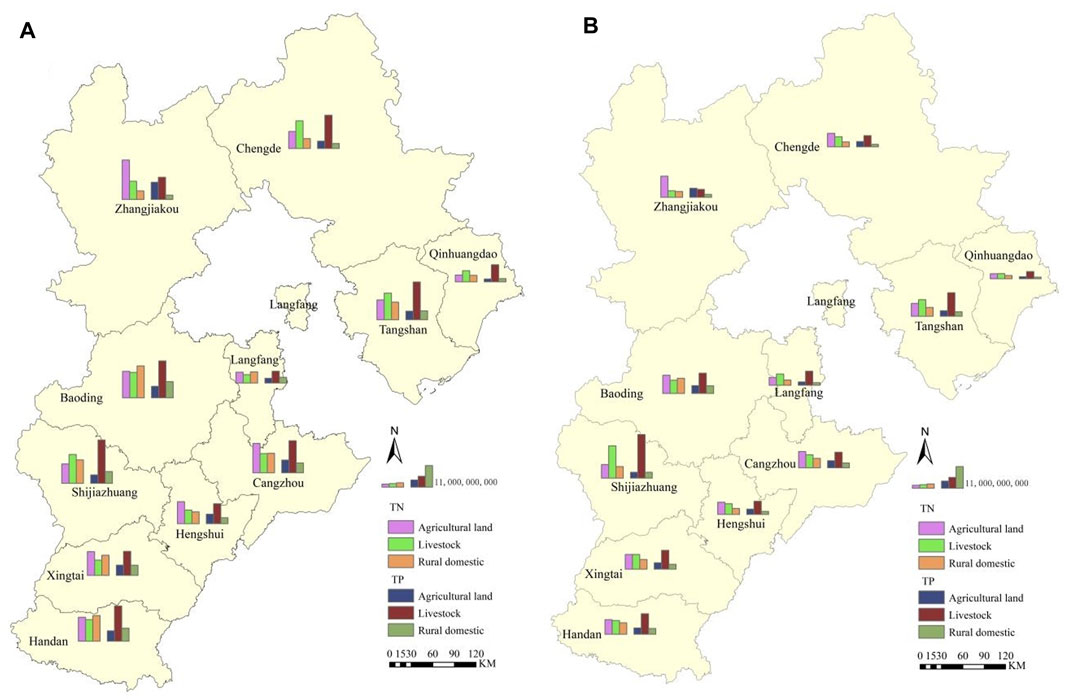
Figure 6. TN and TP equivalent pollution load in (A) 2021 and (B) 2000.
3.3 Evaluation
The results of the comprehensive evaluation of pollutants by SPSS cluster analysis indicated that Hebei Province can be classified into three categories based on the sources of ANP. The first category was characterized by agricultural land pollution, primarily in Zhangjiakou city, Cangzhou, and Hengshui. These areas had common characteristics of large agricultural land area and high fertilization intensity, it was necessary to prioritize implementing appropriate cultivation and fertilization to reduce nitrogen and phosphorus loss (Coelho et al., 2012). Notably, sewage irrigation mainly taken place in Shijiazhuang, Baoding, Cangzhou, and Handan, the direct use of unqualified sewage for farmland irrigation should be strictly prohibited. The second type was the pollution caused by the inadequate treatment of livestock and poultry breeding, mainly in Shijiazhuang, Tangshan, Qinhuangdao, and Chengde. In these areas, it was necessary to scientifically optimize the layout of breeding farms, adopt clean breeding technology, improve fecal waste treatment facilities, and promote the utilization of fecal waste resources.
The third category was pollution from rural areas. Besides Zhangjiakou, the contribution of the rural population to TN emissions in the other 10 cities showed an increasing trend, with the most significant growth observed in Langfang, Shijiazhuang, and Xingtai. These areas had a large rural population base and inadequate domestic sewage treatment facilities. Most areas lacked drainage channels and sewage treatment devices, resulting in unregulated discharge of domestic sewage (Bouwman et al., 2013; Huang et al., 2013; Cheng et al., 2018). Considering the actual situation in rural areas, it was recommended to construct sewage treatment facilities based on local conditions such as small-scale plants or constructed wetlands for effective domestic sewage treatment. Additionally, efforts should be made to improve rural toilets by promoting sanitary options to reduce fecal pollution and implementing proper treatment and utilization methods for feces.
4 Conclusion
On the time scale, the TN and TP emissions load in Hebei showed an increasing trend from 2000 to 2006, and began to decline after a stable trend from 2007 to 2021. The main reason was that the contribution of livestock and poultry farming to TN emissions had decreased significantly, especially the number of cattle decreased. On the spatial scale, the environmental impact of ANP emissions in southwest Hebei was more serious than that in Northeast Hebei Province. Accordingly, this region stood as the pivotal zone for the management of ANP within Hebei Province. Livestock breeding was the main source of ANP pollution in Hebei Province. Accordingly, the critical measure to curtail the dissemination of ANP in Hebei Province lay in the enhancement of livestock and poultry breeding management practices.
Data availability statement
The original contributions presented in the study are included in the article/Supplementary Material, further inquiries can be directed to the corresponding authors.
Author contributions
TL: Investigation, Methodology, Validation, Writing–original draft. YN: Writing–review and editing, Investigation, Methodology, Validation. JP: Investigation, Methodology, Validation, Writing–review and editing. SG: Investigation, Methodology, Validation, Writing–review and editing. YW: Formal Analysis, Investigation, Writing–review and editing. JL: Conceptualization, Supervision, Writing–review and editing. YX: Conceptualization, Supervision, Writing–review and editing. LW: Conceptualization, Funding acquisition, Supervision, Writing–review and editing.
Funding
The author(s) declare that financial support was received for the research, authorship, and/or publication of this article. This study was supported by Shenzhen Science and Technology Innovation Commission (20231128105823001), Shenzhen Polytechnic Scientific Research Initiation Project (6023310038K), and National Water Pollution Control and Treatment Science and Technology Major Project (2018ZX07109).
Conflict of interest
Author YN was employed by Bceg Environmental Remediation Co., Ltd.
The remaining authors declare that the research was conducted in the absence of any commercial or financial relationships that could be construed as a potential conflict of interest.
Publisher’s note
All claims expressed in this article are solely those of the authors and do not necessarily represent those of their affiliated organizations, or those of the publisher, the editors and the reviewers. Any product that may be evaluated in this article, or claim that may be made by its manufacturer, is not guaranteed or endorsed by the publisher.
Supplementary material
The Supplementary Material for this article can be found online at: https://www.frontiersin.org/articles/10.3389/fenvs.2024.1439806/full#supplementary-material
References
Bouwman, L., Goldewijk, K.K., Van Der Hoek, K.W., Beusen, A.H.W., Van Vuuren, D.P., Willems, J., et al. (2013). Exploring global changes in nitrogen and phosphorus cycles in agriculture induced by livestock production over the 1900-2050 period. Proc. Natl. Acad. Sci. 110 (52), 20882–20887. doi:10.1073/pnas.1012878108
Chang, H. (2008). Spatial analysis of water quality trends in the Han River basin, South Korea. Water Res. 42 (13), 3285–3304. doi:10.1016/j.watres.2008.04.006
Cheng, J., and Jia, T. (2017). Prediction of non-point source load based on STELLA and export coefficient method and prevention measures. Water Resour. Prot. 33 (3), 74–81. doi:10.3880/j.issn.1004-6933.2017.03.014
Cheng, X., Chen, L., and Sun, R. (2017). Estimation of non-point source pollution loads of Beijing-Tianjin-Hebei region considering precipitation and topography. Trans. CSAE 33 (4), 265–272. doi:10.11975/j.issn.1002-6819.2017.04.036
Cheng, X., Chen, L., Sun, R., and Jing, Y. (2018). An improved export coefficient model to estimate non-point source phosphorus pollution risks under complex precipitation and terrain conditions. Environ. Sci. Pollut. Res. Int. 25 (21), 20946–20955. doi:10.1007/s11356-018-2191-z
Coelho, B.R.B., Murray, R.C., Lapen, D.R., Topp, E.A., and Bruin, A.D. (2012). Phosphorus and sediment loading to surface waters from liquid swine manure application under different drainage and tillage practices. Agric. Water Manag. 104, 51–61. doi:10.1016/j.agwat.2011.10.020
Department of Natural Resources of Hebei Province (2021). Main data bulletin of the third national land survey of Hebei province. Available at: https://zrzy.hebei.gov.cn/heb/gongk/gkml/gggs/qtgg/zrdcc/.
Ding, X., Shen, Z., Hong, Q., Yang, Z., Wu, X., and Liu, R. (2010). Development and test of the export coefficient model in the upper reach of the yangtze river. J. Hydrol. 383 (3), 233–244. doi:10.1016/j.jhydrol.2009.12.039
Ghebremichael, L.T., Veith, T. L., and Hamlett, J.M. (2013). Integrated watershed- and farm-scale modeling framework for targeting critical source areas while maintaining farm economic viability. J. Environ. Manage 114, 381–394. doi:10.1016/j.jenvman.2012.10.034
Hou, L., Zhou, Z., Wang, R., Li, J., Dong, F., and Liu, J. (2022). Research on the non-point source pollution characteristics of important drinking water sources. Water 14 (2), 211. doi:10.3390/w14020211
Hu, Q., Guo, H., Wang, Y., Zhang, Y., Li, Z., Fu, Z., et al. (2021). Estimation of agricultural non-point source pollution loads based on improved export coefficient model. Acta Sci. Nat. Univ. Pekin. 57 (04), 739–748. (in Chinese). doi:10.13209/j.0479-8023.2021.049
Huang, L., Ban, J., Han, Y., Yang, J., and Bi, J. (2013). Multi-angle indicators system of non-point pollution source assessment in rural areas: a case study near Taihu Lake. Environ. Manage. 51, 939–950. doi:10.1007/s00267-013-0024-x
Ierodiaconou, D., Laurenson, L., Leblanc, M., Stagnitti, F., Duff, G., Salzman, S., et al. (2005). The consequences of land use change on nutrient exports: a regional scale assessment in south-west Victoria, Australia. J. Environ. Manage. 74 (4), 305–316. doi:10.1016/j.jenvman.2004.09.010
Li, X., and Shang, J. (2023). Spatial interaction effects on the relationship between agricultural economic and planting non-point source pollution in China. Environ. Sci. Pollut. Res. Int. 30 (18), 51607–51623. doi:10.1007/s11356-023-25929-2
Liu, J., Zhang, L., Zhang, Y., Hong, H., and Deng, H. (2008). Validation of an agricultural non-point source (AGNPS) pollution model for a catchment in the Jiulong River watershed, China. J. Environ. Sci. 20 (5), 599–606. doi:10.1016/s1001-0742(08)62100-2
Ma, X., Li, Y., Zhang, M., Zheng, F., and Du, S. (2011). Assessment and analysis of non-point source nitrogen and phosphorus loads in the three gorges reservoir area of hubei province, China. Sci. Total Environ. 412-413, 154–161. doi:10.1016/j.scitotenv.2011.09.034
Ongley, E. (2004). NonPoint source water pollution in China: current status and future prospects. Water Int. 29, 299–306. doi:10.1080/02508060408691784
Qi, H., Altinakar, M.S., Vieira, D.A.N., and Alidaee, B. (2008). Application of tabu search algorithm with a coupled AnnAGNPS-CCHE1D model to optimize agricultural land Use1. J. Am. Water Resour. Assoc. 44 (4), 866–878. doi:10.1111/j.1752-1688.2008.00209.x
Schipper, P.N.M., Bonten, L.T.C., Plette, A.C.C., and Moolenaar, S.W. (2008). Measures to diminish leaching of heavy metals to surface waters from agricultural soils. Desalination 226 (1), 89–96. doi:10.1016/j.desal.2007.02.100
Shao, J., Liu, C., Yan, X., and Yang, L. (2019). Cadmium distribution characteristics and environmental risk assessment in typical sewage irrigation area of Hebei Province. Acta Sci. Circumstantiae 39 (03), 917–927.
Shen, Z., Chen, L., Ding, X., Hong, Q., and Liu, R. (2013). Long-term variation (1960-2003) and causal factors of non-point-source nitrogen and phosphorus in the upper reach of the Yangtze River. J. Hazard. Mater. 252-253 (45-56), 45–56. doi:10.1016/j.jhazmat.2013.02.039
Sun, J., and Xu, B. J. (2013). Future trend of the technology for healthy breeding of hens. Chin. Agric. Sci. Bull. 29 (2), 1–5. doi:10.11924/j.issn.1000-6850.2012-3020
Tong, B., Zhang, H., Gao, X., Hou, Y., and Ma, W. (2018). Nitrogen flow and environmental effects of crop-livestock system in typical area of North China plain-A case study in Hebei province. Chin. Agric. Sci. 51 (3), 442–455. doi:10.3864/j.issn.0578-1752.2018.03.005
Wang, Q., and Jin, J. (2010). Space difference research of the grain production in Hebei province. J. Nat. Resour. 25 (09), 1525–1535. (in Chinese). doi:10.11849/zrzyxb.2010.09.012
Wang, S., Yang, D., Sun, J., Tang, L., Wang, P., and Lu, S. (2021). Analysis on status and characteristics of agricultural non point source pollution in China. Water Resour. Prot. 37 (4), 140–147. doi:10.3880/j.issn.1004-6933.2021.04.021
Wang, Y., Zhang, X., and He, Y. (2024). Improved export coefficients enhanced export coefficient model’s accuracy in assessing agricultural non-point pollution: a Jialing River Basin study. Environ. Earth Sci. 83 (11), 359. doi:10.1007/s12665-024-11679-y
Worrall, F., and Burt, T.P. (1999). The impact of land-use change on water quality at the catchment scale: the use of export coefficient and structural models. J. Hydrol. 221 (1), 75–90. doi:10.1016/s0022-1694(99)00084-0
Xia, T., Chen, Z., and Song, J. (2017). New normal control of agricultural non-point source pollution in the dianchi Lake Basin. Meteorol. Environ. Res. 8 (2), 10. (in Chinese).
Xin, Z., Ye, L., and Zhang, C. (2019). Application of export coefficient model and QUAL2K for water environmental management in a rural watershed. Sustainability 11 (21), 6022. doi:10.3390/su11216022
Xu, W., Liu, L., Zhu, S., Sun, A., Wang, H., and Ding, Z. (2023). Identifying the critical areas and primary sources for agricultural non-point source pollution management of an emigrant town within the Three Gorges reservoir area. Environ. Monit. Assess. 195 (5), 602. doi:10.1007/s10661-023-11180-2
Yan, B., Cao, Qi., Yan, S., Gao, Z., Liu, D., and Li, Y. (2023). Analysis of spatial distribution characteristics of non-point source pollution in liaoning province. Water 15 (16), 3014. doi:10.3390/w15163014
Zhang, M., and Xu, J. (2011). Nonpoint source pollution, environmental quality, and ecosystem health in China: introduction to the special section. J. Environ. Qual. 40 (6), 1685–1694. doi:10.2134/jeq2011.0170
Keywords: agricultural non-point, pollution emission, nitrogen, phosphorus, Hebei Province
Citation: Li T, Niu Y, Pang J, Geng S, Wang Y, Li J, Xiong Y and Wang L (2024) Temporal and spatial characteristics of agricultural non-point source pollution in Hebei Province from 2000 to 2021. Front. Environ. Sci. 12:1439806. doi: 10.3389/fenvs.2024.1439806
Received: 29 May 2024; Accepted: 29 July 2024;
Published: 12 August 2024.
Edited by:
David William O’Connell, Trinity College Dublin, IrelandCopyright © 2024 Li, Niu, Pang, Geng, Wang, Li, Xiong and Wang. This is an open-access article distributed under the terms of the Creative Commons Attribution License (CC BY). The use, distribution or reproduction in other forums is permitted, provided the original author(s) and the copyright owner(s) are credited and that the original publication in this journal is cited, in accordance with accepted academic practice. No use, distribution or reproduction is permitted which does not comply with these terms.
*Correspondence: Lei Wang, d2FuZ2xlaWNyYWVzQDE2My5jb20=; Ji Li, bGlqaUBzenB0LmVkdS5jbg==; Yanna Xiong, MTg4MTE3ODU5MjJAMTYzLmNvbQ==