
94% of researchers rate our articles as excellent or good
Learn more about the work of our research integrity team to safeguard the quality of each article we publish.
Find out more
ORIGINAL RESEARCH article
Front. Environ. Sci., 30 September 2024
Sec. Environmental Citizen Science
Volume 12 - 2024 | https://doi.org/10.3389/fenvs.2024.1433489
 Marisa Westbrook1*
 Valentina Serrano-Salomón2
 Jay Pecenka2Sumit Sankhyan3Aniya K. Hollo3Shelly L. Miller3
 Esther Sullivan2
Community science has increased in popularity in communities where residents hope to investigate the relationship between environmental issues and personal health. This study partnered with neighborhoods in the most polluted residential zip code in the US to conduct community science air quality monitoring. We conducted 60 semi-structured interviews after two monitoring deployments to understand participants’ subjective experiences of pollution exposure, their engagement with low-cost air quality monitors, and their data interpretation. We utilize the environmental health concept ‘exposure experience’ to analyze how participants use personal monitors, understand their data, and reinterpret their pollution exposure as a result. We further explore how participants’ understandings are circumscribed by the technological features of low-cost monitors. We find that participants adopt both protective and mitigating behavioral changes based on information gained from personal experiments and hypothesis testing while using the monitors. Of their own accord, 40% of participants in this study adopted mitigation behaviors after identifying sources that impacted their personal air quality. Our analysis reveals that real-time data accessibility through low-cost monitors builds exposure awareness and enables residents of environmental justice communities to test, validate, or invalidate sensory experiences and challenge existing assumptions. These findings point to specific pathways for using low-cost monitors to support individual decision-making and contribute to behavioral change. Findings also identify some limitations of low-cost monitors; designers of low-cost monitors should consider how composite Air Quality Scores may encourage community scientists to equally value scientifically-established pollutants (e.g., PM) with less scientifically-established pollutants (e.g., TVOCs), without additional scientific training and health-related information.
Air pollution is one of the leading causes of death worldwide, making air quality a major public health concern (Reddy and Roberts, 2019). Air quality (AQ) is an important way individuals experience environmental pollution (Kelly and Fussell, 2015). The knowledge gained from measuring one’s exposure to pollution can be a remedy to concerns about the links between local contamination and health (Messer et al., 2019). Given that traditional, fixed location, outdoor air monitors do not document individual AQ exposure, personalized AQ monitoring is a key area of study based on the ability to collect real-time, localized individual data (deSouza, 2022).
Community science is a collaborative approach to gathering environmental data (Jalbert and Kinchy, 2016; Carrera et al., 2018; Adams et al., 2011) and an effective tool for measuring people’s exposure to air pollution (Gabrys and Barratt, 2016; Commodore et al., 2017; Da, 2022; Griswold et al., 2022). AQ monitoring in community science fosters participation in environmental issues and, potentially, policy (Ottinger, 2013). Some scholars have referred to this approach as citizen science (Commodore et al., 2017; Matz et al., 2017), street science (Corburn, 2005), civic science (Cordner et al., 2019), and lay participation (Allen, 2018). We use the term community science to refer to the approach where community members participate to generate knowledge about local environmental hazards that cannot be as easily addressed by academic researchers alone and require strong community partnerships (Da, 2022; Masri et al., 2022a).
Community science is an important method in environmental justice (EJ) communities, which are where people of color and low-income people are disproportionately affected by environmental hazards such as unhealthy air, unsafe drinking water, chemicals, toxic waste, and pesticides (Bullard and Wright, 1993). In these communities, a legacy of environmental contamination and failed policy responses produces poor health outcomes, breeds skepticism of academic research, limits participation due to feelings of powerlessness, and reduces the impact of data-driven responses (Goldberg-Freeman et al., 2007). Community science creates opportunities for participants to inform research at multiple steps in the process and counters perceptions of data gathering as extractive in EJ communities (Carrera et al., 2018; Corburn, 2005). Community science provides EJ communities with opportunities to learn about localized AQ and pollution risks (Griswold et al., 2022) and contribute to environmental health science by posing questions that community members care about and providing ways of knowing that improve health (Allen, 2018).
For this study, we partnered with four EJ communities to equip residents with low-cost monitors to measure their personal pollution exposure over two 30-day deployments. Personal exposures depend on the air pollution concentration that is present at the location of the person and how much time is spent in that location. These monitors measure the air pollution concentration near the person as they move through their day through an Air Quality Score (AQS), a composite index of particulate matter (PM) and total volatile organic compounds (TVOCs). They were chosen for this study for their ease of operation through a dedicated smartphone application and lightweight nature so that they can be carried by each participant as they go about their daily proceedings. We followed up with participants after each deployment and conducted individual interviews to understand their motivations for using a monitor, experiences monitoring personal environments, and interpretations of daily exposure concentration data. We interviewed 38 participants who had used the monitor at two different periods, for a total of 60 interviews.
By partnering with participants to monitor their personal environments, we seek to answer the following questions:
How do residents of an EJ community engage with low-cost monitors and interpret their AQS data?
How do EJ community residents use data provided by low-cost monitors to assess their daily personal exposure?
How do low-cost monitors contribute to community science and shape participants’ experiences of environmental exposure?
Does this lead to changes in home environments, behaviors, and/or routines?
This paper first briefly reports examples of the type of personal pollution exposure concentrations documented by community scientists participating in this study, then focuses on participants’ experiences using personal monitors and receiving real-time data about their homes, work, and neighborhoods. We also inquired how participants modified their behaviors based on these data. Our analysis explores the ways these data impacted their understanding of their personal environment, health, and “exposure experience” (Altman et al., 2008).
Community air monitoring provides people with detailed information about their personal air quality. Lay participants’ interpretation of exposure data is multifaceted; technical information and their lived experience are intertwined (Altman et al., 2008). Altman et al. (2008) conceptualize the process of learning about hazardous exposure and the resulting frame of mind as the “exposure experience.” This concept draws attention to the embodied experience of individuals as they learn about chemicals in their bodies and personal environments (Adams et al., 2011; Altman et al., 2008), and helps to “evaluate the personal, ambiguous experience of living with chronic pollutant exposures” (7 p. 181). The social or lived experience of environmental risk has been “commonly overlooked or underappreciated” by risk mitigation scholars (28 p. 432). Centering the lived experience of environmental sensing and analyzing the interpretations of personalized data delivered through low-cost monitors can help us understand how data accessibility shapes exposure experience.
Learning from EJ communities is a form of knowledge justice (Allen, 2018) that can change inequitable social conditions (Corburn, 2005). Ottinger et al. (2016) highlight the capacity for community science to foster epistemic justice, a central component of EJ that acknowledges people’s right to be respected as knowers (Ottinger, 2023). Community scientists’ knowledge is often derived from their own experiences using their bodies as the primary sensor (Cordner et al., 2019). Even with no prior scientific training, community scientists can engage in complex science, and produce situated data on exposures and health that, when combined with traditional epidemiological methods, can improve scientific inquiry (Corburn, 2005).
AQ is a key aspect of the exposure experience (Altman et al., 2008) and a growing site of community science. Low-cost monitors enable users to measure indoor and outdoor AQ, democratize data for community use, and Supplementary Material provided by high-cost fixed monitoring stations typically run by government agencies (deSouza, 2022; Mahajan et al., 2021). AQ monitoring projects that aim to develop and use low-cost monitors to facilitate citizen engagement increase AQ awareness (Mahajan et al., 2021) and contribute to people’s ability to recognize risks (Griswold et al., 2022). Personal monitors, which are monitors that are carried around with the user, can increase awareness of personal air pollution (Boso et al., 2020). Community participation can lead to collective efficacy and feelings of empowerment (Messer et al., 2019) by providing opportunities to “engage with new technologies and build knowledge about local AQ conditions” (Hubbell et al., 2018). It can also lead to behavioral change (McCarron et al., 2023; Park et al., 2023). Motivating factors to participate in community science projects include concerns for air pollution health risks, residing near polluted and unmonitored areas, a general quest for improved knowledge (Gabrys and Barratt, 2016; Commodore et al., 2017), and controlling and reducing personal exposure (Durkin et al., 2020). Community scientists can use personal monitors in four primary ways: 1) to validate suspicions of exposure, 2) as “environmental health thermometers” to test AQ and make health decisions, 3) as “epistemic objects” to test the tools’ efficacy; and 4) as passive objects by those who rarely interact with the monitors (Matz et al., 2017).
Personal monitors, when paired with community science, offer major advances and new directions in environmental health research. Personal monitors create a direct, less mediated, relationship between people and their data. The ability to measure one’s pollution levels in different locations, such as when driving on a highway or cooking at home, can both reduce distrust towards information about pollution from organizations and remedy fear residents have about present but undetected local contamination (Messer et al., 2019). Yet, there are also concerns about personal AQ monitoring, including the quality of data, the burden of monitoring on the community, and how monitors seem to propose individual solutions to structural problems (Matz et al., 2017). AQ readings can be alarming, and without mitigation options and a deep understanding of air quality science, individuals may become disinterested or feel powerless, increasing anxiety and reducing wellbeing (Adams et al., 2011; Hubbell et al., 2018). Monitor data must also be processed for quality and understanding, translated for users, and ancillary information collected to explain unusually high or low readings (Hubbell et al., 2018). Thus, report-back procedures, follow-up studies, and interventions should be incorporated (Adams et al., 2011).
Community science has been used to explore the experiences of participants using low-cost monitors to understand their motivations to participate in community sensing studies (Durkin et al., 2020), to identify learning outcomes (Da, 2022; Griswold et al., 2022) or, to explore attitudinal and behavioral effects (Matz et al., 2017; Boso et al., 2020; Durkin et al., 2020). Many focus on the experience of collecting only indoor data, using tabletop monitors (Matz et al., 2017; Durkin et al., 2020). Studies have assessed participants’ experiences using portable low-cost monitors that measure personal exposure to both indoor and outdoor air such as the AirCasting Brussels Project (Da, 2022; Clayton et al., 1993). Finally, personal exposure studies that analyze participants’ experiences typically occur when scientists return with data and provide “report-back” summaries (Altman et al., 2008; Becker et al., 2021; Tomsho et al., 2019). These forms of “report-back” can impact perceptions and personal experience, but also introduce lag time between participants engaging with monitoring data and the interview.
This study expands this existing research and is novel in four ways: First, we utilize a small, wearable, personal monitor (the Atmotube PRO) that measures AQ and relays this information instantaneously to participants’ smartphones via an app. This allows participants and researchers to better understand the full range of people’s AQ and their exposure experience, especially within the home. Second, we partner with residents in a highly polluted community where many people have existing AQ concerns; these communities provide an important site within which to question the subjective response to using monitoring technology. Third, we conduct repeated interviews to explore the different ways participants engage with the monitor after two intensive 30-day periods where they check, visualize, and report (via synching) their data daily. We capture not only the outcomes of their air monitoring, but also the methods they use to digest their data, the complexities they consider, and the types of experiments they perform. Fourth, we conduct interviews immediately after monitor deployment to document participants’ raw experience after participating in a personal exposure study, before they receive scientific analysis from researchers or data comparisons to other participants (this study conducted later field deployments where participants received personalized data reports). Thus, participants describe their exposure experience and share their raw interpretation of their data without scientific influence. We show how participants engage with these tools, interpret these technologies, and incorporate experiences into practical approaches to navigating environmental health risks.
This study involves residents from four neighborhoods in North Denver, Colorado–Globeville, Elyria-Swansea, Cole, and Clayton, hereafter referred to as GESCC. GESCC is an EJ community, sometimes referred to as “overburdened” community by the U.S. Environmental Protection Agency (EPA). EJ Communities are defined by the EPA as historically disadvantaged neighborhoods with high rates of low-income households and/or households of color that face disproportionately high and adverse effects from industrial facilities, environmental hazards, and pollution (US Environmental Protection Agency EPA, 2023). The zip code that encompasses all of Globeville and Elyria Swansea and most of Clayton and Cole was designated as the most polluted residential ZIP code in the US, according to an environmental risk index (based on AQ index, number of pollution-generating facilities, and number of locations designated as “Superfund” or “brownfield” sites by the EPA due to pollution with hazardous materials) (ATTOM Data Solutions, 2016). GESCC includes single-family homes, duplexes, apartments, and small businesses interspersed with industrial facilities, such as asphalt manufacturers, tank storage, the Purina dog food factory, and the neighboring Suncor oil and gas refinery. GESCC neighborhoods are also intersected by two major interstate highways, I-25, and I-70. In 2018, The City of Denver approved a $1.2 billion construction project to expand a ten-mile stretch of I-70 through the neighborhoods, leading to lawsuits citing expected environmental and health impacts. The issue of AQ is prominent in GESCC communities as indicated by the presence of multiple community organizations that have AQ and odors as part of their mission (for a list, see project website, https://www.sjeqdenver.com/collaborators). Multiple studies documenting poor air quality compared to the Denver Metro area have been conducted in these neighborhoods as well (Tomsho et al., 2019; Bradley et al., 2024; Cho et al., 2019; Considine et al., 2021; Eltarkawe and Miller, 2019; Morgan et al., 2015; Wang et al., 2019).
The study, Social Justice and Environmental Quality–Denver (SJEQ-D), received ethics approval from the University of Colorado’s Institutional Review Board. The study obtained informed written consent from all participants, as well as oral consent at the beginning of each interview.
Over the Spring and Summer 2021, before beginning air monitoring, we contacted GESCC community organizations, attended community events, and used research assistants and community connectors who were residents of these communities to engage 32 GESCC residents in focus groups in English and Spanish to identify their primary environmental concerns in the four neighborhoods. Snowball sampling was used as a recruitment technique where early-stage research participants are asked to help identify additional research participants and is a well-studied successful way to ensure a diverse sample–useful in our study in an over-researched community where community members are more willing to participate in studies that are trusted by their peers or recommended by community-based organizations. We coded and analyzed these initial focus group transcripts to identify key themes. We learned that community members are informed about AQ issues and other environmental concerns in their neighborhoods, though community members had little baseline knowledge about the composition of air pollution (e.g., PM2.5 versus PM10). TVOCs (e.g., cleaning supplies) were not mentioned during the focus groups. Participants received little information from existing AQ monitoring during neighborhood redevelopment projects and were concerned about pollution from existing industrial facilities, construction, and increased traffic due to redevelopment. They also had health concerns (including worsening asthma and respiratory issues) and were experiencing consistent noise, increased pollution, and other inconveniences such as longer commutes. Participants were frustrated, stressed, and unsure about how to move forward. We published public-facing reports and summary videos about the focus groups that were made available to all study participants and distributed to the community organizations we worked with.1
We recruited GESCC residents into the larger research study by first conducting broad outreach with over fifteen community organizations and service providers through social media and newsletters, flyers in food assistance boxes, tabling at 40 local events, and distributing thousands of flyers door-to-door before each field deployment. We also partnered with several Latino-oriented community organizations for recruitment to ensure that our sample represented the majority Latino/Hispanic population of these neighborhoods (see Table 1). Using this strategy, we engaged 50 study participants to use air quality monitors for Field Deployment 1 and 2 (Figure 1, spatial distribution across neighborhoods of interviewed monitor users). About 50% of monitor users were recruited via direct flyering, while the remaining 50% were recruited via social media, newspapers and email lists, community organizations and events, and snowball sampling from other participants. After each deployment, we invited a sub-sample of 30 monitor users to participate in an interview with the authors on the phone. Inclusion criteria for participating in the study were that the participant lived in the target neighborhoods (GESCC), was willing to carry the monitor continuously for 30 days, and had a smartphone where monitor data could sync automatically. Participants were selected for interviews if they participated in the full month of monitor use and did not have significant monitor malfunction. Interview participants were contacted in order of those who used it the most (according to days of data synced, identified as between 25 and 30 days). These inclusion criteria limit our total sample to those with smartphones and the additional interview criteria may introduce selection bias towards those most interested in the monitor (i.e., those that used it most). Additionally, conducting community science of the kind analyzed here does not allow for a random sample. However, we believe our extensive community-engaged recruiting efforts resulted in a sample that is reflective of key demographics of the community (Table 1). Additionally, community-engaged recruiting allowed us to include difficult-to-reach households (such as low-income and Spanish-speaking households, Table 1). For example, while participants need a smartphone to participate in air monitoring, this did not bias our sample toward more affluent individuals; 70.3% of monitor users interviewed earned a household income less than Denver’s median household income. In addition, smartphone ownership was not required for other aspects of our study, and only four individuals without a smartphone enrolled in our larger research project.
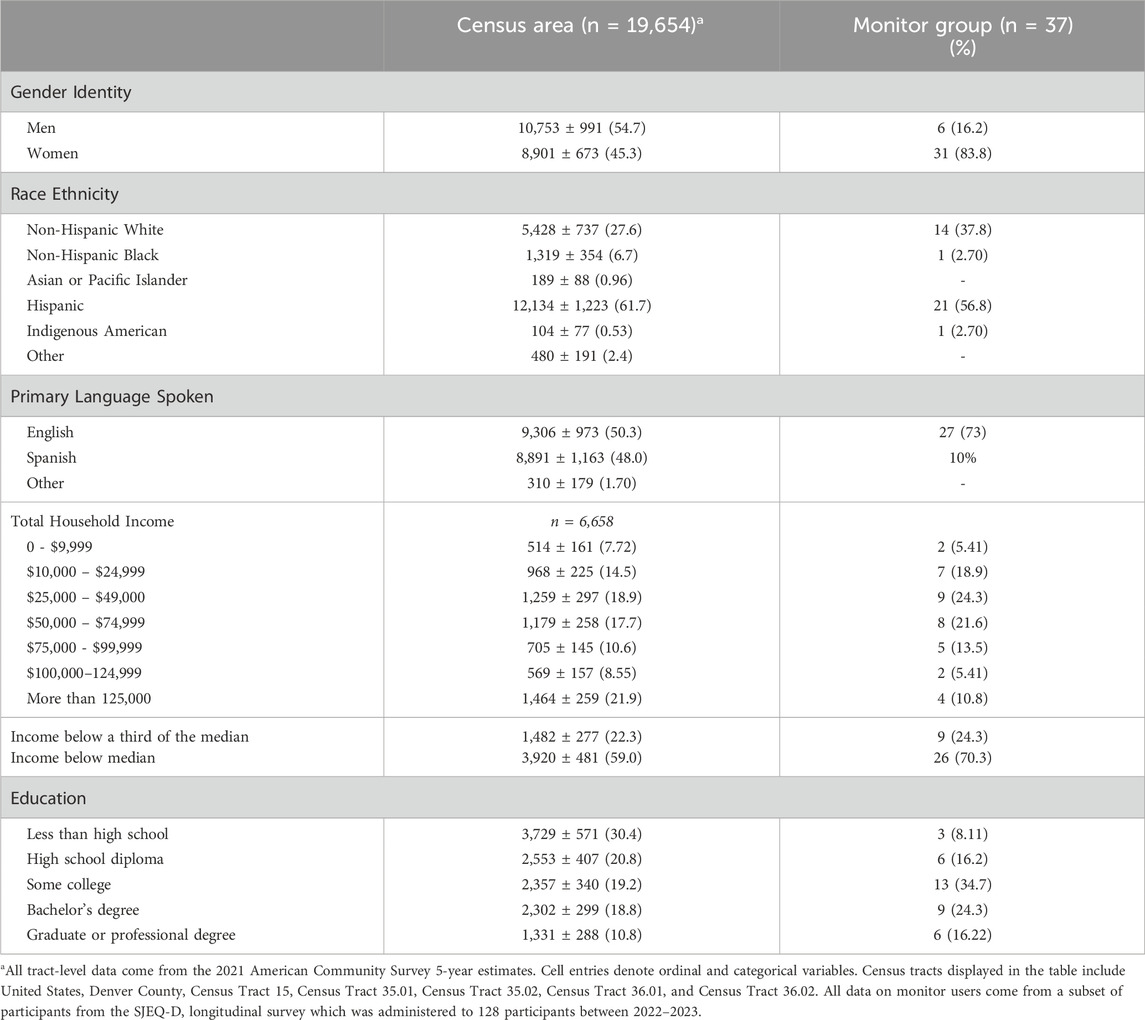
Table 1. Descriptive characteristics by study area (5 Census tracts) and air quality monitor sample group.
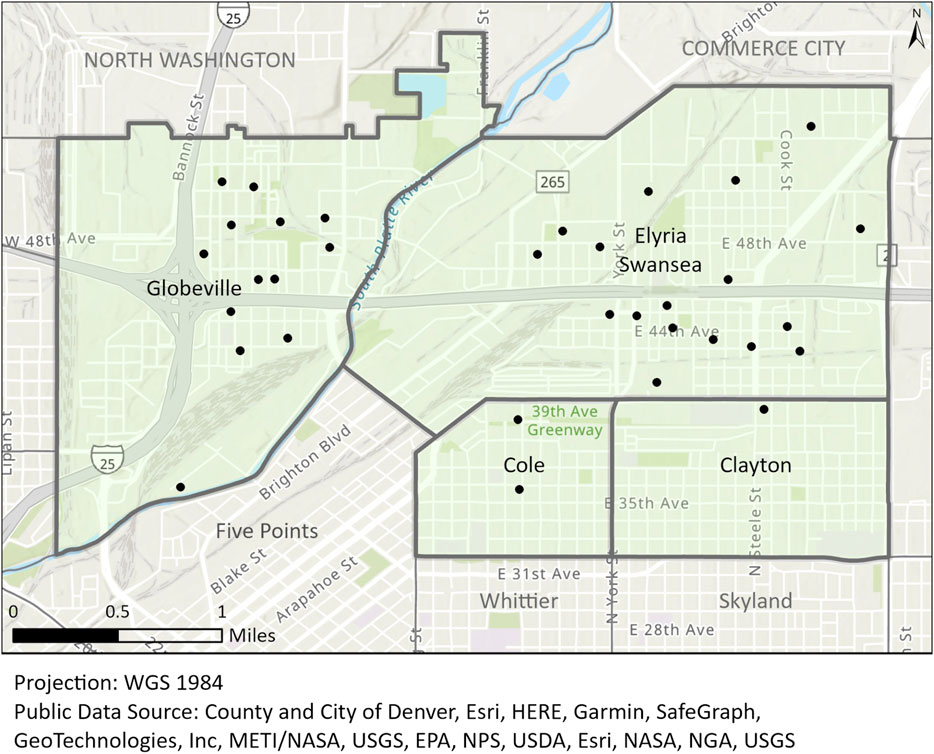
Figure 1. Spatial distribution of air quality monitor users interviewed during Deployments 1 and 2. Note: Points jittered by a quarter mile to anonymize participants’ homes.
Participants received $30 for using the monitor for a month and $25 for participation in each interview. After Field Deployment 1, 30 monitor users were interviewed. After Field Deployment 2, 22 individuals were interviewed again and eight individuals were recruited as new interviewees due to attrition in our sample (4 people left the study and four people were not interested in a second interview). In summary, 22 individuals were interviewed twice (after each deployment) and 16 were interviewed once (sample = 38 unique individuals, 60 total interviews). All participants were surveyed on demographic and housing characteristics via Qualtrics at the study start. This sample size (38 participants, 60 interviews) fits with the standards of qualitative social science designed to capture a range of experiences (Hennink and Kaiser, 2022; Vasileiou et al., 2018) among the 50 participants using the air monitors each deployment. All participants are given pseudonyms in the findings reported below.
Participants carried the wearable monitor Atmotube PRO (ATMO®, San Francisco, CA, USA). The Atmotube PRO was chosen because focus groups indicated the community members’ main concern was PM (mainly from highway traffic and construction pollution) and its negative health impacts. Particulate matter (PM) refers to a mixture of solid and liquid air particles emitted by sources like traffic, gas ranges, and construction. When inhaled, these particles pose serious health risks due to their small particle size (EPA, 2022b). The Atmotube PRO is particularly good at measuring PM2.5 (it also measures PM1 and PM10) as documented in a widely cited field and lab test conducted by the South Coast Air Quality Monitoring Division demonstrating high correlation for the Atmotube PRO’s PM2.5 data in comparison to a FEM GRIMM monitor (R2 ∼ 0.89 for hourly averaged mean) (South Coast Air Quality Management District SCAQMD, 2021). This is in addition to several lab characterization studies done on the Sensirion SPS30 PM sensor (the PM2.5 sensor contained within the Atmotube PRO) (South Coast Air Quality Management District SCAQMD, 2021; Demanega et al., 2021; Kuula et al., 2020; Kwon et al., 2021; Masri et al., 2022b; Tryner et al., 2020; Vogt et al., 2021).2 In addition to PM, Atmotube PRO measures total volatile organic compounds (TVOCs), temperature, and relative humidity and the app displays measured values in real-time of these parameters. VOCs encompass a large group of chemicals ranging from harmless smells to hazardous compounds such as benzene. TVOC, measured in the Atmotube PRO by the widely used MOX sensor, has been used for many years in indoor air studies as an aggregate parameter. A disadvantage of these sensors is that the response factor is varying and often unknown, leading to inaccuracies (Ródenas García et al., 2022), specifically in complex chemical mixtures (Caron et al., 2016). TVOC was recognized early on as not toxicologically based, cannot be used for investigating health-related issues, and thus is only suitable for screening purposes (Salthammer, 2022).
The linked Atmotube PRO smartphone app (“Atmotube,” developed by ATMO®) provides real-time data to users at an average interval of 1 minute. The app displays a composite Air Quality Score (AQS), generated through an algorithm that incorporates the threshold values for PM1, 2.5, 10 and TVOCs (the algorithm is available open-source through Atmotube’s website: atmotube.com/atmotube-support/what-is-air-quality-score-aqs). AQS was designed to reflect immediate local changes in air quality, from 1 minute to the next, compared to the US EPA’s Air Quality Index (AQI) (which does not have the same fine grain temporal quality, and is measured by regulatory monitors to meet the National Ambient Air Quality Standards). The AQS ranges between 0 and 100, where 0 indicates the poorest AQS (shown with a red color) and 100 the best AQS (indicated with a green color) (Figure 2). The AQS will change and drop from 100 (excellent air quality) to a lower number if any one pollutant is registered above one of the thresholds–for example, if PM2.5 levels are recorded as close to 0 but VOC channel reads 1ppm (the threshold between moderate and polluted), you will see a drop in the AQS (and vis versa). The app also provides limited information related to understanding types of potential contaminants, levels noted as harmful to health, and actions that should be undertaken to reduce risk exposure. The study team translated the Atmotube smartphone application language to make it understandable for Spanish-speaking participants since it is not available in Spanish.
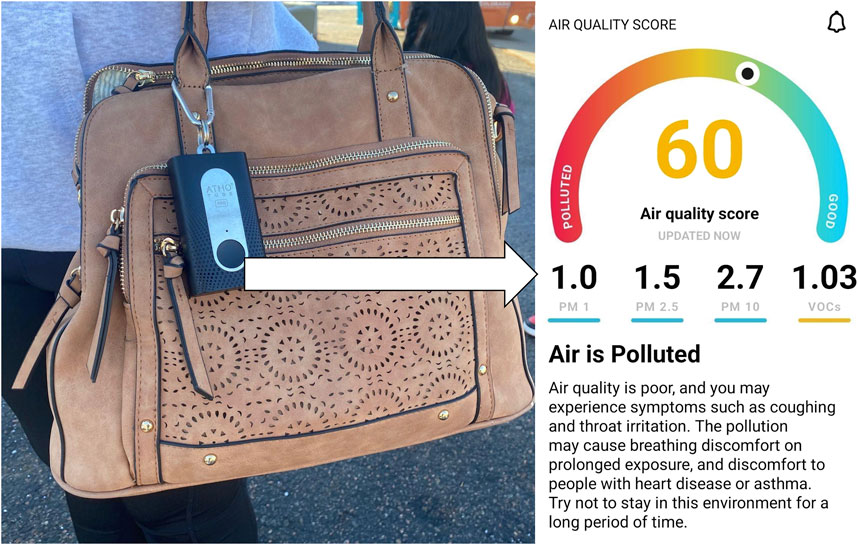
Figure 2. Atmotube PRO air quality monitor carried by a study participant attached to their purse, and a participant screenshot of the linked smartphone app that provides real-time air quality data. Note for Figure 2: For PM, the units are micrograms per cubic meter (µg/m3). The units for TVOC is parts per million (ppm).
Before each field deployment, we eliminated any defective Atmotube PRO monitors through our collocation testing (∼5% of monitors that we purchased were defective). During deployments, the study team visited each participant at their home for up to 30 minutes to support equipment set up and provide training, using a script and informational handout, on: how to use the monitor (e.g., keeping it within two feet of them at all times indoors and outdoors), monitor limitations (e.g., what they were capable of measuring and how to keep them functioning well), the contents of Atmotube PRO smartphone app interface (AQS, PM measurements, TVOC measurements), and processes for syncing and sharing the data with the study team. We did highlight that PM2.5 was a focus for our study given its associations to health. We did not dictate to participants what data points should look at, but left this open ended so we could gauge their experience afterwards. We also explained how to contact us with questions and concerns (e.g., blinking white light indicating defects), and why we collected monitors between deployments for syncing and recalibrating internal sensors. Many participants clipped their monitors to a lanyard around their neck, or to their belt loops, bags, and purses (study participant shown in Figure 2).The data reported by the monitors, while readily accessible by the participants via their smartphone, were also digested by the research team and shared with the participants via deployment-level report-back summaries for noticeable trends in exposure concentrations (later deployments, outside of the scope of this manuscript, included individualized report-back summaries). The study team remotely monitored the monitors through API data provided by the company and communicated via text message every 3 days to check on participants, answer questions and concerns, replace monitors if damaged or defective, and help support data syncing.3
The authors conducted phone interviews within 2 weeks of participants returning the monitors in Field Deployment 1 (March/April 2022) and Field Deployment 2 (June/July 2022). A third of the interviews were conducted in Spanish. The semi-structured interview guide asked what motivated participants to carry the monitor, how they used the monitor and interpreted the data in the accompanying app, what they expected to learn versus what they learned, how they felt about their home and neighborhood environments before and after using the monitor, whether they changed behaviors, environments, or routines after using the monitor, difficulties they encountered, and any feedback for the study team (Supplementary Material S1 Document, Interview Questionnaire). All interviews were recorded and transcribed.
To code interviews, the respective interviewer served as the first coder, reviewing the transcript, summarizing each research question, and extracting representative quotes. As a reliability check, a second coder listened to the recording and read the transcript before reviewing the interviewer’s coding work, correcting and adding information as needed. During this process, each coder created a list of initial themes from the literature and emergent themes from the data; this approach was informed by abductive analysis, and iterative processes of working with empirical materials in relationship to social science theory (Timmermans and Tavory, 2012). The team met bi-weekly to examine variation across the data, all while engaging existing theories. This process was repeated until all interview data was double-coded. We then confirmed emerging themes by tabulating the number of times similar types of responses were made, to ensure that key themes presented below are representative of the group.
The Census tracts that comprise GESCC have a combined population of just under 20,000 residents. These neighborhoods have a prominent Hispanic/Latino majority, with 12,134 Latino residents (61%), 5,428 (28%) Non-Hispanic White residents, and smaller populations of non-Hispanic Black residents (6%), Asian or Pacific Islander residents (2%), and Indigenous American residents (0.9%). The monitor users mirrored the racial and ethnic makeup of the community—56.8% self-identified as Hispanic/Latino and 37.8% self-identified as non-Hispanic White. 70.3% of households earn a combined income less than Denver’s median income (Table 1 for area and study group demographics). Notably, over two-thirds of participants were women, which is characteristic of gendered differences in environmental justice activism; women of color have been particularly foundational to environmental justice work (MacGregor, 2020). Three participants interviewed self-identified in our longitudinal survey as individuals who smoke or vaporize tobacco, nicotine, or marijuana (9% of the 32 respondents who completed that survey question).
The scope of this project is to understand community scientists’ experiences using the monitors to monitor their personal pollution exposure. It is not a controlled experiment to attribute pollution to specific sources. However, to provide an overview of the variation in AQS throughout the study, Figure 3 displays the weekly averages of AQS data for all participants, illustrating the type of data that each participant would have received over time from their monitor smartphone app.
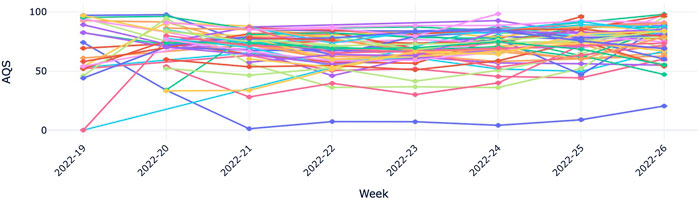
Figure 3. Line plot showing weekly averages for AQS data reported by all the Atmotubes that were assigned to different users during Deployment 2.
Note for Figure 3: The x-axis legend represents the year followed by the week number (2022-19 represents the week of May 9- 15 May 2022). Personal exposure depends on many factors, such as indoor activities like cooking, cleaning, or outdoor air quality events. All of these factors influence the concentrations each day throughout the day. For some participants, as exemplified here and in the figures in the Supplementary Material, there were several occurrences in which the air quality score (AQS) dropped to near zero values. These low values were due to spikes in PM or TVOC values. The participant would have gotten alerts through the app regarding their AQS score, along with general recommendations from app interface on how to mitigate these high exposure concentrations. See the ranges for alerts here: https://atmotube.com/atmotube-support/what-is-air-quality-score-aqs.
Participants viewed their exposure data instantaneously in the monitor app; the combined weekly averaged AQS data we present in Figure 3 shows that the data varied for different participants as per the daily conditions to which they were being exposed. For most users, the trends did not vary between each week, signifying the role of their consistent daily activities and neighborhood on their daily exposure levels. The variability of AQS between users and the correlation of AQS with different pollutants is explained in greater detail in the Supplementary Material, where we provide correlation matrices for AQS, PM1, PM2.5, PM10 and TVOCs and offer a case study of five different users, present variation in their composite AQS, and show how that is related to their PM2.5 and TVOC measurements (see Supplementary Material). In the Supplementary Material, we present correlation matrices as well as individual profiles that show when different monitor users see poor AQS scores, sometimes it is driven by high PM2.5 and sometimes driven by high TVOCs. In the sections that follow, we report on participants’ experiences using the monitor, their perspectives on the data they collect, their assumptions about pollution and exposure, and their experiences and behavioral changes within their community and home.
A majority of participants’ primary expectation (26/38 = 68%) when receiving their monitor was to better understand their pollution exposure. Participants wanted to use the monitor to “measure” contamination in real time to 1) get a baseline understanding of exposure, 2) conduct community science, or 3) investigate a pollution-related health concern.
A portion of participants (17/38 = 45%) had heard about the project and were curious to “just know” how bad the AQ might be. They had preconceived notions about the area and wanted to clarify their pollution exposure. Participants knew of the multiple sources of air pollution within their neighborhood and named those sources when sharing their motivation. Amelia, who lives by the highway construction in Elyria-Swansea, was motivated to participate because her neighborhood is “under a massive construction project.” Others like Bibiana mentioned specific pollutants such as “lead from the construction.” Danna and Carmela expressed motivation as the neighborhood is surrounded by “marijuana dispensaries” and “a lot of industries.” While participants were curious to “just know” about AQ, they had expectations of how sources of pollution impacted their air.
A portion of participants (14/38 = 37%) were interested in comparing findings from the personal monitors to existing local knowledge or media reports to take action and reduce exposure. These individuals expressed an interest in contributing to research through collecting data, problem-solving, and using the monitors to identify the cause of issues. The ways these participants used their monitors fit standard definitions of community science: efforts to generate local knowledge to solve a relevant issue (Da, 2022). Jasmine, an Elyria-Swansea resident, who suffers from chronic health issues, explained, “I really care about my neighborhood. I know that there are some serious problems down here environmentally and wanted to help figure out what those were.” Similarly, Samantha, a Globeville resident, noted:
“I wanted to see for myself … People in our neighborhood who have lived here for longer than us, the stories that they tell about the air quality or how they feel on high smog days and stuff like that or high pollen days. Does the data bear out those stories that we have it worse here than other parts of the Metro area?”
Community scientists were invested in working alongside the research team to document specific neighborhood AQ concerns more so than other resident participants who were participating for a general understanding of AQ or a particular health concern. Two participants (Deployment 1) and four participants (Deployment 2) specifically wanted to gather data to make political change.
A portion of participants (8/38 = 21%) had pollution-related health concerns from their own respiratory health experiences, their families’ health, or awareness of statistics related to health in the area. Participants mentioned how everyday neighborhood realities including harmful odors, coughing, sore throat, or visible haze had motivated them to join the study. As a result, the monitor became a tool to validate whether health issues were a consequence of poor AQ.
Overall, concerns about air pollution from industrial emitters and nearby highway construction were the top concerns among our participants. Health was the next most frequently reported concern and motivation. However, not all participants fell into these discrete categories. Some were just vaguely interested, expressing a curiosity about the data. Ten participants mentioned compensation as one motivation (among others) to enroll in the study (six participants in Deployment 1 and four participants in Deployment 2); two participants across the two Deployments mentioned compensation as the only motivation to participate. This strengthens the findings presented below because it indicates we do not have a sample of only highly motivated and concerned participants.
For many participants (27/38 = 71%), the main benefit of carrying the monitor was building awareness about pollution exposure, especially as related to health. Participants expressed that personal air monitoring increased their consciousness about invisible sources of concern, which helped them find value in using a monitor.
This awareness contributed to a sense of health consciousness and a sense of safety, regardless of the actual AQ levels. This was especially true for the many participants who shared experiences with chronic health issues and concerns related to “dust,” which is a common way for the public to refer to airborne PM. This was the case for Danna, an Elyria-Swansea resident who has respiratory issues, and mentioned that a benefit was “being able to keep my mind at ease and know the exact levels of the air and pollution.” Adriana, another Elyria-Swansea resident who has allergies, noted: “It is always good to be informed about the air quality outside your home, that is not the same to be inside than outside. You feel safer when you go out.” Dalia, a resident of Globeville, summarizes the benefit of the monitor:
“You’re just more conscious of understanding that [AQ] is a health concern that people, I do not think, very often think about. For example, I never thought about it either. I never thought twice about monitoring the air at home. I just think that I'm conscious of greenhouse emissions and climate change, but I feel like I associate that more with being out in more public areas than thinking about how that affects me directly at home.”
Overall, this newfound AQ awareness was beneficial in supporting participants’ “peace of mind” or promoting health consciousness and in expanding their considerations of what counts as an AQ concern.
Participants accessed and understood data from the monitor smartphone app regardless of their level of scientific literacy. Participants had access to information that aided them in interpreting data, including the color-coded AQS and alerts that would pop up on users’ phones to indicate a drop in the AQS (see Figure 2).
A majority of participants (36/38 = 95%), without any prior knowledge of AQ metrics and measurements, used the color-coded spectrum with the composite AQS to understand their data (Figure 2). Most compared AQ in terms of increases/decreases in this composite score. The colors and overall number provided easy insight into the changing nature of AQ and thus developed into a powerful frame of reference. Valery, who recently moved to Elyria-Swansea, described difficulty in understanding the multiple numerical values displayed on the monitor. Like many other participants, Valery leveraged the color-coded AQS in the smartphone app and was able to interpret AQ information regardless of understanding individual PM or TVOC scores:
“I did not really 100% know how to recognize, understand the numbers versus the VOCs versus the other stuff. I kind of Googled it a little bit, but it was over my head. So, definitely, I would say that I know the color stuff, the more simple stuff. And I'm like, not an expert in any of it.”
Valery took this a step further, often comparing the color-coded AQS from her monitor to the global AQS map provided in the Atmotube smartphone app. Using the colors, Valery identified that her pollution exposure resembled that of other countries such as India and parts of South America that face major industrial pollution, which she identified as consistently “yellow” or “red” on the map. Participants initially relied on the AQS at the top of their smartphone app interface; over time, they would frequently scroll down to evaluate components of the AQS, like PM1, PM2.5, PM10 or TVOC, into their evaluation of their environment. A small group of participants (7/38 = 18%) also used the poor AQS alerts or “warnings” that appeared on their smartphone app to complement their understanding.
Participants gathered and uploaded personal exposure data regularly that was then analyzed by the study team. Thus, participants were exposed to and directly handled an array of data. However, when interviewed about their data interpretations and assumptions, 95% of participants referred to the smartphone app’s color-coded AQS as a way to check, measure, and compare their AQ.4 Participants’ experiences show the value of this single measure for making monitor data accessible for participants at any level of scientific literacy. However, as we discuss below, the central role the AQS plays in conveying data to users has important implications for public health and community science because of the very ways it conflates specific pollutants with known health concerns (primarily PM2.5) with more generalized sources (i.e., TVOCs).
Community scientists in this study were only asked to carry their monitor and sync their data daily. However, on their own, half of the participants (18/38 = 47%) conducted experiments and used AQ monitor data to test hypotheses, which they detailed in interviews.
Though Callie came to the study with concerns over specific sources of pollution in Elyria-Swansea and a desire for policy intervention, she described a broad process of fact-finding initiated by monitor use. Rather than documenting AQ near the pollution sources she cited as her motivation for participating, she explored AQ and temperature change in her backyard greenhouse via her monitor. She also passively observed the impacts of her everyday routine on AQ. Before carrying the monitor, Callie and her partner routinely smoked marijuana inside the home with little ventilation–the monitor revealed that smoking had a negative impact on indoor AQ. Callie expressed her surprise, having assumed that marijuana smoke was safer than tobacco smoke.
Other participants tested hypotheses or tracked concerns about indoor air pollutants, including cleaning chemicals, incense, candles, and gas cooking ranges. The portability of the monitor proved beneficial since it allowed participants to compare observations, even between rooms in their homes, and learn how specific sources negatively impacted AQ. Margaret, a mother of four, told us “Last time, my kitchen seemed like it was really high VOC, and so (this time) I put the monitor on the pan rack.” Braxton, a schoolteacher living in Elyria-Swansea, combined monitor observations in different environments with online information about sources of poor AQ to determine why he was seeing a low composite score at his mother’s house, outside of the study area. Like many in the study, casual observations and comparisons produced definitive AQ knowledge and revealed poor AQ sources. This discovery process highlights an important benefit of the monitor for environmental health.
Participants’ observations also revealed how monitor data changed perspectives about sources of poor AQ, with most participants changing their focus from outdoor to indoor AQ. This was true for participants who participated to learn about the impacts of emissions from highway construction and industrial emitters, and participants who believed that the best way to reduce personal exposure was to seal oneself away in their home. Jane, a Globeville resident who participated in the study to better understand how neighborhood AQ impacted her son’s asthma, described this change in assumption from her monitor experience:
“After doing this study, it's going to be swapped. So, like in my house, I thought before I did this study, I thought my house, oh, you know the air quality in here is better than it is outside because we're next to the highway. I thought living next to the highway, we should not be outside all the time because of the air and stuff. But after doing this study and knowing that the air quality inside is worse than it is outside, it's kind of sickening honestly.”
While Jane found this information “very surprising,” she also described how measures from the monitor validated her experiences of illness as a product of poor AQ, something that she did not notice before:
“I thought that was all in my head, and as soon as we started doing the air quality and noticing that it's worse in our room than it is at work or outside or wherever we went, I noticed it affects my health, and it also affects my husband's health too.”
For a portion of participants (12/38 = 32%), the exploratory process of carrying a monitor revealed unexpected sources of poor AQ and connections to embodied experiences of health and wellbeing. These observations may have validated or invalidated participants’ prior assumptions about AQ, and yet they still aided in expanding participants’ knowledge by providing insight into their everyday exposure experience (Adams et al., 2011; Altman et al., 2008).
Beyond general experiments such as those detailed above, specific experiments allowed participants to test particular hypotheses and validate health-related concerns. Raquel, a Cole resident, suspected that her boyfriend’s humidifier was causing her to feel ill. Readings from her monitor made her feel “like my thoughts on your humidifier were valid, looking at the evidence.” Raquel’s observations align with scientific studies that associate humidifiers and/or humidity with PM2.5 and poor AQ (Lau et al., 2021; Mohan et al., 1998; Cheng et al., 2015). Similarly, the monitor allowed many, including Susan, to validate hypotheses:
“My partner is like, we do not need to use that [air purifier]. And then over time, I kept showing him the air quality is better by a number of points. I do not remember what it was, five to 10, if we have the air purifier. So that resolved a conflict.”
The presence of local industrial emitters inspired a portion of participants (6/38 = 16%) to quantify environmental pollution and document environmental inequalities. Raquel described her expectations:
“I knew there were certain things you can notice, like dust, and things around, like construction sites and being so close to the highway, like I-25 and I-70. I was expecting to have some kind of impact from that, and [...] that oil refinery [...], and then you can smell the dog food factory. But actually, the monitor shows the air quality outside was not as bad as I thought it would be.”
Air quality scientists have identified indoor air as a main factor for pollution exposure and adverse health, despite public perceptions that often highlight outdoor concerns. Our participants arrived at this conclusion through their own experimentation. Regardless of the type of experimentation and level of preexisting knowledge, most participants built awareness about AQ and environmental exposures–they learned that variation exists within their homes and neighborhoods.
As a result of understanding exposure, participants reported that the monitors supported decision-making related to behavioral change. A portion of participants (15/38 = 40%) adopted mitigation behaviors when identifying sources impacting personal AQ (i.e., using cleaning products, cooking, or smoking). As a result, some participants opened their windows to circulate the air or purchased/used existing air cleaners or fans. A few decided to make small home repairs that they thought would improve their air quality, such as getting a screen door, replacing heating/air-conditioning system filters, or installing better windows to keep the dust out of their home. Alice identified the negative effects of cleaning products on her AQS. She decided to run an air purifier “that we hardly ever use” to mitigate indoor air pollution, as she noticed that “the lowest scoring room” in her home (referring to the AQS) was where she had sprayed a specific cleaning product.
In some cases, participants leveraged monitor data to support changes they assumed would improve AQ. Adriana, a resident of Elyria-Swansea with allergies, said she adjusted daily routines and made improvements to her home after identifying her indoor AQ: “We did not check it before, but after this study, I asked my husband to vacuum and clean the air ducts, to check the air conditioning, to clean the filters. In fact, some windows were also changed, so that dust did not get in as much.” After these actions, some participants validated how these changes improved AQ; Margaret confirmed that switching cleaning supplies to natural options improved the AQ in her home to the extent that the smartphone app no longer told her to “seek medical attention.”
A majority of participants (20/38 = 53%) adopted protective behaviors. Those who learned from their monitors that their AQ outdoors was better than indoors opted to go outside for walks more frequently. Those who identified that the AQ was better inside their home spent more time inside or closed windows more frequently to avoid outdoor AQ. In some cases, participants chose locations they identified as less polluted, or “healthier,” locations outside their neighborhoods (e.g., grocery stores, parks) to protect themselves from neighborhood AQ.
Finally, a portion of participants (14/38 = 37%) did not report any behavioral changes because they determined their air quality was acceptable. It was more notable for some participants who were part of both deployments. Some participants did not make changes after the initial round of air monitoring, noticing that the AQ was better in the summer than in the winter. Samantha expressed not making any new changes during her second time participating as the AQ readings were better than her prior experience with the monitor:
“I never felt the need to keep the dogs inside instead of taking them on a walk or waiting to do my gardening for a different day, because the air quality scores were good. But if I had seen that the air quality scores had been bad, then yes, I absolutely would have been changing my behavior.”
Although these are cases of non-action, they underscore our finding that people actively consulted their AQ data and shaped behaviors accordingly.
In some cases, participating led to a sense of powerlessness and even resignation. A portion of participants (6/38 = 16%) expressed not knowing what to do to improve outdoor AQ. Miriam was one of several frustrated participants who pointed out that the behavioral decisions that could change their situation were out of their control: “I mean, I still have to live where I live and commute around my area. It was not going to make a difference.” Miriam expressed a similar sentiment after the second field deployment. These participants were aware they lived in a polluted area but felt as Colton did: “I do not really have a choice. I have to breathe, do not I? Can’t do anything about it.” Dominga, a 30-year resident of Elyria-Swansea working in the community as a promotora, lamented, “Everything is the same because this is the environment. I cannot avoid traffic and now with the construction, wherever you go, it is always the same.” This smaller group of participants expressed a lack of agency about addressing poor outdoor AQ given the structural constraints of the community, where the sense was that, in Colton’s words, “There’s no escaping it.”
Despite these very real reservations about the potential for community air monitoring to create neighborhood change, many participants found the monitor individualized profiles to be useful in identifying a reasonable scope of action. Raquel suggested that indoor AQ changes became more reachable after using the monitor:
“I think the benefit was really just understanding where your exposure is, like poor air quality, and then being able to take concrete steps to improve air quality, primarily within your own residence … I can kind of do those things within our power to make the air quality better.”
Raquel’s comment points to the limitations of using personalized monitors. We enumerate some potential pitfalls of personal monitor use.
First, low-cost sensors do not measure all pollutants of concern for community scientists in this study, including issues like lead. More importantly, participants’ understandings of AQ were curtailed by what data was shown and visualized in the app that accompanies the monitor, most notable the composite AQS Most participants described their AQ in the terms dictated by the app’s composite AQS, a color-coded spectrum (Figure 2). Many, like Dalia, used the AQS as shorthand to understand their AQ, interpreting a score of “75 or above, a good AQ, and under 60, bad.”
Second, the knowledge participants gained using the monitor was valuable in its specificity to individual exposures, but this potentially narrowed the scope of participants’ environmental action. As participants’ experiences of air monitoring make clear, environmental changes were mainly focused on participants’ immediate environments.
Third, a portion of participants (4/38 = 10%) pointed to the disconnect between data and action by explicitly asking for recommendations and interventions to improve AQ. In other words, they wanted specific guidance that the monitor alone did not provide. A portion of participants (8/38 = 21%) felt that they could interpret the data in the app but that it did not give them a meaningful understanding of AQ. Callie noted that, even after participating twice, she did not understand how various polluting sources impacted her score. Some felt that their understanding was limited to whether AQ was “good” or “bad,” and identifying further information about it was their first step. Some participants identified scenarios that negatively affected AQ, such as driving with windows closed in a vehicle, but then had questions related to what produced each element of their composite AQS. Participants’ understanding of AQ was thus structured and limited by the app interface, which privileges the overall AQS over the specific measured pollutants such as PM2.5 and TVOC. Participants built awareness and felt that they could better interpret pollution exposure, but they still had questions related to the differences between AQ indicators that generate the composite score.
Fourth, many repeat participants noted that their understanding of AQ increased only marginally during the second deployment. While interviews with first-time users were filled with insightful comments, notes on experimentation, and in some cases, the “eureka” moments described above, these were less common in interviews with participants using the monitor for a second time. Susan discussed in her second interview how the novelty wore off, explaining that previously, “I was looking at the data more in the winter because it was new, and it was exciting [...] This time [...] I have an idea of what might be happening, air quality-wise.” Repeat participants still appreciated the chance to explore their indoor and outdoor environments but continued to interpret AQ primarily through the AQS–which did not further their understanding or keep them engaged.
Low-cost monitors democratize access to scientific tools necessary to fill gaps in environmental research and create action around environmental inequality (Commodore et al., 2017; Corburn, 2005). Given the proliferation of low-cost monitors in community air monitoring (Commodore et al., 2017) and the promise of practical relevance acquired through scientific knowledge (Hackett et al., 2016), it is vital to explore the experiences of people using these tools. Our analysis reveals that monitors build exposure awareness and serve as instruments for residents of EJ communities to test and validate or invalidate sensory experiences related to AQ that challenge existing assumptions, support decision-making, and contribute to behavioral change.
Participants shared similar motivations and expectations for air monitoring regardless of demographic characteristics and levels of scientific literacy. Existing lay expertise about AQ was drawn from sensory experiences and knowledge of local industrial emitters and proximity to highways. Participants were motivated to participate to gather a baseline understanding of AQ, to become community scientists, and to understand health concerns. Monitors were used as a tool to inform and corroborate pollution concerns by comparing AQ in various settings. We build on the concept of exposure experience (Adams et al., 2011; Altman et al., 2008) by showing how people evaluate data on everyday AQ exposures in relationship to their health and environments.
How people interpret and engage with low-cost monitors highlights the potential of community science. Participants went far beyond the technical task of simply carrying the monitors and synchronizing their data. Participants demonstrated an aptitude and interest in the scientific process by conducting experiments to identify sources of pollution in their homes, cars, and immediate environments. The propensity to use the monitor to experiment and investigate is significant given that participants were drawn from the public–many learned of the project via a flier on their door, and participants included people who told us they participated mainly for the compensation. Participant interests extended beyond general curiosity and, often, they also took steps to mitigate and protect themselves from poor AQ. Future community air monitoring projects might be designed to foster the tendency for experimentation we documented among participants in this study.
Importantly, we find that community scientists pre-dated our study rather than being created by it. Participants already identified themselves as having an orientation and desire for data-gathering projects, which benefited the uptake of technological tools. Carrera et al. (2018) describe this process as “research altruism,” where participants’ engagement in community-centered research is motivated by desires to generate knowledge and achieve social impact. Community science projects should gauge existing orientations to environmental experimentation when conceptualizing partnerships in EJ communities. Scholars have identified that air pollution health concerns, residing near potentially hazardous sources (Gabrys and Barratt, 2016; Commodore et al., 2017), and the desire to reduce personal exposure (Durkin et al., 2020) lead participants to be involved in community science studies. Community science projects might fold these existing concerns and orientations into research designs from the start.
Beyond tools for community science, personal monitors are potentially transformative technologies and catalysts for translating feelings about invisible contamination and AQ health concerns into tangible data points (Timmermans and Berg, 2003). Efforts to advance personal monitors might consider accounting for experiences of AQ monitoring, as we have done in this study. We demonstrate that sensory experiences—smell, sight, touch, embodied reactions—play a key role in how people experience AQ, and that they use personal monitors to extend their primary senses to further explore and validate pre-existing concerns. This study further demonstrates that scientific tools can shape people’s embodied health experiences (Altman et al., 2008). Monitor technologies might be redesigned to help users explore links between their senses (e.g., visible dust, irritants in their eyes, nose, and throat, odors) and empirical measurements reported by the monitor. For example, a partnership between the EPA and the Louisville Metro Air Pollution Control District created an “Odor Wheel” app that allows users to report odors (i.e., rubber, rotten eggs) and then organizes odors into “smell type” categories (e.g., fuel type, chemical mixture); this generates community consensus on pollution sources and common odor types (EPA, 2022a). Research on odors and wellbeing in North Denver provided smartphone tools to report odors to local air pollution agencies for subsequent action and to locate and identify major odor sources (Eltarkawe and Miller, 2019; Eltarkawe and Miller, 2018). Personal monitors would benefit from incorporating similar sensory heuristic tools to foster a better understanding of how exposure experience impacts health and wellbeing (Adams et al., 2011; Altman et al., 2008).
These technologies can be improved; it is important to recognize their limitations. The Air Quality Score in the Atmotube app facilitates community science with this easy-to-read composite score, providing an important method of communication. However, this type of composite score may overlook important nuances, mask variations in specific pollutants, and/or fail to capture specific health risks. For example, the AQS measures particulate matter (PM1, PM2.5, PM10) as well as TVOCs. We found that sometimes participants’ poor AQS scores may be driven primarily by TVOC measurements (as some of the individual profiles in the included Supplementary Material detail and as participants experiments with household cleaners or cosmetics also show). The negative health impacts of PM have been widely documented (EPA, 2022b); however, TVOC encompasses a large group of chemicals ranging from harmless smells to hazardous compounds. Without expensive instrumentation like a gas chromatograph, it is difficult to identify what the main TVOC pollutant is and therefore whether it is toxic (Ródenas García et al., 2022; Caron et al., 2016; Salthammer, 2022). As demonstrated in our study, community scientists have interest in what elements of their environment impact their AQS so that they can make behavior change. The inclusion of TVOC measurements in the composite AQS score requires further scrutiny given that TVOC is an aggregate parameter that is not toxicologically based, i.e., it cannot be used for investigating health-related issues and is only suitable for screening purposes (Ródenas García et al., 2022; Caron et al., 2016; Salthammer, 2022). Designers of low-cost monitors and researchers working with these tools should consider how community scientists may differentially value information in absence of training and information about which readings are hazardous to health (see epa.gov/haps). Public education and awareness is an important aspect of community science, and community scientists should be empowered with the tools to understand how different components of AQS scores are valued in order to understand the implications for their health.
The Atmotube AQS corresponds to several other AQ indices designed to provide easy-to-understand information to the public regarding how the air quality compares to the regulatory standards for that location. This approach is used around the world to communicate air pollution levels more easily. These indices vary between companies, research teams, and government agencies, and from country to country. Both community science air monitoring and the public understanding of AQ would be strengthened by a unifying AQ index, which is difficult given the different regulatory standards around the world.
Most importantly, in our study of personal exposure monitoring, we find that people’s sphere of exposure is constrained by using a monitor. The parameters of individual AQ monitoring lead users to focus on their immediate sphere since this is the environmental scale measured by the personal monitor. Indeed, a stated benefit of these tools is that they more accurately measure individual exposure compared to regulatory instrumentation that measures ambient neighborhood air quality (English et al., 2017). Though many participants joined the study in hopes of validating concerns over large-scale industrial emitters in the community, over time, they focused more on the limited sphere of their homes and routines (Ottinger et al., 2016). Personal monitor data is individualized, allowing people to see sources of pollution impacting them in their immediate environment, including indoors, which is an important concern since this is where people spend over 90% of their time (EPA, 2021). Yet, using the monitor refocused participants’ attention on indoor AQ. This should be put in context with participants’ documented frustration when discussing outdoor AQ and the lack of agency they felt related to community-level pollution. Concerns about outdoor AQ may lessen as they exercise an ability to control something more tangible and closer to home.
Personal AQ monitoring tools reinforce the individual sphere of exposure, refocusing actions away from industrial emitters toward individual environments, actions, and routines. This is a political question rather than only a question of focus since one of the goals of community science is to foster political change (Corburn, 2005; Hacklay et al., 2018). Less technological, DIY tools that are used in fenceline monitoring (like the Louisiana Bucket Brigade) or truck traffic observer studies (truck counts and truck idling) might offer lessons on how to refocus attention toward structural environmental harm (Louisiana Bucket Brigade; Gonzalez et al., 2011). Community science projects should consider the use of monitoring tools to collect data in tandem with the reporting and visualization of data. Education on how indoor AQ readings might be connected to outdoor sources of pollution is also key.
Low-cost monitors provide opportunities for education and action. Our study shows, however, that to generate a bigger impact, monitors may need to be paired with outdoor AQ monitoring, and intervention strategies and policy changes to improve air quality. Participants should be equipped with resources that can help them create community change, even when studies conclude. Monitor developers should consider how they can integrate exposure-reduction strategies and steps for action into the platforms attached to their technological devices, as these metrics and descriptions have significant power in how people experience AQ and make decisions about AQ information.
Beyond these monitor concerns, this project has lessons for community science and social equity. Of the goals of community science—“bringing more diverse communities into science, by posing questions of interest to marginalized communities, and by gathering data across wider expanses of place and time”—it is the first goal that is most often unfulfilled (Lewenstein, 2022). In this analysis, meeting individuals where they are at in terms of their current AQ understanding and taking seriously how they engage with data-gathering tools, we build on the existing AQ capacity in EJ communities–including the work of Latino-oriented nonprofits already deeply engaged–to support epistemic justice in AQ research. As community science focused on AQ continues to grow in popularity, we push to ensure that the experience of air monitoring is beneficial to residents through ongoing stakeholder input and flexible research design that adapts to meet their needs.
The datasets presented in this article are not readily available because consent documents indicate data will only be available to study researchers for analysis, and transcripts cannot be sufficiently anonymized to prevent deductive disclosure. The Interview Questionnaire is provided as Supplementary Material Document 1. Questions about the qualitative data should be sent to bWFyaXNhd0BwZHguZWR1. The underlying quantitative dataset is available from CU Scholar (https://scholar.colorado.edu/concern/datasets/n583xw50g). Requests to access the datasets should be directed to SM, c2hlbGx5Lm1pbGxlckBjb2xvcmFkby5lZHU=.
The studies involving humans were approved by University of Colorado’s Institutional Review Board. The studies were conducted in accordance with the local legislation and institutional requirements. The participants provided their written informed consent to participate in this study. Written informed consent was obtained from the individual(s) for the publication of any potentially identifiable images or data included in this article.
MW: Conceptualization, Data curation, Formal Analysis, Investigation, Methodology, Project administration, Resources, Software, Supervision, Validation, Writing–original draft, Writing–review and editing. VS-S: Data curation, Formal Analysis, Investigation, Validation, Writing–original draft, Writing–review and editing. JP: Data curation, Formal Analysis, Investigation, Validation, Visualization, Writing–original draft, Writing–review and editing. SS: Formal analysis, Visualization, Writing–review and editing. AH: Data curation, Formal Analysis, Investigation, Project administration, Visualization, Writing–review and editing. SM: Data curation, Formal Analysis, Funding acquisition, Investigation, Methodology, Project administration, Resources, Supervision, Writing–review and editing. ES: Conceptualization, Data curation, Formal Analysis, Funding acquisition, Investigation, Methodology, Project administration, Resources, Supervision, Validation, Visualization, Writing–original draft, Writing–review and editing.
The author(s) declare that financial support was received for the research, authorship, and/or publication of this article. This work was supported by the National Science Foundation (award #1952223) and the University of Colorado Office of Research Services.
We would like to thank the Social Justice and Environmental Quality—Denver research team, especially Nicholas Clements, PhD and Emily Evans, and all participants in our study.
The authors declare that the research was conducted in the absence of any commercial or financial relationships that could be construed as a potential conflict of interest.
All claims expressed in this article are solely those of the authors and do not necessarily represent those of their affiliated organizations, or those of the publisher, the editors and the reviewers. Any product that may be evaluated in this article, or claim that may be made by its manufacturer, is not guaranteed or endorsed by the publisher.
The Supplementary Material for this article can be found online at: https://www.frontiersin.org/articles/10.3389/fenvs.2024.1433489/full#supplementary-material
1Our project website is where participants and the general public could access preliminary data from the study, including 1-page reports on: focus group data that informed study design, AQ sensor selection and colocation, background literature summaries on existing neighborhood research, and preliminary study data from each deployment. See https://www.sjeqdenver.com/for these documents. More details about the focus groups are available here: https://www.sjeqdenver.com/_files/ugd/7aa46d_6b8ddea0edc544d2abc12e6b9c05371d.pdf.
2For further details on the Atmotube PRO performance measuring PM, see https://atmotube.com/blog/aqmd-and-atmotube-pro-preliminary-test-results. Note that our study conducted additional chamber experiments and colocation to verify the Atmotube PRO’s efficacy measuring PM2.5, the main pollutant of concern in this study. Our team also tested its ease of use and efficacy by measuring common individual sources of particulate matter (PM) with a diameter <2.5 μm (PM2.5) (e.g., burning candles, cooking, traffic, walking through neighborhoods), and with collocation experiments with the neighborhood area’s closest high-quality governmental stationary air monitors.
3This paper only covers two of the four 30-day field deployments, and participants received formal individual reports and additional one-on-one feedback after the additional field deployments, though that data is beyond the scope of this manuscript.
4The remaining 5% of users did not engage with the monitor and told us they did not review the data due to lack of interest or lack of understanding, though they still participated in syncing their data regularly for the study.
Adams, C., Brown, P., Morello-Frosch, R., Brody, J. G., Rudel, R., Zota, A., et al. (2011). Disentangling the exposure experience: the roles of community context and report-back of environmental exposure data. J. health Soc. Behav. 52 (2), 180–196. doi:10.1177/0022146510395593
Allen, B. L. (2018). Strongly participatory science and knowledge justice in an environmentally contested region. Sci. Technol. and Hum. Values 43 (6), 947–971. doi:10.1177/0162243918758380
Altman, R. G., Morello-Frosch, R., Brody, J. G., Rudel, R., Brown, P., and Averick, M. (2008). Pollution comes home and gets personal: women's experience of household chemical exposure. J. health Soc. Behav. 49 (4), 417–435. doi:10.1177/002214650804900404
ATTOM Data Solutions (2016). Environmental hazard housing risk. Available at: https://www.attomdata.com/news/heat-maps/2016-environmental-hazard-housing-risk-index/.
Becker, A. M., Marquart, H., Masson, T., Helbig, C., and Schlink, U. (2021). Impacts of personalized sensor feedback regarding exposure to environmental stressors. Curr. Pollut. Rep. 7 (4), 579–593. doi:10.1007/s40726-021-00209-0
Boso, À., Álvarez, B., Oltra, C., Garrido, J., Muñoz, C., and Hofflinger, Á. (2020). Out of sight, out of mind: participatory sensing for monitoring indoor air quality. Environ. Monit. Assess. 192, 104–105. doi:10.1007/s10661-019-8058-z
Bradley, A. C., Croes, B. E., Harkins, C., McDonald, B. C., and de Gouw, J. A. (2024). Air pollution inequality in the Denver metroplex and its relationship to historical redlining. Environ. Sci. Technol. 58, 4226–4236. doi:10.1021/acs.est.3c03230
Bullard, R. D., and Wright, B. H. (1993). Environmental justice for all: community perspectives on health and research. Toxicol. industrial health 9 (5), 821–841. doi:10.1177/074823379300900508
Caron, A., Redon, N., Thevenet, F., Hanoune, B., and Coddeville, P. (2016). Performances and limitations of electronic gas sensors to investigate an indoor air quality event. Build. Environ. 107, 19–28. doi:10.1016/j.buildenv.2016.07.006
Carrera, J. S., Brown, P., Brody, J. G., and Morello-Frosch, R. (2018). Research altruism as motivation for participation in community-centered environmental health research. Soc. Sci. and Med. 196, 175–181. doi:10.1016/j.socscimed.2017.11.028
Cheng, Y., He, K. B., Du, Z. Y., Zheng, M., Duan, F. K., and Ma, Y. L. (2015). Humidity plays an important role in the PM2.5 pollution in Beijing. Environ. Pollut. 197, 68–75. doi:10.1016/j.envpol.2014.11.028
Cho, S., Cicutto, L., Siripanichgon, N., McCombs, M., McCullough, M., Crews, K., et al. (2019). Evaluation of PM2. 5 exposures for an environmental justice community using a low-cost PM sensor. Environ. Epidemiol. 3, 69–70. doi:10.1097/01.ee9.0000606428.38783.53
Clayton, C. A., Perritt, R. L., Pellizzari, E. D., Thomas, K. W., Whitmore, R. W., Wallace, L. A., et al. (1993). Particle Total Exposure Assessment Methodology (PTEAM) study: distributions of aerosol and elemental concentrations in personal, indoor, and outdoor air samples in a southern California community. J. Expo. analysis Environ. Epidemiol. 3 (2), 227–250.
Commodore, A., Wilson, S., Muhammad, O., Svendsen, E., and Pearce, J. (2017). Community-based participatory research for the study of air pollution: a review of motivations, approaches, and outcomes. Environ. Monit. Assess. 189, 1–30. doi:10.1007/s10661-017-6063-7
Considine, E. M., Reid, C. E., Ogletree, M. R., and Dye, T. (2021). Improving accuracy of air pollution exposure measurements: statistical correction of a municipal low-cost airborne particulate matter sensor network. Environ. Pollut. 268, 115833. doi:10.1016/j.envpol.2020.115833
Corburn, J. (2005). Street science: community knowledge and environmental health justice. (Cambridge, MA: MIT Press). ISBN: 0-262-53272-7.
Cordner, A., Poudrier, G., DiValli, J., and Brown, P. (2019). Combining social science and environmental health research for community engagement. Int. J. Environ. Res. public health 16 (18), 3483. doi:10.3390/ijerph16183483
Da, S. N. (2022). The empowering virtues of citizen science: claiming clean air in Brussels. Engaging Sci. Technol. Soc. 8 (1), 29–52. doi:10.17351/ests2022.795
Demanega, I., Mujan, I., Singer, B. C., Anđelković, A. S., Babich, F., and Licina, D. (2021). Performance assessment of low-cost environmental monitors and single sensors under variable indoor air quality and thermal conditions. Build. Environ. 187, 107415. doi:10.1016/j.buildenv.2020.107415
deSouza, P. N. (2022). Key concerns and drivers of low-cost air quality sensor use. Sustainability 14 (1), 584. doi:10.3390/su14010584
Durkin, A., Gonzalez, R., Isaksen, T. B., Walker, E., and Errett, N. A. (2020). Establishing a community air monitoring network in a wildfire smoke-prone rural community: the motivations, experiences, challenges, and ideas of Clean Air Methow’s clean air ambassadors. Int. J. Environ. Res. Public Health 17 (22), 8393. doi:10.3390/ijerph17228393
Eltarkawe, M., and Miller, S. (2018). The impact of industrial odors on the subjective well-being of communities in Colorado. Int. J. Environ. Res. Public Health 15 (6), 1091. doi:10.3390/ijerph15061091
Eltarkawe, M., and Miller, S. (2019). Industrial odor source identification based on wind direction and social participation. Int. J. Environ. Res. public health 16 (7), 1242. doi:10.3390/ijerph16071242
English, P. B., Olmedo, L., Bejarano, E., Lugo, H., Murillo, E., Seto, E., et al. (2017). The Imperial County Community Air Monitoring Network: a model for community-based environmental monitoring for public health action. Environ. health Perspect. 125 (7), 074501. doi:10.1289/ehp1772
EPA (2021). Indoor Air Qual. Available at: https://www.epa.gov/report-environment/indoor-air-quality.
EPA (2022a). Odor explore: a participatory science project using a mobile app and new measurement approaches. Available at: https://www.epa.gov/air-research/odor-explore-participatory-science-project-using-mobile-app-and-new-measurement.
EPA (2022b). Particulate matter (PM) basics. Available at: https://www.epa.gov/pm-pollution/particulatematter-pm-basics.
Gabrys, J. P. H., and Barratt, B. (2016). Just good enough data: figuring data citizenships through air pollution sensing and data stories. Big Data Soc. 3 (2), 2053951716679677.
Goldberg-Freeman, C., Kass, N. E., Tracey, P., Ross, G., Bates-Hopkins, B., Purnell, L., et al. (2007). You’ve got to understand community: community perceptions on breaking the disconnect between researchers and communities. Prog. Community Health Partnersh. Res. Educ. Action 1 (3), 213–214. doi:10.1353/cpr.2007.0020
Gonzalez, P. A., Minkler, M., Garcia, A. P., Gordon, M., Garzón, C., Palaniappan, M., et al. (2011). Community-based participatory research and policy advocacy to reduce diesel exposure in West Oakland, California. Am. J. Public Health 101 (S1), S166–S175. doi:10.2105/ajph.2010.196204
Griswold, W., Patel, M., and Gnanadass, E. (2022). One person cannot change it; it’s going to take a community’: addressing inequity through community environmental education. Adult Learn. 19, 10451595221145206.
Hackett, E. J., Parker, J. N., Vermeulen, N., and Penders, B. (2016). “Chapter 25: the social and epistemic organization of scientific work,” in The handbook of science and technology studies. Editors U. Felt, R. Fouché, C. A. Miller, and L. Smith-Doerr (Cambridge, MA: Mit Press).
Hacklay, M., Bowser, A., Makuch, Z., Vogel, J., and Bonn, A. (2018). Citizen science: innovation in open science, society and policy (London, UK: UCL Press).
Hennink, M., and Kaiser, B. N. (2022). Sample sizes for saturation in qualitative research: a systematic review of empirical tests. Soc. Sci. and Med. 292, 114523. doi:10.1016/j.socscimed.2021.114523
Hubbell, B. J., Kaufman, A., Rivers, L., Schulte, K., Hagler, G., Clougherty, J., et al. (2018). Understanding social and behavioral drivers and impacts of air quality sensor use. Sci. Total Environ. 621, 886–894. doi:10.1016/j.scitotenv.2017.11.275
Jalbert, K., and Kinchy, A. J. (2016). Sense and influence: environmental monitoring tools and the power of citizen science. J. Environ. Policy and Plan. 18 (3), 379–397. doi:10.1080/1523908x.2015.1100985
Kelly, F. J., and Fussell, J. C. (2015). Air pollution and public health: emerging hazards and improved understanding of risk. Environ. Geochem. health 37, 631–649. doi:10.1007/s10653-015-9720-1
Kuula, J., Mäkelä, T., Aurela, M., Teinilä, K., Varjonen, S., González, Ó., et al. (2020). Laboratory evaluation of particle-size selectivity of optical low-cost particulate matter sensors. Atmos. Meas. Tech. 13 (5), 2413–2423. doi:10.5194/amt-13-2413-2020
Kwon, J., Ahn, Y., and Chung, S. (2021). Spatio-temporal analysis of the roadside transportation related air quality (STARTRAQ) and neighborhood characterization. San Jose, CA: Mineta Transportation Institute Publications.
Lau, C. J., Loebel Roson, M., Klimchuk, K. M., Gautam, T., Zhao, B., and Zhao, R. (2021). Particulate matter emitted from ultrasonic humidifiers—chemical composition and implication to indoor air. Indoor Air 31 (3), 769–782. doi:10.1111/ina.12765
Lewenstein, B. V. (2022). Is citizen science a remedy for inequality? Ann. Am. Acad. Political Soc. Sci. 700 (1), 183–194. doi:10.1177/00027162221092697
Louisiana Bucket Brigade About the Bucket. Available at: https://labucketbrigade.org/pollution-tools-resources/the-bucket/.
MacGregor, S. (2020). Gender matters in environmental justice, in Environmental justice (London, UK: Routledge), 234–248.
Mahajan, S., Gabrys, J., and Armitage, J. (2021). AirKit: a citizen-sensing toolkit for monitoring air quality. Sensors 21 (12), 4044. doi:10.3390/s21124044
Masri, S., Cox, K., Flores, L., Rea, J., and Wu, J. (2022a). Community-engaged use of low-cost sensors to assess the spatial distribution of PM2. 5 concentrations across disadvantaged communities: results from a pilot study in santa ana, CA. Atmosphere 13 (2), 304. doi:10.3390/atmos13020304
Masri, S., Rea, J., and Wu, J. (2022b). Use of low-cost sensors to characterize occupational exposure to PM2. 5 concentrations inside an industrial facility in Santa Ana, CA: results from a worker-and community-led pilot study. Atmosphere 13 (5), 722. doi:10.3390/atmos13050722
Matz, J. R., Wylie, S., and Kriesky, J. (2017). Participatory air monitoring in the midst of uncertainty: residents’ experiences with the speck sensor. Engaging Sci. Technol. Soc. 3, 464–498. doi:10.17351/ests2017.127
McCarron, A., Semple, S., Braban, C. F., Swanson, V., Gillespie, C., and Price, H. D. (2023). Public engagement with air quality data: using health behaviour change theory to support exposure-minimising behaviours. J. Expo. Sci. and Environ. Epidemiol. 33 (3), 321–331. doi:10.1038/s41370-022-00449-2
Messer, C. M., Adams, A. E., and Shriver, T. E. (2019). Living with chronic contamination: a comparative analysis of divergent psychosocial impacts. Nat. Hazards 99, 895–911. doi:10.1007/s11069-019-03781-3
Mohan, A. K., Feigley, C. E., and Macera, C. A. (1998). Humidifier use in the home environment and its effects on respiratory health. Appl. Occup. Environ. Hyg. 13 (11), 782–787. doi:10.1080/1047322x.1998.10389150
Morgan, B., Hansgen, R., Hawthorne, W., and Miller, S. L. (2015). Industrial odor sources and air pollutant concentrations in Globeville, a Denver, Colorado neighborhood. J. Air and Waste Manag. Assoc. 65 (9), 1127–1140. doi:10.1080/10962247.2015.1064833
Ottinger, G. (2023). Careful knowing as an aspect of environmental justice. Environ. Polit. 17, 199–218. doi:10.1080/09644016.2023.2185971
Ottinger, G., Barandiarán, J., and Kimura, A. H. (2016). Environmental justice: knowledge, technology, and expertise, in The handbook of science and technology studies. Editors U. Felt, R. Fouché, C. A. Miller, and L. Smith-Doerr (Cambridge, MA: Mit Press).
Ottinger, G. (2013). Redefining Expertise: How responsible engineers subvert environmental justice challenges. New York, NY: New York University Press. Available at: https://www.jstor.org/stable/j.ctt9qgg5g.
Park, Y. M., Chavez, D., Sousan, S., Figueroa-Bernal, N., Alvarez, J. R., and Rocha-Peralta, J. (2023). Personal exposure monitoring using GPS-enabled portable air pollution sensors: a strategy to promote citizen awareness and behavioral changes regarding indoor and outdoor air pollution. J. Expo. Sci. and Environ. Epidemiol. 33 (3), 347–357. doi:10.1038/s41370-022-00515-9
Reddy, K. S., and Roberts, J. H. (2019). Mitigating air pollution: planetary health awaits a cosmopolitan moment. Lancet Planet. Health 3 (1), e2–e3. doi:10.1016/s2542-5196(18)30286-9
Ródenas García, M., Spinazzé, A., Branco, P. T., Borghi, F., Villena, G., Cattaneo, A., et al. (2022). Review of low-cost sensors for indoor air quality: features and applications. Appl. Spectrosc. Rev. 57 (9-10), 747–779. doi:10.1080/05704928.2022.2085734
South Coast Air Quality Management District (SCAQMD) (2021). Atmotube pro field evaluation. Diamond Bar, CA, USA. Available at: http://www.aqmd.gov/aq-spec/sensordetail/atmotube---pro.
Timmermans, S., and Berg, M. (2003). The practice of medical technology. Sociol. health and Illn. 25 (3), 97–114. doi:10.1111/1467-9566.00342
Timmermans, S., and Tavory, I. (2012). Theory construction in qualitative research: from grounded theory to abductive analysis. Sociol. theory 30 (3), 167–186. doi:10.1177/0735275112457914
Tomsho, K. S., Schollaert, C., Aguilar, T., Bongiovanni, R., Alvarez, M., Scammell, M. K., et al. (2019). A mixed methods evaluation of sharing air pollution results with study participants via report-back communication. Int. J. Environ. Res. public health 16 (21), 4183. doi:10.3390/ijerph16214183
Tryner, J., Mehaffy, J., Miller-Lionberg, D., and Volckens, J. (2020). Effects of aerosol type and simulated aging on performance of low-cost PM sensors. J. Aerosol Sci. 150, 105654. doi:10.1016/j.jaerosci.2020.105654
US Environmental Protection Agency EPA (2023). What is the definition of “overburdened community” that is relevant for EPA actions and promising practices? Available at: https://www.epa.gov/caa-permitting/what-definition-overburdened-community-relevant-epa-actions-and-promising-practices#:∼:text=The%20term%20is%20used%20to,greater%20vulnerability%20to%20environmental%20hazards.
Vasileiou, K., Barnett, J., Thorpe, S., and Young, T. (2018). Characterising and justifying sample size sufficiency in interview-based studies: systematic analysis of qualitative health research over a 15-year period. BMC Med. Res. Methodol. 18 (148), 1–18. doi:10.1186/s12874-018-0594-7
Vogt, M., Schneider, P., Castell, N., and Hamer, P. (2021). Assessment of low-cost particulate matter sensor systems against optical and gravimetric methods in a field co-location in Norway. Atmosphere 12 (8), 961. doi:10.3390/atmos12080961
Keywords: air quality, community science, community monitoring, behavior change, citizen science
Citation: Westbrook M, Serrano-Salomón V, Pecenka J, Sankhyan S, Hollo AK, Miller SL and Sullivan E (2024) The sphere of exposure: centering user experience in community science air monitoring. Front. Environ. Sci. 12:1433489. doi: 10.3389/fenvs.2024.1433489
Received: 15 May 2024; Accepted: 30 August 2024;
Published: 30 September 2024.
Edited by:
James Kevin Summers, U.S. Environmental Protection Agency (EPA), United StatesReviewed by:
Gayle S. W. Hagler, United States Environmental Protection Agency (EPA), United StatesCopyright © 2024 Westbrook, Serrano-Salomón, Pecenka, Sankhyan, Hollo, Miller and Sullivan. This is an open-access article distributed under the terms of the Creative Commons Attribution License (CC BY). The use, distribution or reproduction in other forums is permitted, provided the original author(s) and the copyright owner(s) are credited and that the original publication in this journal is cited, in accordance with accepted academic practice. No use, distribution or reproduction is permitted which does not comply with these terms.
*Correspondence: Marisa Westbrook, bWFyaXNhd0BwZHguZWR1
Disclaimer: All claims expressed in this article are solely those of the authors and do not necessarily represent those of their affiliated organizations, or those of the publisher, the editors and the reviewers. Any product that may be evaluated in this article or claim that may be made by its manufacturer is not guaranteed or endorsed by the publisher.
Research integrity at Frontiers
Learn more about the work of our research integrity team to safeguard the quality of each article we publish.