 Robert I. McDonald1,2,3*
 Rebecca Chaplin-Kramer4
 Mark Mulligan5
 Chahan M. Kropf6
 Sarah Hülsen6Preston Welker7Erin Poor7James T. Erbaugh8,9
 Yuta J. Masuda10
- 1The Nature Conservancy in Europe, Berlin, Germany
- 2CUNY Institute for Demographic Research, City University of New York, New York, NY, United States
- 3Geography Department, Humboldt University, Berlin, Germany
- 4Global Science, World Wide Fund, San Francisco, CA, United States
- 5Geography Department, King’s College London, London, United Kingdom
- 6Department of Environmental Systems Science, ETH Zürich, Zürich, Switzerland
- 7Tackle Climate Change, The Nature Conservancy, Washington, DC, United States
- 8Global Science, The Nature Conservancy, Washington, DC, United States
- 9Department of Environmental Studies, Dartmouth College, Hanover, NH, United States
- 10Paul G. Allen Family Foundation, Seattle, WA, United States
Nature-based solutions (NBS) can deliver many benefits to human wellbeing, including some crucial to climate adaptation. We quantitatively assess the global potential of NBS strategies of protection, restoration, and agroforestry by modeling global climate change mitigation and local ecosystem services (water availability, sediment retention, runoff, pollination, nitrogen retention, green water storage, and coastal protection). The strategies with the most potential to help people do not necessarily deliver the most climate change mitigation: per area of conservation action, agroforestry provides substantial benefits (>20% increase in at least one local ecosystem service) to three times more people on average than reforestation while providing less than one tenth the carbon sequestration per unit area. Each strategy delivers a different suite of ecosystem service benefits; for instance, avoided forest conversion provides a strong increase in nitrogen retention (100% increase to 72 million people if fully implemented globally) while agroforestry increases pollination services (100% increase to 3.0 billion people if fully implemented globally). One common disservice shared by all the NBS strategies modeled here is that increased woody biomass increases transpiration, reducing annual runoff and in some watersheds negatively impacting local water availability. In addition, the places with the greatest potential for climate change mitigation are not necessarily the ones with the most people. For instance, reforestation in Latin America has the greatest climate change mitigation potential, but the greatest ecosystem service benefits are in Africa. Focusing on nations with high climate mitigation potential as well as high local ecosystem service potential, such as Nigeria in the case of reforestation, India for agroforestry, and the Republic of Congo for avoided forest conversion, can help identify win-win sites for implementation. We find that concentrating implementation of these three conservation strategies in critical places, covering 5.8 million km2, could benefit 2.0 billion people with increased local ecosystem services provision. These critical places cover only 35% of the possible area of implementation but would provide 80% of the benefits that are possible globally for the selected set of ecosystem services under the NBS scenarios examined here. We conclude that targeting these critical places for protection, restoration, and agroforestry interventions will be key to achieving adaptation and human wellbeing goals while also increasing nature-based carbon mitigation.
1 Introduction
There has been much research and modeling of the potential role of nature-based solutions (NBS) in providing multiple benefits to human wellbeing, including climate mitigation. NBS has been defined as actions addressing “societal challenges through actions to protect, sustainably manage, and restore natural and modified ecosystems, benefiting people and nature at the same time” (Cohen-Shacham et al., 2019). Sometimes the term natural climate solutions (NCS) (Griscom et al., 2017) is also used to specify a specific type of nature-based solution (NBS) that has climate change mitigation as a primary goal (Ellis et al., 2024). In this study we will use the term NBS, discussing conservation actions that have both climate change mitigation and local ecosystem service benefits. Examples of NBS include avoided forest conversion, reforestation, and the appropriate use of agroforestry, for which case studies have shown benefits and disbenefits for climate change adaptation and human wellbeing (Chausson et al., 2020; Chang et al., 2024). These three conservation actions, if implemented properly, are nature-based solutions in the sense of the Cohen-Shacham definition. For instance, reforestation is an action to “restore” (increase forest cover back toward past levels) a “natural ecosystem” (a forest) in order to address a societal challenge (climate mitigation as well as some potential wellbeing benefits, like reduced soil erosion).
Climate change is one of the most pressing challenges affecting human society, and urgent actions are needed to avoid catastrophic impacts (IPCC, 2023). In order to avoid more than 2°C average warming, total net emissions of greenhouse gasses (GHG) need to be reduced beyond current Nationally Determined Commitments (NDCs) by an additional 6–14 Pg of carbon dioxide equivalent per year (Pg CO2e yr−1) by 2030 (Shukla et al., 2022). One study estimated the maximum global potential of NBS for climate mitigation is 20–37 Pg CO2e yr−1, of which 11.3 Pg CO2e yr−1 is cost-effective (<100 USD MgCO2−1) and 4.1 Pg CO2e yr−1 of which is low cost (<10 USD MgCO2−1) (Griscom et al., 2017).
Mitigating climate change could ameliorate catastrophic hazards, but communities around the world are already experiencing impacts from a changing climate (IPCC, 2023). Major impacts from climate change include increased freshwater flooding (Hirabayashi et al., 2013) and water shortages (Li et al., 2009; Flörke et al., 2018), as the hydrologic cycle is altered (Kundzewicz, 2008), and coastal flooding (Toimil et al., 2020) as sea levels rise (Mimura, 2013) and tropical storms become more intense (Walsh et al., 2016). NBS for adaptation (Turner et al., 2022)— sometimes called by the related but distinct term of ecosystem-based adaptation (Colls et al., 2009)— can play an important role in helping reduce these impacts. Examples of NBS for adaptation include reforestation of steep slopes to slow water’s movement and decrease peak flows in rivers during floods (Kabisch et al., 2016; Tellman et al., 2018), or protection or restoration of coastal habitat to reduce hazards to communities in the low-elevation coastal zone (Spalding et al., 2014). While there have been many case studies of NBS providing adaptation benefits in particular places to particular communities (Chausson et al., 2020), it remains scientifically difficult to map and quantify the global potential of NBS as an adaptation tool.
NBS can provide many other benefits (MEA, 2005; McDonald, 2015; Kabisch et al., 2016), sometimes referred to as “co-benefits” in the context of climate mitigation but often of significant importance in their own right (Ürge-Vorsatz et al., 2014). Natural habitat, for instance, supports pollination of many crops (Kremen et al., 2007), a service which has been valued at $195–387 billion per year globally (Porto et al., 2020). The roots of trees and other vegetation can stabilize soil and encourage rainwater infiltration (Vogl et al., 2017), decreasing erosion and increasing retention of nutrients like nitrogen and phosphorus that can be harmful to water bodies if released in excess (Hopkins et al., 2018; Keeler et al., 2019). A recent global mapping exercise assessed a suite of ecosystem services—also sometimes referred to by the similar but not identical concept of nature’s contribution to people (Pascual et al., 2023)— delivered by current natural habitats, designating critical natural assets as the 30% of total global land area that provides 90% of the current magnitude of ecosystem services (Chaplin-Kramer et al., 2023).
However, there remains little knowledge globally of how NBS, which cause changes in land cover and land use, will change ecosystem service provision. In particular, the degree to which key sites for climate change mitigation overlap with key sites for local ecosystem services for adaptation and other facets of human wellbeing remains unclear. Most previous global research has focused on one kind of NBS, rather than considering multiple potential actions, and has modeled one or a couple benefits to human wellbeing. There has been much rhetoric about win-win opportunities for NBS for mitigation and adaptation, and some empirical research on when such win-wins occur (Nelson et al., 2009; Mueller et al., 2014; Hegwood et al., 2022). However, there is little quantitative global data on how often key sites for the provision of these ecosystem services overlap spatially.
This paper addresses the following research questions.
• Where are the areas where NBS, conservation actions such as protection, reforestation, or agroforestry, have the greatest potential to enhance local ecosystem services?
• Which NBS have positive and negative impacts on local ecosystem services? How many people will benefit and how much will they benefit?
• Where are areas in which NBS are the most effective, in terms of benefits to people per area over which the action is implemented?
• What is the spatial overlap between critical places for NBS supporting human wellbeing, and priority places identified for carbon mitigation?
2 Materials and methods
Our analysis proceeded in six steps: 1) defining a conceptual framework for ecosystem services and their relationship to adaptation benefits; 2) selecting the input scenarios of conservation action; 3) selecting other key global datasets needed for our analysis; 4) ecosystem service modeling in biophysical terms; 5) calculating and mapping of beneficiaries; and 6) prioritization analysis to select sites for conservation action with high human wellbeing benefits. Below, we discuss each of these six phases in greater detail.
2.1 Ecosystem services and relationship to adaptation benefits
Our analysis began by defining a set of societal problems, from climate change or otherwise, that have a potential solution in ecosystem services, and for which there are well-studied global ecosystem service models (Table 1). For instance, a loss of pollination services is a challenge for crop production of insect-pollinated crops. Similarly, degraded water quality due to sedimentation and nutrient pollution can impact suitability and treatment costs for human water use. For climate risks specifically, we follow the definition of the IPCC: “The consequences of realized risks on natural and human systems, where risks result from the interactions of climate hazards, exposure, and vulnerability” (Allen et al., 2018). Our working definition of adaptation follows that of the IPCC: “The process of adjustment to actual or expected climate and its effect” (IPCC, 2018). This paper primarily considers metrics of ecosystem services provision that relate to the reduction in hazard or exposure, leaving aside the mapping of vulnerability, which is often context and society-specific and hence difficult to model globally. For example, we looked at metrics related to having too little water (drought) or too much water (floods), overlaid with population.
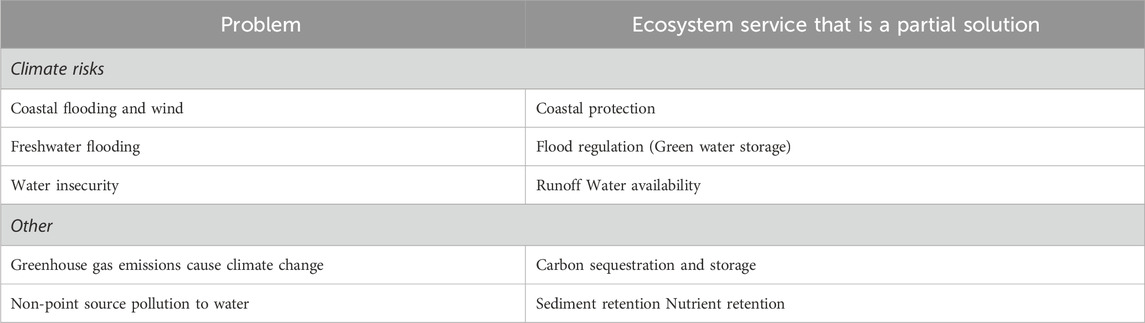
Table 1. Conceptual relationship between societal problems and ecosystem services used in this study.
We then identified common NBS that aim to increase ecosystem service provision, selecting three that are often used to achieve climate change mitigation as well as other societal goals: reforestation (e.g., Bastin et al., 2019), avoided forest conversion (e.g., Houghton and Nassikas, 2018), and agroforestry (e.g., Zomer et al., 2022). Each NBS delivers a bundle of ecosystem service benefits, providing all the ecosystem services listed in Table 1 (and described below), but to differing degrees. We always measure ecosystem services benefits of these interventions relative to a baseline case in 2020, calculating the change in ecosystem service provision from this baseline case. For ecosystem services related to climate adaptation, we tallied the number of beneficiaries.
2.2 Input scenarios of NBS
We reviewed available datasets of these three types of NBS that define where the actions are possible, looking for datasets that met the following global requirements, and adjusting as necessary. First, datasets had to be globally complete and spatially detailed, with a pixel size of at least 1 km, to roughly match the spatial scale of the ecosystem service models we used. Second, we ensured consistency in land cover classification between the baseline scenario and the conservation action scenario, to allow for their direct comparison. Below, we describe each NBS type and define our input data sources that map where it is possible.
2.2.1 Reforestation
Targeted reforestation efforts, such as planting trees on degraded historically forested lands, can contribute to carbon sequestration and provide multiple co-benefits, including improved water quality. Reforestation potential was mapped using the areas of opportunity from Griscom et al. (2017). This analysis mapped reforestation potential using a combination of the Atlas of Forest Restoration Opportunities (Potapov et al., 2011) and MODIS-derived vegetation continuous fields data (Hansen et al., 2003). Reforestation was restricted to biomes that naturally have some tree cover (Olson et al., 2001), in places not currently used for cropland or developed land uses, among other restrictions. More information can be found on pages 48–52 of the Supplementary Material of Griscom et al. (2017). Note that in the special case of ecosystems with only partial tree cover, such as savannahs, we assumed reforestation up to percent canopy cover observed in that biome. For reforestation carbon sequestration potential, we followed the methodology of Cook-Patton et al. (2020), which calculates the carbon sequestration rate of natural regeneration from 2020 to 2050.
2.2.2 Avoided forest conversion
Protecting existing forests is another strategy for climate mitigation. Trees absorb carbon dioxide and store it in their biomass, so by preventing deforestation in at-risk places, annual carbon sequestration and total carbon storage can be maintained over time (Mollicone et al., 2007). This is different than assessing current provision of ecosystem services (e.g., Chaplin-Kramer et al., 2023) because the likelihood of conversion or loss of the ecosystems is considered, along with the counterfactual of what the ecosystem is likely to be converted to. Avoided forest conversion was mapped using the Avoided Forest Conversion v1.1 product, described in Avoidable Forest Conversion Map. Average annual forest cover loss rates were measured using Landsat-defined forest cover maps (Hansen et al., 2013) from 2000 to 2018. Avoided forest conversion is distinct from other NBS in that the baseline is not current land cover, but instead the reduced forest cover that will remain if current forest loss continues. We therefore constructed a map of forest cover loss to 2050 by extrapolating the annual rate of loss forward for our analysis. The effect of avoided forest conversion is then to avoid this forest loss, maintaining current forest cover.
2.2.3 Agroforestry
Integrating trees into agricultural landscapes, a practice known as agroforestry, helps sequester carbon, while also improving soil health, conserving water, and providing shade and windbreaks which all support more sustainable food production (Ramachandran Nair et al., 2009). Agroforestry potential mapping followed the Foodscapes report (Bossio et al., 2021). This report assessed potential for adding trees to the landscape in both croplands (silviculture) and grazing lands (silvopasture). See page 71–73 of the report for more information on methodology used. Note that agroforestry was mapped as possible for most of the cropland and rangeland globally, which makes the spatial extent of this NBS larger than for reforestation or avoided forest conversion. However, as only a small fraction of the agricultural area if revegetated, the increase in carbon sequestration per hectare is less than for reforestation or avoided forest conversion (Leavitt et al., 2021).
2.3 Other data sources and data harmonization
Our baseline land cover for this project was the European Space Agency’s Climate Change Initiative (CCI) Medium Resolution Land Cover (MRLC) data set for 2020 (Harper et al., 2022), version 2.0. This baseline was chosen since it was a globally consistent, long-term time series of land-cover, important characteristics for other linked analyses of this project (Hülsen et al., 2023). The 300 m spatial scale of the MRLC matches the resolution of the other input data layers to the ecosystem service models we used for this analysis, and helps align our results with those derived in the Critical Natural Assets (Chaplin-Kramer et al., 2023) paper.
The land cover classification and pixel size of each input NBS scenario was harmonized to this baseline land cover by making a set of simple decision rules that applied the logic of the NBS scenarios to the MRLC data. For reforestation, we applied the logic from Griscom et al. (2017). We define as reforestable all pixels that are within the reforestation potential areas of Griscom et al. (2017) and that do not have currently an urban or cropland use in the MRLC data. Note that Griscom et al. (2017)’s definition of what can be reforested includes information on natural land cover in an ecoregion, so reforestation is not considered possible in areas that do not have natural forest cover.
For agroforestry, we used the area of potential for silvopasture and silviculture defined in the Foodscapes report (Bossio et al., 2021). Pixels that were grassland currently and identified as potential silvopasture were switched from grassland to a new silvopastoral category. Similarly, pixels that were cropland in the base year (2020) and within the area of potential agroforestry were switched in the NBS scenario from cropland to the mosaic crop/natural class for silviculture and from grassland to savanna for silvopasture.
For avoided forest conversion, we needed to estimate a map of forest cover in 2050, if current trends continue. This “status quo 2050” map was then run through the ecosystem service models. The ecosystem service value of avoided forest conversion is then the extra service provision from retaining forest cover (i.e., baseline provision minus “status quo 2050” provision). This “status quo 2050” layer had to be harmonized with the MRLC data. Wherever the 2050 tree cover fell below 40% (for forested pixels) or below 15% (for intermediate forest or savannah) we convert the pixels to another land-use category. To do this, we needed spatial information on the drivers of conversion, to better understand what land-use forested pixels might become. To be consistent with the Avoided Forest Conversion (AFC) dataset, we used Curtis et al. (2018), which provides 10 km resolution data on the drivers of deforestation. If the driver was urbanization, then the pixel was shifted to an urban land-use in this NBS scenario. If it was shifting agriculture or commodity-driven conversion it was moved to an agricultural land-use class.
Our base population for this project was taken from Landscan (Dobson et al., 2000) for 2020. Landscan is one of the most spatially resolved of global population datasets, interpolating census estimates of population using other ancillary datasets such as information on infrastructure and nighttime lights. Note that while our analysis looks at scenarios of NBS implementation, we do not attempt to project future population distribution. Rather, our dominant research question is “If NBS is implemented in the short-term, who will benefit?”
For country boundaries, we used the Natural Earth’s (naturalearthdata.com) country boundary file at the most spatially detailed spatial resolution (1:10), with lakes and Antarctica excluded from our analysis. Countries are referred to by three letter ISO codes, to save space. Note that the use of this boundary file and country names is not a political endorsement of any contested boundary or territory.
2.4 Ecosystem service models
2.4.1 Carbon storage and sequestration
To assess the carbon stock for the baseline land cover, we mapped zones based upon unique combinations of the MRLC land cover (in 2010, to match the carbon data) and ecoregions (Olson et al., 2001; Dinerstein et al., 2017). Within each zone, we calculated the average carbon per hectare, based upon the above-ground and below-ground biomass carbon for 2010 from Spawn et al. (2020). These average carbon densities, for a given MRLC land cover type, in each ecoregion, were then applied to the current and scenario maps. Where certain land cover types were missing from certain ecoregions, gaps were filled first within the same biome. If the land use type was missing from the whole biome, then the global average value of the land use type was used. This approach was taken so ecosystem service benefits including carbon could also be consistently estimated for historical land-use cover, going back to 1992, for another related research project (Hülsen et al., 2023).
Methodology to calculate the carbon benefits of NBS varied by conservation action, to match as much as possible methodology used in the previously published studies that mapped potential areas of implementation. For reforestation, areas of reforestation were assumed to add carbon at rates from Cook-Patton et al. (2020), who spatially mapped the rate of carbon accumulation in natural forest regeneration globally. For agroforestry, we followed the assumption of the Foodscapes report methodology (Bossio et al., 2021) that 10% of each agricultural pixel would be allowed to increase in woody biomass. We assumed this increase in woody biomass occurred at the rate mapped by Cook-Patton et al. (2020). For all three scenarios of conservation action, note that because the spatial resolution of our analysis differs from some of the input datasets, our total estimate of carbon also varies, even if the spatial patterns of carbon sequestration are globally similar. In general, maps of global forest cover at 30 m resolution tend to estimate greater forest cover and carbon than maps at 1 km resolution, for instance. This is an example of the modifiable areal unit problem (Jelinski and Wu, 1996).
2.4.2 Water availability
This ecosystem service was assessed with WaterWorld v2.92 using the water stress module. WaterWorld is an open-access global hydrological model that runs entirely from global datasets and can be applied for analysis at scales from local through global. It is widely used as a decision support tool and includes modules for wind-driven rainfall, fog inputs, snow and ice, water balance and surface runoff as well as a model for water quality and its transmission downstream (Mulligan, 2013; Mulligan and Soesbergen, 2017). The model is applied here for 2020 land cover, land use, and population, as well as for average climate according to WorldClim (Hijmans et al., 2005). Annual mean water stress (% of water demand not supplied or contaminated) is the ratio of the supply of water (the simulated clean water balance after evaporative water use) and water demand (estimated from per capita domestic and industrial demand and population), assessed monthly. Clean water is considered as 100 minus the WaterWorld Human Footprint on Water Quality (HFWQ), an indicator of the impact of upstream human land use on water quality, measured as the percent of water affected by upstream human land use (Mulligan, 2009). For consistency with other ecosystem services, in this paper we express our results in terms of water availability (i.e., 1–annual mean water stress ratio), so that conservation actions that have positive benefits to human wellbeing have a positive sign.
2.4.3 Water runoff for water provision
Annual total runoff was assessed with the runoff module of the WaterWorld v2.92 model, and relates both to problems (e.g., too much runoff can lead to flooding) and opportunities (e.g., runoff can be abstracted for human uses, and it maintains base flow in streams). Runoff is the cumulative water balance along the HydroSHEDS (Lehner et al., 2008) flow network, calculated on a monthly basis. Note that many scenarios that increase biomass increase evapotranspiration and hence decrease runoff, but that there are places globally in which vegetation growth increases precipitation and thus runoff, such as through fog-interception in cloud forests.
2.4.4 Green water storage for flood mitigation
This ecosystem service was assessed with the flood storage module of the WaterWorld v2.92, and is the sum of components of canopy water storage, wetland storage capacity, and soil storage capacity (Gunnell et al., 2019). This metric relates to flood risk reduction through natural flood storage, and identifies the upstream places where canopies, wetlands, and soils can take up and temporarily store rainfall, which is then slowly released, to the benefit of downstream communities.
2.4.5 Sediment retention
This ecosystem service measures how vegetation helps prevent erosion and stabilize soils, which is important for improving water quality for downstream populations. Sediment retention is modeled using the InVEST Sediment Delivery Ratio model (Tallis et al., 2013), which estimates erosion using the Revised Universal Soil Loss Equation (Renard et al., 2017), based on climate, soil texture, topography, and land cover. In this case, we use the global implementation established in Chaplin-Kramer et al. (2023). Sediment movement is estimated with a conductivity index based on the upslope and downslope areas of each pixel. Ideally sediment retention would be estimated for reservoirs, canals, and other water infrastructure most impacted by sedimentation, but as there is no comprehensive global dataset identifying all such infrastructure, we measure the beneficiaries simply as the total number of people downstream.
2.4.6 Nitrogen retention
This ecosystem service measures how vegetation and natural ecosystems prevent the movement of nitrogen downstream, which helps to regulate water quality for downstream populations. Nitrogen retention is modeled using the InVEST Nutrient Delivery Ratio model run at 300 m resolution (Tallis et al., 2013), again using the global implementation developed in Chaplin-Kramer et al., 2023. This model estimates nutrient export based on fertilizer application, precipitation, and the retention capacity of vegetation. The people benefiting from nitrogen retention are those downstream who might be exposed to nitrogen contamination in their drinking water, which again, in absence of global information about drinking water sources, we represent as the total number of people downstream.
2.4.7 Pollination
Natural habitat can play an important role in supporting native pollinators that also help pollinate certain insect-pollinated agricultural crops that human livelihoods depend on. Pollination services are mapped using the methodology described in Chaplin-Kramer et al. (2023), based on the sufficiency of habitat within 2 km (the typical flight range of a pollinator). Pollinator habitat sufficiency is modeled based upon natural MRLC types at 300 m. This overall value of natural habitat for supporting pollinators also depends on pollinator-dependent agricultural production, determined by the mixture of crops (as mapped by Monfreda et al., 2008) and the percent of yield reductions in absence of pollination (reviewed by Klein et al., 2007). The equivalent number of people fed from the pollinated portion of production on each farmed pixel is then mapped back to natural habitat that supplied the pollination benefit.
2.4.8 Coastal protection
Coastal protection is the reduction in risk from coastal hazards that human communities receive due to natural ecosystems. Coastal protection is modeled with the InVEST Coastal Vulnerability model (Tallis et al., 2013), using information on terrestrial and coastal/off-shore habitats and a global implementation developed in Chaplin-Kramer et al., 2023. In this case, following the methodology of Chaplin-Kramer et al. (2023), the value of coastal protection is assigned to the natural habitat that caused the benefit. Coastal risk depends on the physical exposure to coastal hazards (such as wind, waves, storm surge, sea level rise, geomorphology, and bathymetry, and the presence of protective natural habitat), and the risk reduction is measured as the difference between the coastal risk with and without the existing (current or scenario) level of natural habitat. This risk reduction measured at the shore was then mapped back to the habitat protecting it according to the protective distance of the habitat (ranging from 500 m for sea grass to 2,000 m for coral reefs and mangroves).
2.5 Number of people benefiting
Different ecosystem services were assessed with very different biophysical units (e.g., tons of sediment avoided, liters of runoff, etc.). It was beyond the scope of this paper to attempt to estimate the total economic value of all these services. To facilitate comparison among ecosystem services, we calculated the percent change in provision with implementation of the conservation action. This provides a unitless, comparable metric of the change in the “supply” of an ecosystem service.
To quantify the number of beneficiaries for each ecosystem service (the “demand”), we defined areas where proximate populations would receive direct benefits. This is related to the “serviceshed” concept (Tallis et al., 2012), the area of ecosystem service transportability (McDonald, 2009). Servicesheds (or “benefit-sheds” as we delineate here) differ in spatial scale depending on the ecosystem service (McDonald, 2015), and the flow of water determines the benefit-shed for many of the ecosystem services in this study. However, for pollination and coastal protection, the proximity of habitat at distances relative to pollinator flight and wave attenuation, respectively, was delineated. Calculation of these benefitting areas was generally done with the WaterWorld and InVEST frameworks, following the methods described in Chaplin-Kramer et al. (2023). These benefit-shed maps (defined separately for each scenario of land cover, for each ecosystem service) were then used to estimate the number of direct beneficiaries using our spatial population data (Dobson et al., 2000). For some calculations, we wished to assess only those with a meaningful change in ecosystem service provision, defined as at least a 20% change in biophysical provision. Note that this can be positive (a service) or negative (a disservice). For instance, the reduction in runoff due to increasing biomass can be thought of as a disservice.
2.6 Prioritization analysis
The different NBS have very different areas of potential implementation, as defined in the scientific literature. Agroforestry, for instance, might be practiced in many agricultural landscapes globally, while avoided forest conversion is only viable as a conservation action in landscapes with actual deforestation. To account for these different areas of implementation, we calculated carbon benefits per area of implementation and local ecosystem service beneficiaries per area of implementation, both globally and by country. We also calculated these metrics in major hydrologic basins, which are useful summary units of analyses since many ecosystem services that are hydrological in nature have service-sheds that follow watershed, not country, boundaries.
For our simple prioritization analysis, we used the number of beneficiaries normalized by intervention area as a simple metric of efficiency, in the absence of a spatially explicit global dataset on the costs of these actions per square kilometer of implementation. We ranked major hydrological basins by the beneficiaries per square kilometer achieved using the NBS with the greatest value of our metric of efficiency. This allowed us to construct an accumulation curve and estimate the percent of watersheds that would need conservation benefit to achieve a certain percentage of the maximum possible total global human wellbeing benefits from the three NBS we assessed.
3 Results
There are many ways NBS can benefit people, several of which we model as ecosystem services. Each strategy delivers a unique set of services, and each service benefits people within a specific serviceshed that depends on the service in question. At one extreme, carbon sequestration anywhere provides climate regulation services globally (McDonald, 2009) since the atmosphere’s carbon dioxide concentration is well mixed. At the other extreme, pollination services must be provided in proximity of animal-pollinated crops.
Moreover, patterns of ecosystem service provision vary among services. Notably, the NBS with the most potential to directly help people are not necessarily the ones with the most carbon mitigation potential. Figure 1 shows change in provision of ecosystem services, in biophysical units, per area of conservation action. Both avoided forest conversion and reforestation have high carbon sequestration potential, as measured in tons of carbon sequestered per square kilometer of conservation action, with a large increment of biomass compared to the base case of no conservation action. However, at a global average level, these two strategies significantly (i.e., a greater than 20% increase in one local service) benefit a relatively small number of people per square kilometer of conservation action, simply because where these two strategies are feasible is often in relatively rural, sparsely populated landscapes. Conversely, agroforestry has relatively low carbon sequestration potential per square kilometer due to our definition of agroforestry. However, agricultural landscapes tend to have more people nearby sites where agroforestry would be implemented, resulting in higher numbers of people benefiting from agroforestry implementation. In sum, different conservation strategies have different potentials for climate mitigation and benefits to people, and conservation planners must pick the appropriate strategy based upon their goals.
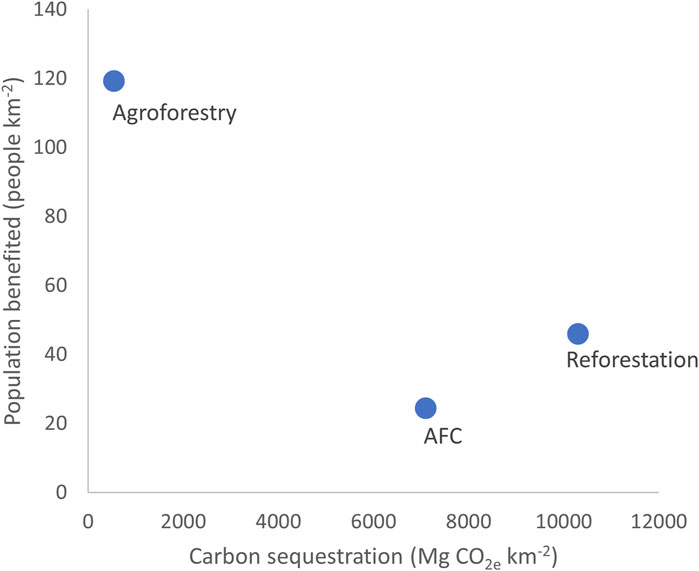
Figure 1. Global average benefits per area of conservation action for three conservation actions. Shown are the carbon sequestration (x-axis) and the people benefiting from a significant increase in other ecosystem services provision (y-axis). Significant benefit is defined to be at least one local (non-carbon) ecosystem service increasing by at least 20%.
In percentage terms, pollination in the agroforestry scenario and nitrogen retention in the avoided forest scenario demonstrate some of the biggest increases (>100%) in ecosystem service provision (Figure 2). The greatest percentage increase in carbon sequestration is under the reforestation scenario, because the denominator (carbon storage in the baseline case) is often low. In terms of people benefitting, carbon sequestration under any of the three NBS scenarios delivers the greatest number of beneficiaries, since carbon sequestration is a global ecosystem service. Other strategies that provide many people with a significant benefit include sediment and nutrient retention from agroforestry.
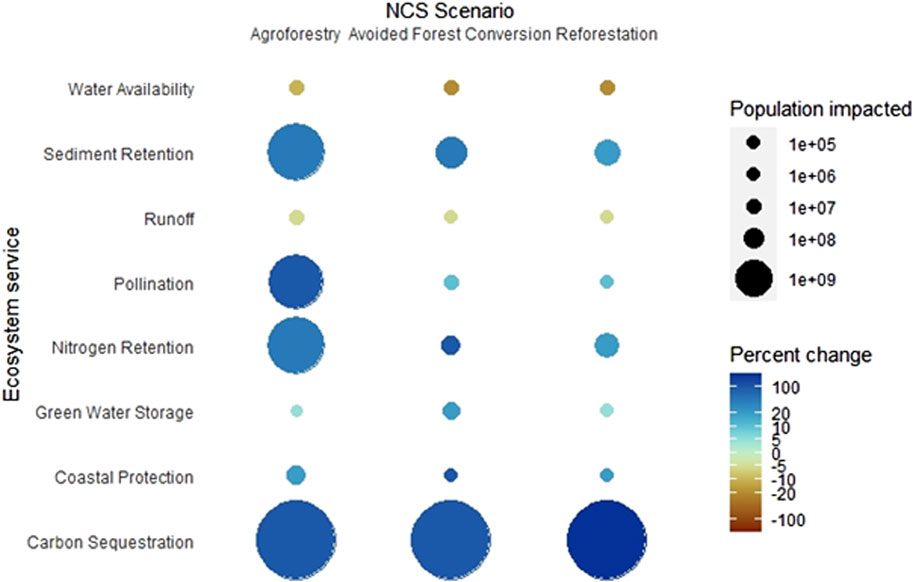
Figure 2. The effect of three scenarios of natural climate solutions (NCS) on eight ecosystem services. The size of the bubble is proportional to the total number of people whose ecosystem services are impacted at some level by the scenario, while the color is the average percent change in ecosystem service provision in areas where the scenario is implemented. Note that for carbon sequestration, the entire global population is considered the beneficiary.
NBS may also locally result in disservices, negative consequences of their implementation for some people (Figure 2). Among the ecosystem services modeled here, the major disservice is associated with water resources. Increasing biomass, as happens in any of our three NBS, tends to increase transpiration above the baseline case of no NBS (e.g., Jaramillo et al., 2018), which decreases runoff but increases green storage by tree canopies. While the increase in green water storage could be important for reducing flood risk--a risk that is projected to increase from climate change in many other studies (see review in Wasko et al., 2021)—the reduction in runoff will lead to lower base flows in rivers and to decreased flow into groundwater. In some watersheds globally, the implementation of any of these three NBS decreases water availability for people (i.e., water stress increases). NBS that are good for climate change mitigation (carbon sequestration) may reduce flood risk but increase water insecurity, with implications of NBS needing to be carefully considered within the local and downstream hydrological context.
We also find differences in climate change mitigation and local ecosystem service benefits when examining overlap in terms of normalized benefits per unit area (Figure 3). For agroforestry, the greatest potential for carbon sequestration per square kilometer is in the tropics, but the greatest number of beneficiaries per square kilometer is concentrated in the largest agricultural production areas of the world: the Indian subcontinent and southeast and east Asia. Similarly, for reforestation and avoided forest conversion, the greatest potential for carbon sequestration per square kilometer is in tropical rainforest ecosystems, which have high carbon density of mature forests and fast growth rates, while the greatest number of beneficiaries per implementation area for both NBS is in Africa, particularly west Africa and portions of the headwaters of the Nile basin that are in forest ecosystems.
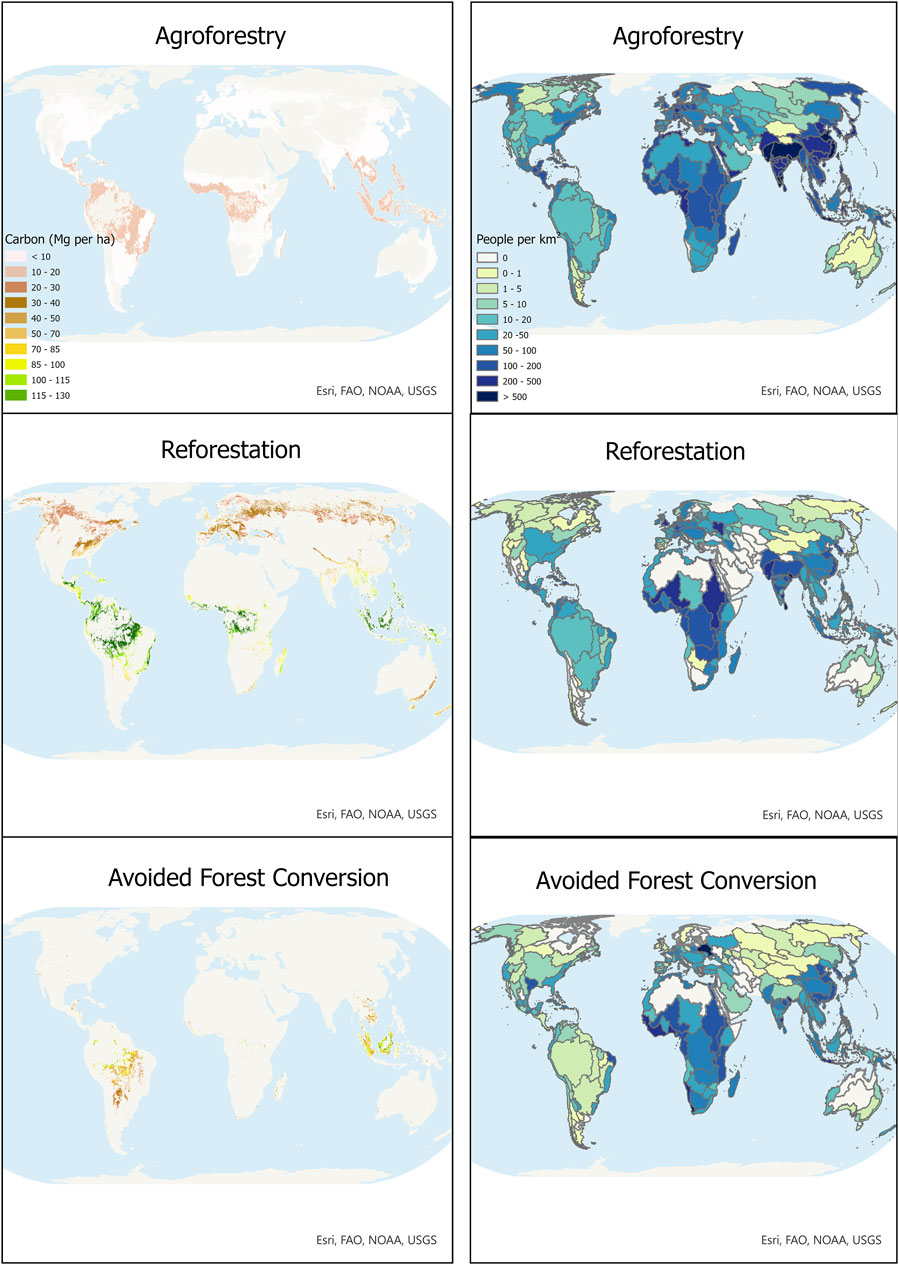
Figure 3. Carbon and co-benefits potential of three NBS. Carbon (left column) is shown at 300 m resolution. Note that at this global scale, much detail about where an action is possible or not is not visible since the image has been resampled. The number of people receiving significant co-benefits (right column) is shown at the major watershed resolution. Significant benefit is defined to be at least one local (non-carbon) ecosystem service increasing by at least 20%.
At a country-level, normalized for area of NBS, the carbon sequestration potential is not correlated with the number of people significantly benefited by any NBS. For each NBS, it is possible to find countries with similar carbon sequestration potential, but different numbers of people benefitting significantly. For instance, each square kilometer of avoided forest conversion in Gabon (GAB) removes more than 10,000 Mg carbon but provides significant ecosystem service benefits to less than 5 people (Figure 4). Conversely, in the Democratic Republic of Congo (COD) there is a similar level of carbon potential but almost 100 people benefited per square kilometer of conservation action. Of course, many other aspects differ between these two countries in terms of population density (9 people/km2 in Gabon versus 45 people/km2 in the DOC), governance, and cost and feasibility of conservation action, and these other factors must also be considered when choosing where NBS are implemented. Indeed, these other factors may make NBS for carbon mitigation more cost-effective to implement in rural, less populated landscapes. Similar patterns can be found for agroforestry (Supplementary Figure S1) and reforestation (Supplementary Figure S2). Our results suggest that while it is possible to choose countries that deliver both carbon and human wellbeing benefits, it should not be assumed that countries that have high carbon benefits will necessarily deliver significant ecosystem service benefits to many people.
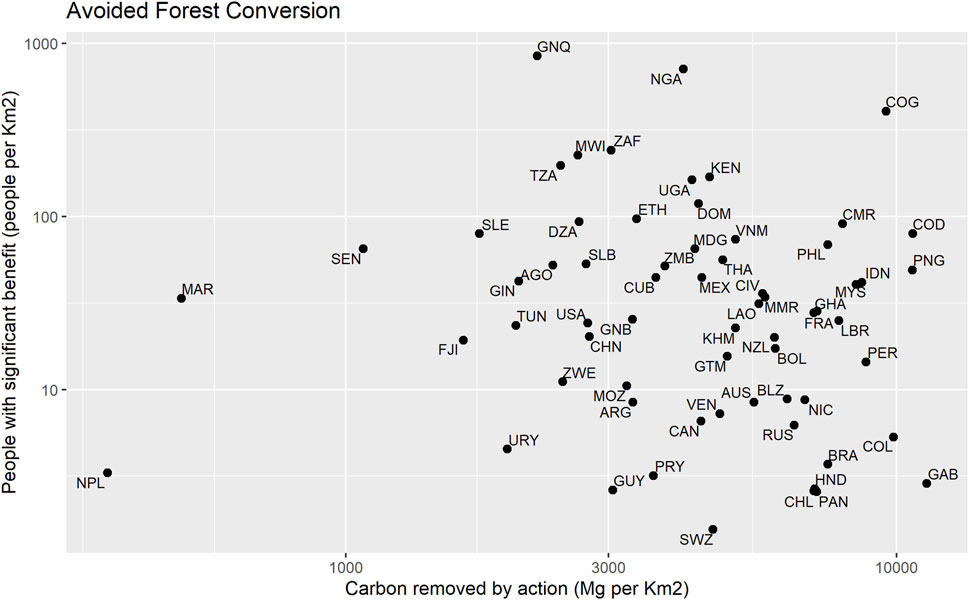
Figure 4. Carbon removed by avoided forest conversion (AFC) versus the number of people with a significant co-benefit from other ecosystem services, by country. Significant benefit is defined as at least a 20% increase in ecosystem service provision of a service other than carbon. Only countries where conservation action is possible are shown, and results are shown normalized by the square kilometers per conservation action. Countries are labeled with their three-digit UN ISO code (e.g., IDN is Indonesia).
NBS interventions at win-win sites, those that deliver carbon mitigation as well as large benefits to human wellbeing, are extremely concentrated (Figure 5). For the three NBS interventions we modeled, around 80% of all the people who could potentially benefit can be helped by action in just 35% of the total conservation area possible, a priority set of watersheds with the highest effectiveness (see Methods for details on prioritization). Priority watersheds for agroforestry are in the Indian subcontinent and southeast and east Asia, as well as a portions of central America, the Caribbean, and Europe. For avoided forest conversion and reforestation, priority watersheds are generally in Africa, as well a few watersheds in Europe. Note that within each watershed, only a small fraction of the area is prioritized for NBS, since actions can also be prioritized at the pixel level. For instance, the area around Lagos, Benin City, and Port Harcourt (inset map in Figure 5) is an interesting example of a region with priority sites for all three NBS.
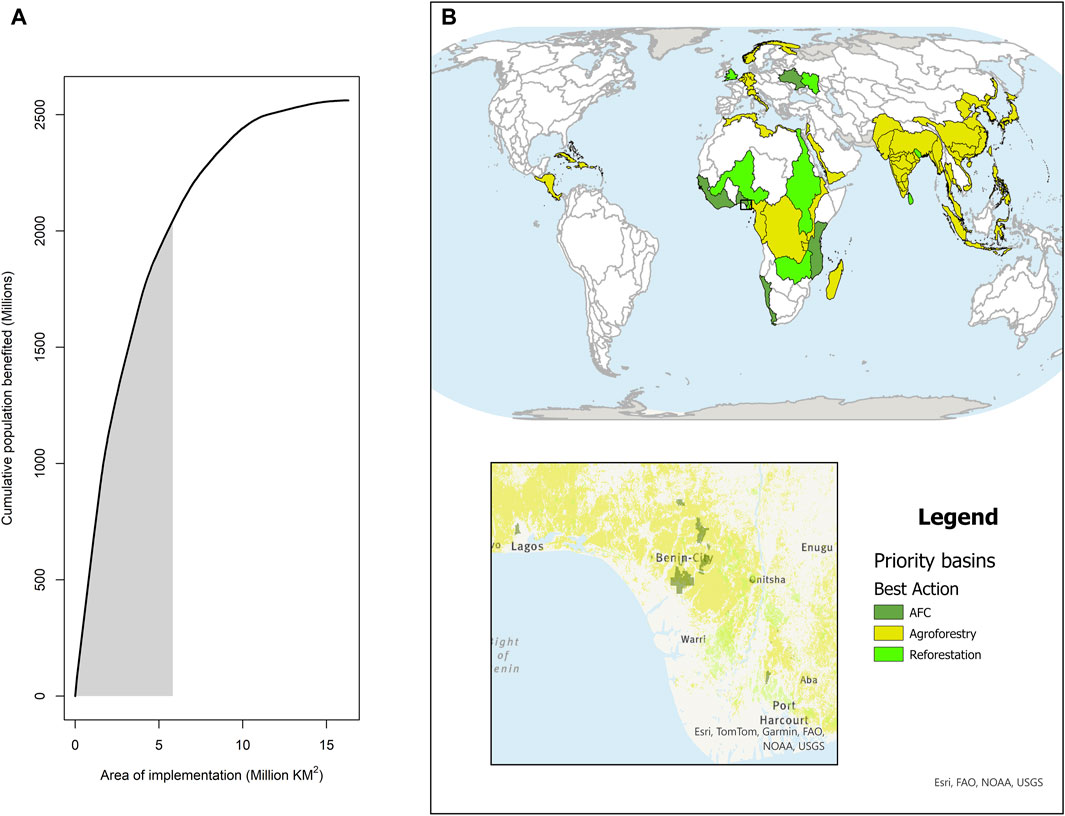
Figure 5. Priority watersheds for co-benefits. (A) The area of conservation implementation for the best action versus the cumulative population with a significant benefit. Significant benefit is defined as at least a 20% increase in ecosystem service provision of a service other than carbon. Around 80% of all potential people with a benefit are reached by working in a small set of priority watersheds (gray shading), amounting to 35% of total area. (B) Priority watersheds, classified by the best NBS. The zoomed-in map shows pixel-level data from one region in Nigeria.
4 Discussion
Our global analysis, like many global analyses, is conducted at a relatively coarse (300 m) resolution. It also does not account for different enabling conditions and constraints, which are often only known at the national or local level. Our research should not be used for site-level planning of NBS, but rather for regional priority setting. Given these important caveats, a few results are clear from our global analysis.
Key places for NBS vary depending on where they are feasible but have one common pattern: NBS provide ecosystem service benefits to a larger number of people in more densely populated landscapes, all else being equal. For instance, for reforestation and avoided forest conversion, portions of West Africa are key places to provide human wellbeing benefits, precisely because many people live close to where such interventions are possible and are likely to deliver important ecosystem services. At a regional or local scale, of course, many other factors come into play. Ecosystem services operate over a variety of scales, from shade provision at a very local level (10 s of meters) to hydrological services (downstream areas within watersheds) to global (carbon sequestration), which changes the optimal locations for ecosystem service delivery through conservation (McDonald, 2009).
On one hand, our research emphasizes that patterns of ecosystem service generation vary by service and by landscape, and that there can be varying degrees of synergies or tradeoffs among services. This matters from a public policy perspective since many of these ecosystem services are public goods, and have no real value in most market decisions (MEA, 2005). Carbon is a partial exception, as there are emerging carbon markets that incentivize changes in landcover that increase net carbon storage or sequestration. The most economically ideal places to implement carbon projects—for global benefit—are not necessarily the sites that will provide the most human wellbeing benefits to local people, so there is no reason to expect carbon markets to adequately provide human wellbeing benefits (McDonald, 2015).
We found a particularly pervasive tradeoff between carbon sequestration and water runoff (c.f., Jaramillo et al., 2018). Plants transpire water when they photosynthesize, the process that converts carbon dioxide to another form and sequesters it. Intercepted rainfall is also lost from plant leaves through direct evaporation. The three NBS strategies we included in our analysis increase plant biomass and thus increase evapotranspiration and decrease runoff. This can sometimes be useful, as has been shown in tropical rainforest systems, where transpiration from forests over large scales is linked to regional rainfall patterns that can offset some of these losses (Smith et al., 2023). However, our results indicate that in some locations, NBS have the potential to decrease water availability, increasing seasonal and annual water scarcity. In our analysis, these locations are primarily watersheds that already have high water stress (e.g., human water use is a large fraction of availability), so that additional water use in a scenario of NBS implementation makes this ratio meaningfully worse. Areas of currently high water stress in our results include the southwest of the United States, Chile and Peru along the west coast of South America, and the Indus River valley of Pakistan and India. In these kinds of water stressed basins, the additional water use requirements of a NBS must be considered carefully during decision-making.
Despite these potential trade-offs, there are sites where win-wins are possible (Figure 5), sites that can achieve goals for multiple objectives. These win-win sites are in places of high carbon density, often in tropical climates, where implementation of NBS has large carbon mitigation potential. They also are landscapes with high population density, so there are large local co-benefits provided from the NBS. Geographically, priority basins are concentrated in Africa and southeastern Asia. There remain win-win sites to choose from, if both carbon and human wellbeing benefits are considered jointly.
To implement NBS on these win-win site, multi-benefit planning needs to be encouraged and incentivized. Currently, ecosystem service benefits are considered through a variety of overlapping planning frameworks, policies, regulations, and incentives. For instance, increased water security might be delivered using government requirements for integrated watershed management, or due to regulations around water use. At the same time, a different agency in the national government may be planning for climate mitigation sufficient to achieve that country’s goal for greenhouse gas reduction, and may be considering using NBS as one strategy for climate mitigation. Our results suggest that, where feasible, disparate plans and policies should more comprehensively account for geographical variation in ecosystem service provision to achieve a better overall outcome for society and drive action toward win-win solutions. Only by fully considering the multiple benefits nature provides can NBS fulfil its greatest potential.
Data availability statement
The data presented in the study are deposited in the Data Dryad repository, DOI:10.5061/dryad.cz8w9gjcr.
Author contributions
RM: Conceptualization, Data curation, Formal Analysis, Funding acquisition, Investigation, Methodology, Project administration, Validation, Writing–original draft, Writing–review and editing. RC-K: Conceptualization, Formal Analysis, Methodology, Writing–original draft, Writing–review and editing. MM: Conceptualization, Formal Analysis, Methodology, Writing–original draft, Writing–review and editing. CK: Conceptualization, Methodology, Writing–original draft, Writing–review and editing. SH: Conceptualization, Methodology, Writing–original draft, Writing–review and editing. PW: Conceptualization, Project administration, Writing–original draft, Writing–review and editing. EP: Conceptualization, Funding acquisition, Writing–original draft, Writing–review and editing. JE: Conceptualization, Funding acquisition, Writing–original draft, Writing–review and editing. YM: Conceptualization, Funding acquisition, Writing–original draft, Writing–review and editing.
Funding
The author(s) declare that financial support was received for the research, authorship, and/or publication of this article. This research was supported by members and donors of The Nature Conservancy, a non-profit organization, including a philanthropic grant from the Bezos Earth Fund. CK received funding from the European Union’s Horizon 2020 research and innovation program grant agreement Nos 820712 (PROVIDE), 101073978 (DIRECTED), and 101081369 (SPARCCLE). Funders played no role in research design, analysis, or write-up.
Acknowledgments
The authors are grateful to numerous colleagues for advising us on possible methodologies, including S. Cook-Patton, P. Ellis, K. Fessenden, D.T. Hart, N. Wolff, and S. Wood.
Conflict of interest
The authors declare that the research was conducted in the absence of any commercial or financial relationships that could be construed as a potential conflict of interest.
Publisher’s note
All claims expressed in this article are solely those of the authors and do not necessarily represent those of their affiliated organizations, or those of the publisher, the editors and the reviewers. Any product that may be evaluated in this article, or claim that may be made by its manufacturer, is not guaranteed or endorsed by the publisher.
Supplementary material
The Supplementary Material for this article can be found online at: https://www.frontiersin.org/articles/10.3389/fenvs.2024.1432654/full#supplementary-material
References
Allen, M., Dube, O., Solecki, W., Aragón-Durand, F., Cramer, W., Humphreys, S., et al. (2018). Special report: global warming of 1.5 C. Intergovernmental Panel on Climate Change IPCC.
Bastin, J.-F., Finegold, Y., Garcia, C., Mollicone, D., Rezende, M., Routh, D., et al. (2019). The global tree restoration potential. Science 365, 76–79. doi:10.1126/science.aax0848
Bossio, D. A., Obersteiner, M., Wironen, M., Jung, M., Wood, S., Folberth, C., et al. (2021). “Foodscapes: toward food system transition,” in The nature conservancy, international institute for applied systems analysis, and SYSTEMIQ. Available at: https://www.nature.org/content/dam/tnc/nature/en/documents/TNC_FoodscapesReport.pdf.
Chang, C. H., Erbaugh, J. T., Fajardo, P., Lu, L., Molnar, I., Papp, D., et al. (2024). A global evidence map of human well-being and biodiversity co-benefits and trade-offs of natural climate solutions. Nat. Sustain. doi:10.1126/science.aax0848
Chaplin-Kramer, R., Neugarten, R. A., Sharp, R. P., Collins, P. M., Polasky, S., Hole, D., et al. (2023). Mapping the planet’s critical natural assets. Nat. Ecol. Evol. 7, 51–61. doi:10.1038/s41559-022-01934-5
Chausson, A., Turner, B., Seddon, D., Chabaneix, N., Girardin, C. A., Kapos, V., et al. (2020). Mapping the effectiveness of nature-based solutions for climate change adaptation. Glob. Change Biol. 26, 6134–6155. doi:10.1111/gcb.15310
Cohen-Shacham, E., Andrade, A., Dalton, J., Dudley, N., Jones, M., Kumar, C., et al. (2019). Core principles for successfully implementing and upscaling Nature-based Solutions. Environ. Sci. Policy 98, 20–29. doi:10.1016/j.envsci.2019.04.014
Colls, A., Ash, N., and Ikkala, N. (2009). Ecosystem-based Adaptation: a natural response to climate change. Gland, Switzerland: Iucn.
Cook-Patton, S. C., Leavitt, S. M., Gibbs, D., Harris, N. L., Lister, K., Anderson-Teixeira, K. J., et al. (2020). Mapping carbon accumulation potential from global natural forest regrowth. Nature 585, 545–550. doi:10.1038/s41586-020-2686-x
Curtis, P. G., Slay, C. M., Harris, N. L., Tyukavina, A., and Hansen, M. C. (2018). Classifying drivers of global forest loss. Science 361, 1108–1111. doi:10.1126/science.aau3445
Dinerstein, E., Olson, D., Joshi, A., Vynne, C., Burgess, N. D., Wikramanayake, E., et al. (2017). An ecoregion-based approach to protecting half the terrestrial realm. BioScience 67, 534–545. doi:10.1093/biosci/bix014
Dobson, J. E., Bright, E. A., Coleman, P. R., Durfee, R. C., and Worley, B. A. (2000). LandScan: a global population database for estimating populations at risk. Photogrammetric Eng. remote Sens. 66, 849–857. doi:10.1201/9781482264678-24
Ellis, P. W., Page, A. M., Wood, S., Fargione, J., Masuda, Y. J., Carrasco Denney, V., et al. (2024). The principles of natural climate solutions. Nat. Commun. 15, 547. doi:10.1038/s41467-023-44425-2
Flörke, M., Schneider, C., and Mcdonald, R. I. (2018). Water competition between cities and agriculture driven by climate change and urban growth. Nat. Sustain. 1, 51–58. doi:10.1038/s41893-017-0006-8
Griscom, B. W., Adams, J., Ellis, P. W., Houghton, R. A., Lomax, G., Miteva, D. A., et al. (2017). Natural climate solutions. Proc. Natl. Acad. Sci. 114, 11645–11650. doi:10.1073/pnas.1710465114
Gunnell, K., Mulligan, M., Francis, R. A., and Hole, D. G. (2019). Evaluating natural infrastructure for flood management within the watersheds of selected global cities. Sci. Total Environ. 670, 411–424. doi:10.1016/j.scitotenv.2019.03.212
Hansen, M. C., Potapov, P. V., Moore, R., Hancher, M., Turubanova, S. A., Tyukavina, A., et al. (2013). High-resolution global maps of 21st-century forest cover change. science 342, 850–853. doi:10.1126/science.1244693
Hansen, M., Defries, R., Townshend, J., Carroll, M., Dimiceli, C., and Sohlberg, R. (2003). Global percent tree cover at a spatial resolution of 500 meters: first results of the MODIS vegetation continuous fields algorithm. Earth Interact. 7, 1–15. doi:10.1175/1087-3562(2003)007<0001:gptcaa>2.0.co;2
Harper, K. L., Lamarche, C., Hartley, A., Peylin, P., Ottlé, C., Bastrikov, V., et al. (2022). A 29-year time series of annual 300-metre resolution plant functional type maps for climate models. Earth Syst. Sci. Data Discuss. 2022, 1–37. doi:10.5194/essd-2022-296
Hegwood, M., Langendorf, R. E., and Burgess, M. G. (2022). Why win–wins are rare in complex environmental management. Nat. Sustain. 5, 674–680. doi:10.1038/s41893-022-00866-z
Hijmans, R. J., Cameron, S. E., Parra, J. L., Jones, P. G., and Jarvis, A. (2005). Very high resolution interpolated climate surfaces for global land areas. Int. J. Climatol. A J. R. Meteorological Soc. 25, 1965–1978. doi:10.1002/joc.1276
Hirabayashi, Y., Mahendran, R., Koirala, S., Konoshima, L., Yamazaki, D., Watanabe, S., et al. (2013). Global flood risk under climate change. Nat. Clim. change 3, 816–821. doi:10.1038/nclimate1911
Hopkins, K. G., Noe, G. B., Franco, F., Pindilli, E. J., Gordon, S., Metes, M. J., et al. (2018). A method to quantify and value floodplain sediment and nutrient retention ecosystem services. J. Environ. Manag. 220, 65–76. doi:10.1016/j.jenvman.2018.05.013
Houghton, R. A., and Nassikas, A. A. (2018). Negative emissions from stopping deforestation and forest degradation, globally. Glob. change Biol. 24, 350–359. doi:10.1111/gcb.13876
Hülsen, S., Mcdonald, R. I., Chaplin-Kramer, R., Bresch, D., Sharp, R., Worthington, T., et al. (2023). Global protection from tropical cyclones by coastal ecosystems - past, present, and under climate change. Environ. Res. Lett. 18, 124023. doi:10.1088/1748-9326/ad00cd
IPCC (2018). “Annex I: glossary,” in Global Warming of 1.5°C. An IPCC Special Report on the impacts of global warming of 1.5°C above pre-industrial levels and related global greenhouse gas emission pathways, in the context of strengthening the global response to the threat of climate change, sustainable development, and efforts to eradicate poverty Editors V. P. Masson-Delmotte, H.-O. Zhai, D. Pörtner, J. Roberts, P. R. Skea, and A. Shukla (Cambridge, United Kingdom and New York, NY, United States: Cambridge University Press), 1, 541–562. doi:10.1017/9781009157940.008
IPCC (2023). Climate change 2022 – impacts, adaptation and vulnerability: working group II contribution to the sixth assessment report of the intergovernmental panel on climate change. Cambridge: Cambridge University Press.
Jaramillo, F., Cory, N., Arheimer, B., Laudon, H., Van Der Velde, Y., Hasper, T. B., et al. (2018). Dominant effect of increasing forest biomass on evapotranspiration: interpretations of movement in Budyko space. Hydrology Earth Syst. Sci. 22, 567–580. doi:10.5194/hess-22-567-2018
Jelinski, D. E., and Wu, J. (1996). The modifiable areal unit problem and implications for landscape ecology. Landsc. Ecol. 11, 129–140. doi:10.1007/bf02447512
Kabisch, N., Frantzeskaki, N., Pauleit, S., Naumann, S., Davis, M., Artmann, M., et al. (2016). Nature-based solutions to climate change mitigation and adaptation in urban areas: perspectives on indicators, knowledge gaps, barriers, and opportunities for action. Ecol. Soc. 21, art39. doi:10.5751/es-08373-210239
Keeler, B. L., Hamel, P., Mcphearson, T., Hamann, M. H., Donahue, M. L., Meza Prado, K. A., et al. (2019). Social-ecological and technological factors moderate the value of urban nature. Nat. Sustain. 2, 29–38. doi:10.1038/s41893-018-0202-1
Klein, A.-M., Vaissière, B. E., Cane, J. H., Steffan-Dewenter, I., Cunningham, S. A., Kremen, C., et al. (2007). Importance of pollinators in changing landscapes for world crops. Proc. R. Soc. B Biol. Sci. 274, 303–313. doi:10.1098/rspb.2006.3721
Kremen, C., Williams, N. M., Aizen, M. A., Gemmill-Herren, B., Lebuhn, G., Minckley, R., et al. (2007). Pollination and other ecosystem services produced by mobile organisms: a conceptual framework for the effects of land-use change. Ecol. Lett. 10, 299–314. doi:10.1111/j.1461-0248.2007.01018.x
Kundzewicz, Z. W. (2008). Climate change impacts on the hydrological cycle. Ecohydrol. Hydrobiology 8, 195–203. doi:10.2478/v10104-009-0015-y
Leavitt, S. W., Cook-Patton, S., Marx, L., Drever, C. R., Navarrete, D., Nan, Z., et al. (2021). Natural climate solutions handbook: a technical guide for assessing NatureBased mitigation opportunities in countries. Arlington, VA, USA: The Nature Conservancy.
Lehner, B., Verdin, K., and Jarvis, A. (2008). New global hydrography derived from spaceborne elevation data. Eos, Trans. Am. Geophys. Union 89, 93–94. doi:10.1029/2008eo100001
Li, Y., Ye, W., Wang, M., and Yan, X. (2009). Climate change and drought: a risk assessment of crop-yield impacts. Clim. Res. 39, 31–46. doi:10.3354/cr00797
Mcdonald, R. I. (2009). Ecosystem service demand and supply along the urban-to-rural gradient. J. Conservation Plan. 5, 1–14.
Mcdonald, R. I. (2015). Conservation for cities: how to plan & build natural infrastructure. Washington, DC: Island Press.
Mimura, N. (2013). Sea-level rise caused by climate change and its implications for society. Proc. Jpn. Acad. Ser. B 89, 281–301. doi:10.2183/pjab.89.281
Mollicone, D., Achard, F., Federici, S., Eva, H. D., Grassi, G., Belward, A., et al. (2007). An incentive mechanism for reducing emissions from conversion of intact and non-intact forests. Clim. change 83, 477–493. doi:10.1007/s10584-006-9231-2
Monfreda, C., Ramankutty, N., and Foley, J. (2008). Farming the planet: 2. Geographic distribution of crop areas, yields, physiological types, and net primary production in the year 2000. Glob. Biogeochem. Cycles 22. doi:10.1029/2007GB002947
Mueller, N. D., West, P. C., Gerber, J. S., Macdonald, G. K., Polasky, S., and Foley, J. A. (2014). A tradeoff frontier for global nitrogen use and cereal production. Environ. Res. Lett. 9, 054002. doi:10.1088/1748-9326/9/5/054002
Mulligan, M. (2009) “The human water quality footprint: agricultural, industrial, and urban impacts on the quality of available water globally and in the Andean region,” in Proceedings of the international conference on integrated water resource management and climate change. Cali: CO, 11.
Mulligan, M. (2013). WaterWorld: a self-parameterising, physically based model for application in data-poor but problem-rich environments globally. Hydrology Res. 44, 748–769. doi:10.2166/nh.2012.217
Mulligan, M., and Soesbergen, A. V. (2017). Estimating water use by crops and other vegetation in the Volta basin using WaterWorld.
Nelson, E., Mendoza, G., Regetz, J., Polasky, S., Tallis, H., Cameron, D., et al. (2009). Modeling multiple ecosystem services, biodiversity conservation, commodity production, and tradeoffs at landscape scales. Front. Ecol. Environ. 7, 4–11. doi:10.1890/080023
Olson, D. M., Dinerstein, E., Wikramanayake, E. D., Burgess, N. D., Powell, G. V. N., Underwood, E. C., et al. (2001). Terrestrial ecoregions of the world: a new map of life on Earth. Bioscience 51, 933–938. doi:10.1641/0006-3568(2001)051[0933:teotwa]2.0.co;2
Pascual, U., Balvanera, P., Anderson, C. B., Chaplin-Kramer, R., Christie, M., González-Jiménez, D., et al. (2023). Diverse values of nature for sustainability. Nature 620, 813–823. doi:10.1038/s41586-023-06406-9
Porto, R. G., De Almeida, R. F., Cruz-Neto, O., Tabarelli, M., Viana, B. F., Peres, C. A., et al. (2020). Pollination ecosystem services: a comprehensive review of economic values, research funding and policy actions. Food Secur. 12, 1425–1442. doi:10.1007/s12571-020-01043-w
Potapov, P. V., Laestadius, L., and Minnemeyer, S. (2011). Global map of potential forest cover. Available at: www.wri.org/resources/maps/atlas-forest-and-landscape-restoration-opportunities/data-info.
Ramachandran Nair, P., Mohan Kumar, B., and Nair, V. D. (2009). Agroforestry as a strategy for carbon sequestration. J. plant Nutr. soil Sci. 172, 10–23. doi:10.1002/jpln.200800030
Renard, K. G., Laflen, J., Foster, G., and Mccool, D. (2017) “The revised universal soil loss equation,” in Soil erosion research methods. Routledge.
Shukla, A., Skea, J., Reisinger, A., Slade, R., Fradera, R., Pathak, M., et al. (2022). IPCC 2022: climate change 2022: mitigation of climate change. Summary for policymakers. IPCC.
Smith, C., Baker, J., and Spracklen, D. (2023). Tropical deforestation causes large reductions in observed precipitation. Nature 615, 270–275. doi:10.1038/s41586-022-05690-1
Spalding, M. D., Ruffo, S., Lacambra, C., Meliane, I., Hale, L. Z., Shepard, C. C., et al. (2014). The role of ecosystems in coastal protection: adapting to climate change and coastal hazards. Ocean Coast. Manag. 90, 50–57. doi:10.1016/j.ocecoaman.2013.09.007
Spawn, S. A., Sullivan, C. C., Lark, T. J., and Gibbs, H. K. (2020). Harmonized global maps of above and belowground biomass carbon density in the year 2010. Sci. Data 7, 112. doi:10.1038/s41597-020-0444-4
Tallis, H. T., Ricketts, T., Guerry, A. D., Wood, S. A., Sharp, R., Nelson, E., et al. (2013). InVEST 2.5.6 user's guide. Stanford, CA: The Natural Capital Project.
Tallis, H., Wolny, S., Lozano, J. S., Benitez, S., Saenz, S., and Ramos, A. (2012). “Servicesheds” enable mitigation of development impacts on ecosystem services. New York: Mimeo.
Tellman, B., Mcdonald, R. I., Goldstein, J. H., Vogl, A. L., Flörke, M., Shemie, D., et al. (2018). Opportunities for natural infrastructure to improve urban water security in Latin America. PloS one 13, e0209470. doi:10.1371/journal.pone.0209470
Toimil, A., Losada, I. J., Nicholls, R. J., Dalrymple, R. A., and Stive, M. J. (2020). Addressing the challenges of climate change risks and adaptation in coastal areas: a review. Coast. Eng. 156, 103611. doi:10.1016/j.coastaleng.2019.103611
Turner, B., Devisscher, T., Chabaneix, N., Woroniecki, S., Messier, C., and Seddon, N. (2022). The role of nature-based solutions in supporting social-ecological resilience for climate change adaptation. Annu. Rev. Environ. Resour. 47, 123–148. doi:10.1146/annurev-environ-012220-010017
Ürge-Vorsatz, D., Herrero, S. T., Dubash, N. K., and Lecocq, F. (2014). Measuring the co-benefits of climate change mitigation. Annu. Rev. Environ. Resour. 39, 549–582. doi:10.1146/annurev-environ-031312-125456
Vogl, A. L., Goldstein, J. H., Daily, G. C., Vira, B., Bremer, L., Mcdonald, R. I., et al. (2017). Mainstreaming investments in watershed services to enhance water security: barriers and opportunities. Environ. Sci. Policy 75, 19–27. doi:10.1016/j.envsci.2017.05.007
Walsh, K. J., Mcbride, J. L., Klotzbach, P. J., Balachandran, S., Camargo, S. J., Holland, G., et al. (2016). Tropical cyclones and climate change. Wiley Interdiscip. Rev. Clim. Change 7, 65–89. doi:10.1002/wcc.371
Wasko, C., Westra, S., Nathan, R., Orr, H. G., Villarini, G., Villalobos Herrera, R., et al. (2021). Incorporating climate change in flood estimation guidance. Philosophical Trans. R. Soc. A 379, 20190548. doi:10.1098/rsta.2019.0548
Keywords: climate adaptation, climate mitigation, nature-based solutions (NBS), nature’s benefits to people, natural climate solutions (NCS)
Citation: McDonald RI, Chaplin-Kramer R, Mulligan M, Kropf CM, Hülsen S, Welker P, Poor E, Erbaugh JT and Masuda YJ (2024) Win-wins or trade-offs? Site and strategy determine carbon and local ecosystem service benefits for protection, restoration, and agroforestry. Front. Environ. Sci. 12:1432654. doi: 10.3389/fenvs.2024.1432654
Received: 14 May 2024; Accepted: 26 July 2024;
Published: 08 August 2024.
Edited by:
Andrea Ghermandi, University of Haifa, IsraelReviewed by:
Ariana Sutton-Grier, University of Maryland, College Park, United StatesFrancesco Orsi, Wageningen University and Research, Netherlands
Copyright © 2024 McDonald, Chaplin-Kramer, Mulligan, Kropf, Hülsen, Welker, Poor, Erbaugh and Masuda. This is an open-access article distributed under the terms of the Creative Commons Attribution License (CC BY). The use, distribution or reproduction in other forums is permitted, provided the original author(s) and the copyright owner(s) are credited and that the original publication in this journal is cited, in accordance with accepted academic practice. No use, distribution or reproduction is permitted which does not comply with these terms.
*Correspondence: Robert I. McDonald, cm9iX21jZG9uYWxkQHRuYy5vcmc=