
95% of researchers rate our articles as excellent or good
Learn more about the work of our research integrity team to safeguard the quality of each article we publish.
Find out more
ORIGINAL RESEARCH article
Front. Environ. Sci. , 12 September 2024
Sec. Land Use Dynamics
Volume 12 - 2024 | https://doi.org/10.3389/fenvs.2024.1431645
 Bwalya Mutale1
 Neel Chaminda Withanage2,3
 Prabuddh Kumar Mishra4*
 Jingwei Shen3
 Kamal Abdelrahman5
 Mohammed S. Fnais5
Reliable information plays a pivotal role in sustainable urban planning. With advancements in computer technology, geoinformatics tools enable accurate identification of land use and land cover (LULC) in both spatial and temporal dimensions. Given the need for precise information to enhance decision-making, it is imperative to assess the performance and reliability of classification algorithms in detecting LULC changes. While research on the application of machine learning algorithms in LULC evaluation is widespread in many countries, it remains limited in Zambia and Sri Lanka. Hence, we aimed to assess the reliability and performance of support vector machine (SVM), random forest (RF), and artificial neural network (ANN) algorithms for detecting changes in land use and land cover taking Lusaka and Colombo City as the study area from 1995 to 2023 using Landsat Thematic Mapper (TM), and Operational Land Imager (OLI). The results reveal that the RF and ANN models exhibited superior performance, both achieving Mean Overall Accuracy (MOA) of 96% for Colombo and 96% and 94% for Lusaka, respectively. Meanwhile, the SVM model yielded Overall Accuracy (OA) ranging between 77% and 94% for the years 1995 and 2023. Further, RF algorithm notably produced slightly higher OA and kappa coefficients, ranging between 0.92 and 0.97, when compared to both the ANN and SVM models, across both study areas. A predominant land use change was observed as the expansion of vegetation by 11,990 ha (60.4%), primarily through the conversion of 1,926 ha of bare lands into vegetation in Lusaka during 1995–2005. However, a noteworthy shift was observed as built-up areas experienced significant growth from 2005 to 2023, with a total increase of 25,110 ha (71%). However, despite the conversion of vegetation to built-up areas during the entire period from 1995 to 2023, there was still a net gain of over 11,000 ha (53.4%) in vegetation cover. In case of Colombo, built-up areas expanded by 1,779 ha (81.5%), while vegetation land decreased by 1,519 ha (62.3%) during concerned period. LULC simulation also indicated a 160-ha expansion of built-up areas during the 2023–2035 period in Lusaka. Likewise, Colombo saw a rise in built-up areas by 337 ha within the same period. Overall, the RF algorithm outperformed the ANN and SVM algorithms. Additionally, the prediction and simulation results indicate an upward trend in built-up areas in both scenarios. The resultant land cover maps provide a crucial baseline that will be invaluable for urban planning and policy development agencies in both countries.
Geoinformatics is now widely used as a reliable and effective decision-making tool in various fields (Jayasinghe and Withanage, 2020; Withanage et al., 2024; Withanage et al., 2024; Wijesinghe et al., 2023; Wimalasena and Withanage, 2022; Withanage et al., 2023). Urban landscapes are dynamic, continually evolving in response to a myriad of socio-economic, environmental, and anthropogenic factors. Understanding the spatio-temporal patterns of land use and land cover changes in rapidly growing cities is critical for informed urban planning and sustainable development (Yuh et al., 2023; Withanage and Jingwei, 2024). The rise in urbanization is increasingly conspicuous across many nations, particularly in mega cities and swiftly advancing regions, leading to a host of socioeconomic and environmental issues. In 1950, a quarter of the global population resided in urban areas, whereas presently, half of the world's population calls urban regions their home (Withanage et al., 2023; Withanage et al., 2024). To effectively track these transformations, it is essential to generate dependable and precise land use and land cover (LULC) maps and predict future land use. These maps offer crucial data necessary for the formulation of policies, conservation strategies, and urban development plans, as well as for monitoring deforestation and agricultural activities (Wijesinghe and Withanage, 2021; Withanage et al., 2024; Noi and Kappas, 2017).
Recent advancements in remote sensing and machine learning (ML) techniques have significantly enhanced the accuracy and efficiency of land use and land cover (LULC) classification and monitoring. Studies in Egypt have demonstrated the effectiveness of various ML algorithms, such as Support Vector Machines (SVMs), Decision Trees (DTs), Random Forests (RFs), and Artificial Neural Networks (ANNs), in utilizing multi-spectral satellite imagery for precise LULC mapping (Mahmoud et al., 2023). In India, comparative reviews of machine learning classifiers for LULC monitoring have highlighted that the Random Forest algorithm frequently achieves superior accuracy compared to other classifiers (Talukdar et al., 2021). These studies collectively emphasize the robust application of ML algorithms in diverse geographic contexts, driving forward the capabilities of LULC analysis and fostering sustainable land management practices.
Remote sensing satellite images are regarded as crucial data sources for LULC mapping owing to their wide geographical coverage at a cost-effective rate, coupled with their ability to provide invaluable information about the Earth’s surface. LULC maps are typically generated using classification approaches based on remote sensing imagery (Yuh et al., 2023). According to Navin and Agilandeeswari (2020) the outcome of LULC mapping results is influenced not only by the suitability of the imagery but also by the careful selection of the classification methods. Choosing the optimal classification algorithm presents a challenge due to variations in accuracy across diverse environmental conditions, satellite data sources, spatial resolutions, and other factors (Chowdhury, 2023).
Several image classification techniques across different categories have been widely employed in the classification of satellite images. Parametric classifiers such as maximum likelihood (MaxL), minimum distance, linear discriminant, and Bayesian classifiers are among the most commonly utilized methods. Machine learning (ML) classifiers encompass support vector machines, random forest, and k-nearest neighbor algorithms. Additionally, deep learning algorithms, including artificial neural networks and convolutional neural networks, are prominent in satellite image classification (Chowdhury, 2023; Ge et al., 2020). Machine learning models have been extensively applied in diverse geospatial contexts, such as: (1) hydrology (Lee et al., 2023); (2) urban growth (Shafahahd et al., 2022); (3) land-use classification (Lu and Weng, 2007); (4) land-use forecasting (Lukas et al., 2023); (5) remote sensing applications (Li et al., 2014).
ML models have been utilized to generate land probability maps, which can be incorporated into dynamic models to enhance overall simulation capabilities. Various studies have endeavored to identify the optimal classification algorithm for LULC studies by evaluating the performance of these classifiers either against each other or against alternative classification methods (Khatami et al., 2016). However, the findings from these studies diverge considerably. For instance, Noi and Kappas (2017) observed that SVM yielded the highest accuracy, followed by RF and kNN, a conclusion consistent with (Adam et al., 2014). Conversely, Chowdhury (2023), in a comparison of RF, SVM, ANN, and (MaxL), determined that ANN was the most accurate and reliable model for urban LULC classification. Many urban LULC and modeling studies in developing countries, often constrained by coarse satellite imagery, have predominantly relied on single methods, leading to increased classification uncertainties compared to the utilization of ML techniques. Notable examples include the works of (Ahmad et al., 2023; Lukas et al., 2023; Kavian. et al., 2016; Simwanda et al., 2021; Senanayake et al., 2013). In contrast, a comprehensive ML study by (Yuh et al., 2023; Kavian. et al., 2016; Vapnik, 1998) in Cameroon found that RF outperformed other models, followed by kNN, SVM, and ANN, respectively, albeit limited to a specific region.
In this study, our primary objective is to leverage Machine Learning (ML) techniques, employing three classification algorithms (Support Vector Machine - SVM, Artificial Neural Network - ANN, and Random Forest - RF), to effectively classify, quantify changes, model, and simulate urban LULC dynamics in two developing nation cities, Lusaka, Zambia, and Colombo, Sri Lanka, Spanning the temporal scale from 1995 to 2023 using Landsat TM/ETM+ and Landsat 8 OLI imagery. To the best of our knowledge no research was published that compared and evaluated the performance of the above ML algorithms for Zambia and Sri-Lanka. Additionally, we endeavor to conduct a novel comparative analysis of urban expansion between these two cities. Our study aims to assess the classification performance of these algorithms within the unique environmental contexts of Lusaka and Colombo, discern the spatio-temporal patterns of LULC changes in both cities and simulate future LULC changes up to 2035. By undertaking this comprehensive analysis, we endeavor to deepen our insight into the most appropriate machine-learning techniques for distinct geographic regions and medium-resolution imagery.
This paper is organized into five sections. Section one focused on providing a comprehensive overview of the research background, rationale, and literature review. Following that, Section two detailed the study’s geographical scope, materials, and methodology. The third Section presented the findings derived from three distinct algorithms, accompanied by maps, tables, and figures. The discussion Section delved into the limitations of the study, proposed directions for future research, and discussed the policy implications of LULC change detection and comparison of three machine learning algorithms. Finally, the conclusion was presented in the last section.
(a) The city of Lusaka (Figure 1), situated in Zambia’s Lusaka Province, spans an area of 418 km2, located between latitudes 15°17′56″ to 15°32′04″ South and longitudes 28°12′07″ to 28°29′19″ East. It serves as the pivotal political, cultural, and economic hub of Zambia, housing the central government and hosting a concentration of institutional, commercial, and industrial activities. Since Zambia gained independence in 1964, Lusaka has undergone rapid urbanization, evolving into a metropolitan center. Its population has surged from 0.12 million in 1963 to 2.2 million in 2022, with an annual growth rate of 2.0 according to the Zambia Statistical Agency, 2022. The urban landscape of Lusaka is characterized by a mosaic of planned and unplanned residential areas, alongside commercial, industrial, and institutional zones. This swift urban expansion has placed significant strain on land management and the provision of social services, necessitating careful consideration for sustainable urban development in future planning endeavors.
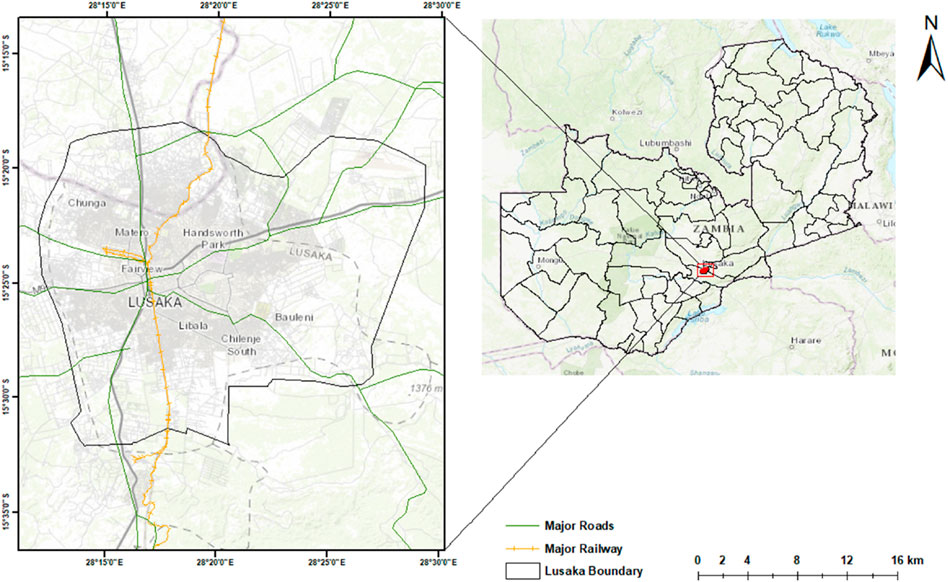
Figure 1. Location of study area. Lusaka.
(b) Colombo, the bustling commercial hub of Sri Lanka, rests on the western coast of the island nation, spanning an area of approximately 37 km2 between latitudes 6°55’ – 6°59′ North and longitudes 79°50’ – 79°53′ East (Figure 2). The heart of the city, Colombo Fort, serves as the central business district (CBD) and houses major transportation hubs, including the primary railway station and central bus terminal. The rapid urbanization of Colombo has led to its extensive expansion. Through contemporary urban development initiatives and strategic planning projects, Colombo has evolved into one of the most densely populated urban centers in South Asia, boasting a resident population of 637,865 as of 2017, according to Senanayake et al., 2013. This accelerated urban growth has come at the expense of diminishing vegetation cover, as green spaces give way to the construction of buildings, roads, parking lots, pavements, and other infrastructure. Recognizing the national significance of Colombo’s urban landscape, it becomes imperative to gain a comprehensive understanding of its growth and expansion for effective planning and sustainable development initiatives.
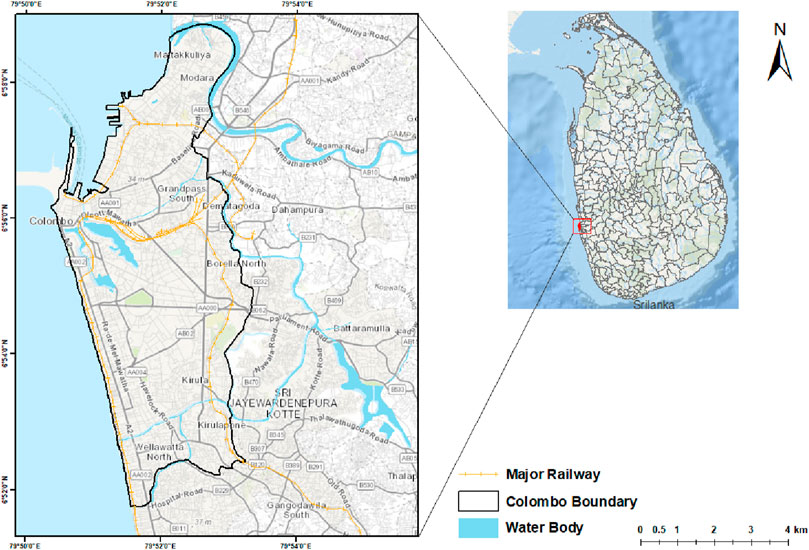
Figure 2. Location of study area. Colombo.
(c) Climate and Vegetation: Lusaka, Zambia: Lusaka has a subtropical highland climate with distinct wet and dry seasons. The wet season runs from November to March, characterized by heavy rainfall and lush vegetation. Common vegetation types include miombo woodland, sa-vanna grasslands, and various agricultural crops.
Colombo, Sri Lanka: Colombo experiences a tropical monsoon climate, with consistent temperatures year-round and two main monsoon seasons. The city is characterized by tropical wet evergreen forests, mangroves, and extensive urban vegetation.
Landsat imagery was acquired online via the Google Earth Engine (GEE) platform (accessed on 1 March 2024). A total of eight Landsat Thematic Mapper (TM) and Operational Land Imager (OLI) Thermal Infrared Sensor (TIRS) images, each with a resolution of 30 m × 30 m, covering the areas of Lusaka and Colombo across various years including 1995, 2005, 2015, and 2023, were procured. The specific date ranges for the acquisition of these images were selected to avoid the rainy season and minimize atmospheric interference, ensuring optimal image quality: Colombo, Sri Lanka: 1 December (previous year) - 31 March; and Lusaka, Zambia: 1 May–31 October. Specifically, Landsat 5 images were utilized for 1995 and 2005, while Landsat 8 images were employed for 2015 and 2023. The Landsat-8 Surface Reflectance (SR), Top of Atmosphere (TOA), and OLI datasets are geometrically, atmospherically, and radiometrically corrected.
Only Cloud masking was performed by using the ‘pixel_qa’ band to eliminate cloud interference. Subsequent image preprocessing, including boundary filtering, date selection, median compositing, and clipping, was conducted within the GEE platform. Ultimately, cloud-free Landsat images spanning from 1995 to 2023 were prepared for classification purposes.
For additional verification and comparison of the findings, we incorporated two LULC datasets for the years 2005 and 2015: the Moderate Resolution Imaging Spectroradiometer (MODIS) Global Land Cover products (Friedl and Sulla-Menashe, 2019) produced by NASA, are mapped at a 500 m pixel resolution; and the global land cover and land use change datasets derived from the Landsat archive (Potapov et al., 2021) with 30 m pixel resolution.
The study utilized all the raw bands available from the Landsat TM and OLI sensors, specifically bands 1-7 for Landsat 5 TM and bands 1–11 for Landsat 8 OLI, ensuring a comprehensive analysis of the spectral information. To assess the performance of the selected machine learning algorithms, several steps were undertaken, including image preprocessing, classification, selection of training datasets, and validation (Figure 3). Subsequently, an accuracy assessment of each algorithm was conducted. In the final stage, LULC change detection and simulation were performed.
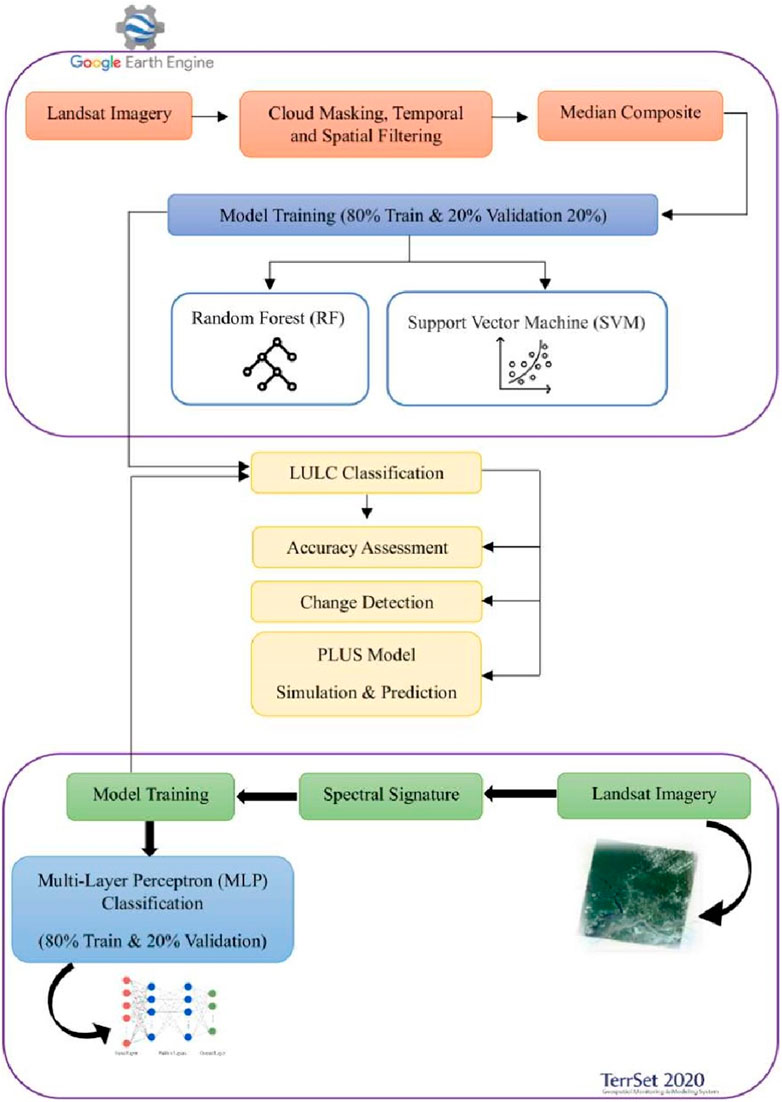
Figure 3. Methodological flowchart of the study.
To classify the atmospherically corrected surface reflectance and cloud-free images of the study areas over the specified years, we employed the random forest and Support Vector Machine (SVM) classifier algorithms within the GEE platform, as well as the Multi-layer Perceptron (MLP) algorithm in TerrSet 2020 GIS software for Artificial Neural Network (ANN) analysis. The LULC maps are produced by the 3 ML classification algorithms.
The dominant land cover types in Lusaka include water bodies, built-up areas, vegetation, and bare land, whereas Colombo is characterized by water bodies, built-up areas, and vegetation. Sample points were established for each year, with 289, 518, 413, and 619 points for Colombo, and 672, 898, 931, and 940 points for Lusaka, respectively. Approximately 80% of the sample datasets was allocated for training the classifiers, while the remaining 20% served as validation samples to ensure accuracy. Sample points, hereafter referred to as “samples,” were established for each year with the following counts (Tables 1, 2). Samples were selected using a stratified random sampling method. This method ensures that each LULC class is proportionately represented in the training and validation dataset.
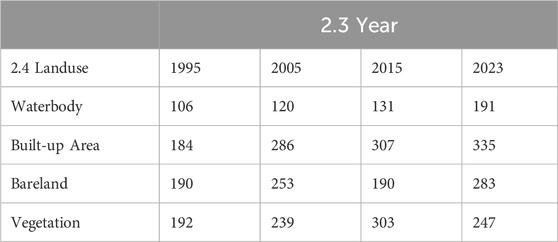
Table 1. Number of samples for Lusaka (1995, 2005, 2015, 2023).
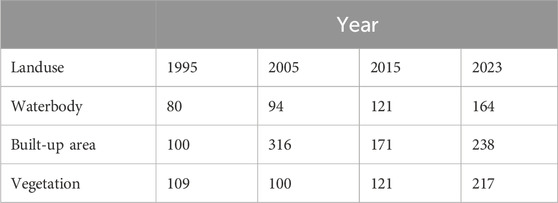
Table 2. Number of samples for Colombo (1995, 2005, 2015, 2023).
This partitioning was achieved using the functions “training.randomColumn”, “filter [ee.Filter.lessThan (“random”, 0.8)]”, and “filter [ee.Filter.greaterThanOrEquals (“random”, 0.8)]” as described by (Tassi et al., 2021).
Random Forest is an ensemble learning method that constructs multiple decision trees during training and outputs the mode of the classes (classification) or mean prediction (regression) of the individual trees. It aggregates multiple decision trees to improve classification accuracy and robustness, particularly for high-dimensional data (Avci et al., 2023).
Is a supervised machine learning algorithm that can be used for both classification and regression challenges. It works by finding the hyperplane that best divides a dataset into classes. SVM is effective in high-dimensional spaces and is particularly useful for complex but small to medium-sized datasets.
ANN is inspired by the structure and function of the human brain. It consists of interconnected groups of nodes, similar to a vast network of neurons in the brain. ANNs can learn and model complex relationships between inputs and outputs, capturing nonlinear dependencies.
To assess and validate our LULC maps produced by the (ML) models, we computed classification accuracy for each model, including Random Forest (RF), Support Vector Machine (SVM), and Artificial Neural Network (ANN). The ground-truth data were validated using high-resolution Google Earth imagery available within the Google Earth Engine (GEE) platform. These accuracy were then compared using both test and validation datasets, facilitated by the “classifiedTest.errorMatrix ()” function. Four widely used accuracy metrics were computed: Overall Accuracy (OA), Producer’s Accuracy (PA), User’s Accuracy (UA), and Kappa Coefficients. OA represents the overall percentage of correctly classified LULC classes, calculated by dividing the number of accurately classified land cover pixels by the total number of pixels in the datasets using below Equation 1 (Yuh et al., 2023; Olofsson et al., 2014; Mutale and Qiang, 2024; Withanage et al., 2024; Congalton, 1991).
Where, OA is overall accuracy; N is total samples number; n is total categories number; and Pii is correct classifications number of ith sample in confusion matrix.
PA measures the percentage accuracy of individual LULC classes within a map, determined by dividing the number of correctly classified pixels in a specific land cover class by the total number of pixels belonging to that class in the reference data. Misclassified pixels within this metric are known as errors of omission and was calculated using as below Equation 2.
Where, nii is correctly classified number pixel in each category; ni+ is correctly classified total number pixels in that category (column total).
UA evaluates the reliability of a given land cover map concerning its agreement with ground observations. It is calculated by dividing the number of correctly classified pixels in a specific land cover class by the total number of pixels classified within that class. Similar to Producer’s Accuracy, misclassified pixels in this metric are referred to as errors of omission. The formula is as below Equation 3.
Where, nii is correctly classified number pixel in each category; ni+ is correctly classified total number pixels in that category (row total).
The Kappa Coefficient Equation 4 indicates the level of agreement between test and validation data in a generated land cover map. It is based on the probability of the test data closely matching the validation data during the land cover mapping process and is highly correlated with overall accuracy.
where, po = total accuracy and pe is random accuracy.
These metrics demonstrate the alignment between the LULC outcomes and the real LULC on the respective sites, as viewed from various angles (Lu et al., 2022; Hu et al., 2013).
The accuracy assessment of LULC classification was conducted utilizing error matrices. During this assessment, four distinct categories were considered: waterbody, built-up area, bare land, and vegetation for Lusaka, and waterbody, built-up area, and vegetation for Colombo. Waterbody delineates open water surfaces, while built-up area encompasses constructed and human-inhabited regions. Forested and crop areas represent the heterogeneous vegetation class, with bare land indicating areas devoid of significant vegetation. The LULC classes were established based on the CORINE classification system (Table 3).
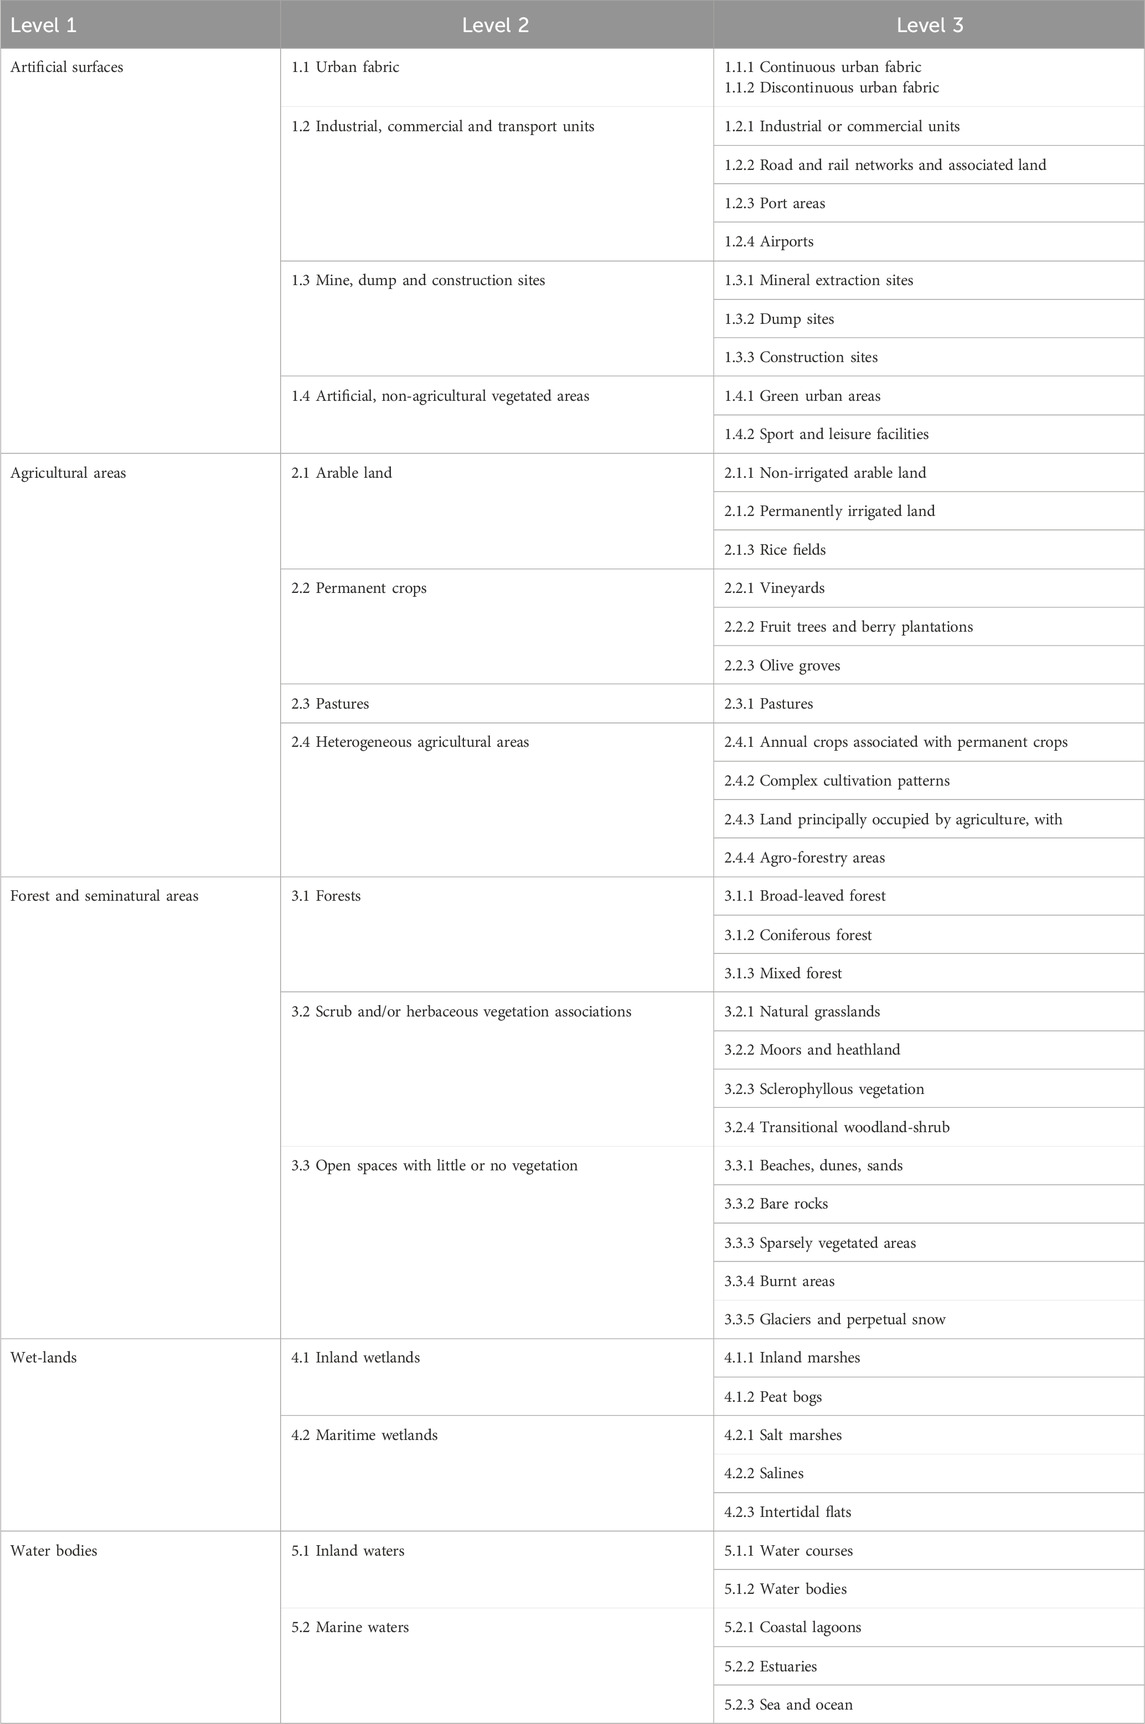
Table 3. CORINE classification system (European Environment Agency).
Land cover change detection primarily revolves around four key aspects, as outlined by (Zhou et al., 2008): (1) detecting the occurrence of change, (2) determining the nature of the change, and (3) quantifying the spatial extent of the change. In our study, we conducted change detection analysis using ArcGIS 10.7.1 and Microsoft Excel, which are widely adopted tools for this purpose. This analysis involves commonly utilized techniques such as image differencing and image ratioing. Image differencing and ratioing methods compare images obtained on different dates by assessing the disparity or proportion of digital number values within the images. These techniques serve to effectively identify and characterize land cover changes over time.
The LULC maps derived from RF, SVM, and ANN for the years 1995, 2005, 2015, and 2023 are depicted in (Figures 4, 5). Various metrics were computed to evaluate the accuracy of the classifications, including overall accuracy (OA), kappa coefficient (K), producer’s accuracy (PA), and user’s accuracy (UA), as detailed in (Supplementary Tables A1–A8). In general, all three-machine learning (ML) models exhibited commendable performance in generating LULC classifications across the study years (1995, 2005, 2015, and 2023), achieving Overall Accuracy (OA) scores exceeding 85%. Particularly, the RF and ANN models demonstrated superior performance, both achieving Mean overall Accuracy (MOA) of 96% for Colombo and 96% and 93% for Lusaka respectively from 1995 to 2023 (Table 4, 5). These models surpassed the SVM model, which yielded OAs ranging between 86% and 88% throughout the study period in both Cities.
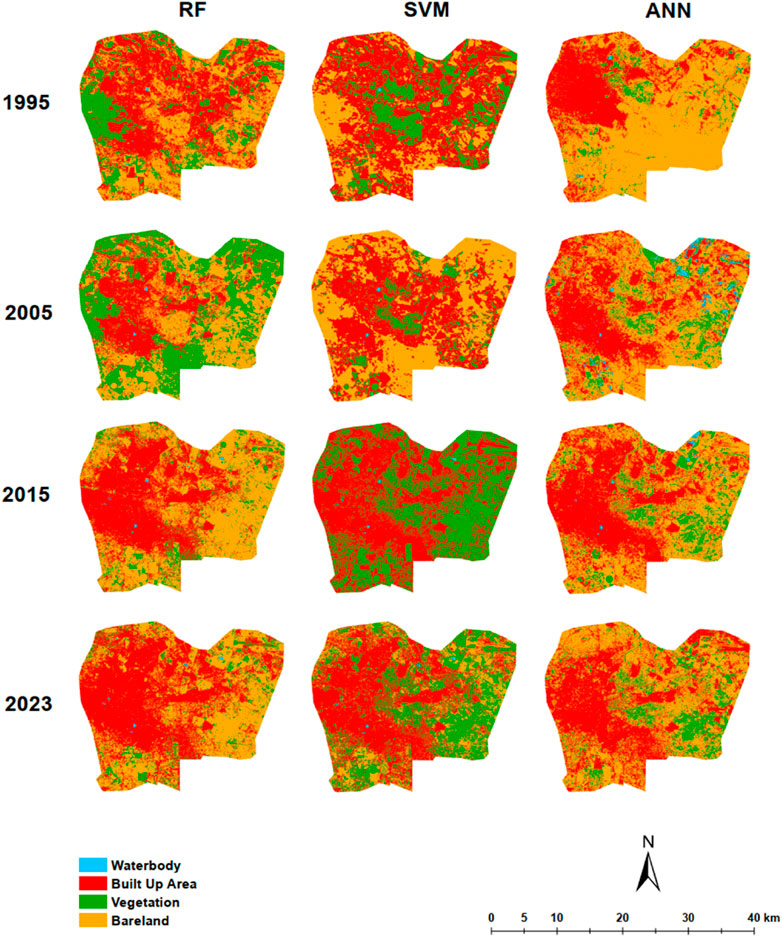
Figure 4. Lusaka RF, SVM, ANN classification 1995, 2005 2015 and 2023.
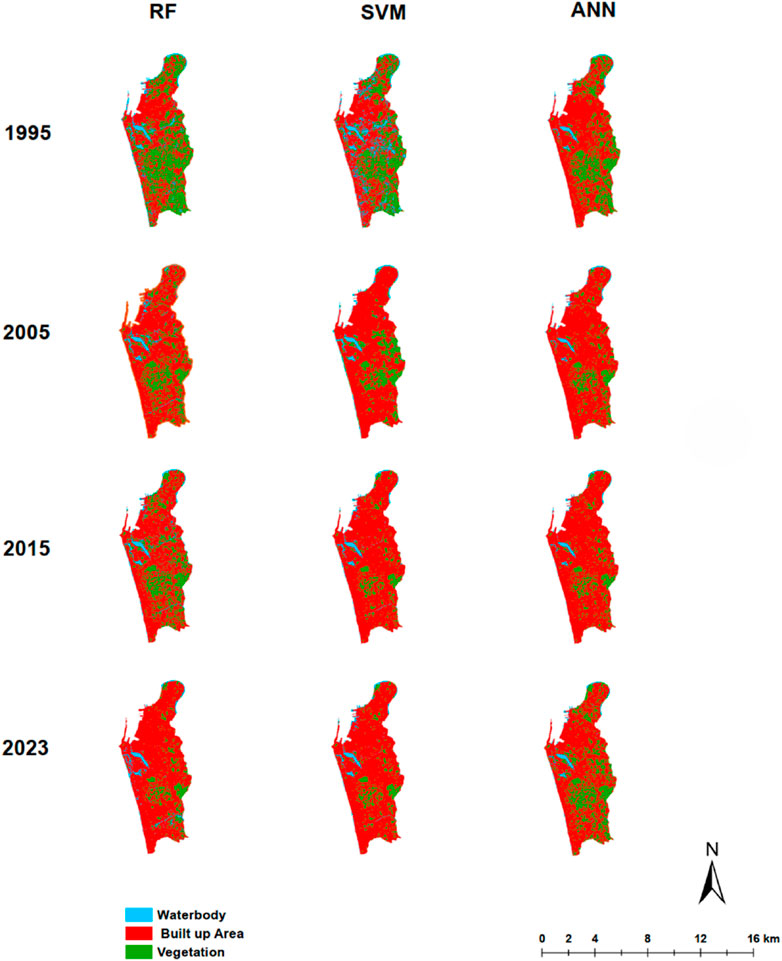
Figure 5. Colombo RF, SVM, ANN classification 1995,2005, 2015 and 2023.
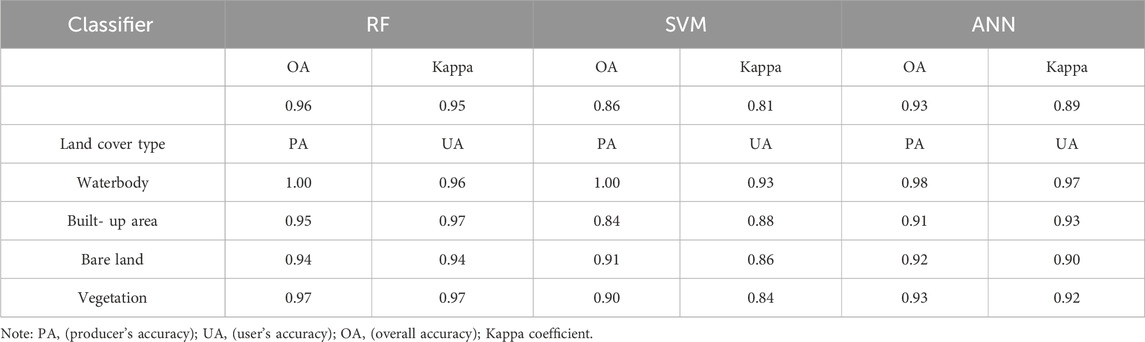
Table 4. Overall mean accuracy, Lusaka (1995, 2005, 2015, 2023).
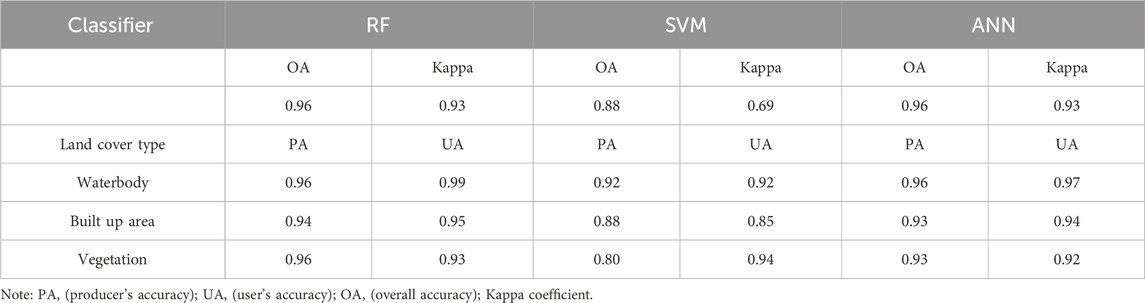
Table 5. Overall mean accuracy, Colombo (1995, 2005, 2015, 2023).
The RF algorithm notably yielded slightly higher overall accuracy and exhibited superior kappa coefficients (ranging between 0.92 and 0.97) compared to both ANN and SVM models, across both study areas. Consequently, the RF-derived LULC maps from all study years were selected for further processing and analysis due to their consistently robust performance.
In the ANN model in Lusaka, there were slight misclassifications observed between vegetation areas and barelands. But, these misclassifications are considered negligible.
However, in the SVM model, there was considerable misclassification detected between vegetation and bare lands. Further evaluation of the performance of each machine learning algorithm revealed varying levels of spatial consistency for each LULC class in both Cities. To confirm the accuracy of the LULC from RF, ANN, and SVM models, a cross-check was performed using the results of 2015 along with Landsat 8 OLI band composite image of the year 2015 (Figure 6). In both cities, the classification of built-up areas, and water bodies was nearly accurate across all three algorithms (a1-a3, d1-d3, e1-e3,g1-g3). In Lusaka, the vegetation class is detected similarly by the RF and SVM algorithms (d1, d3). However, when identifying vegetation, the ANN displays inconsistency, as some vegetation areas are classified as bare land in Lusaka (b2, d2). In identifying bare lands in Lusaka city, both ANN and SVM show some weakness, as they incorrectly identify bare lands as vegetation or built-up areas (c2, c3). Highlighting the weakness in LULC detection of the SVM algorithm compared to RF and ANN for 2015, SVM did not identify any LULC class as bare lands in Lusaka. The SVM algorithm has displayed misleading detection compared to RF and ANN of built-up areas in Colombo city as well, as it classified some vegetation areas as the built-up class (f3).
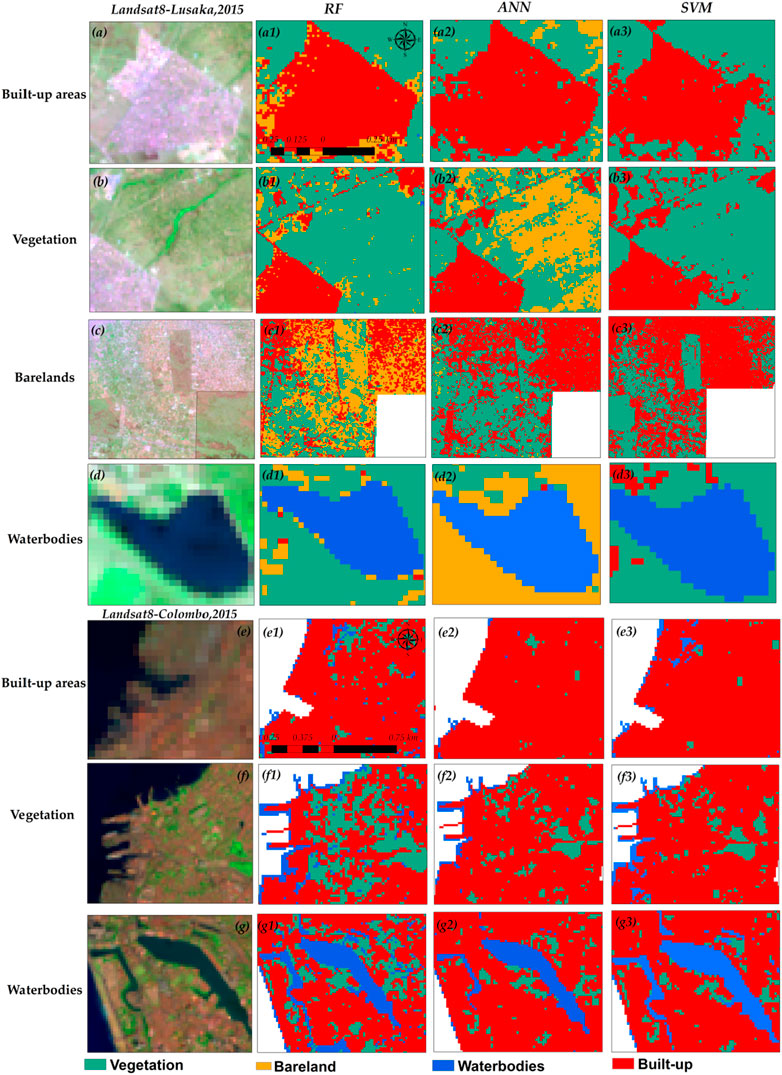
Figure 6. LULC class derived by RF, ANN, SVM in Lusaka, and Colombo City, 2015. (A–D) Landsat8, Lusaka. (E–G) Landsat8, Colombo. (a1, b1, c1) rf, lusaka. (a2, b2, c2) ann, lusaka. (c3, d3, e3) svm, lusaka. (e1, f1, g1) rf, colombo. (e2, f2, g2) ann,colombo. (e3, f3, g3) SVM,Colombo.
Supplementary Figure A1 illustrates the changes in LULC in Lusaka from 1995 to 2005. To elucidate these findings, thematic maps were produced to illustrate the gains and losses within four identified LULC categories: waterbody, built-up area, bare land, and vegetation. Notably, the predominant change observed during this period was the expansion of vegetation, particularly in cropland areas. A substantial gain of 11990.43 ha in vegetation area occurred over the decade, accompanied by the conversion of 1926.75 ha of bare land into vegetation. However, the transition was not unidirectional.
In the years spanning 2005 to 2015, a noteworthy shift was observed where built-up areas experienced significant growth, as indicated in Supplementary Figure A2. This expansion escalated notably between 2015 and 2023, with a total increase of 25110.15 ha in built-up areas (Supplementary Figure A3). Analysis reveals that a considerable portion of this conversion stemmed from the vegetation class, accounting for over 7067.72 ha, and an additional 2,710 ha from bare lands. Figure 7 depicts hotspot maps showcasing the changes in two LULC classes over the period of 1995–2023: built-up areas and vegetation in both Cities. As inferred from the derived results (Figures 7A, B), the areas where vegetation has been lost are predominantly taken over by built-up areas in Colombo over time.
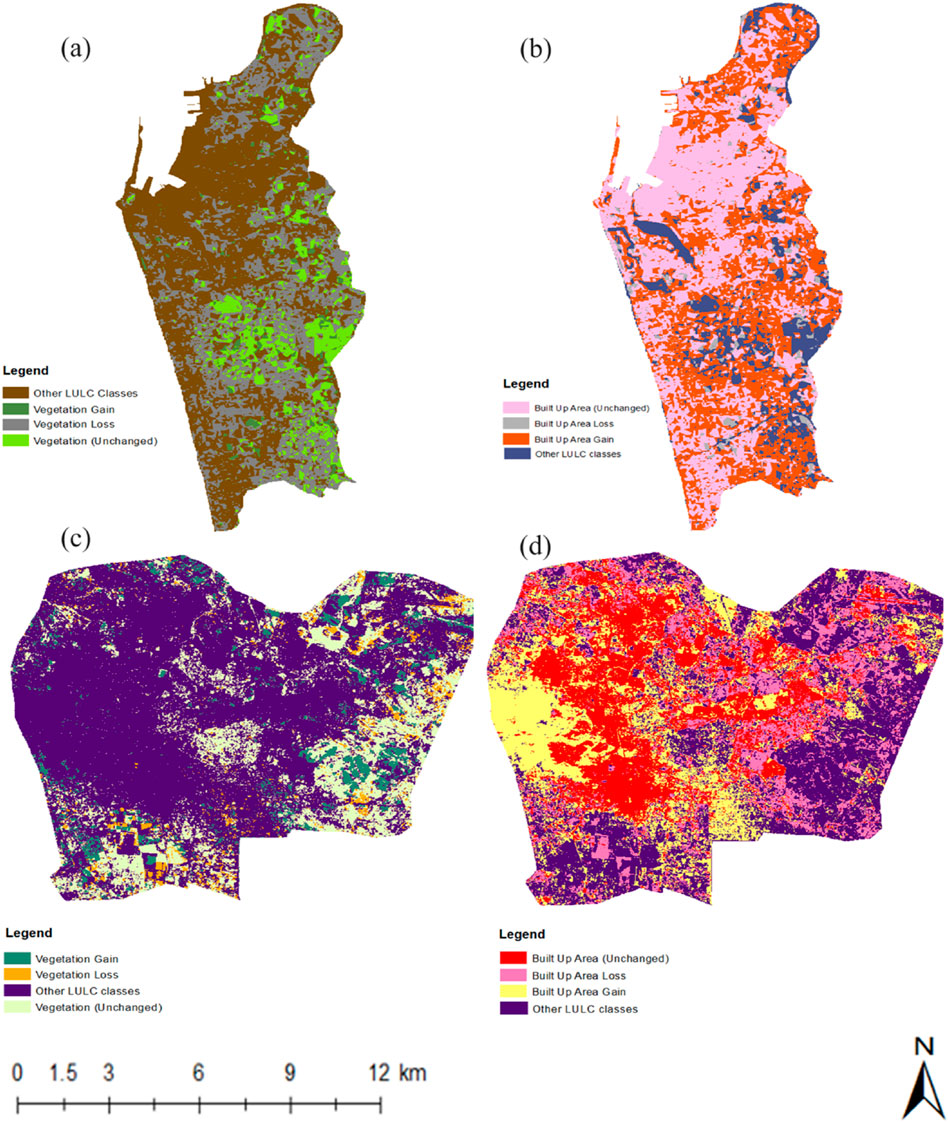
Figure 7. Hotspots maps showing gain and loss of vegetation and built-up areas (A, B) Colombo (C, D) Lusaka.
Identifying vegetation gains during this period in Colombo proves challenging based on this hotspot map. By 2023, the majority of dispersed vegetation areas in the eastern part of Colombo city have vanished due to the rapid urbanization during the concerned period. However, in some locations, lost built-up areas have been replaced by forest or vegetation. This could be attributed to urban greening policies implemented by planning authorities. The analysis of land cover changes in Colombo highlights a significant expansion in the built-up area category (Figure 8).
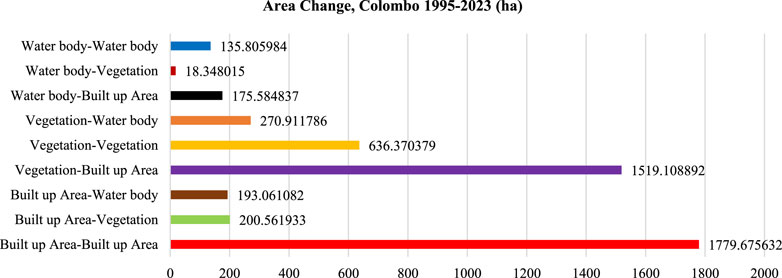
Figure 8. LULC area change, Colombo (1995–2023).
Specifically, in 1995, the built-up area covered 2181.4 ha, gradually increasing to 3086.2 ha by 2005, indicating a notable growth of 41.5% over the span of a decade (Supplementary Figure A4). Further examination, as illustrated in Supplementary Figure A5, reveals that between 1995 and 2023, urban built-up areas expanded by approximately 1,779 ha, while vegetation land decreased by 1,519 ha, experiencing only minimal gains of 636 ha. Notably, the most substantial increase in built-up areas, amounting to about 2,555 ha, occurred in 2023, particularly notable between 2015 and 2023 (Supplementary Figure A6). Concurrently, vegetation underwent a significant decline, diminishing by approximately 53.5% during the same period.
Despite the conversion of vegetation to built-up areas during the entire period from 1995 to 2023, there was still a net gain of over 11,000 ha in vegetation cover in Lusaka (Figures 7C, D). The vegetation areas along the western boundary have undergone rapid conversion into built-up areas during the concerned period. Furthermore, by 2023, certain built-up areas and bare lands have been reclaimed by vegetation or forest cover. Conversely, bare land experienced the most significant reduction, dwindling from 12988.37 ha to 7002.62 ha, reflecting a net loss of 5,986 ha (Figure 9). The bulk of this loss was attributed to its conversion into built-up areas, underscoring the dynamic nature of land cover transformations over the concerned period in Lusaka.
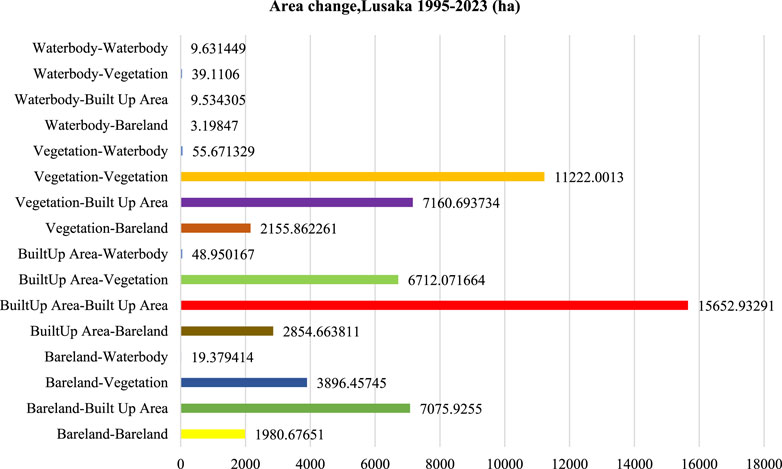
Figure 9. LULC area change, Lusaka (1995–2023).
Between 2023 and 2035, a notable trend emerged in the change of Land Use and Land Cover (LULC) types, particularly in built-up areas, mirroring patterns observed in preceding decades as shown in Figure 10. Specifically, the built-up class expanded by 160 ha during the 2023–2035 period in Lusaka, while experiencing a corresponding loss of 60 ha in vegetation cover. Similarly, Colombo witnessed a reduction in vegetation coverage from 863 ha to 526 ha within the same period. Notably, water bodies remained unaffected by the simulation, as they were designated as conversion constraints in both Lusaka and Colombo.
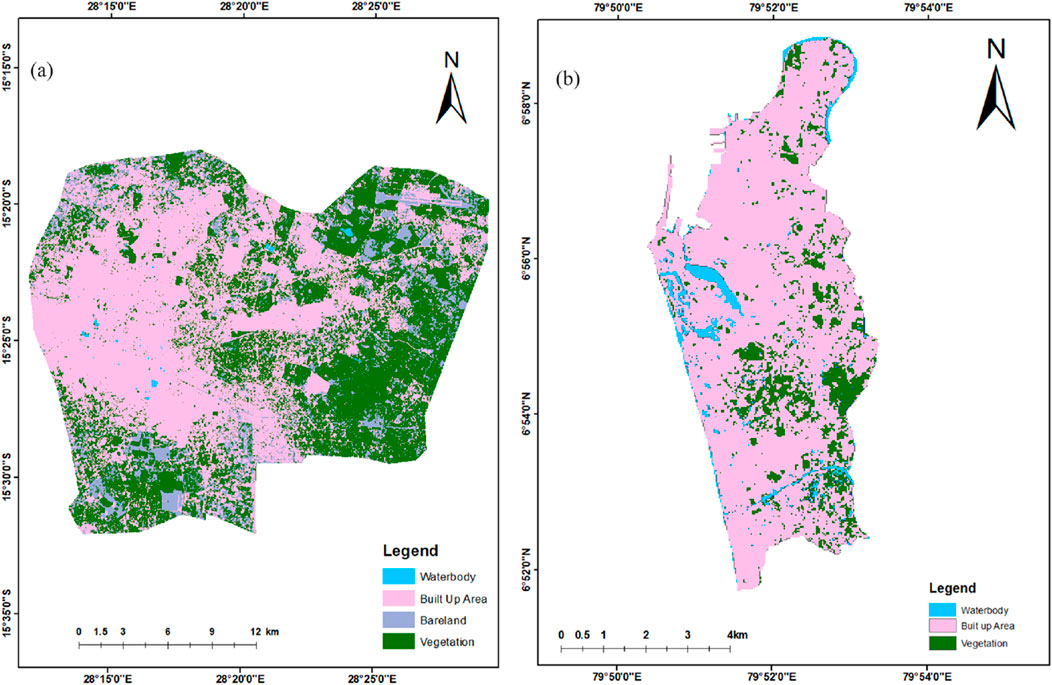
Figure 10. LULC 2035 simulated map. (A) Lusaka. (B) Colombo.
In this study we tried to evaluate the performance of 3 ML algorithms for detecting the LULC changes in two cities: Lusaka; and Colombo from 1995 to 2023. A recent study has demonstrated that performance-based evaluation of LULC changes using various machine learning algorithms is notably deficient, particularly in the African context (Pacheco and Hewitt, 2014). Moreover, the majority of researchers have relied on Maximum Likelihood Classification (MLC) algorithms for their studies (Yuh et al., 2019; Ghosh and Joshi, 2014). However, a similar study conducted by Yuh et al. (2019) in Cameroon involved the comparison of four machine learning algorithms: SVM, ANN, RF, and k-nearest neighbor (KNN). They discovered that among these, RF outperformed all other algorithms (Yuh et al., 2023). Their results showcased that all machine learning algorithms produced high accuracy (>80%), with the RF model achieving an accuracy of >90% consistent with our findings. Due to the lack of freely available high-resolution satellite data and limited financial resources for satellite-based land evaluation in Zambia and Sri Lanka, reliance is placed on freely available Landsat data. Hence, it is crucial to uphold the high accuracy and reliability of LULC change detection methods using Landsat data, as many critical decisions and related actions rely on the outputs generated from these methods.
The visual comparison reveals a significant spatial consistency between our results (Figure 11) and MODIS and Global LULC products published by Friedl and Sulla-Menashe, (2019), as well as Potapov et al. (2021). For Colombo’s built-up areas, the identification of water bodies remains consistent across the two products: RF and Global LULC (a-d2). While the Global LULC products identified the vegetation class to a small extent (a1,b1), the MODIS products did not identify vegetation areas for both years (a2,b2). In Lusaka, the identification of all four classes remains consistent for both years, albeit showing minor differences in some areas (c-d2). In their study, Yuh et al. (2023) identified relatively strong correlations between their datasets and those from Potapov et al. (2021), with R-squared values of 0.8 (p < 0.05) for the year 2020 and 0.7 (p < 0.05) for the year 2000 for built-up areas. They also observed strong correlations between extracted water bodies with an impressive accuracy level, of a 99% correlation with the 2020 MODIS data, as evidenced by an R-squared value of 0.99 (p < 0.05). For instance, our identification of built-up areas exhibited a robust correlation with built-up areas extracted from Potapov et al. (2021). Additionally, we observed a high level of spatial consistency between our built-up areas and vegetation classifications and those derived from the 2020 MODIS global land cover datasets. Also, the identification of water bodies showed a high level of consistency across all three products for both years. However, when identifying bare lands, some inconsistencies were noted between our products and those from other sources, particularly for Lusaka City. However, the RF model findings of Lusaka are comparatively consistent with other similar research conducted in tropical Africa and Asia (Li et al., 2014; Khatami et al., 2016; Simwanda et al., 2021). Simwanda and Murayama (2017) reported that the overall accuracy values and kappa statistics achieved from their object-based, and, pixel-based ULU classification approach in Lusaka city were sufficiently high, exceeding 80%. In the case of Colombo, one of the studies by Subasinghe et al. (2019) indicates that the Colombo metropolitan area underwent rapid urban expansion, with a 288% increase in the total urban footprint from 1992 to 2014. The annual urban expansion intensity was particularly pronounced during the 2000s, reaching 1.45%. Indeed, this information corroborates the evidence supporting the rapid expansion of built-up areas in Colombo city.
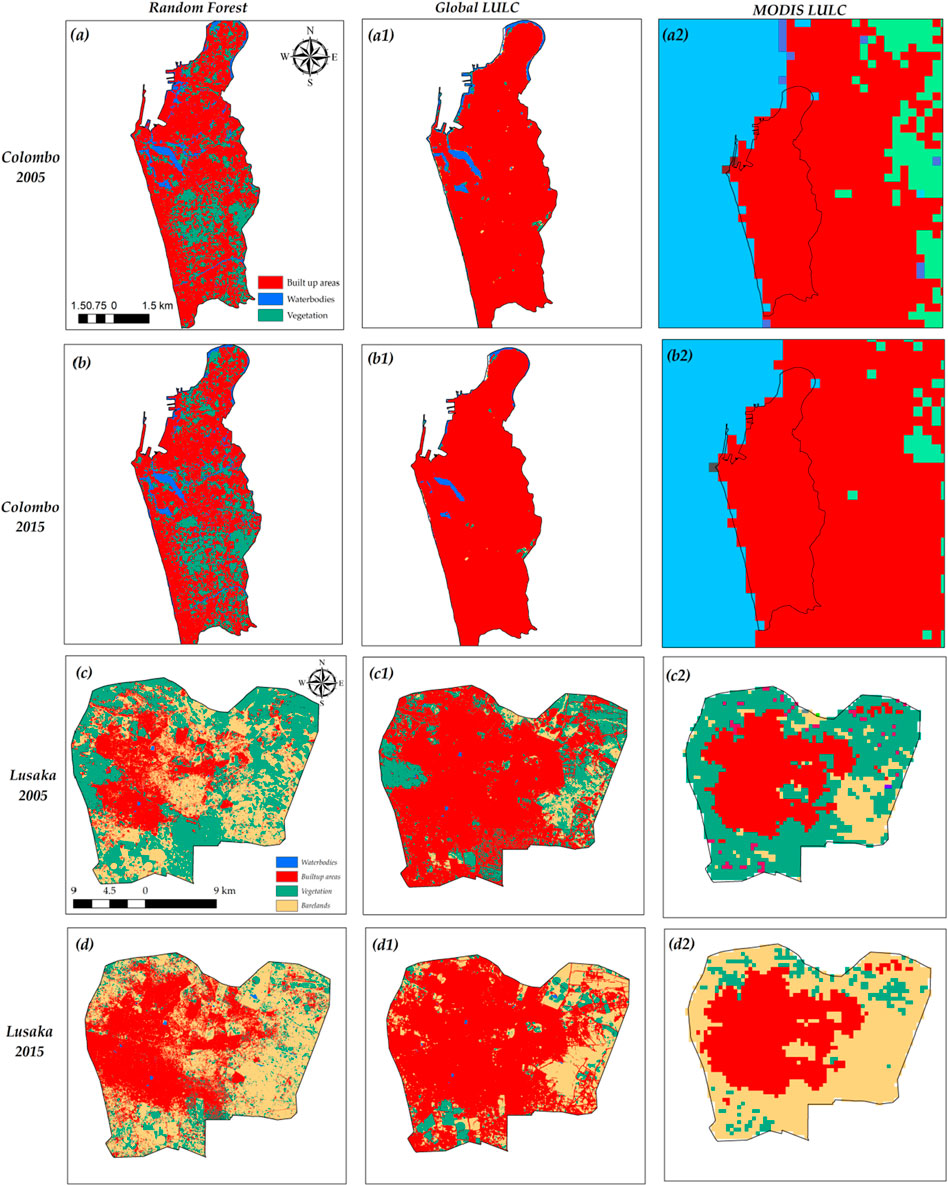
Figure 11. LULC maps of RF, Global LULC, and MODIS, 2005,2015 (A, B) RF for Colombo. (a1, b1) global lulc for colombo. (a2, b2) modis for colombo (C, D) rf for lusaka. (c1, d1) global lulc for lusaka. (c2, d2) MODIS for Lusaka.
Our findings suggest that these machine learning models (RF, SVM, ANN) are comparatively robust approaches that hold the potential for detecting LULC changes in urban areas in tropical countries in Africa and South Asia. The results further revealed that the RF model consistently outperformed the other two models for each year of study, achieving over 95% accuracy compared to between 88% and 94% accuracy generated for the SVM and ANN, respectively. Thus, the RF model emerges as the most suitable approach for land use and land cover mapping in other studies with a similar spatial context. Indeed, studies of Pouteaua et al. (2011), and Heydari and Mountrakis (2018) have demonstrated that KNN outperformed RF, ANN, and SVM, contrary to our findings.
Our findings underscore a rapid outward expansion of urban areas from Colombo city, posing several challenges for sustainable urban planning, including environmental issues, traffic congestion, loss of agricultural lands, biodiversity loss, and the urban heat islands effect as highlighted by previous research (Senanayake et al., 2013; Subasinghe et al., 2021; Ranagalage et al., 2017). Hence, urban planners should prioritize these concerns during the planning, design, and implementation stages, as highlighted by Subasinghe et al. (2021). This approach can help mitigate land use conflicts among stakeholders and maintain ecological balance in Colombo city. As an immediate strategy, it is recommended to increase green cover on highly congested impervious surfaces, particularly along main roads.
Policymakers must tackle the challenges posed by the improper expansion of settlements in Lusaka, primarily driven by slums and urban poverty, unemployment issues as emphasized by Siwanda et al. (2017). Therefore, it is imperative to establish appropriate urban zones, taking into account the significant expansion of built-up areas outward from the city center, as indicated by our LULC simulations for 2035.
Despite the significant urbanization observed throughout the entire Western Province, Sri Lanka accompanied by diverse social and environmental issues over the last 2 decades, which necessitate reliable LULC identification for future urban planning prospects, we restricted our study to the Colombo urban area due to time and resource constraints. Also, we did not account for the limitations stemming from potential nonlinearities that may arise from ecosystem dynamics in the tropical region. Future research should incorporate models such as Convergent Cross Mapping or Optimal Information Flow to address these nonlinearities, as recommended by Yuh et al. (2023) and Li and Convertino (2021). Another limitation of the RF model is the complexity of the decision-making and feature input process. The presence of noise in datasets is another limitation that affected the classification accuracy of SVM. Implementing advanced noise reduction techniques and exploring additional distinguishing features for LULC classes could improve the accuracy of SVM. Additionally, the similarity in DN values across different LULC classes can reduce the accuracy of the SVM model (Chowdhury, 2023). However, this issue is unavoidable as some LULC classes (water, bare lands) are inherently smaller compared to others. It is recommended to develop specific methodologies, potentially through weighted classification techniques, to address this challenge. Additionally, future research could explore the use of object-based ULU parcels to segregate ULU, aiming to mitigate spatial heterogeneity issues in densely populated cities (Heydari and Mountrakis, 2018; Subasinghe et al., 2021). But upon commendable nature of cities the researchers should prioritize developing and applying object-based approaches to improve the precision of LULC classifications in the future. While the class categories (Water Bodies, Built-up Areas, Vegetation, Bare Land) are broad, they are selected to align with commonly observed land cover types in urban environments. Future studies could benefit from more granular classification to capture finer land cover details.
The study did not incorporate independent variables such as socio-economic factors, climate data, or other environmental variables, which could enhance prediction accuracy. Therefore, future research should integrate a wider range of independent variables to provide a more comprehensive understanding of the factors influencing urbanization and LULC changes. The net gain in vegetation cover despite urbanization is intriguing but could be enhanced by a more detailed analysis of reclamation processes. Thus, conducting in-depth studies on the drivers and processes of vegetation reclamation in urban areas in the future could provide valuable insights for urban planning and sustainability efforts. To enhance the robustness of the RF model, it is recommended to expand the geographical coverage of study areas to include more rural landscapes. This approach will allow the model to be tested for accuracy across a broader range of diverse landscapes. Additionally, analyzing more frequent time intervals will be more effective and reliable for capturing subtle changes and trends in LULC.
Detecting LULC changes in cities poses greater challenges due to the high spectral mixing and spatial heterogeneity. Given the support of remote sensing techniques utilizing satellite data, it could be possible to develop various machine learning algorithms capable of detecting LULC changes with reliable outputs. Our research scrutinized and contrasted the performance of three machine learning methodologies: RF, ANN, and SVM in detecting LULC changes within two Cities, Lusaka, and Colombo, situated in the global south. The performance assessments encompassed the classification accuracy of each ML algorithm utilizing their optimal parameters. Although both the RF and ANN algorithms displayed the ability to achieve remarkably high OA, RF emerges as superior due to its slightly higher overall kappa coefficients, when compared to both the ANN and SVM. Throughout the entire period, despite the conversion of vegetation into built-up areas, Lusaka experienced a net increase in vegetation cover. During the specified period, built-up areas expanded in Colombo while vegetation land decreased. The LULC simulation suggested that both cases would experience an expansion of built-up areas. However, the rate of increase in Colombo exceeded that of Lusaka during the period from 2023 to 2035. The results of the study offer a vital foundation that will prove invaluable for urban planning and policy development agencies in both countries. But,in the future researchers could benefit from integrating independent variables or exploring advanced machine-learning models to achieve more efficient and reliable results while addressing the various drawbacks mentioned in the limitations.
The original contributions presented in the study are included in the article/Supplementary Material, further inquiries can be directed to the corresponding author.
BM: Data curation, Formal Analysis, Investigation, Methodology, Software, Validation, Visualization, Writing–original draft. NW: Conceptualization, Data curation, Formal Analysis, Investigation, Methodology, Software, Validation, Visualization, Writing–original draft. PM: Conceptualization, Methodology, Supervision, Writing–review and editing. JS: Data curation, Formal Analysis, Investigation, Methodology, Validation, Writing–review and editing. KA: Formal Analysis, Funding acquisition, Project administration, Supervision, Writing–review and editing. MF: Funding acquisition, Project administration, Software, Supervision, Writing–review and editing.
The author(s) declare that financial support was received for the research, authorship, and/or publication of this article. The APC was funded by the Researchers Supporting Project (RSP2024R249), King Saud University, Riyadh, Saudi Arabia.
The authors would like to extend their gratitude to the reviewers and editors for their invaluable feedback, which significantly improved the quality of the manuscript. Additionally, we express our appreciation to the U.S. Geological Survey (USGS), NASA, and The University of Maryland for providing open-source Landsat, MODIS and Global LULC datasets crucial for the study.
The authors declare that the research was conducted in the absence of any commercial or financial relationships that could be construed as a potential conflict of interest.
All claims expressed in this article are solely those of the authors and do not necessarily represent those of their affiliated organizations, or those of the publisher, the editors and the reviewers. Any product that may be evaluated in this article, or claim that may be made by its manufacturer, is not guaranteed or endorsed by the publisher.
The Supplementary Material for this article can be found online at: https://www.frontiersin.org/articles/10.3389/fenvs.2024.1431645/full#supplementary-material
Adam, E., Mutanga, O., Odindi, J., and Abdel-Rahman, E. M. (2014). Land-use/cover classification in a heterogeneous coastal landscape using RapidEye imagery: evaluating the performance of random forest and support vector machines classifiers. Int. J. Remote Sens. 35 (10), 3440–3458. doi:10.1080/01431161.2014.903435
Ahmad, M. N., Shao, Z., Javed, A., Islam, F., Ahmad, H. H., and Aslam, R. W. (2023). The cellular automata approach in dynamic modelling of land use change detection and future simulations based on remote sensing data in lahore Pakistan. Photogramm. Eng. Remote Sens. 89 (1), 47–55. doi:10.14358/PERS.22-00102R2
Avci, C., Budak, M., Yaguran, N., and Balcik, F. (2023). Comparison between random forest and support vector machine algorithms for LULC classification. Inte. J. Eng. Geosci. 8 (1), 1–10. doi:10.26833/ijeg.987605
Chowdhury, M. S. (2023). Comparison of accuracy and reliability of random forest, support vector machine, artificial neural network and maximum likelihood method in land use/cover classification of urban setting. Envir. Chall. 14, 100800. doi:10.1016/j.envc.2023.100800
Congalton, R. G. (1991). A review of assessing the accuracy of classifications of remotely sensed data. Remote Sens. Enviro. 37, 35–46. doi:10.1016/0034-4257(91)90048-b
Friedl, M., and Sulla-Menashe, D. (2019). “MCD12Q1 MODIS/Terra+Aqua land cover type yearly L3 Global 500m SIN Grid V006 [Data set],” in NASA EOSDIS land processes DAAC. doi:10.5067/MODIS/MCD12Q1.006
Ge, G., Shi, Z., Zhu, Y., Yang, X., and Hao, Y. (2020). Land use/cover classification in an arid desert-oasis mosaic land-scape of China using remote sensed imagery: performance assessment of four machine learning algorithms. Glob. Ecol. Conserv. 22, e00971. doi:10.1016/j.gecco.2020.e00971
Ghosh, A., and Joshi, P. K. (2014). A comparison of selected classification algorithms for mapping bamboo patches in lower Gangetic plains using very high resolution WorldView 2 imagery. Int. J. Appl. Earth Obs. Geoinfo. 26, 298–311. doi:10.1016/j.jag.2013.08.011
Heydari, S. S., and Mountrakis, G. (2018). Effect of classifier selection, reference sample size reference class distribution and scene heterogeneity in per-pixel classification accuracy using 26 Landsat sites. Rem. Sens. Environ. 204, 648–658. doi:10.1016/j.rse.2017.09.035
Hu, Y., Zheng, Y., and Zheng, X. (2013). Simulation of land-use scenarios for Beijing using CLUE-S and Markov composite models. China Geogr. Sci. 23 (1), 92–100. doi:10.1007/s11769-013-0594-9
Jayasinghe, A. D. S., and Withanage, W. K. N. C. (2020). Geographical information system-based multi-criteria decision analysis of potato cultivation land suitability in Welimada divisional secretariat, Sri Lanka. Potato J. 47 (2), 126–134.
Kavianet al. (2016). Forecasting of land use changes based on land change modeler (LCM) using remote sensing: a Case Study of Talar Watershed, Mazandaran Province, Northern Iran. Advan. Biorese. 8 (1). doi:10.15515/abr.0976-4585.14
Khatami, R., Mountrakis, G., and Stehman, S. V. (2016). A meta-analysis of remote sensing research on supervised pixel-based land-cover image classification processes: general guidelines for practitioners and future research. Remote Sens. Environ. 177, 89–100. doi:10.1016/j.rse.2016.02.028
Lee, J. M., Ko, K. S., and Yoo, K. (2023). A machine learning-based approach to predict groundwater nitrate susceptibility using field measurements and hydrogeological variables in the Nonsan Stream Watershed, South Korea. Appl. Water Sci. 13 (12), 242. doi:10.1007/s13201-023-02043-9
Li, J., and Convertino, M. (2021). Inferring ecosystem networks as information flows. Sci. Rep. 11, 7094. doi:10.1038/s41598-021-86476-9
Li, M., Zang, S., Zhang, B., Li, S., and Wu, C. (2014). A review of remote sensing image classification techniques: the role of Spatio-contextual information. Eur. J. Remote Sens. 47 (1), 389–411. doi:10.5721/EuJRS20144723
Lu, C., Qi, X., Zheng, Z., and Jia, K. (2022). PLUS-model based multi-scenario land space simulation of the lower yellow river region and its ecological effects. Sustainability 14 (11), 6942. doi:10.3390/su14116942
Lu, D., and Weng, Q. (2007). A survey of image classification methods and techniques for improving classification performance. Int. J. Remote Sens. 28 (5), 823–870. doi:10.1080/01431160600746456
Lukas, P., Melesse, A. M., and Kenea, T. T. (2023). Prediction of future land use/land cover changes using a coupled CA-ANN model in the upper omo–gibe river basin, Ethiopia. Remote Sens. 15 (4), 1148. doi:10.3390/rs15041148
Mahmoud, R., Hassanin, M., Al Feel, H., and Badry, R. M. (2023). Machine learning-based land use and land cover mapping using multi-spectral satellite imagery: A case study in Egypt. Sustainability. 15 (9467), 1–21. doi:10.3390/su15129467
Mutale, B., and Qiang, F. (2024). Modeling future land use and land cover under different scenarios using patch-generating land use simulation model. A case study of Ndola district. Front. Environ. Sci. 12. doi:10.3389/fenvs.2024.1362666
Navin, M. S., and Agilandeeswari, L. (2020). Comprehensive review on land use/land cover change classification in remote sensing. J. Spe. Im 9, 1–21. doi:10.1255/jsi.2020.a8
Noi, T. P., and Kappas, M. (2017). Comparison of random forest, k-nearest neighbor, and support vector machine classifiers for land cover classification using sentinel-2 imagery. Sensors 18 (1), 18. doi:10.3390/s18010018
Olofsson, P., Foody, G. M., Herold, M., Stehman, S. V., Woodcock, C. E., and Wulder, M. A. (2014). Good practices for estimating area and assessing accuracy of land change. Remote Sens. Environ. 148, 42–57. doi:10.1016/j.rse.2014.02.015
Pacheco, J. D., and Hewitt, R. J. (2014). Modelado del cambio de usos del suelo urbano a trav_es de Redes Neuronales Artificiales. Comparaci_on con dos aplicaciones de software. GeoFocus 14 (1).
Potapov, P., Hansen, M. C., Pickens, A., Hernandez-Serna, A., Tyukavina, A., Turubanova, S., et al. (2021). The global 2000-2020 land cover and land use change dataset derived from the Landsat archive: first results. Front. Remote Sens. 3, 856903. doi:10.3389/frsen.2022.856903
Pouteaua, R., Collinb, A., and Stolla, B. A. (2011). “Comparison of machine learning algorithms for classification of tropical ecosystems observed by multiple sensors at multiple scales,” in International geoscience and remote sensing symposium (Vancouver, BC, Canada).
Ranagalage, M. R., Estoque, C., and Murayama, Y. (2017). An urban heat island study of the Colombo metropolitan area, Sri Lanka, based on Landsat data (1997–2017). ISPRS Int. J. Geo-Info. 6 (7), 189–217. doi:10.3390/ijgi6070189
Senanayake, I. P., Welivitiya, W. D. D. P., and Nadeeka, P. M. (2013). Remote sensing based analysis of urban heat islands with vegetation cover in Colombo city, Sri Lanka using Landsat-7 ETM+ data. Urban Clim. 5, 19–35. doi:10.1016/j.uclim.2013.07.004
Shafahahd, , et al. (2022). Prediction of land use changes at a metropolitan city using integrated cellular automata: past and future. Geol. Eco. Landsc. doi:10.1080/24749508.2022.2132010
Simwanda, M., and Murayama, Y. (2017). Integrating geospatial techniques for urban land use classification in the developing sub-saharan african city of lusaka, Zambia. ISPRS Int. J. Geo-Info. 6 (4), 102. doi:10.3390/ijgi6040102
Simwanda, M., Murayama, Y., Phiri, D., Nyirenda, V. R., and Ranagalage, M. (2021). Simulating scenarios of future intraurban land-use expansion based on the neural network–markov model: a case study of lusaka, Zambia. Remote Sens. 13 (5), 942–1025. doi:10.3390/rs13050942
Subasinghe, S., Wang, R., Simwanda, M., Murayama, Y., and Vitanova, L. L. (2021). Neighborhood dynamics of urban expansion based on morphological spatial pattern analysis and geospatial techniques: a case study of the Colombo metropolitan area, Sri Lanka. Asian Geo 39 (2), 155–175. doi:10.1080/10225706.2021.1903519
Tassi, A., Gigante, D., Modica, G., Di Martino, L., and Vizzari, M. (2021). Pixel-vs. Object-based Landsat 8 data classification in google earth engine using random forest: the case study of Maiella National Park. Remote Sens. 13 (12), 2299. doi:10.3390/rs13122299
Talukdar, S., Uddin, K., Akhter, S., Ziaul, S., Reza, A., Islam, T., et al. (2021). Modeling fragmentation probability of land-use and land-cover using the bagging, random forest, and random subspace in the teesta river basin, Bangladesh. Ecologi. Indica. 126. doi:10.1016/j.ecolind.2021.107612
Wijesinghe, D. C., Mishra, P. K., Withanage, N. C., Abdelrahman, K., Mishra, V., Tripathi, S., et al. (2023). Application of GIS, multi-criteria decision-making techniques for mapping groundwater potential zones: a case study of thalawa division, Sri Lanka. Water 15 (19), 3462. doi:10.3390/w15193462
Wijesinghe, W. M. D. C., and Withanage, W. K. N. C. (2021). Detection of the changes in land use and land cover using remote sensing and GIS in Thalawa DS Division. Prathimana J. 14, 72–86.
Wimalasena, K. H. M. D. P., and Withanage, W. K. N. C. (2022). A GIS-based spatial variations analysis of water quality in domestic wells in the buttala area, Sri Lanka. J. Soc. Sci. Huma. Revi. 6 (3), 155–169. doi:10.4038/jsshr.v6i3.64
Withanage, N. C., and Jingwei, S. (2024). Evaluating the spatial-temporal dynamics of urbanization in prefecture cities of China using SNPP-viirs nighttime light remote sensing data. Gazi Univ. J. Sci. Part A Eng. Innov. 11 (2), 346–371. doi:10.54287/gujsa.1466745
Withanage, N. C., Mishra, P. K., Abdelrahman, K., and Singh, R. (2024). Monitoring deforestation, forest health, and environmental criticality in a protected area periphery using Geospatial Techniques. PeerJ 12 (e17714), e17714–e17726. doi:10.7717/peerj.17714
Withanage, N. C., Shi, K., and Shen, J. (2023). Extracting and evaluating urban entities in China from 2000 to2020 based on SNPP-VIIRS-like data. Remote Sens. 15, 4632. doi:10.3390/rs15184632
Withanage, N. C., Wijesinghe, D. C., Mishra, P. K., Abdelrahman, K., Mishra, V., and Fnais, M. S. (2024). An ecotourism suitability index for a world heritage city using GIS-multi criteria decision analysis techniques, Sri Lanka. Heliyon 10, 1–16.
Withanage, W. K. N. C., Gunathilaka, M. D. K. L., Mishra, P. K., Wijesinghe, W. M. D. C., and Tripathi, S. (2023). Indexing habitat suitability and human-elephant conflicts using GIS-MCDA in a human-dominated landscape. Geo. Sust. 4 (4), 343–355. doi:10.1016/j.geosus.2023.08.004
Withanage, W. K. N. C., Mishra, P. K., and Jayasinghe, B. C. (2024). An assessment of spatio-temporal land use/land cover dynamics using Landsat time series data (2008-2022) in kuliyapitiya west divisional secretariat division in kurunagala district, Sri Lanka. J. Geospatial Sur. 4 (1), 12–23. doi:10.4038/jgs.v4i1.52
Yuh, Y. G., Dongmo, Z. N., N’Goran, P. K., Ekodeck, H., Mengamenya, A., Kuehl, H., et al. (2019). Effects of land cover change on great apes distribution at the lobeke national park and its surrounding forest management units, South-East Cameroon. A 13-year time series analysis. Sci. Rep. 9, 1445. doi:10.1038/s41598-018-36225-2
Yuh, Y. G. W., Tracz, H., Matthews, D., and Turner, S. E. (2023). Application of machine learning approaches for land cover monitoring in northern Cameroon. Ecol. Inf. 74, 101955. doi:10.1016/j.ecoinf.2022.101955
Keywords: artificial neural network, Colombo, land use/land cover, Lusaka, random forest, support vector machine
Citation: Mutale B, Withanage NC, Mishra PK, Shen J, Abdelrahman K and Fnais MS (2024) A performance evaluation of random forest, artificial neural network, and support vector machine learning algorithms to predict spatio-temporal land use-land cover dynamics: a case from lusaka and colombo. Front. Environ. Sci. 12:1431645. doi: 10.3389/fenvs.2024.1431645
Received: 12 May 2024; Accepted: 27 August 2024;
Published: 12 September 2024.
Edited by:
Merja H. Tölle, University of Kassel, GermanyReviewed by:
Clinton Nkolokosa, Malawi-Liverpool-Wellcome Trust Clinical Research Programme, MalawiCopyright © 2024 Mutale, Withanage, Mishra, Shen, Abdelrahman and Fnais. This is an open-access article distributed under the terms of the Creative Commons Attribution License (CC BY). The use, distribution or reproduction in other forums is permitted, provided the original author(s) and the copyright owner(s) are credited and that the original publication in this journal is cited, in accordance with accepted academic practice. No use, distribution or reproduction is permitted which does not comply with these terms.
*Correspondence: Prabuddh Kumar Mishra, cHJhYnVkZGhAc2hpdmFqaS5kdS5hYy5pbg==
Disclaimer: All claims expressed in this article are solely those of the authors and do not necessarily represent those of their affiliated organizations, or those of the publisher, the editors and the reviewers. Any product that may be evaluated in this article or claim that may be made by its manufacturer is not guaranteed or endorsed by the publisher.
Research integrity at Frontiers
Learn more about the work of our research integrity team to safeguard the quality of each article we publish.