 Alice H. Howie1*
 Vera Rullens1
 Anita Thomas1,2Stella Kondylas1Sophie K. Russell3
 Simon E. Reeves1,4Judith M. Ament5Miguel Castro6Sharie Detmar7
- 1The Nature Conservancy Australia, Carlton, VIC, Australia
- 2College Sciences and Engineering, Flinders University of South Australia, Adelaide, SA, Australia
- 3School of Biological Sciences and Environment Institute, University of Adelaide, Adelaide, SA, Australia
- 4National Centre for Coasts and Climate, University of Melbourne, Melbourne, VIC, Australia
- 5The Nature Conservancy, Arlington, VA, United States
- 6The Nature Conservancy, Quito, Ecuador
- 7Coast and Marine Branch, Department for Environment and Water, Adelaide, SA, Australia
Introduction: The emergence of voluntary carbon markets is creating new opportunities to sustainably finance Natural Climate Solution (NCS) projects. In Australia, the federal government recently enacted the Tidal Restoration of Blue Carbon Ecosystems Methodology Determination 2022 (Tidal Reconnection Method), whereby restoration activities that reintroduce tidal flows to allow the re-establishment of coastal wetland (blue carbon) ecosystems, through the removal or modification of a tidal restriction, can be used to gain and sell Australian carbon credit units. Australia has the highest net blue carbon wealth in the world, with 5%–11% of global carbon stocks, yet there is currently a lack of large-scale feasibility assessments and supporting methodologies to identify and prioritise sites with the greatest potential for NCS project implementation to help inform investment decisions.
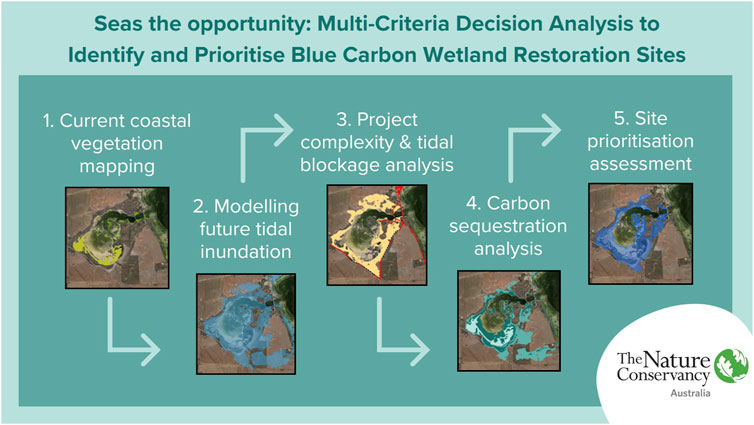
Methods: In this study, we applied a spatial Multi-Criteria Decision Analysis (MCDA) to identify, map, and prioritise potential sites for blue carbon coastal wetland restoration in South Australia that meet criteria outlined in the Tidal Reconnection Method. This study compared information on 1) predicted flooding extent following tidal reconnection and under sea level rise (SLR; present-day, 2050 and 2,100); 2) project implementation complexity (e.g. who possesses land tenure); and 3) carbon sequestration potential through predicted area of vegetation change under the above SLR scenarios.
Results: Our results identified 64 sites of interest, of which 32 received an overall “high” prioritisation score of 3 or more out of 5. This equates to approximately 21,114 ha of high priority potential blue carbon restoration sites.
Discussion: The MCDA enables development of a portfolio of viable restoration projects through a rapid “desktop” prioritisation of sites of interest, which can then guide investment in further detailed cost/benefit feasibility assessments. This study demonstrates an adaptable MCDA approach to map potential NCS projects at meaningful spatial scales and in-line with carbon market-based opportunities.
1 Introduction
Achieving the critical goal of stabilising Earth’s climate to limit temperature increase to 1.5°C, as outlined in the Paris Agreement, demands a substantial acceleration in our efforts to reduce greenhouse gas (GHG) emissions (Anderson et al., 2019; Shukla et al., 2022). It is evident that a comprehensive approach, incorporating nature, energy and industry solutions, is imperative to effectively curtail emissions and ensure the stabilisation of global warming well below the 1.5°C target (Anderson et al., 2019; Griscom et al., 2019). This imperative has brought into focus the critical role that ecosystems such as forests, wetlands, grasslands, and agricultural lands have in storing carbon, avoiding GHG emissions and providing near-term climate mitigation needs (Griscom et al., 2017; 2019). Natural Climate Solutions (NCS) offer practical means to protect, manage, and restore natural and working landscapes, seascapes and wetlands, while providing crucial climate mitigation benefits. Actions like preserving existing ecosystems, improving the management of working lands, and restoring natural ecosystems are central to NCS (Griscom et al., 2017; Cook-Patton et al., 2021). These activities, unlike emerging GHG removal technologies, are cost-effective and can be readily deployed at scale (Griscom et al., 2017; Shukla et al., 2022). Additionally, NCS bring about various co-benefits for people and the planet, such as improved air, soil, and water quality, sustained livelihoods, and biodiversity protection (Rashid et al., 2005).
Coastal wetlands are “blue carbon” ecosystems that include mangrove forests, tidal marshes, and seagrass meadows, offering significant carbon-sequestration capabilities (Lovelock and Duarte, 2019). They excel over many terrestrial forests in greenhouse gas removal rates and long-term carbon storage potential due to their unique ability to trap carbon in anoxic substrates by limiting the decomposition of soil organic matter (Duarte et al., 2013; Taillardat et al., 2018; Zou et al., 2022). Restoration of blue carbon ecosystems provides an NCS pathway that offers both climate change mitigation potential, as well as additional co-benefits such as support of fisheries and biodiversity, enhancements in water quality, climate change adaptation, and sustaining community livelihoods (Barbier et al., 2011; Macreadie et al., 2021). The benefits of coastal wetland restoration, while significant, are notably offset by other significant upfront costs (Bayraktarov et al., 2016). This is because the restoration process often entails extensive community engagement and detailed hydrological modelling and structural engineering to reinstate natural tidal flows (e.g., removal of bund walls, tidal gates or installation of road/rail culverts), to create conditions conducive to the growth of blue carbon ecosystems (Lovelock et al., 2022). Additionally, the associated costs of project implementation, monitoring, and carbon verification can be substantial (Bayraktarov et al., 2016). To address this financial challenge and encourage broader adoption of this NCS pathway, payments for ecosystem services, particularly for carbon sequestration, have potential to increase uptake of blue carbon ecosystem restoration to help offset restoration costs (Dencer-Brown et al., 2022; Lovelock et al., 2022; Williamson and Gattuso, 2022). International voluntary carbon trading schemes have successfully supported the management and restoration of coastal wetlands in various countries, such as Kenya, India, Vietnam, Madagascar and Japan (Wylie et al., 2016; Kuwae et al., 2022).
Recognising the urgent need for climate action, voluntary carbon markets have become vital tools for environmental sustainability and are growing rapidly with carbon offsetting doubling in value from 2017 to 2020 and predicted to grow by five times the 2021 value by 2030 (Seddon et al., 2021; Shell and BCG, 2023). Overall, the global market for carbon credits could be worth upward of $50 billion USD by 2030 (Blaufelder et al., 2021). These markets provide complementary measures alongside regulatory and policy-driven approaches, that enable individuals, organisations, and governments to buy and sell carbon offsets or credits from reduction, removal or avoidance of GHG emissions through investments in NCS such as blue carbon ecosystem restoration (Kuwae et al., 2022; Lovelock et al., 2022). In Australia, the government recently enacted a Tidal Restoration of Blue Carbon Ecosystems Methodology Determination 2022 (hereafter referred to as the Tidal Reconnection Method) formulated through stakeholder consultation (Kelleway et al., 2020; Lovelock et al., 2022). To be eligible for carbon credits, this methodology mandates restoration activities involving the installation of tidal gates or the removal of bund walls and other barriers that impede previous tidal flows. The associated Blue Carbon Accounting Model or “BlueCAM” (Clean Energy Regulator, 2022; Lovelock et al., 2022) provides the approved Australian framework for calculating and verifying the net carbon abatement potential, enabling private and public landowners to assess the cost-effectiveness of potential blue carbon initiatives (Lovelock et al., 2022). Using BlueCAM still requires substantial technical knowledge, time and effort, however, and is not feasible across a large portfolio of potential sites. Australia has the highest net blue carbon wealth in the world, with 5%–11% of global carbon stocks in mangroves, seagrass and tidal marshes (Serrano et al., 2019), yet substantial work remains in the development of a portfolio of eligible blue carbon projects to capitalise on this emerging market. A major gap thus remains in the identification and prioritisation of eligible sites across large landscapes to help guide further investment into finer-scale site feasibility and BlueCAM assessments.
One powerful approach for identifying suitable locations for blue carbon ecosystem restoration is the application of Multi-Criteria Decision Analysis (MCDA) (Huang et al., 2011; Thompson and Friess, 2019; Pittman et al., 2022). MCDA helps decision-makers assess various options based on multiple factors or criteria that cannot be directly compared using a common scale or unit of measurement. This analysis broadly uses rules to combine these criteria and assign ratings or rankings to the alternatives (Greene et al., 2011). Adding spatial analysis to MCDA enables not only the “what” to be assessed but also visualises the “where” (Malczewski, 1999). By incorporating MCDA into the identification and prioritisation, of potential blue carbon restoration sites (commonly known as a pre-feasibility analyses), we can pinpoint those with the greatest potential for uptake through market-based approaches. This approach improves outcomes and facilitates more effective prioritisation of investment in NCS projects across extensive spatial scales (Pittman et al., 2022).
Many studies have utilised spatially explicit data to guide decision frameworks (e.g., Higginbottom et al., 2018) and some have integrated MCDA into their methodologies (e.g., Uuemaa et al., 2018). However, few studies have employed this approach specifically in the context of blue carbon (e.g., Moritsch et al., 2021; Carnell et al., 2022; Costa M. D. et al., 2022; Costa M. D.deP. et al., 2022). The purpose of this study was to identify, map and prioritise potential blue carbon project sites that are eligible for blue carbon restoration under the Tidal Reconnection Method (Clean Energy Regulator, 2022; Lovelock et al., 2022) using a MCDA approach. We focussed on the coastal wetlands of South Australia, stretching across 5,000 km of the southern coast of Australia, which equates to approximately 9% of the country’s total coastline. Specifically, this study aimed to evaluate the large-scale opportunity of blue carbon ecosystem restoration through tidal reconnection by combining information on 1) predicted flooding extent following tidal reconnection and under sea level rise (SLR; present day, 2050 and 2,100); 2) project implementation complexity (e.g., who possesses land tenure and the number of land parcels at a site); and 3) carbon sequestration potential through predicted area of vegetation changes under SLR. We outline the approach in five steps and provide a case-study example to demonstrate the implementation of the MCDA.
The establishment of this feasibility analysis allows for rapid prioritisation of sites that require more comprehensive assessments, including detailed cost-benefit analyses, BlueCAM evaluations, and other feasibility studies. Moreover, it illustrates the versatility of a MCDA approach that can be customised to identify additional potential NCS projects at meaningful scales, aligning with opportunities in carbon markets.
2 Materials and methods
The subsequent sections describe the methodology for each component of this multi-part analysis. Figure 1 outlines these sections and additional analysis detail, and code are provided in the Supplementary Material (Supplementary Figures S1–S4) and research data repository, respectively.
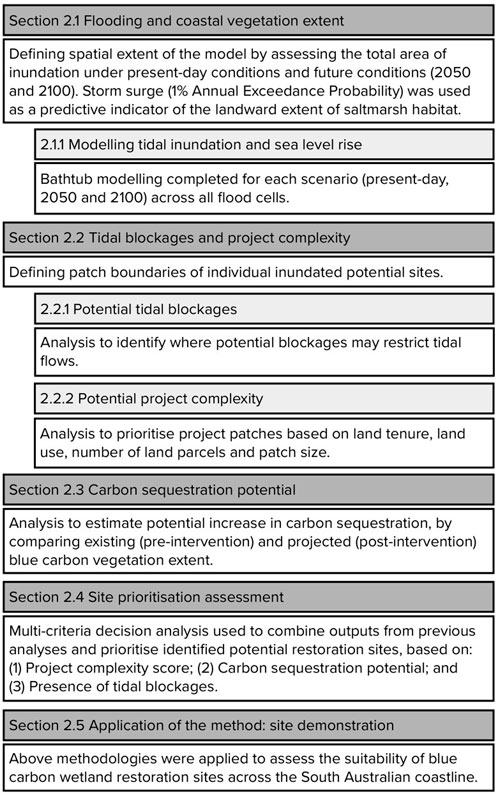
Figure 1. Outline of methods section.
2.1 Flooding and coastal vegetation extent
The first step of the feasibility analysis considers the amount of inundation in a coastal area under present-day conditions for Mean High Water Springs (MHWS) tide levels and storm surge (here: 1% Annual Exceedance Probability (AEP), or equivalent), and future conditions in 2050 and 2,100, accounting for sea level rise (SLR). MHWS tide levels were used due to the local availability of data when this analysis was conducted, use of other metrics (e.g., Highest Astronomical Tide) would not alter final results. Locations that are not subject to coastal flooding or tidal influence in present day or future conditions will not be suitable for coastal wetland restoration, and the spatial extent of analysis was restrained based on previous work completed in South Australia. This previous work revealed a consistent correlation between the current predicted 1% AEP inundation level and the current inland boundaries of saltmarsh habitat, and was carried out visually using aerial imagery across all sites with saltmarsh and mangroves present along the Eyre Peninsula coastline (Russell, 2019). This strong spatial relationship was later visually assessed and observed to hold true along the entire South Australian coast, and its validity was assumed under future SLR conditions. Leveraging this insight, the projected storm surge level for the year 2,100 (1% AEP) was employed as a predictive indicator for estimating the corresponding landward expansion of saltmarsh habitat in 2,100. The connection between saltmarsh extent and tidal inundation is well-established (Zedler et al., 2008), however the use of storm surge data for projecting future saltmarsh extent is novel and provides a rapid, straightforward approach for identifying areas that may become vegetated coastal wetlands.
2.1.1 Modelling tidal inundation and sea level rise
Tidal inundation and storm surge levels can vary spatially due to local topography and shape, and aspect of the shoreline. Therefore the South Australian coastline was broken up into “flood cells” with similar tidal and storm surge conditions (Figure 2). To identify the maximum potential extent of coastal wetlands (hereafter “maximum flooding extent layer”), areas that fall between the −0.2 m Australian Height Datum (AHD; lowest elevation of observed current mangrove vegetation) and 2100 MHWS tide level +1 m SLR +1% AEP storm surge level and wave set-up, were extracted. This was modelled using simplistic bathtub models, which assumes areas will be flooded if they lie below the inundation level and for inundation to be uniform across the area, but does not consider complex hydrodynamics or connectivity to marine waters–allowing areas of degraded wetlands currently disconnected from tidal flows to be captured in the spatial analysis (Cooper, 2003; Rotzoll and Fletcher, 2013; Yunus et al., 2016).
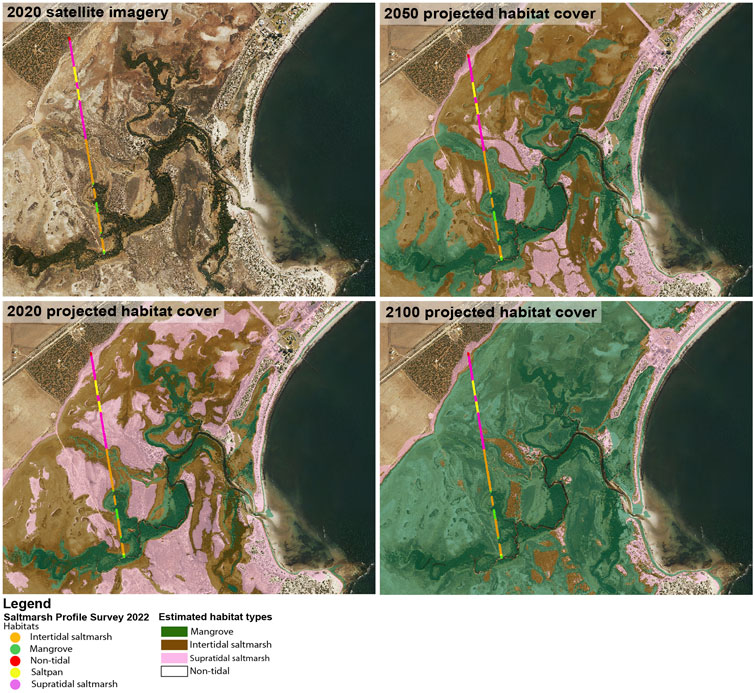
Figure 2. Saltmarsh profile survey (2022) spatially compared to reclassified ‘post intervention’ LiDAR digital elevation model for each scenario (2020, 2050 and 2100). Survey habitat readings are indicated by coloured segments along survey lines. Reclassified DEM shows elevation bands for each habitat type (mangrove, intertidal and supratidal saltmarsh and non-tidal), based on previous saltmarsh profile surveys and 30 cm of sea level rise for 2050 and 1 m of sea level rise for 2,100.
2.2 Tidal blockages and project complexity
To identify sites that could be suitable for blue carbon ecosystem restoration under the Tidal Reconnection Method, and prioritise sites that could be mobilised quickly, project complexity in individual patches of potential project sites was assessed.
This built off the maximum flooding extent dataset layer (Section 2.1.1). This layer was broken into individual inundated areas (patches) by “splitting” it, using the potential tidal blockage dataset (Section 2.2.1) to identify the sections of the landscape that had lower complexity from a project establishment perspective, e.g., habitat, land use and tenure types (Section 2.2.2), and therefore are potentially eligible for tidal reconnection. Each of these individual patches were subsequently assessed for potential project complexity.
2.2.1 Potential tidal blockages
To identify eligible blue carbon project sites that could be registered under the Tidal Reconnection Method, tidal blockages that prevent or restrict water flows to degraded or potential wetlands need to be identified. Tidal blockages can involve artificial blockages or built infrastructure, such as causeways and seawalls, as opposed to natural blockages such as sand dunes, and can be categorised in two types: “point intersections” where a road, railway, or levee bank directly intersects with a watercourse, or “linear intersections” such as stretches of road, railways, or levees that either intersect with, or sit above low-lying areas (i.e., inundated or raised linear intersections).
Point intersections between watercourses and roads, railways, or levee banks were extracted in ArcGIS Pro (version 3.1.1) at the locations where they intersect with the maximum flooding extent layer. Linear intersections were identified using a multi-step process outlined in Supplementary Figure S2. Both intersection layers were merged to generate a “potential tidal blockage” layer. Patch boundaries were defined by splitting the maximum flooding extent layer (Section 2.1.1, 2.2), by the newly created “potential tidal blockage” layer. Collectively these patches represent the maximum area of possible landward expansion of coastal wetlands, with inter-patch boundaries as (potential) tidal blockages. Modelled inundated patches landward of these possible tidal blockages were selected and labelled as having a “potential tidal blockage.” Inundated patches calculated as being less than 50 ha in size were considered too small to be feasible for project implementation and therefore were not included in the analysis (Supplementary Figure S1).
2.2.2 Potential project complexity
The complexity and suitability of blue carbon project implementation across the landscape was assessed to prioritise areas that could be mobilised quickly. Prioritisation of patches was based on the following criteria: land tenure, land use, number of land parcel holders, and size. Prioritised patches encompassed sites that: 1) are situated on government-owned land; 2) consist of land designated as natural areas or pasture lands; 3) exhibit a minimal number of intersecting cadastral parcels; and 4) cover a substantial area (>50 ha).
Large patches were prioritised (given higher weighting) to optimise the cost-benefit ratios of potential project implementation (assuming economies of scale with greater potential to generate carbon credits to offset project implementation costs), and patches with a low number of intersecting cadastral parcels were prioritised to reduce the number of landowners that a project would need approvals from to commence a blue-carbon project. Similarly, patches with a high coverage of government-owned land and land use types of natural areas or pasture lands were prioritised for simplification of project implementation.
Five categories of land tenure and nine categories of land use were present and analysed across the state (Table 1; Supplementary Table S2). For each patch, the percentage cover of each land tenure or land use category was calculated using ArcGIS Tabulate Intersection tool, percent cover for each category, and a weighted arithmetic mean (for parameter weights see Table 1) were calculated for land tenure and land use for each patch. Resulting patch values for land tenure and land use, numbers of cadastral parcels intersecting with each patch, as well as patch size in hectares, were each normalised to a common range of 0–100, with 100 indicating the more desirable state of each variable.
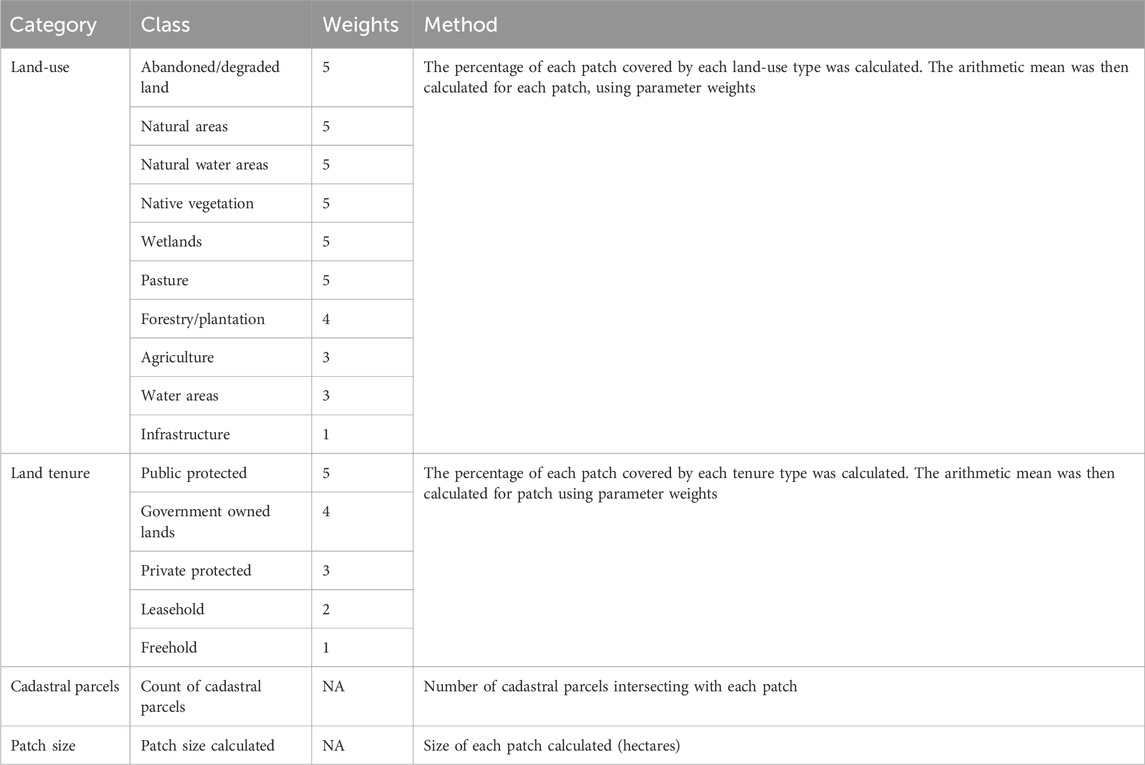
Table 1. Summary table of parameter categories, classes, weights, and method description for land-use, land tenure, cadastral parcel and size scoring structures.
Normalisation was used to create a wider range of scores to distinguish the highly suitable sites from sites with moderate or low suitability. All normalised category scores were then averaged using a weighted arithmetic mean for each patch using Equation 1, creating a single score to represent project implementation complexity. Size of the patch was given a higher weight in comparison to other parameters to optimise the cost-benefit ratio of project development.
2.3 Carbon sequestration potential
Potential increase in carbon capture and storage was estimated across all patches by comparing existing (pre-intervention) and projected (post-intervention) blue carbon vegetation extent Existing vegetation extent maps were used to obtain the current coastal wetland ecosystem extent, and relative carbon values were ascribed to each vegetation type (Table 2) based on published literature of Australian soil carbon accumulation rates (Lovelock, 2021). In cases where categories of vegetation types did not align with available data on Australian soil carbon accumulation rates, local information on carbon stocks were consulted (i.e., Russell et al., 2024) and/or expert elicitation was used to ascribe a relative carbon value. For each flood cell (i.e., section of the Australian coastline with similar tidal and storm surge conditions), a dataset of pre-intervention relative carbon values was created at 1 m resolution, using a classification of relative carbon values by vegetation type (Table 2). In this classification, the highest relative carbon values were assigned to mangroves, followed by intertidal and supratidal saltmarsh vegetation. Classifications were intentionally broad to improve processing speed across the large modelling extent (i.e., 5,000 km coastline). Given the focus on terrestrial coastal wetland restoration from tidal reconnection, potential seagrass gains/losses were not considered, nor were transitions from mangrove/marsh to subtidal or seagrass habitat as this level of detail was outside of the scope of this study.
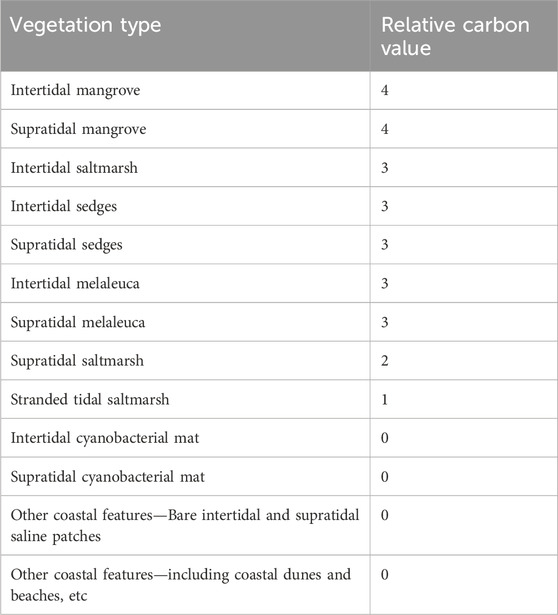
Table 2. Classification of relative carbon values per vegetation type based on Australian soil carbon accumulation rates, local carbon stocks and/or expert elicitation (Lovelock, 2021; Russell et al., 2024).
Post-intervention projections of blue carbon vegetation type extents were created from LiDAR Digital Elevation Models (DEM), which were re-classified using information on current vegetation types per elevation band for each flood cell (at 1 m resolution). For this step, data was obtained from elevation transects of the South Australian Department of Environment and Water Coastal Saltmarsh Monitoring Program (personal communication) on elevation and corresponding vegetation type and species, plant height and density along the saltmarsh monitoring transect lines, which generally run perpendicular to the coast. Where transect data was not available for a given flood cell, visual estimates from aerial imagery and local expert knowledge were used to estimate elevation bands. If no tidal saltmarsh or mangrove vegetation were currently present in a flood cell, best estimates and expert judgement were used to consider whether under SLR, these areas could support saltmarsh or mangrove vegetation (i.e., considering a low energy embayment compared to an exposed, steep coastline).
Relationships between elevation bands and vegetation types for each flood cell were used to extrapolate wetland vegetation to three post-intervention scenarios, to simulate tidal reconnection impacts for present day (2020), 2050 (+0.3 m SLR) and 2,100 (+1 m SLR). For future projections, vegetation elevation bands were updated to mimic 0.3 m and 1 m SLR respectively, and the DEMs were re-classified according to the derived vegetation relationships and assigned relative carbon values for the projected vegetation type (Table 2).
Carbon sequestration potential of coastal wetlands (Blue Carbon) was estimated by comparing the vegetation types and their relative carbon values pre- and post-intervention. The carbon potential was calculated by subtracting the “pre-intervention” relative carbon values from each of the “post-intervention” relative carbon values for 2020, 2050 and 2,100 in each flood cell.
This analysis was not restrained to specific project areas or sites, but was run across the full coastline. This meant that the analysis was inclusive of areas not presently mapped as being coastal wetland habitat, and also included areas such as sandy beaches that are adjacent to coastal wetland habitat (in the same flood cell), but are not likely to support coastal wetlands. The results from the carbon sequestration analysis were considered alongside the potential tidal blockage layer (Section 2.2.1) to spatially define potential project sites, based on the estimated area of blue carbon habitat present in the post-intervention 2020 scenario.
2.4 Site prioritisation assessment
MCDA was used to combine outputs from each of the preceding steps and a ranking system was applied to prioritise potential blue carbon project sites based on their suitability for registration under the Tidal Restoration Method.
Ranking of the potential sites was based on three aspects: 1) project complexity score (Section 2.2.2); 2) carbon sequestration potential for 2020, 2050 and 2,100 (Section 2.3); and 3) potential tidal blockages (Section 2.2.1). For project complexity and carbon sequestration potential, each site of interest was assigned a score between 1 and 5 (with 5 being more desirable), determined by expert opinion with site knowledge and evaluating the outcomes of these analyses. For carbon sequestration potential, sites of interest that have high potential for 2020, 2050 and 2,100 were given a higher score than those that have lower potential for 2020, and higher potential for 2050/2,100. Potential blockages in the area of interest were verified qualitatively using aerial imagery, local knowledge, and on-ground imagery to: i) assess if a tidal blockage is likely present and restricting tidal flows and ii) assess if the blockage is natural or artificial. Those sites that could not be reasonably assessed from aerial imagery were classified as requiring further verification in the field. Each site was classified by a binary Yes/No, depending on whether a tidal blockage was verified. Supplementary Material from local sources or experts regarding the site’s history and the viability of project implementation was also documented and used to guide scores.
Based on the above, each site of interest received an overall blue carbon project suitability score between 1 and 5. Sites that achieved a total score of three or more were recognised as highly suitable potential project sites, and their spatial boundaries were delineated and mapped. This captured areas of expected flooding on the landward side of a man-made tidal blockage based on the blue carbon potential in 2020 (Section 2.3). Finally, the following metrics were calculated for each of the highly suitable sites: i) total area (ha); ii) area (ha) that is under each land tenure and land-use category, and iii) count of cadastral parcels that intersect with each potential site. This process facilitated the identification of a collection of sites possessing the greatest potential for blue carbon restoration.
2.5 Application of the method: site demonstration
The above methodology was applied to assess the suitability of blue carbon wetland restoration sites across a 5,000 km stretch of the South Australian coastline, spanning from Fowlers Bay on the western side of the Eyre Peninsula to Lake Bonney near the South Australia/Victorian border (Figure 3). This coastal expanse encompasses three primary peninsulas: the Fleurieu, Yorke, and Eyre peninsulas. The diverse environmental conditions and topographies in this region provided a compelling case study for testing the feasibility of the MCDA approach. All necessary data were either supplied by the South Australian Department for Environment and Water or retrieved from publicly available datasets in online repositories. Refer to Table 1 in the Supplementary Material for a comprehensive breakdown of data sources employed in each of the five steps of the South Australian case study, and Supplementary Figures S1–S4 for a detailed, step-by-step explanation of the methods.
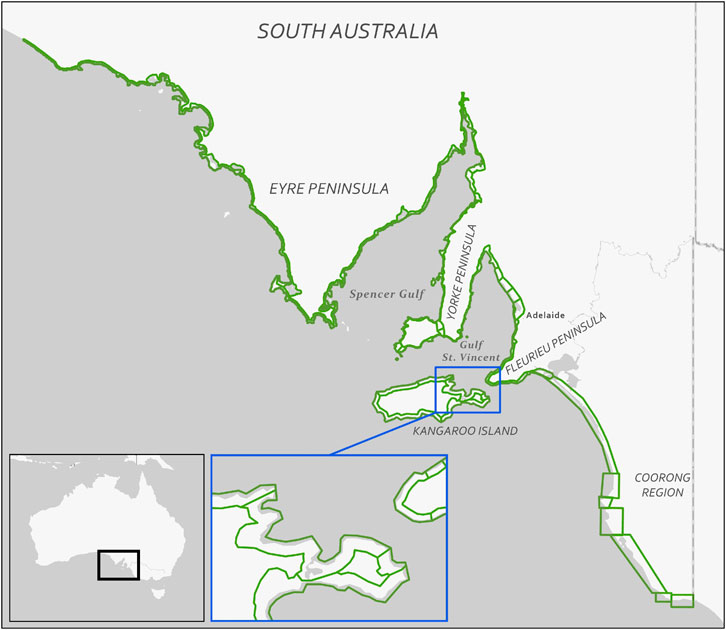
Figure 3. Map of South Australia’s coastline where the assessment was conducted. Flood cells used in the tidal inundation and sea level rise model (Section 2.1.1) are highlighted in green. Blue inset shows flood cells around East Kangaroo Island.
3 Results
3.1 Flooding extent and sea level rise
Across South Australia, there were a total of 65 flood cells covering 1,458,585 ha including 17 cells on the Yorke Peninsula, 20 on the Eyre Peninsula, 7 on the Adelaide plains/upper Gulf St Vincent, six on the Fleurieu Peninsula, six on Kangaroo Island, three in the Coorong Region, and six in the South East. The size of the flood cells varied from a minimum of 633 ha to a maximum of 153,398 ha (mean: 22,440 ha, median: 11,960 ha), with size being determined by the swath width of the DEM available and the topography (i.e., large low-lying coastal areas have a larger flood cell than areas with steep coastal cliffs).
Across all flood cells, the total area that would be inundated by the maximum flooding extent (i.e., between −0.2 m AHD and 1% Annual Exceedance Probability for 2,100) was 250,774 ha. The projected inundation of each flood cell ranged from 0.8% to 75.2%, with higher projected inundation for cells situated on the Yorke Peninsula and in Gulf St Vincent, as opposed to flood cells on Kangaroo Island and the Fleurieu Peninsula. The latter areas, characterised by steeper topography, were all projected to experience inundation for less than 10% of their coverage.
3.2 Project complexity potential and tidal blockage analysis
The tidal blockage analysis identified a variety of scenarios (Figure 4), including instances where roads/railways/levee banks A) directly intersected tidal creeks (point intersection), B) crossed a floodplain but were at a higher elevation (i.e., a linear intersection from raised blockage), or C) crossed a floodplain and were inundated by tidal flows.
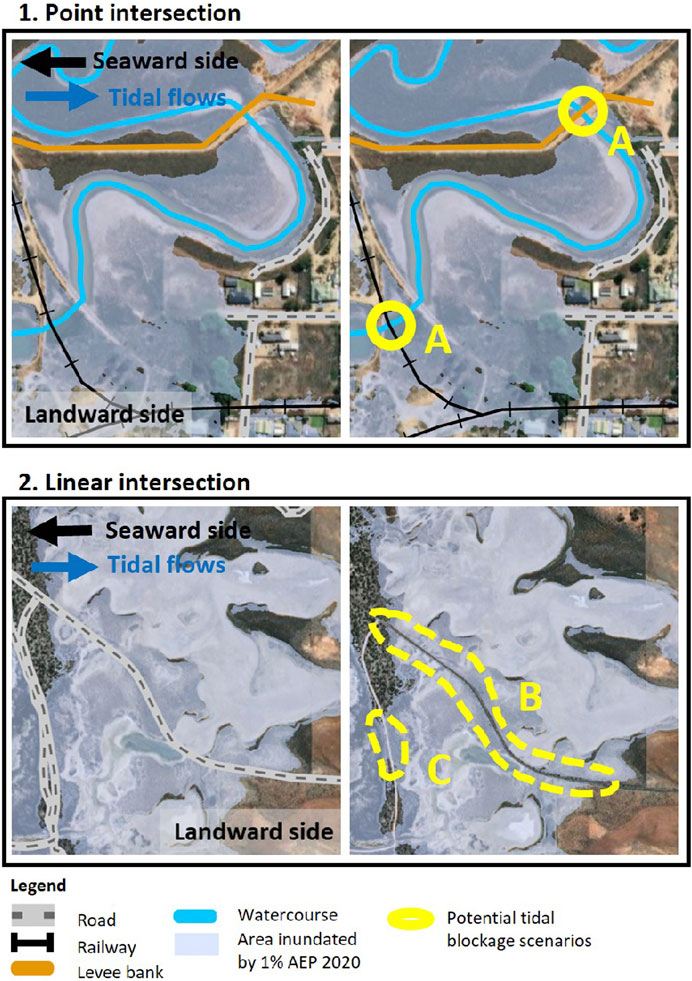
Figure 4. Example of potential tidal blockage scenarios (yellow) detected in the analysis, including 1) Point intersections indicated by (A), and 2) Linear intersections, indicated by (B) Raised intersection and Inundated intersection (C).
A total of 347 patches were analysed based on their land tenure, patch size, land use and number of intersecting cadastral parcels. The analysis found a range of project complexity scores ranging from 12 to 77 out of 100, with 162 of these patches being on the landward side of a potential blockage. The patches on the seaward side of potential blockages were larger than on the landward side, as this area typically covered large stretches of coastline in the absence of infrastructure obstructions. Consequently, these areas do not meet the criteria outlined in the Tidal Reconnection Method. In general, project complexity scores tended to increase with the size of project patches (Figure 5).
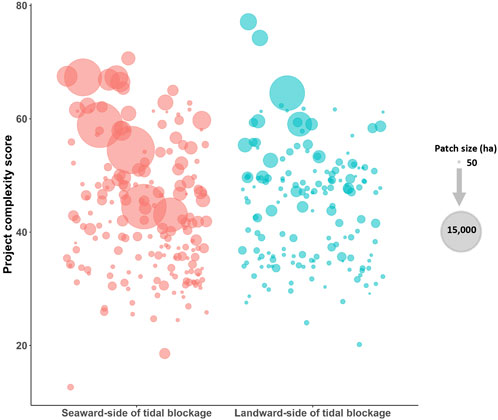
Figure 5. Distribution of project complexity scores between patches on the seaward and landward of a potential tidal blockage.
3.3 Site demonstration
To demonstrate the implementation of each of the above analytical and prioritisation steps conducted, results from the project complexity analysis (Section 3.2) and carbon sequestration potential analysis (Section 2.3) are shown for three anonymised sites of interest in South Australia (Figure 6).
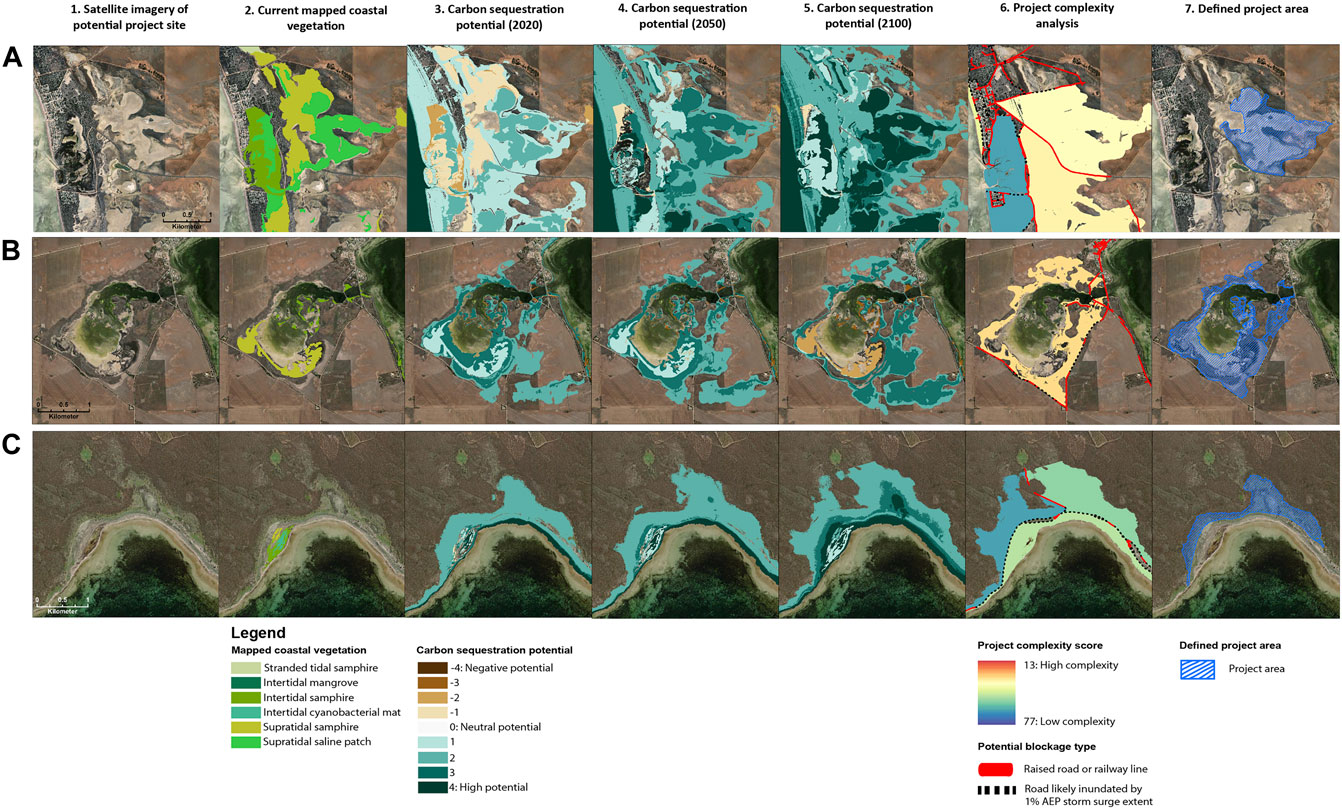
Figure 6. Example sites of interest illustrating the intermediary and prioritisation results for the project complexity analysis (6A–C), carbon sequestration potential for 2020 (3A–C), 2050 (4A–C) and 2,100 (5A–C), as well as mapped coastal vegetation for each project area (2A–C) and defined project area (7A–C) based on outputs in columns 1 to 5. Each row indicates an anonymised project area: row (A) received an overall blue carbon project suitability score of 4/5, row (B) received an overall score of 3/5, and row (C) received a score of 1/5.
Site A (Figure 6A1-7) received a project complexity score of 3/5, with specific patch complexity scores ranging from 33 to 62 out of 100, indicating moderate complexity and, consequently, moderate suitability for project implementation. Land tenure was predominantly identified as public protected land, with a clear tidal blockage (raised linear intersection) restricting tidal flows. Evaluation of the current coastal vegetation indicates a large patch of supratidal samphire (saltmarsh) and supratidal saline patch on the landward side of a raised tidal blockage, which, based on elevation, the saline patch is predicted to be supratidal samphire once tidally reconnected, and the entire area would transition to intertidal samphire and then mangrove vegetation under 2050 and 2,100 scenarios, respectively. Therefore, this area received a moderate score of 3/5 for carbon sequestration potential. At this site, oblique aerial imagery and local experts were both consulted, confirming that a tidal blockage was indeed very likely restricting flows to this potential project area of 129 ha. Overall, this site obtained an overall blue carbon project suitability score of 4/5 and was prioritised for further detailed assessments.
Site B (Figure 6B1-6) received a low project complexity score of 1/5 (with specific patch score of 29 out of 100), as it was observed that most of the potential blue carbon patches lie on land under freehold tenure. Land use is largely as pasture land and existing wetland vegetation. Tidal flows have previously been introduced at this site through the installation of two culverts, however an assessment of the mapped current vegetation and results from the carbon sequestration potential analysis indicated that the existing culverts may not be sufficient, particularly under future SLR predictions. Consequently, the carbon sequestration potential analysis received a moderate/high score of 4/5. Although it was acknowledged that on-site evaluations and comprehensive hydrodynamic modelling are necessary to determine the frequency of tidal flows and the degree to which existing culverts impede such flows, there seems to be significant long-term carbon sequestration potential. With a feasible project area of 122 ha, the site obtained an overall blue carbon project suitability score of 3/5.
Site C (Figure 6C1-6) received a moderate/high project complexity score of 4/5 (with specific patch complexity scores ranging from 48 to 62 out of 100), primarily due to the presence of protected public land tenure and natural vegetation on patches. In the long term, there seems to be carbon sequestration potential through the expansion and establishment of intertidal and supratidal samphire in the project area, based on elevation. Despite a few potential blockages that might limit the retreat of samphire in the future (e.g., roads inundated by 1% AEP), as there are currently no clear blockages restricting tidal flows, the present-day potential is very limited. The site has an area of 71 ha, and received a low carbon sequestration score of 2/5. Taking all these factors into account, the site obtained an overall blue carbon project suitability score of 1/5.
3.4 Final site prioritisation
In total, 64 regional sites of interest were identified including two sites scoring the highest suitability score of 5 out of 5, 12 sites scoring a four out of 5, 16 sites scoring a moderate score of three out of 5, 20 obtaining a score of two out of 5, and 14 sites obtaining the lowest blue carbon project suitability score of 1 out of 5, and (Figure 7). Thirty-two sites of interest received an overall blue carbon project suitability score of three or greater out of 5 and were prioritised for further investigation and feasibility analysis. For the 32 prioritised sites, the defined project area and the area of expected inundation on the landward side of a suspected tidal blockage were mapped. Across these 32 sites, a total of 8,370 ha received a blue carbon project suitability score of three out of 5; 10,178 ha scored at 4, and 2,565 ha scored 5, totalling 21114 ha overall.
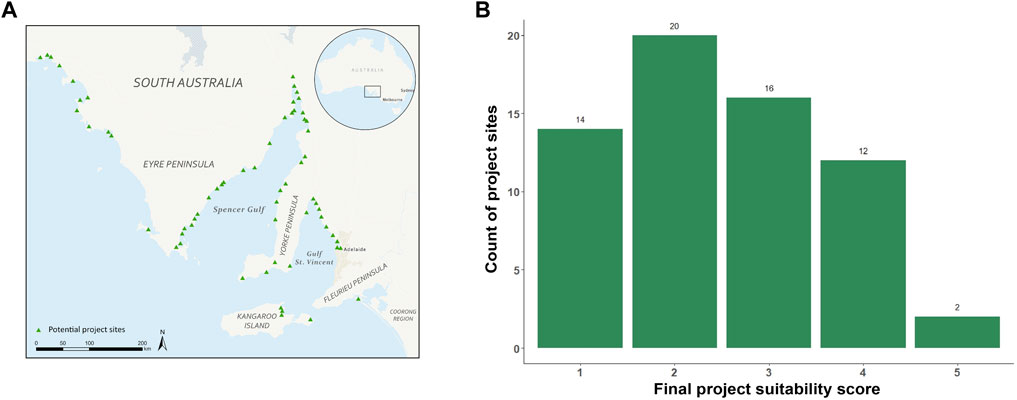
Figure 7. Distribution of 64 sites of interest along the South Australian coastline (A) and Count of sites of interest by overall project site score (B).
The 32 project areas were further broken down by their corresponding land-use (Figure 8A) and tenure (Figure 8B) categories. In terms of land-use, the percentage of land classified as urban and commercial use declined as overall blue carbon project suitability scores increased, likely as a result of low project complexity scores (i.e., high project complexity). For each scoring category, water was the dominant land-use class, which also increased in proportion as site scores increased, potentially a signal of low-lying features such as lakes and dams which tend to flood when tidally reconnected. For tenure, the percentage of government-owned land increased as the overall blue carbon project suitability score increased, whilst the percentage of freehold land decreased across all sites, reflecting the weights given in the project complexity analysis. The percentage of publicly protected lands also decreased as overall site score increased. When broken down by land tenure type, 6.4% (1,358 ha) of potential blue carbon project sites fell on public protected lands (e.g., National Parks and the Adelaide International Bird Sanctuary), 48.7% (10,285 ha) on privately owned (freehold), 42.7% (9,016 ha) on government owned lands, 1.9% (402 ha) on Crown Lands under leasehold tenure, and 0.3% (53 ha) on private conservation lands.
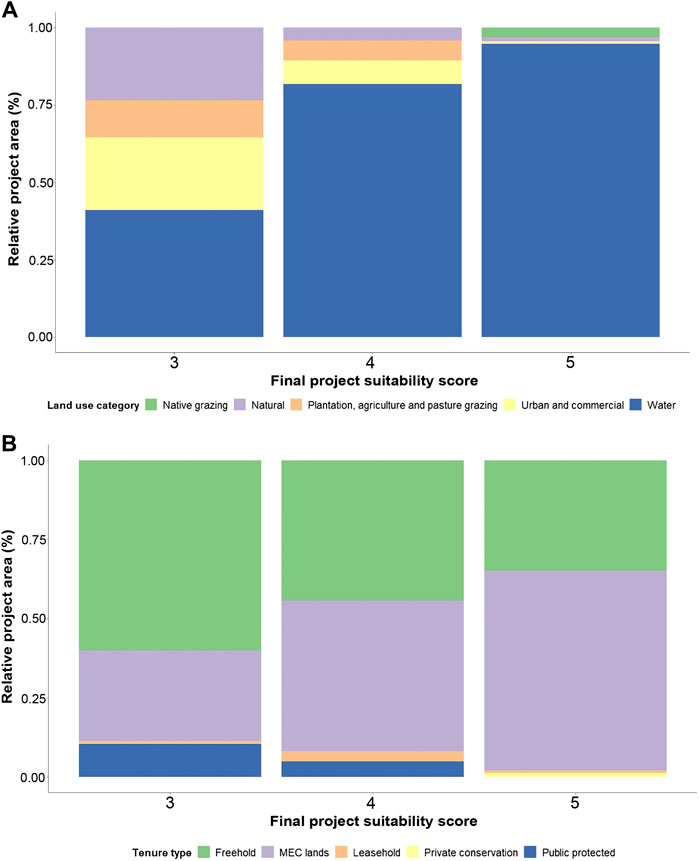
Figure 8. Breakdown of (A) land use category and (B) tenure type across potential project sites.
4 Discussion
As global efforts to address climate change intensify, there is growing interest in decarbonizing the economy and mitigating the impacts of greenhouse gas emissions. Voluntary carbon markets play a role in this process by allowing individuals, businesses, and organisations to offset their carbon footprint by investing in NCS projects, including blue carbon ecosystem restoration, that reduce or remove an equivalent amount of greenhouse gases from the atmosphere. To reach their carbon mitigation potential and the demand for credits, these markets require the development of prospective blue carbon project sites across large scales efficiently and cost-effectively. The spatial desktop assessment of potential blue carbon ecosystem restoration projects, described here, demonstrates an efficient MCDA for potential blue carbon project sites to be systematically identified, mapped, and prioritised based on their eligibility for tidal reconnection, ecological restoration potential, and practicality for implementation. This process can be carried out without detailed local data and at a low-cost, to provide managers a preliminary understanding of the potential blue carbon project opportunities across a large area, informing decisions on further investment in detailed feasibility assessments.
In this study, a MCDA was used as a framework to create a replicable workflow to systematically identify, map and prioritise potential blue carbon project sites based on their suitability for tidal reconnection and ecological restoration under an established methodology for the trading of carbon credits (Clean Energy Regulator, 2022). This large-scale assessment established a portfolio of potential blue carbon abatement projects across 5,000 km of South Australia’s coastline. Across this area, 64 potential sites were identified, with half of them (22,022 ha) receiving an overall blue carbon project suitability score of three or higher out of 5, and therefore deemed “highly suitable.” This underscores the sites that should be prioritised for comprehensive feasibility assessments and BlueCAM modelling by managers and restoration practitioners. Based on our criteria, site suitability was most influenced by i) confirmed tidal blockages, ii) large predicted tidal inundation areas and consequent blue carbon ecosystem extent, and iii) greater portion of government-owned land tenure and fewer cadastral parcels.
4.1 Integration of land tenure and land use
Densely populated coastal areas form one of the biggest practical obstacles in implementing blue carbon projects. Areas with mixed residential, industrial, commercial, agricultural, and recreational land uses are often why tidal flows were restricted in the first place. Tenure, land use, and the number of cadastral parcels were factors which assisted in prioritising sites likely to have less complexity in project implementation. Projects are easier to establish if tenure, land use are simple and the number of land parcels are small as these elements reduce complex negotiations and agreements with multiple neighbouring landholders for the project to proceed, or reduce participation of neighbouring landholders in the project application. The complexity analysis therefore favoured sites with fewer parcel holders as an indication of the number of landowners that would need to be involved and engaged. However, this assumes that each cadastral parcel has a different landowner and does not account for a single, or few, landowners owning multiple parcels. Consequently, the analysis was not able to account for sites with many cadastral parcels all owned by the same landowner and therefore potentially lowered the score of such sites compared to sites with a few cadastral parcels held in separate ownership. Land ownership data is considered sensitive and requires a high level of confidentiality. Whilst including land ownership information in MCDA assessments could be done, it may require additional time (for seeking approvals) and greater levels of data security and scrutiny.
4.2 Estimating tidal blockages
Identification and mapping of artificial tidal blockages proved relatively easy due to ample availability of spatial data identifying significant infrastructure such as roads, railways and levees. Very limited information was available, however, on the nature and details of these infrastructure features, such as whether there were culverts installed under roads to allow flow, whether roads were raised, to what standard a levee was built, or its condition. Furthermore, the assessment did not elucidate whether any natural barriers were also impacting tidal flows. Supplementary Material was used to circumvent these data limitations as best as possible, including aerial imagery, on-ground imagery (e.g., google street view) and discussions with local environmental staff.
4.3 Mapping carbon sequestration potential
Several other studies have evaluated blue carbon restoration opportunities using spatial assessments that compared outcomes for multiple management scenarios including tidal reconnection, fencing out feral herbivores, and the deliberate and planned process of allowing coastal areas to undergo controlled retreat or migration inland, also known as “managed retreat.” (e.g., Moritsch et al., 2021; Carnell et al., 2022; Costa M. D. et al., 2022; Costa M. D.deP. et al., 2022; Costa et al., 2024). Some of these studies included rankings of prospective sites based on the predicted carbon sequestration potential (e.g., Costa M. D.deP. et al., 2022), the estimated intervention costs (e.g., Carnell et al., 2022; Costa M. D. et al., 2022) or cost-benefit (Costa et al., 2024). A unique advancement made by the present study was predicting the potential blue carbon project area under future inundation levels including sea level rise, which will likely play an important role in the restoration and re-establishment of coastal wetlands. Relative carbon values were assigned for mangrove, intertidal and supratidal saltmarsh vegetation types using the best available data, and relative carbon values were assumed to be standard and uniform within each vegetation type across the state. Studies on the spatial variability of blue carbon storage potential and carbon accumulation rates at local and global scales indicate that carbon storage is highly variable across seascapes, and dependent on vegetation configuration and terrestrial input (e.g., Gullström et al., 2018; Huxham et al., 2018; Asplund et al., 2021; Russell et al., 2024). Strategic sampling of blue carbon stocks across local and regional scales, and across a variety of structural features and vegetation mosaics could increase the accuracy of carbon sequestration potential predictions. Similarly, as the condition of existing and future vegetation may impact the ability of an ecosystem to sequester and store carbon, updated vegetation mapping that includes information on vegetation condition would improve the identification and prioritisation of sites with higher blue carbon sequestration potential.
4.4 Opportunities and applications to other market-based natural climate solutions
We expect that the methods presented here can be readily reproduced in other regions, to quickly identify potential blue carbon restoration project sites. The Australian Tidal Reconnection Method is aligned with international standards and while blue carbon projects are emerging, there are currently a limited number of approved methods, such as those by Verra (e.g., VM0007—REDD + Methodology Framework v1.6, VM0048—Reducing Emissions from Deforestation and Forest Degradation v1.0, VM0033—Methodology for Tidal Wetland and Seagrass Restoration v2.0, and VM0024—Methodology for Coastal Wetland Creation v1.0) with some still under development (e.g., Gold Standard and Social Carbon). The application of a modified workflow with suitability criteria that considers multiple methods could be useful for evaluating the establishment of other NCS project activities aimed at restoring and creating coastal wetlands such as those eligible through other international voluntary carbon markets, including re-introducing native plant communities, fencing grazing animals or other improved land management practices. For example, an additional analysis could include spatial data that specifically identifies agricultural or grazing land uses on degraded coastal wetlands and prioritise sites where fences would prove useful in excluding grazing animals to improve native vegetation.
We anticipate that the application of the workflow from this study will provide additional confidence when considering suitable sites and making decisions about investing in further feasibility activities to meet the formal requirements for blue carbon project registration. Further in-depth feasibility studies will be required for blue carbon site registration including a detailed analysis of the technical, environmental, legal and economic feasibility and community support factors, to comprehensively determine the feasibility of a blue carbon project at any given site. Another consideration when exploring site options for restoring blue carbon ecosystems is including sites that maximise the provision of one or more ecosystem services. These encompass various co-benefits such as coastal protection, fish nursery, water purification and marine biodiversity (Rashid et al., 2005). Whilst not included in this workflow, co-benefits could improve a project site’s potential for other market mechanisms and incentives (e.g., emerging payment for ecosystem markets such as coastal resilience and biodiversity credits). It is worth noting that our MCDA approach can also easily integrate the assessment of co-benefits in the prioritization by introducing additional spatial layers and assigning higher weightings to project sites that support high levels of biodiversity or coastal vulnerability.
5 Conclusion
Through the workflow proposed here, potential blue carbon project sites can be systematically identified, mapped, and prioritised based on their eligibility for tidal reconnection, ecological restoration potential, and practicality for project implementation. Although demonstrated in an Australian context, this stepwise identification and prioritisation approach could be adapted to other geographies and blue carbon methodologies as a first-pass assessment of site eligibility across large spatial scales. Such exploratory workflows are important to ensure the most ecologically and financially sound decisions are made and enable site prioritisation with readily available spatial data without the need for undertaking expensive field studies to collect further data. Subsequent steps in the registration of blue carbon restoration projects entail numerous and detailed technical, environmental, social, economic, and legal assessments that can be costly, therefore minimising cost in the site prioritisation project life-cycle stage is key. Optimising site selection towards sites with a high potential for a return on investment can facilitate the uptake of the Tidal Reconnection Method and targeted outreach to landholders and communities. Uptake of blue carbon restoration projects locally by public and private landholders, in combination with the establishment of strong (voluntary) carbon markets, can solidify the position of this Tidal Reconnection Method as a Natural Climate Solution and contribute to climate change mitigation globally.
Data availability statement
All R-code used for the analysis is made publicly available on https://github.com/naturalclimatesolutions/australia-bc-feasibility/blob/main/src/blue-carbon-potential.R.
Author contributions
AH: Conceptualization, Data curation, Formal Analysis, Methodology, Project administration, Visualization, Writing–original draft, Writing–review and editing. VR: Methodology, Writing–original draft, Writing–review and editing. AN: Conceptualization, Project administration, Writing–original draft, Writing–review and editing. SK: Conceptualization, Project administration, Writing–review and editing. SKR: Methodology, Writing–review and editing. SER: Conceptualization, Methodology, Writing–original draft, Writing–review and editing. JA: Data curation, Software, Writing–review and editing. MC: Conceptualization, Project administration, Writing–review and editing. SD: Conceptualization, Data curation, Formal Analysis, Methodology, Visualization, Writing–original draft, Writing–review and editing.
Funding
The author(s) declare that financial support was received for the research, authorship, and/or publication of this article. This study was funded by the Natural Climate Solutions Prototyping Network (received funding from the Bezos Earth Fund and other partners), The COmON Foundation and the South Australian Coast Protection Board. Publication charges were covered by The Nature Conservancy's Finishline Fund. Ideas expressed do not necessarily reflect the views of any funder.
Acknowledgments
Sara Leavitt for funding acquisition and project support. Peter Benham and Pathanchali Premachandra for program management. Geoffrey Lipsett-Moore, Fiona Valesini, Ashley Whitt, Lindsay Smart and Chris Gillies for their guidance and support in conceptualising, reviewing and developing this research. We acknowledge the traditional owners of the lands and waters on which this publication was produced, where this analysis was conducted, and where restoration activities occur. We pay our respects to elders, both past present and emerging.
Conflict of interest
The authors declare that the research was conducted in the absence of any commercial or financial relationships that could be construed as a potential conflict of interest.
Publisher’s note
All claims expressed in this article are solely those of the authors and do not necessarily represent those of their affiliated organizations, or those of the publisher, the editors and the reviewers. Any product that may be evaluated in this article, or claim that may be made by its manufacturer, is not guaranteed or endorsed by the publisher.
Supplementary material
The Supplementary Material for this article can be found online at: https://www.frontiersin.org/articles/10.3389/fenvs.2024.1431027/full#supplementary-material
References
Anderson, C. M., DeFries, R. S., Litterman, R., Matson, P. A., Nepstad, D. C., Pacala, S., et al. (2019). Natural climate solutions are not enough. Science 363, 933–934. doi:10.1126/science.aaw2741
Asplund, M. E., Dahl, M., Ismail, R. O., Arias-Ortiz, A., Deyanova, D., Franco, J. N., et al. (2021). Dynamics and fate of blue carbon in a mangrove–seagrass seascape: influence of landscape configuration and land-use change. Landsc. Ecol. 36, 1489–1509. doi:10.1007/s10980-021-01216-8
Barbier, E. B., Hacker, S. D., Kennedy, C., Koch, E. W., Stier, A. C., and Silliman, B. R. (2011). The value of estuarine and coastal ecosystem services. Ecol. Monogr. 81, 169–193. doi:10.1890/10-1510.1
Bayraktarov, E., Saunders, M. I., Abdullah, S., Mills, M., Beher, J., Possingham, H. P., et al. (2016). The cost and feasibility of marine coastal restoration. Ecol. Appl. 26, 1055–1074. doi:10.1890/15-1077
Blaufelder, C., Levy, C., Mannion, P., and Pinner, D. (2021). A blueprint for scaling voluntary carbon markets to meet the climate challenge. McKinsey. viewed January 8, 2024).
Carnell, P., McLeod, R., Young, M., Gillies, C., Obst, C., Macreadie, P., et al. (2022). Prioritising the restoration of marine and coastal ecosystems using ecosystem accounting (preprint). Review. doi:10.21203/rs.3.rs-1617940/v1
Clean Energy Regulator (2022). Tidal restoration of blue carbon ecosystems method. Available at: http://www.cleanenergyregulator.gov.au/ERF/Choosing-a-project-type/Opportunities-for-the-land-sector/Vegetation-methods/tidal-restoration-of-blue-carbon-ecosystems-method.
Cook-Patton, S. C., Drever, C. R., Griscom, B. W., Hamrick, K., Hardman, H., Kroeger, T., et al. (2021). Protect, manage and then restore lands for climate mitigation. Nat. Clim. Change 11, 1027–1034. doi:10.1038/s41558-021-01198-0
Cooper, J. A. G. (2003) “Anthropogenic impacts on estuaries. Coastal zones, estuaries,” in Encyclopedia of life support systems (EOLSS). Oxford, UK: UNESCO EOLSS Publishers, 246pp.
Costa, M. D., de, P. M., Wartman, M., Macreadie, P., Ierodiaconou, D., Morris, R., et al. (2022a) “Mapping the benefits and costs of management actions for coastal wetlands in Victoria,” in Report submitted to the department of environment, land, water and planning. Burwood, VIC, Australia: Deakin University.
Costa, M. D. de P., Lovelock, C. E., Waltham, N. J., Moritsch, M. M., Butler, D., Power, T., et al. (2022b). Modelling blue carbon farming opportunities at different spatial scales. J. Environ. Manag. 301, 113813. doi:10.1016/j.jenvman.2021.113813
Costa, M. D. de P., Wartman, M., Macreadie, P. I., Ferns, L. W., Holden, R. L., Ierodiaconou, D., et al. (2024). Spatially explicit ecosystem accounts for coastal wetland restoration. Ecosyst. Serv. 65, 101574. doi:10.1016/j.ecoser.2023.101574
Dencer-Brown, A. M., Shilland, R., Friess, D., Herr, D., Benson, L., Berry, N. J., et al. (2022). Integrating blue: how do we make nationally determined contributions work for both blue carbon and local coastal communities? Ambio 51 (9), 1978–1993. doi:10.1007/s13280-022-01723-1
Duarte, C. M., Losada, I. J., Hendriks, I. E., Mazarrasa, I., and Marbà, N. (2013). The role of coastal plant communities for climate change mitigation and adaptation. Nat. Clim. Change 3, 961–968. doi:10.1038/nclimate1970
Greene, R., Devillers, R., Luther, J. E., and Eddy, B. G. (2011). GIS-based multiple-criteria decision analysis. Geogr. Compass 5, 412–432. doi:10.1111/j.1749-8198.2011.00431.x
Griscom, B. W., Adams, J., Ellis, P. W., Houghton, R. A., Lomax, G., Miteva, D. A., et al. (2017). Natural climate solutions. Proc. Natl. Acad. Sci. U. S. A. 114, 11645–11650. doi:10.1073/pnas.1710465114
Griscom, B. W., Lomax, G., Kroeger, T., Fargione, J. E., Adams, J., Almond, L., et al. (2019). We need both natural and energy solutions to stabilize our climate. Glob. Change Biol. 25, 1889–1890. doi:10.1111/gcb.14612
Gullström, M., Lyimo, L. D., Dahl, M., Samuelsson, G. S., Eggertsen, M., Anderberg, E., et al. (2018). Blue carbon storage in tropical seagrass meadows relates to carbonate stock dynamics, plant–sediment processes, and landscape context: insights from the western Indian Ocean. Ecosystems 21, 551–566. doi:10.1007/s10021-017-0170-8
Higginbottom, T. P., Field, C. D., Rosenburgh, A., Wright, A., Symeonakis, E., and Caporn, S. J. (2018). High-resolution wetness index mapping: a useful tool for regional scale wetland management. Ecol. Inf. 48, 89–96. doi:10.1016/j.ecoinf.2018.08.003
Huang, I. B., Keisler, J., and Linkov, I. (2011). Multi-criteria decision analysis in environmental sciences: ten years of applications and trends. Sci. Total Environ. 409, 3578–3594. doi:10.1016/j.scitotenv.2011.06.022
Huxham, M., Whitlock, D., Githaiga, M., and Brown, A. (2018). Carbon in the coastal seascape: how interactions between mangrove forests, seagrass meadows and tidal marshes influence carbon storage. Curr. For. Rep. 4, 101–110. doi:10.1007/s40725-018-0077-4
Kelleway, J. J., Serrano, O., Baldock, J. A., Burgess, R., Cannard, T., Lavery, P. S., et al. (2020). A national approach to greenhouse gas abatement through blue carbon management. Glob. Environ. Change 63, 102083. doi:10.1016/j.gloenvcha.2020.102083
Kuwae, T., Yoshihara, S., Suehiro, F., and Sugimura, Y. (2022). “Implementation of Japanese blue carbon offset crediting projects,” in Green infrastructure and climate change adaptation (Singapore: Springer), 353–377.
Lovelock, C. E. (2021). Blue carbon accounting model (BlueCAM) technical overview. Rep. Clean. Energy Regul. Aust.
Lovelock, C. E., Adame, M. F., Bradley, J., Dittmann, S., Hagger, V., Hickey, S. M., et al. (2022). An Australian blue carbon method to estimate climate change mitigation benefits of coastal wetland restoration. Restor. Ecol. 31. doi:10.1111/rec.13739
Lovelock, C. E., and Duarte, C. M. (2019). Dimensions of blue carbon and emerging perspectives. Biol. Lett. 15, 20180781. doi:10.1098/rsbl.2018.0781
Macreadie, P. I., Costa, M. D., Atwood, T. B., Friess, D. A., Kelleway, J. J., Kennedy, H., et al. (2021). Blue carbon as a natural climate solution. Nat. Rev. Earth Environ. 2, 826–839. doi:10.1038/s43017-021-00224-1
Moritsch, M. M., Young, M., Carnell, P., Macreadie, P. I., Lovelock, C., Nicholson, E., et al. (2021). Estimating blue carbon sequestration under coastal management scenarios. Sci. Total Environ. 777, 145962. doi:10.1016/j.scitotenv.2021.145962
Pittman, S. J., Stamoulis, K. A., Antonopoulou, M., Das, H. S., Shahid, M., Delevaux, J., et al. (2022). Rapid site selection to prioritize coastal seascapes for nature-based solutions with multiple benefits. Front. Mar. Sci. 9, 571. doi:10.3389/fmars.2022.832480
Rashid, H., Scholes, R., and Ash, N. (2005). Ecosystems and human well-being: current state and trends: findings of the condition and trends working group. Washington, DC: Island Press, 917.
Rotzoll, K., and Fletcher, C. H. (2013). Assessment of groundwater inundation as a consequence of sea-level rise. Nat. Clim. Change 3, 477–481. doi:10.1038/nclimate1725
Russell, S. (2019). Eyre peninsula saltmarsh retreat assessment report. Adelaide, SA, Australia: South Australian Department for Environment and Water.
Russell, S., Gillanders, B., Detmar, S., Fotheringham, D., and Jones, A. (2024). Determining environmental drivers of fine-scale variability in blue carbon soil stocks. Estuaries Coasts 47, 48–59. doi:10.1007/s12237-023-01260-4
Serrano, O., Lovelock, C. E., and Atwood, T. (2019). Australian vegetated coastal ecosystems as global hotspots for climate change mitigation. Nat Commun. 10 (8), 4313. doi:10.1038/s41467-019-12176-8
Seddon, N., Smith, A., Smith, P., Key, I., Chausson, A., Girardin, C., et al. (2021). Getting the message right on nature-based solutions to climate change. Glob. Change Biol. 27, 1518–1546. doi:10.1111/gcb.15513
Shukla, P. R., Skea, J., Slade, R., Al Khourdajie, A., Van Diemen, R., McCollum, D., et al. (2022). IPCC, 2022: climate change 2022: mitigation of climate change. Contribution of working group III to the sixth assessment report of the (Cambridge, UK: Intergovernmental Panel on Climate Change). doi:10.1017/9781009157926
Taillardat, P., Friess, D. A., and Lupascu, M. (2018). Mangrove blue carbon strategies for climate change mitigation are most effective at the national scale. Biol. Lett. 14, 20180251. doi:10.1098/rsbl.2018.0251
Thompson, B. S., and Friess, D. A. (2019). Stakeholder preferences for payments for ecosystem services (PES) versus other environmental management approaches for mangrove forests. J. Environ. Manag. 233, 636–648. doi:10.1016/j.jenvman.2018.12.032
Uuemaa, E., Hughes, A. O., and Tanner, C. C. (2018). Identifying feasible locations for wetland creation or restoration in catchments by suitability modelling using light detection and ranging (LiDAR) Digital Elevation Model (DEM). Water 10, 464. doi:10.3390/w10040464
Williamson, P., and Gattuso, J.-P. (2022). Carbon removal using coastal blue carbon ecosystems is uncertain and unreliable, with questionable climatic cost-effectiveness. Front. Clim. 4. doi:10.3389/fclim.2022.853666
Wylie, L., Sutton-Grier, A. E., and Moore, A. (2016). Keys to successful blue carbon projects: lessons learned from global case studies. Mar. Policy 65, 76–84. doi:10.1016/j.marpol.2015.12.020
Yunus, A. P., Avtar, R., Kraines, S., Yamamuro, M., Lindberg, F., and Grimmond, C. (2016). Uncertainties in tidally adjusted estimates of sea level rise flooding (bathtub model) for the greater London. Remote Sens. 8, 366. doi:10.3390/rs8050366
Zedler, J. B., Bonin, C. L., Larkin, D. J., and Varty, A. (2008). “Salt marshes,” in Encyclopedia of ecology. Editors S. E. Jørgensen,, and B. D. Fath (Oxford: Academic Press), 3132–3141. doi:10.1016/B978-008045405-4.00357-8
Keywords: natural climate solutions (NCS), GIS, carbon market, tidal marshes, mangroves, feasibility assessment, sea level rise, spatial modelling
Citation: Howie AH, Rullens V, Thomas A, Kondylas S, Russell SK, Reeves SE, Ament JM, Castro M and Detmar S (2024) Seas the opportunity: multi-criteria decision analysis to identify and prioritise blue carbon wetland restoration sites. Front. Environ. Sci. 12:1431027. doi: 10.3389/fenvs.2024.1431027
Received: 13 May 2024; Accepted: 26 July 2024;
Published: 28 August 2024.
Edited by:
Pierre Failler, University of Portsmouth, United KingdomReviewed by:
Andrew D. L. Steven, Commonwealth Scientific and Industrial Research Organisation (CSIRO), AustraliaPhoebe Jan Stewart-Sinclair, National Institute of Water and Atmospheric Research, New Zealand
Copyright © 2024 Howie, Rullens, Thomas, Kondylas, Russell, Reeves, Ament, Castro and Detmar. This is an open-access article distributed under the terms of the Creative Commons Attribution License (CC BY). The use, distribution or reproduction in other forums is permitted, provided the original author(s) and the copyright owner(s) are credited and that the original publication in this journal is cited, in accordance with accepted academic practice. No use, distribution or reproduction is permitted which does not comply with these terms.
*Correspondence: Alice H. Howie, QWxpY2UuSG93aWVAdG5jLm9yZw==