- 1School of Economics and Management, Tongji University, Shanghai, China
- 2Sichuan Administrative Institute, Chengdu, China
Financial agglomeration contributes to energy efficiency improvement and carbon emission reduction, but more micro-level evidence is needed to further support it. Based on the data of high-growth enterprises and bank branches in China using panel regression analysis, this study examines the impact of bank agglomeration on carbon intensity of high-growth enterprises. The results suggest that bank agglomeration facilitates the reduction of carbon intensity in high-growth enterprises. Specifically, bank agglomeration significantly reduces carbon intensity in non-state-owned enterprises, while it has no significant effect on state-owned enterprises. Compared with state-owned commercial banks and small banks, the agglomeration of joint-stock commercial banks has the strongest promoting effect on enterprise carbon reduction. Bank agglomeration has a particularly significant effect on the carbon reduction of enterprises in high-energy-consuming industries and high-polluting industries. Mechanism analysis shows that bank agglomeration reduces enterprise carbon intensity by promoting innovation, changing energy structure, and mitigating financial constraint. These findings carry important policy implications, suggesting that policymakers should leverage financial agglomeration as a tool for carbon reduction and sustainable development.
1 Introduction
Global warming has evolved into both a critical environmental issue and a significant socioeconomic challenge, with profound implications for business operations and public health (Hasegawa et al., 2016). Excessive CO2 emissions, a primary driver of global warming, obstruct global sustainable development (Wang and Liu, 2017). In pursuit of a green and low-carbon development model, China has set ambitious goals: “Peaking Carbon Dioxide Emissions before 2030 and Achieving Carbon Neutrality by 2060.” These targets represent a proactive response to global environmental concerns (Alt and Dreyer Lassen, 2006; Fan et al., 2023; Shi, 2022; Wang and Yang, 2018; Xiao et al., 2021; Yu et al., 2018). The financial system, a key pillar of economic activity, is increasingly recognized for its vital role in promoting green transformation and reducing carbon emissions. The agglomeration of financial institutions, in particular, is thought to enhance enterprise innovation in energy efficiency and emission reduction by providing increased financing opportunities and resources. Exploring how financial agglomeration affects enterprise carbon intensity through various mechanisms helps to deepen our understanding of finance’s contribution to green development, facilitates the formulation and implementation of green financial policies, further optimizes financial resource allocation, and drives business innovation and transformation within financial institutions. Moreover, it supports the regulation of energy-intensive and highly polluting industries, enhancing enterprise social responsibility and environmental awareness, and supporting the sustainable development of high-growth enterprises.
A series of studies have explored the relationships among financial development, energy consumption, and carbon emissions (Al-Silefanee et al., 2022; Bekhet et al., 2017; Esso and Keho, 2016; Riti et al., 2017; Salahuddin et al., 2018; Shahzad et al., 2017; Sultana et al., 2022; Zhao et al., 2023). Feng et al. (2023) investigated the effects of environmental regulation on carbon intensity, finding that it significantly reduces carbon intensity. Similarly, Zhang et al. (2024) examined the impact of the central environmental protection inspection on carbon emission reduction, suggesting that increased inspections lead local governments and enterprises to adopt strategies conducive to carbon reduction. Evidence from different countries shows that financial development reduces carbon emissions (Shahbaz et al., 2018; 2013; Tamazian and Rao, 2010; Ziolo et al., 2019). Recent empirical studies have increasingly focused on the impact of regional financial agglomeration on carbon emissions. For instance, Mei et al. (2023) analyzed data from 30 Chinese provinces between 2010 and 2020, revealing that the relationship between financial agglomeration and per capita carbon emissions follows an inverted U-shape. Wang and Zhang (2022) utilized provincial panel data from China spanning 2005 to 2018 and employed a panel smooth transition model to empirically test the nonlinear effects of financial agglomeration on carbon emission efficiency. Their study found that, at low levels, financial agglomeration inhibits carbon emission efficiency, but as financial agglomeration intensifies, it promotes carbon emission efficiency. Wu et al. (2023) identified spatial agglomeration characteristics between carbon emissions and financial development in China. Their study showed that financial agglomeration can reduce carbon emissions, with a more pronounced effect in central low-carbon regions and carbon trading pilot areas.
An important source of carbon emissions is industrial enterprises, particularly high-growth ones. A growing number of countries now view high-growth enterprises as engines of industrial transformation and focal points in political discussions about economic performance and industrial resilience (Anyadike-Danes and Hart, 2018; Bleda and del Rio, 2013; Brown et al., 2017). In China, the 14th Five-Year Plan (2021–2025) identifies high-growth enterprises as a pillar and fundamental force to constructing a modern industrial system and supply chain modernization. However, due to their rapid expansion, high-growth enterprises are likely to face challenges such as high energy consumption, high carbon intensity, and difficulties in energy conservation and consumption reduction. Achieving low-carbon transformation and green development in high-growth enterprises while maintaining rapid growth is a critical issue with both theoretical and practical implications. Existing studies primarily examine the impact of financial support on corporate carbon emissions in terms of government subsidies and liability structures (Chen and Li, 2023; Chen and Zhu, 2022). Few studies have explored the impact of bank agglomeration on carbon emissions by targeting fast-growth enterprises. Therefore, this paper aims to explore the impact of financial development on carbon emissions of fast-growth enterprises from the perspective of agglomeration economy.
The existing literature has several gaps that need to be addressed. First, most research measures financial agglomeration based on the size of financial assets or the number of financial employees, overlooking the actual geographical distribution of financial institution branches and, consequently, neglecting spatial factors. Second, the majority of existing studies adopt a macro perspective, examining the impact of financial agglomeration on carbon emissions at the industry or province level with limited focus on the enterprise level. Third, while research on high-growth enterprises predominantly examines their attributes and industrial distribution, there is insufficient attention to their carbon dioxide emissions and the influence of financial agglomeration on these emissions.
This paper brings geospatial factors into the study, providing new evidence of bank agglomeration’s influence on carbon intensity from the micro-level of “enterprise-bank”. Firstly, we analyze the influence channels from bank agglomeration to enterprise carbon emissions theoretically. Secondly, we screen out samples of high-growth enterprises and measure their carbon intensity with the improved EIO-LCA method. At the same time, using the latitude and longitude data of enterprises and bank branches, we obtain the distribution of bank branches within a certain range around enterprises and calculate the degree of bank agglomeration. Then, we conduct a series of empirical tests. The findings suggest that the agglomeration of banks around enterprises can help high-growth enterprises reduce their carbon intensity. The heterogeneity is analyzed at the enterprise, bank, and industry levels. Bank agglomeration significantly promotes the carbon intensity reduction of non-state-owned enterprises but has no significant effect on state-owned enterprises. The agglomeration of state-owned commercial banks, joint-stock commercial banks, and small banks each has a negative impact on the carbon intensity of high-growth enterprises, with joint-stock commercial banks exerting the strongest influence. Through an analysis of industry heterogeneity, our research reveals that the carbon reduction effect of bank agglomeration is most pronounced in high-energy-consuming and high-polluting industries. To clarify the mechanisms through which bank agglomeration affects the carbon intensity of high-growth enterprises, we study the mediating effects of enterprise innovation, energy structure, and financial constraints by constructing a mediating effect model. Additionally, a series of robustness tests are conducted to reinforce the findings. Finally, we address potential endogeneity issues by employing several approaches, including using the average grade at the county level and the distance of the county from the coastline as instrumental variables, adding control variables, and excluding samples from specific years.
Our research addresses several gaps in the existing literature and contributes in three key ways that align with these gaps. Firstly, we refine the measurement of financial agglomeration by incorporating the geographical distribution of financial institution branches. Unlike most studies that rely solely on the size of financial assets or the number of financial employees, our novel approach uses the actual addresses of bank branches to calculate the degree of bank agglomeration around enterprises. This enhanced measurement captures spatial factors more accurately, providing a clearer and more detailed depiction of financial agglomeration and its environmental impact. Secondly, our study provides valuable micro-level evidence on the environmental consequences of financial agglomeration, specifically at the enterprise level. While existing research predominantly focuses on macro-level impacts, such as those at the industry or city level, our analysis explores how financial agglomeration influences the carbon intensity of individual high-growth enterprises. This micro-level perspective complements broader studies and offers detailed insights that are crucial for formulating effective carbon reduction strategies at the enterprise level. Thirdly, we focus on the low-carbon development of high-growth enterprises, a topic that has received limited attention in previous studies. By analyzing the CO2 emissions of these enterprises, we not only fill a significant gap in the literature but also provide practical guidance for high-growth enterprises to enhance their social responsibility and environmental practices. Our research highlights the specific pathways through which financial agglomeration can support the sustainable development of these dynamic businesses. Through these contributions, our research enhances the understanding of financial institutions, businesses, and policymakers both domestically and internationally. It provides essential support for promoting low-carbon economic practices, optimizing financial resource allocation, and driving business innovation and transformation in the context of green development. Furthermore, by offering micro-level insights into the environmental impact of financial agglomeration, our study has significant international relevance, offering valuable lessons for global efforts in reducing carbon emissions and achieving sustainable development goals.
The remainder of this paper is organized as follows. Section 2 presents the theoretical analysis and research hypotheses. Section 3 describes the data, variables, and descriptive statistics. In Section 4, we present the empirical facts and main results, discuss endogeneity issues, perform robustness checks, and conduct a heterogeneity analysis. Section 5 analyzes the underlying mechanisms, and Section 6 concludes the paper.
2 Theoretical hypotheses
The degree of competition in the banking industry influences the scale and cost of loans available to enterprises, thereby affecting their behavior (Beck et al., 2006; Love and Peria, 2015). Consequently, bank competition can impact the carbon intensity of high-growth enterprises. One indicator of intense bank competition is the aggregation of bank branches. Moreover, bank agglomeration signals increased business activity and higher demand for loans from businesses and individuals in surrounding areas. From the perspective of high-growth enterprises, bank agglomeration facilitates access to sufficient and high-quality financial services, which is more conducive to their development (Fan et al., 2023). Several studies have confirmed that financial agglomeration positively affects regional and industrial carbon emission reduction (Sai et al., 2023; Wu et al., 2022). When high-growth enterprises receive better financial services, they are motivated to improve operational quality, which, in turn, helps reduce carbon emissions per unit of output. Additionally, high-growth enterprises are likely to place greater emphasis on social responsibility, which is often reflected in the gradual reduction of carbon intensity (Gao et al., 2024). Then we propose hypothesis 1.
Hypothesis 1:. Bank agglomeration promotes high-growth enterprise carbon intensity reduction.
Bank agglomeration creates a favorable financial environment for enterprise technological innovation (Levine, 1997). By expanding financing channels and providing sufficient financial support, bank agglomeration can alleviate credit constraints on enterprise innovation (Tadesse, 2002; Zhang, 2022). Additionally, financial agglomeration can mitigate innovation risks, helping enterprises avoid inter-temporal risks associated with innovation activities (Levine and Zervos, 1998; Saintpaul, 1992). Agglomeration also promotes the efficient allocation of resources, leading to innovation in the surrounding area. Qu et al. (2020) finds that bank agglomeration is conducive to the improvement of enterprise innovation levels. As high-growth enterprises improve their innovation capabilities, they can optimize production processes. One key aspect of production optimization is improving energy efficiency and reducing carbon intensity (Wang et al., 2021). Accordingly, we propose hypothesis 2.
Hypothesis 2:. Bank agglomeration affects high-growth enterprise carbon intensity through improving the level of enterprise innovation.
Bank agglomeration encourages enterprises to prioritize green development (Feng et al., 2022; Qu et al., 2020). In China, the financial sector has played a significant role in transforming the energy structure (Ji and Zhang, 2019; Yuan et al., 2022). With the development of green finance, the annual green credit issued by banks is now included in assessments by regulatory authorities. Consequently, banks are more inclined to lend to green businesses, making it more difficult for high energy-consuming enterprises to obtain credit as easily as before (Yu and Zhou, 2023). Therefore, bank agglomeration indirectly promotes a cleaner energy structure for high-growth enterprises. As an enterprise’s energy structure improves—for example, by increasing the use of natural gas and reducing coal consumption—its carbon intensity decreases (Wang et al., 2021). Overall, bank agglomeration encourages high-growth enterprises to adopt cleaner energy sources, thereby reducing their carbon intensity. Therefore, we propose Hypothesis 3.
Hypothesis 3:. Bank agglomeration promotes the use of clean energy and then reduce high-growth enterprises’ carbon intensity.
Bank credit is the primary channel for Chinese enterprises to obtain external financing (Zhang, 2011). Bank agglomeration results in more abundant credit funds and increased competition among banks. Numerous studies suggest that financial agglomeration can help alleviate corporate financing constraints (Gao and Xu, 2023; Qu et al., 2020; Yuan et al., 2022). To capture market share, banks may lower the threshold for lending to enterprises. In this scenario, firms facing financing constraints benefit from bank agglomeration by gaining sufficient credit, which in turn improves their production activities (Chen, 2023). On the one hand, energy-efficient technologies and equipment often require substantial upfront investments. When financial constraints are eased, firms are more likely to invest in these technologies, which, in turn, lowers the energy consumption per unit of output, thereby reducing carbon intensity. On the other hand, enterprises with better access to finance can expand their operations and achieve economies of scale. This expansion can lead to more efficient use of resources and energy, resulting in lower carbon emissions per unit of output. Furthermore, financially healthy enterprises can afford to take a long-term strategic approach, investing in sustainability initiatives that may have higher upfront costs but ultimately reduce carbon emissions over time. Therefore, we propose Hypothesis 4.
Hypothesis 4:. Bank agglomeration promotes enterprise carbon emission reduction by easing enterprise financing constraints.
3 Data and variables
Before delving into the empirical results, this section details the data source and sample selection, the measures of the core variables, and the baseline model employed in this paper.
3.1 Data source and sample selection
The industrial enterprise data is sourced from the Chinese Industrial Enterprise Database, covering the period from 2001 to 2013. To obtain data on energy usage and pollution emissions, the Chinese Industrial Enterprise Database was matched with the Chinese Enterprise Pollution Database, following the methodology of Brandt et al. (2012). Enterprises with missing fuel usage data (coal, fuel oil, or natural gas) were excluded from the sample. Additionally, enterprises that were suspended, canceled, or newly established were also removed. The data on bank branches come from the financial license information disclosed on the official website of the China Banking and Insurance Regulatory Commission (CBIRC), which provided details on the number, type, longitude, and latitude of bank branches.
High-growth enterprises are identified using specific criteria. While there are various methods to measure high-growth enterprises, employee growth rate and turnover growth rate are the most commonly used metrics (Ahlfeldt et al., 2015; Barringer et al., 2005; Daunfeldt and Halvarsson, 2015). According to the OECD definition, a high-growth enterprise is one that achieves an average annual growth rate (in terms of employees or turnover) of more than 20% over 3 years, starting with at least 10 employees at the beginning of the growth period (Madzarevic-Sujster, 2013). Building on this literature, this study defines a high-growth enterprise as one whose annual labor productivity growth ranks in the top 10% of all enterprises. Labor productivity is calculated as the ratio of sales revenue from the main business product to the number of employees, capturing both employee growth and turnover growth.
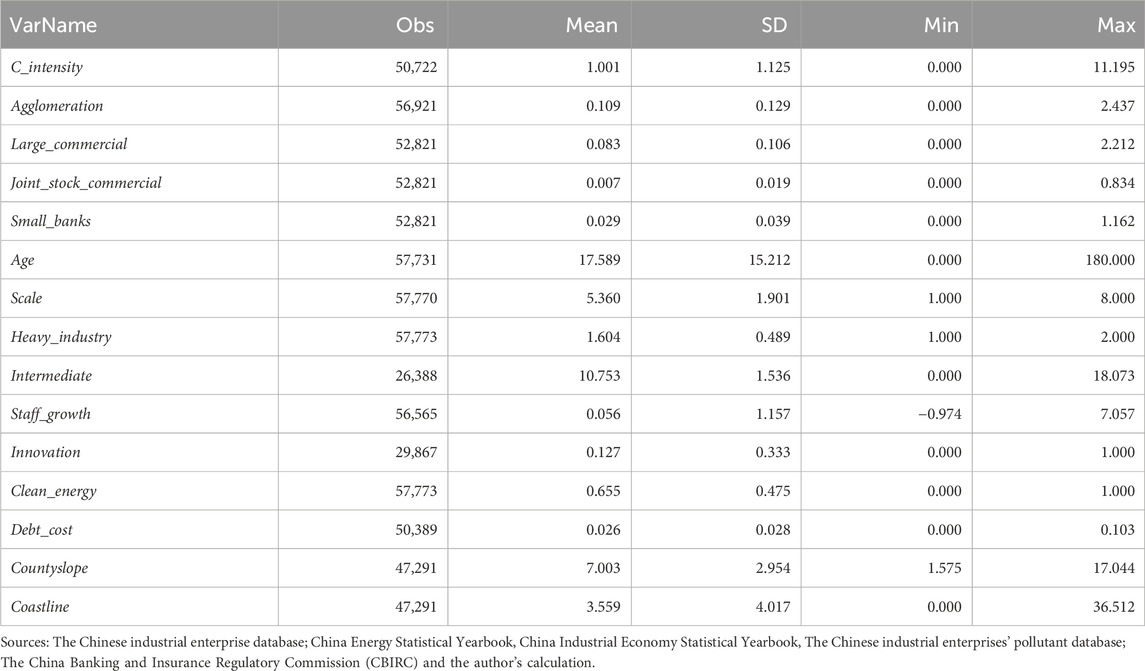
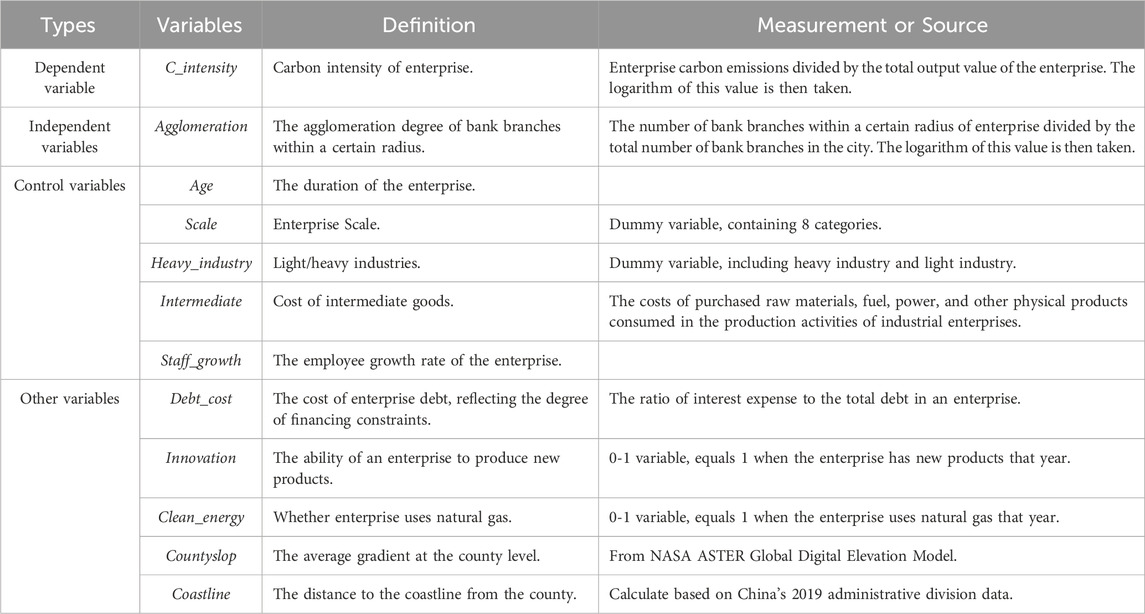
Table 1 shows descriptive statistics of the main variables. C_intensity is logarithmic carbon emissions per unit of output, ranging from 0 to 11.195. Agglomeration is the degree of bank agglomeration after taking the logarithm, which ranges from 0 to 2.437. Large_commercial, Joint_stock_commercial and Small_banks represent the agglomeration degree of three different types of bank outlets, respectively. Scale, Heavy_industry, Innovation and Clean_energy are categorical variables. Additionally, all continuous variables are winsorized. Detailed definitions and measurements of variables are provided in Table A1.
3.2 Core variables
3.2.1 Bank agglomeration
The effects of agglomeration externalities are complex. While some studies have empirically analyzed the relationship between agglomeration externalities and enterprise performance within cities or regions, they often fail to capture the variability of these effects within the same city or region (Ciccone and Hall, 1996; Glaeser and Maré, 2001; Ottaviano and Pinelli, 2006). Based on the relative independence of geographical information from other economic indicators, the core variable Agglomeration is defined as the number of bank branches within a certain radius of the enterprise divided by the total number of bank branches in the city. To calculate the number of bank branches around an enterprise, the longitude and latitude of each bank branch are matched with the enterprise’s office address, with a 10 km radius used in the baseline model. Since the number of branches changes over time, the degree of bank agglomeration is also calculated annually, providing continuous annual data on Agglomeration from 2001 to 2013.
The reason for choosing 10 km as the radius is that the cooperative banks of most enterprises are distributed within this range, and the banking competition within this range will have a significant impact on enterprises. Supporting this choice, the Federal Reserve’s 1993 National Survey of Small Business Finance (NSSBF) found that the median distance between enterprises and banks is 3 miles (4.8 km) (Berger et al., 2005). Additionally, a 2013 study of 290 cities in Sweden showed that the average distance between banks and enterprises in rural areas, urban areas, and megacities is 7.6 km, 4.8 km, and 2.5 km, respectively (Ho and Berggren, 2020). Therefore, selecting a 10 km radius is appropriate as it encompasses most banks associated with enterprises.
This spatial agglomeration indicator is less likely to suffer from endogeneity with economic development indicators such as regional population size and production efficiency, allowing for a more objective assessment of the effect of spatial agglomeration. Although there is no consensus in the agglomeration literature regarding the maximum geographical scope of agglomeration economies, most studies agree on the spatial decay of agglomeration externalities (Ahlfeldt et al., 2015; Arzaghi and Henderson, 2008; Di Addario and Patacchini, 2008; Koster et al., 2014; Rosenthal and Strange, 2008). Recent research also shows that agglomeration has a significant positive effect at medium distances (5–10 km) (Verstraten et al., 2019). Furthermore, to ensure the robustness of the regression results, this study tests the sensitivity of the findings to different radius.
3.2.2 Enterprise carbon intensity
The EIO-LCA is a widely accepted method of calculating carbon emissions (Matthews and Small, 2000), which is an economic model constructed by Carnegie Mellon University. With further extension, the EIO-LCA approach is used to evaluate the carbon footprint at the enterprise level (Wei et al., 2022). EIO-LCA method is used in our paper to calculate the enterprises’ carbon emissions.
Referring to Wei et al. (2022), we first calculate the carbon emissions of the industry. Then, we determine the carbon emissions for each enterprise based on its proportion within the industry. Finally, we calculate the carbon intensity of the enterprise.
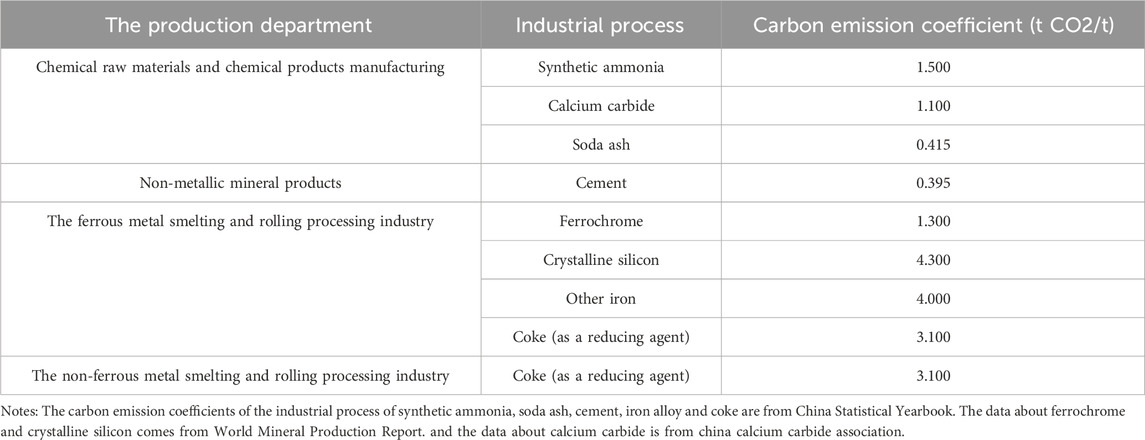
Firstly, Industrial carbon emissions consist of two components: emissions from the combustion of fossil fuels and emissions generated by the industrial production process in specific sectors. The carbon emission from fossil fuel combustion (
Where,
The calculation formula of carbon emissions in the industrial production process across various industries is shown in Equation 2.
Where
Secondly, in order to calculate the carbon footprint at the enterprise level, we match the production data of the enterprise with the data of the industry in which it operates as shown in Equation 3.
Where
From these calculations, we derive the total annual carbon emissions for each enterprise. This calculation accounts for both direct carbon emissions from energy consumption and emissions from industrial processes, thereby providing a more accurate representation of the carbon footprint distribution.
Thirdly, to calculate an enterprise’s carbon intensity, divide the enterprise’s annual carbon emissions by its total industrial output for the year, and then take the logarithm of the resulting ratio as shown in Equation 4.
Where,
3.3 Baseline model
To investigate the impacts of bank agglomeration on carbon emissions of high-growth enterprises, we estimate the following econometric model as shown in Equation 5.
Where i, t, c, and p denote enterprise, year, city, and industry, respectively. C_intensity represents the enterprise’s carbon emissions per unit output value. Agglomeration indicates the bank agglomeration within a certain radius of the enterprise.
4 Empirical results
Based on the sample selection and baseline model mentioned previously, this section examines the effect of bank competition on the carbon intensity of high-growth firms. And this paper performs several series of endogeneity treatment and robustness tests to ensure the reliability of the baseline results. Additionally, in order to explore the potential impact of firm attributes, bank types, and industry differences on this relationship, this paper estimates the baseline model for the different subsample.
4.1 Empirical facts
4.1.1 Bank agglomeration
The large-scale expansion of Chinese banks began in 1987 with the establishment of joint-stock commercial banks. Prior to this, China’s banking industry was dominated by a few state-owned banks. The number of banks further increased following the creation of city commercial banks in the mid-to-late 1990s, the shareholding reforms of state-owned banks, and the surge in bank IPOs after China’s entry into the WTO in the 21st century. As a result, newly established banks sought to capture market share by opening branches and sub-branches in various regions and expanding their business coverage.
The theoretical research on financial agglomeration mainly has two perspectives. One is the perspective of the industry life cycle. The geographical layout of an industry goes through five stages: incubation, growth, maturity, saturation, and decline. According to the research of Ren et al. (2010), China’s financial industry was in the incubation period before 2003 and in the growth period after 2003. Another is the perspective of new economic geography. In large cities with strong local market effects, the centripetal force is greater than the centrifugal force, and economic agglomeration is easy to occur (Krugman, 1992). The financial industry is in line with the mechanism of industrial agglomeration evolution (Grote, 2008).
Figure 1 illustrates the geographical location and distribution ratio of bank branches in China. In Figure 1A, it is evident that most branches are concentrated in developed areas, such as the Beijing-Tianjin-Hebei Economic Development Circle, the Yangtze River Delta Economic Development Circle, the Pearl River Delta Economic Development Circle, and the Chengdu-Chongqing Economic Development Circle. Figure 1B displays the proportion and total number of three types of bank branches in each province. Commercial banks have the highest proportion in most regions, followed by state-owned banks. In the southeastern region, branches are predominantly from commercial and state-owned banks, while the proportion of non-commercial banks is relatively higher in the central, western, and northeastern regions.
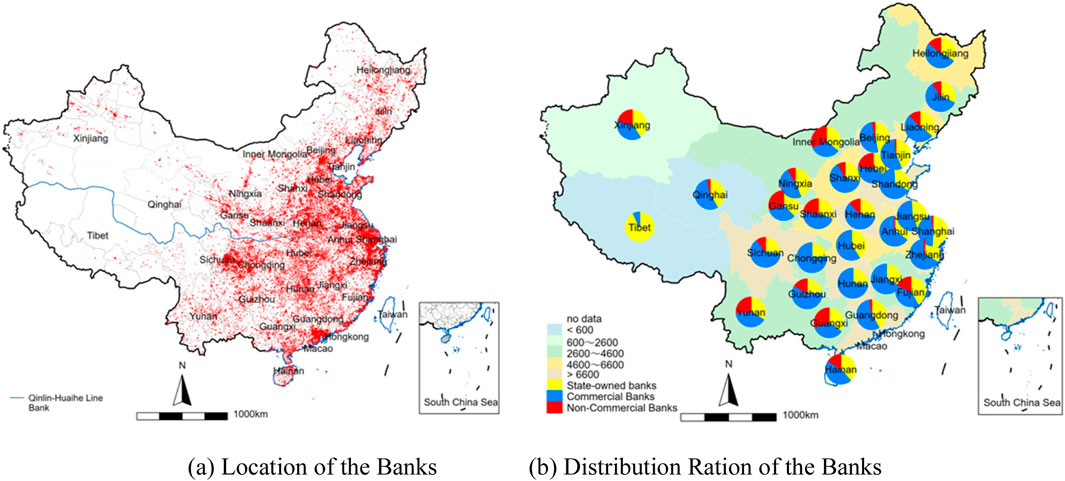
Figure 1. The location and distribution ration of banks. (A) Location of the banks (B) distribution ration of the banks.
4.1.2 Carbon intensity of high-growth enterprises
Carbon emissions from enterprise production account for more than 95% of total energy-related carbon emissions (Wan et al., 2021). Reducing enterprise carbon emissions is a primary focus of China’s carbon reduction initiatives. Among all enterprises, a small number exhibit rapid growth rates and are referred to as high-growth enterprises. Research on the carbon emissions of high-growth companies warrants greater attention (Wu et al., 2022).
Figure 2 illustrates the geographical location and carbon intensity of high-growth enterprises. These maps depict the spatial distribution of high-growth enterprises and their carbon intensity characteristics. In Figure 2A, it is evident that most high-growth enterprises are concentrated in developed areas, such as the Beijing-Tianjin-Hebei Economic Development Circle, the Yangtze River Delta Economic Development Circle, the Pearl River Delta Economic Development Circle, and the Chengdu-Chongqing Economic Development Circle. The incidence of high-growth enterprises is particularly high in the eastern coastal areas. In contrast, Figure 2B shows that the eastern coastal region, where high-growth enterprises are concentrated, has lower carbon intensity. High-growth enterprises in the northeastern and western regions exhibit relatively high carbon intensity.
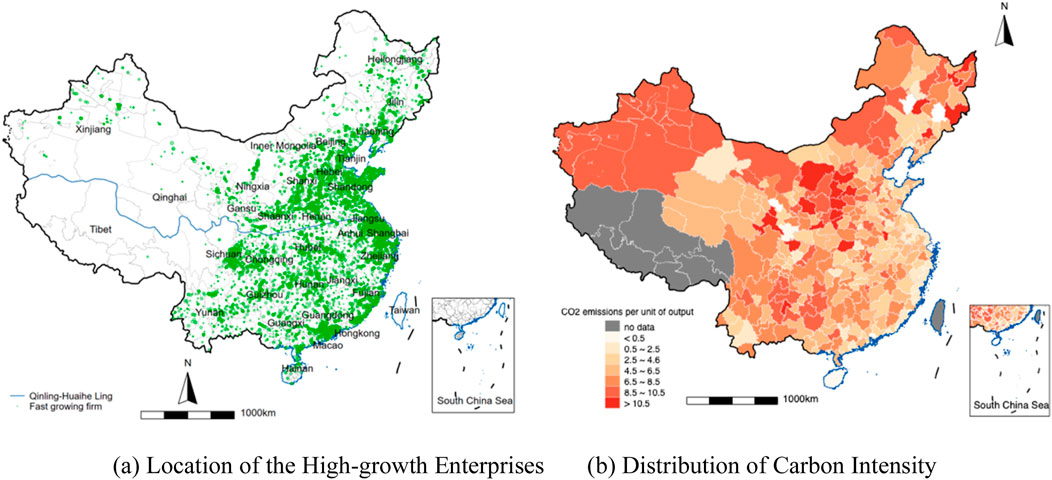
Figure 2. The location and carbon intensity distribution of high-growth enterprises. (A) Location of the high-growth enterprises (B) distribution of carbon intensity.
Combining Figures 1, 2, we observe that areas with a high density of bank branches also have a concentrated distribution of high-growth enterprises, and these enterprises tend to have lower carbon emissions. This suggests a potential correlation between bank agglomeration and the carbon intensity of high-growth enterprises.
4.2 Baseline results
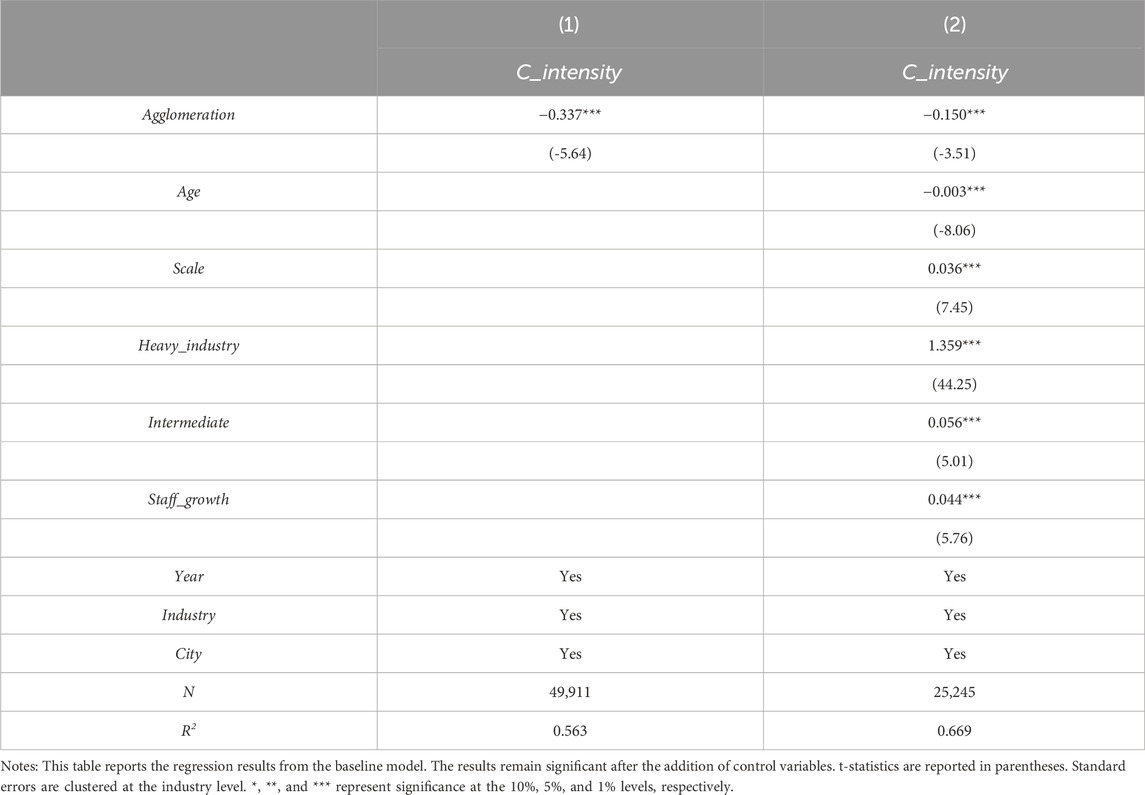
Table 4 presents the regression results of the baseline model, where the dependent variable is the carbon intensity of high-growth enterprises. In column (1), after controlling for year, city, and industry fixed effects, the coefficient of Agglomeration is significantly negative (−0.337). In column (2), after adding control variables such as Age, Scale, Heavy industry, Intermediate and Staff_growth, the coefficient of the main variable remains significantly negative (−0.15). These results suggest that bank agglomeration significantly reduces the carbon intensity of high-growth enterprises, providing support for Hypothesis 1.
4.3 Endogenous problem
4.3.1 Instrumental variable method
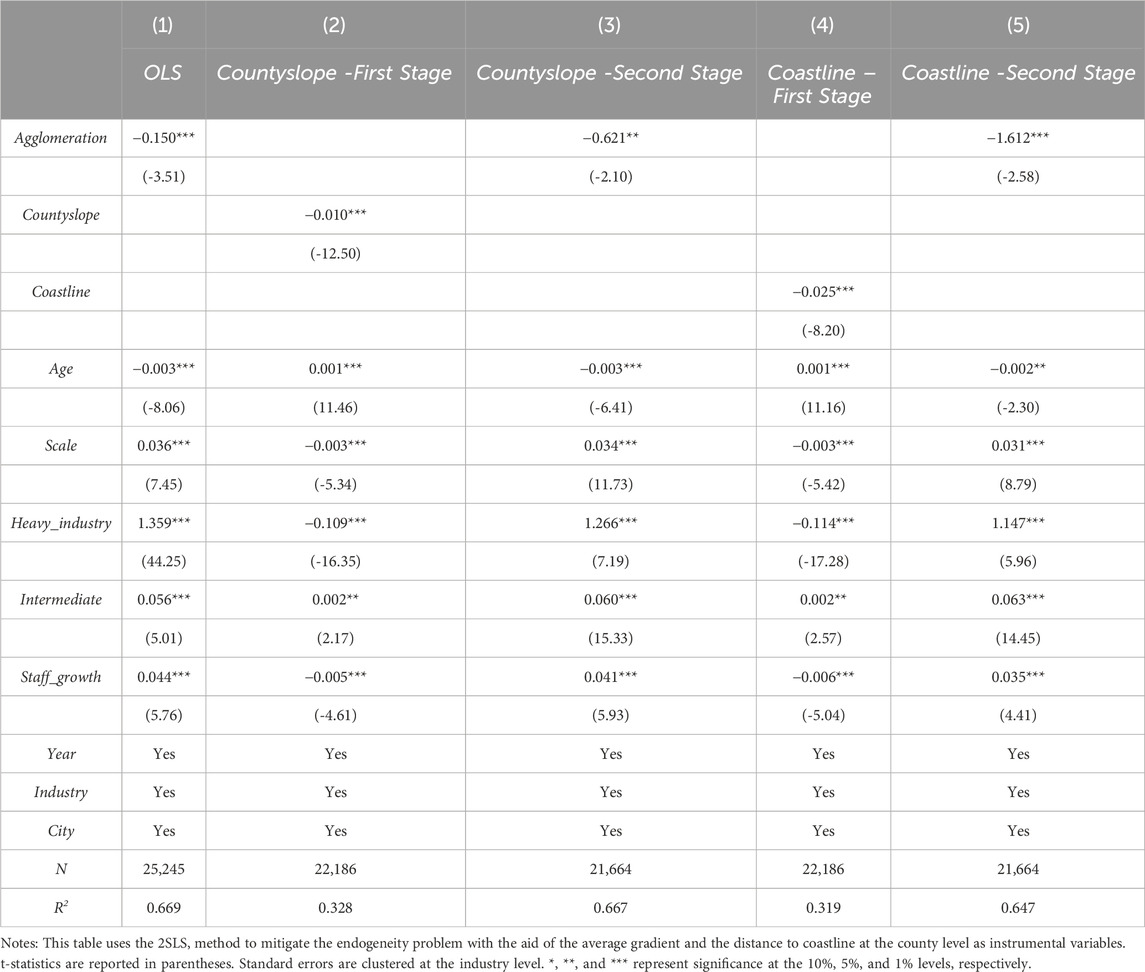
This paper uses Two-stage Least Squares (2SLS) method to alleviate the endogeneity problem. The average gradient (Countyslope) and the distance to the coastline (Coastline) at the county level are used as instrumental variables of bank agglomeration. On the one hand, the gradient/distance would not directly affect the carbon intensity of enterprises, which met the “exogeneity” assumption of instrumental variables. On the other hand, the gradient/distance has a strong correlation with bank agglomeration, which satisfies the “correlation” condition of the instrumental variable (Feng et al., 2022; Hu et al., 2009). The regression results are presented in Table 5. Column (1) shows the regression results using the OLS method, while columns (2) and (3) display the results of the 2SLS regression with Countyslope as the instrumental variable. In these columns, the coefficient of Agglomeration is significantly negative. Columns (4) and (5) show the results using Coastline as the instrumental variable, where the coefficient of Agglomeration remains significantly negative. Additionally, when Countyslope and Coastline are used as instrumental variables, the corresponding F-values are 377.475 and 88.474, respectively. Both F-values exceed the threshold of 10, which is generally considered an indication of strong instruments. This suggests that the two instruments have sufficient explanatory power, thereby reducing the bias associated with weak instruments.
4.3.2 Add control variables and remove specific years
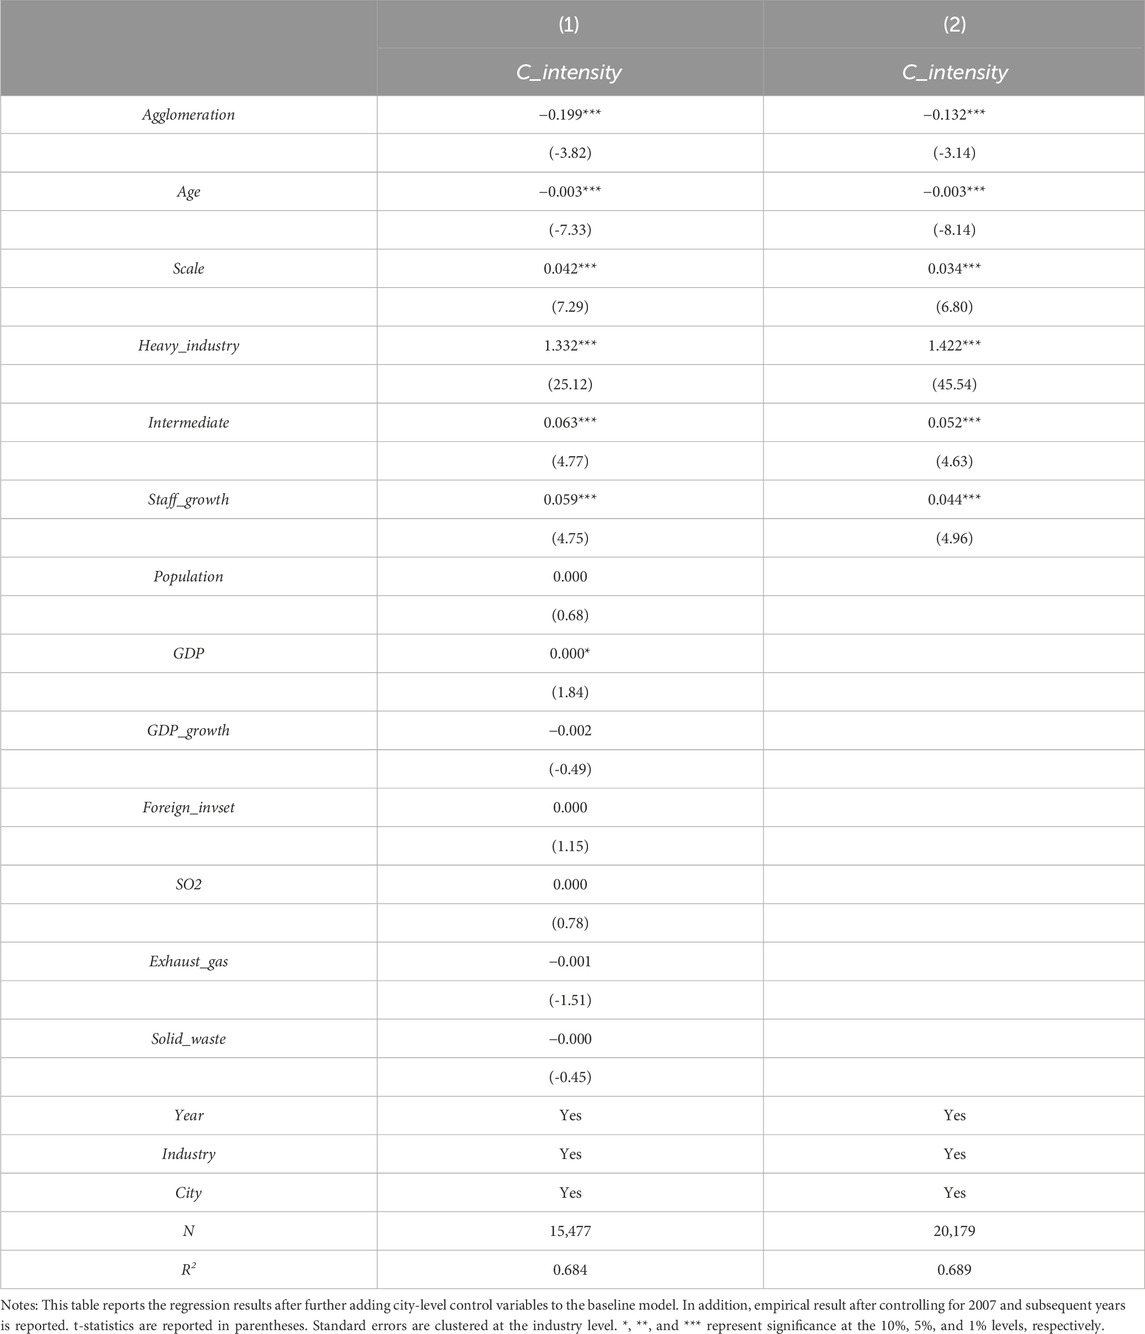
To overcome the potential missing variable problem, the city-level variables are added, including total urban population at the end of the year (Population), regional GDP (GDP), regional GDP growth rate (GDP_growth), actual foreign investment (Foreign_invset), industrial sulfur dioxide removal (SO2), number of waste gas treatment facilities (Exhaust_gas) and comprehensive utilization rate of general industrial solid waste (Solid_waste). The empirical results are shown in Column (1) of Table 6. The coefficient of Agglomeration is significantly negative, which is consistent with the baseline model. Furthermore, the influence of bank agglomeration on corporate carbon intensity could be affected by external policies, potentially leading to biased empirical results. In July 2007, the Chinese government issued the Opinions on Implementing Environmental Protection Policies and Regulations to Prevent Credit Risks, which called for credit controls on enterprises that failed to save energy and reduce emissions. Consequently, some reductions in corporate carbon intensity after 2007 may be attributed to the impact of this “restricted credit” policy. To eliminate the potential bias from this external policy, we exclude samples from 2007 and later. The new regression results, shown in column (2) of Table 6, indicate that the coefficient of Agglomeration remains significantly negative. This indicates that the basic conclusion still stands after excluding the influence of the “restricted credit” policy in 2007.
4.4 Robustness checks
4.4.1 Change the calculation method of enterprise carbon intensity
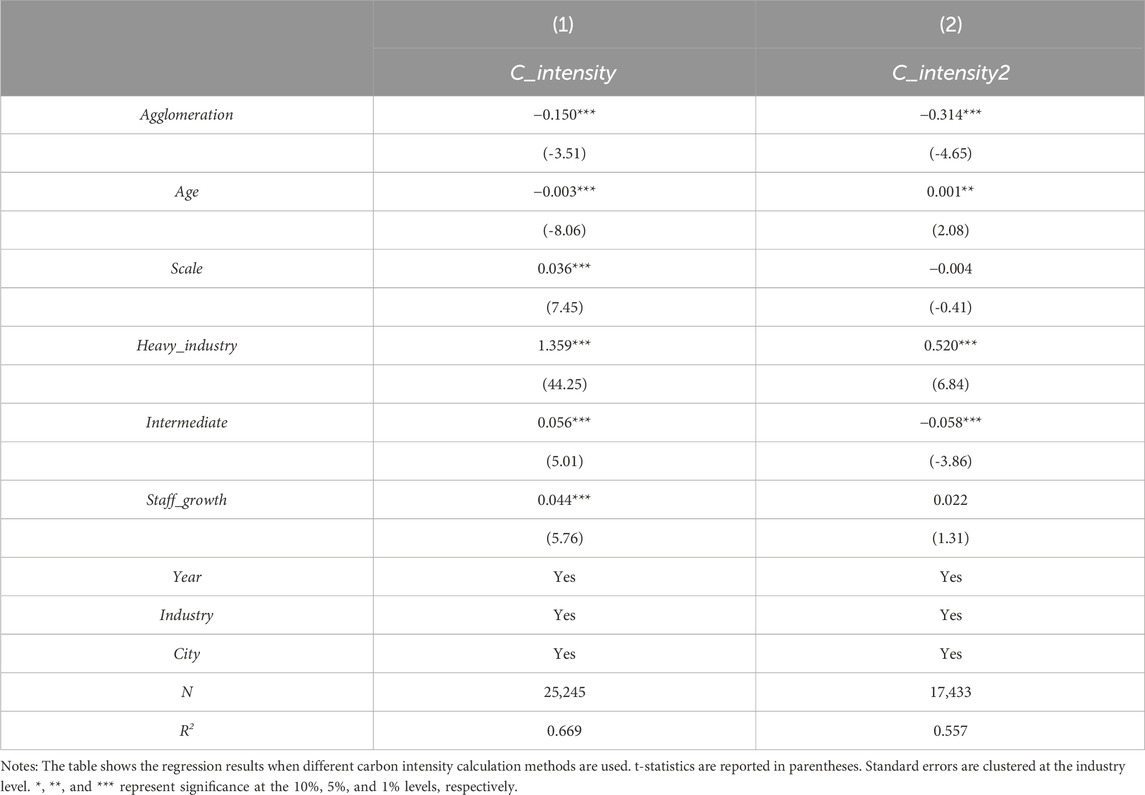
In addition to calculating corporate carbon emissions based on industry-level emissions, they can also be directly estimated from the fossil fuel consumption of enterprises. This approach is also employed in several studies on corporate carbon intensity in China (Chen and Zhu, 2022; Liu et al., 2022). The Chinese Industrial Pollution Database provides a limited range of data, including coal, natural gas, and fuel oil. Given that these three energy sources represent over 80% of the energy consumption in China’s industrial enterprises, we use them as the basis for estimating corporate CO2 emissions, following established references. Accordingly, an enterprise’s CO2 emissions are calculated as the sum of the consumption of coal, fuel oil, and natural gas, each multiplied by their respective carbon emission coefficients.
The formula is shown in Equation 6.
Similarly, carbon intensity equals CO2 emissions divided by the total output value of the enterprise (
Upon comparison, the two methods for calculating enterprise carbon intensity yield minimal differences. Detailed descriptive statistics can be found in Table A2. The first column in Table 7 is the result of baseline model, and the second column is the regression result after changing the calculation method of carbon intensity. After using the new enterprise carbon intensity data, the coefficients of the key variables are still significantly negative. The above results show that the results of this paper are robust to some extent.
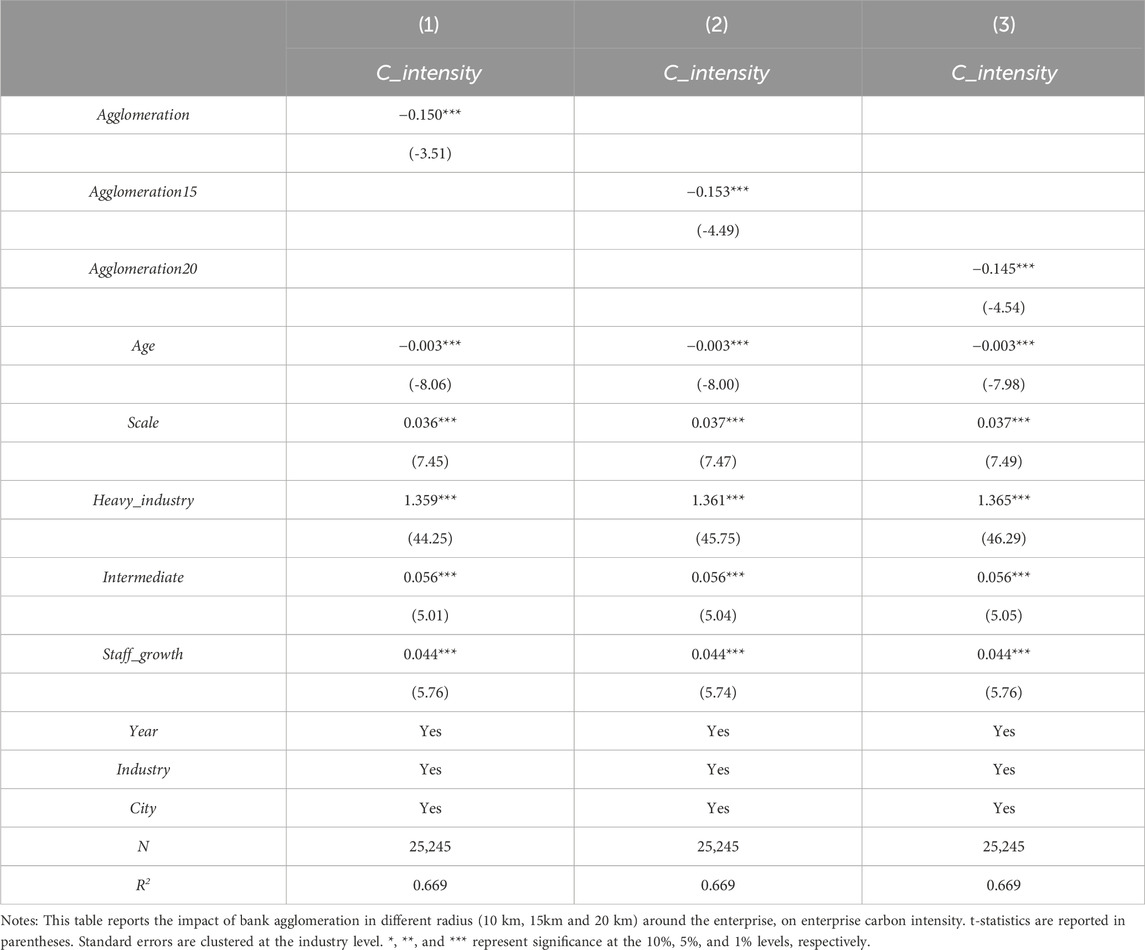
4.4.2 Bank agglomeration under different radius
In the baseline model, we use the number of bank branches within 10 km to the total number of branches in the city to describe the degree of bank agglomeration. To prove the robustness of the conclusion, we also use number of bank branches within 15 km and 20 km of the enterprise’s periphery to measure the degree of bank agglomeration. And the regression results are shown in Table 8. Column (1) shows the results of the baseline model, and columns (2)-(3) use bank agglomeration within the radius of 15 km and 20 km as explanatory variables, respectively. We can find that all the coefficients are significantly negative. Obviously, after replacing different measurement calibers, the conclusion that bank agglomeration can reduce the carbon intensity of enterprises is still the same.
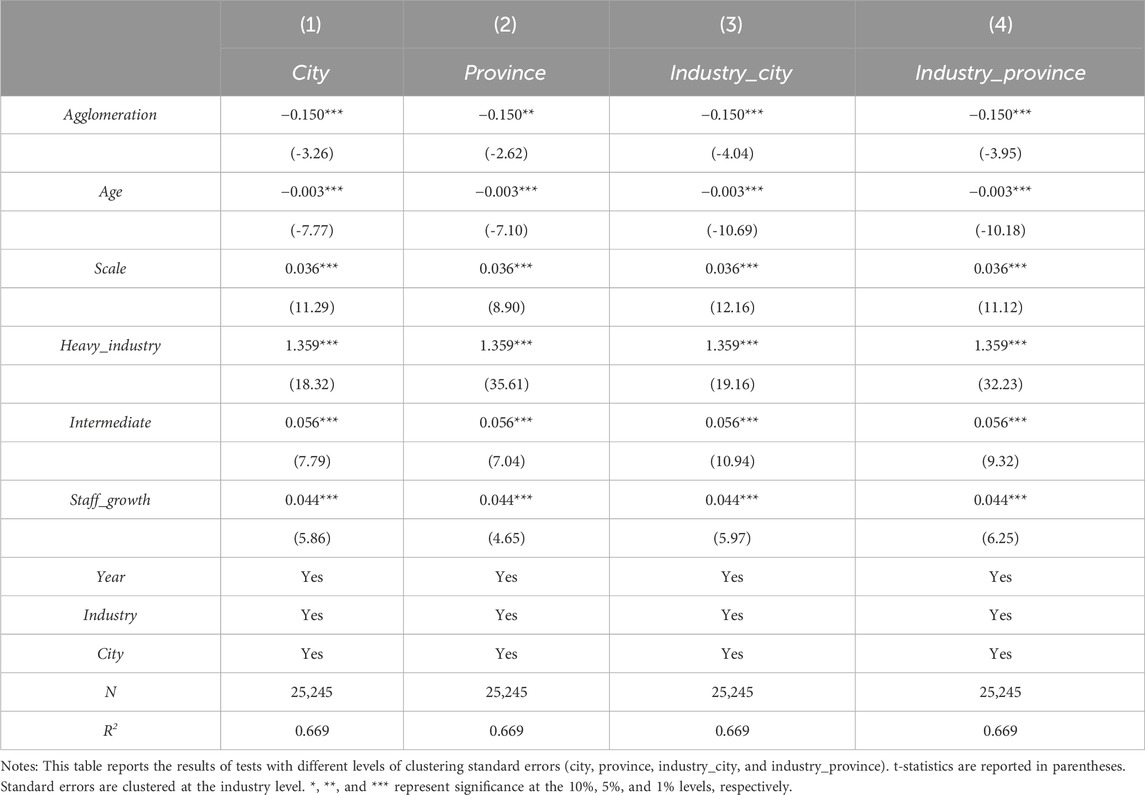
4.4.3 Different clustering criteria error
Since different levels of clustering will have different effects on the regression standard errors and coefficient significance levels, this paper replaces the clustering levels of the baseline results (clustered at the industry level) with city level, province level, industry-city level, and industry-province level, respectively. The results are reported in Table 9. From columns (1) to (4), it can be found that the core explanatory variable is significantly negative under different clustering levels, which is consistent with the baseline result.
4.5 Heterogeneous analysis
4.5.1 State-owned enterprises and non-state-owned enterprises
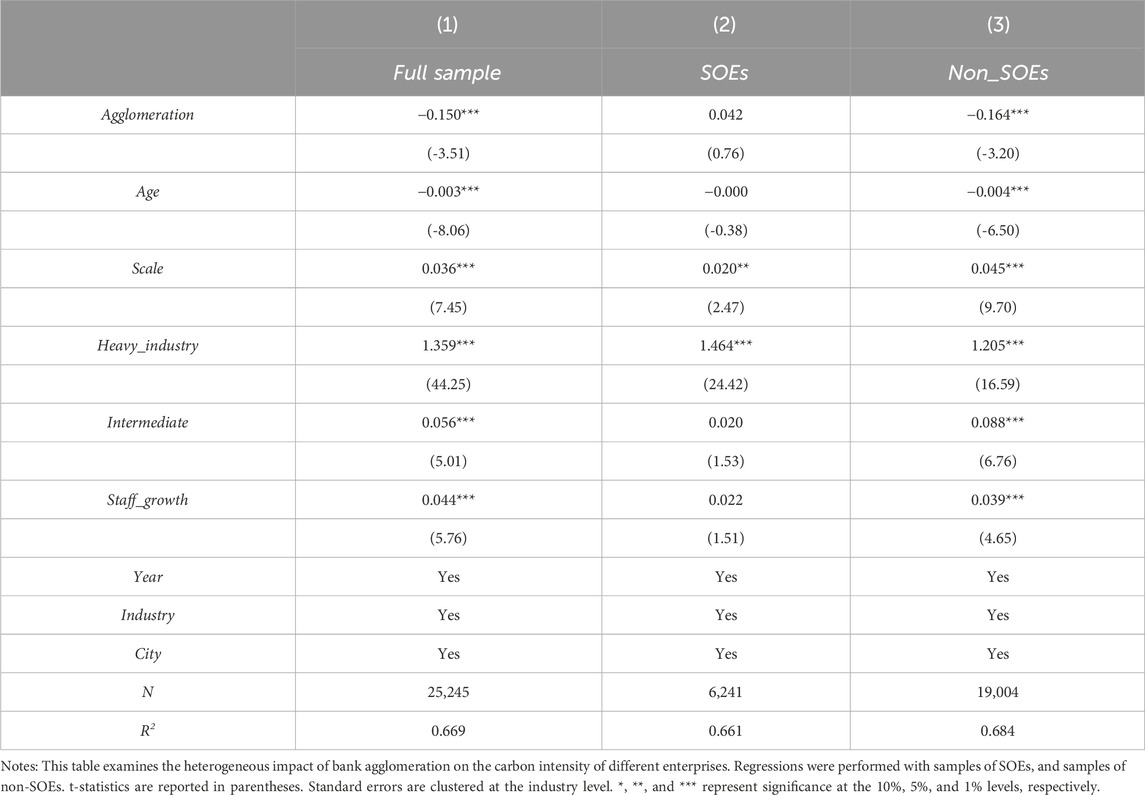
The impact of bank agglomeration on carbon reduction in high-growth enterprises may differ between state-owned enterprises (SOEs) and non-state-owned enterprises (non-SOEs). The property rights of enterprises can reflect institutional arrangements, which may influence low-carbon practices. Enterprises with different property rights vary in resource acquisition and management philosophy. To test for this heterogeneous effect, we perform separate regressions for the SOE and non-SOE samples, with the results presented in Table 10. Column (1) presents the empirical results for the full sample. Column (2) focuses on state-owned high-growth enterprises, where the coefficient of the main explanatory variable is not significant. Column (3) stands for the sample of non-state-owned high-growth enterprises, and the coefficient of the main explanatory variable is significantly negative (−0.164). These results indicate that bank agglomeration significantly promotes the carbon emission reduction in non-state-owned high-growth enterprises, but has no significant effect on state-owned enterprises. In China, state-owned enterprises, backed by government credit, are often well-funded and less influenced by banks. However, for non-state-owned enterprises, changes in the degree of bank competition may directly affect their capital cost and production behavior.
4.5.2 Different types of banks
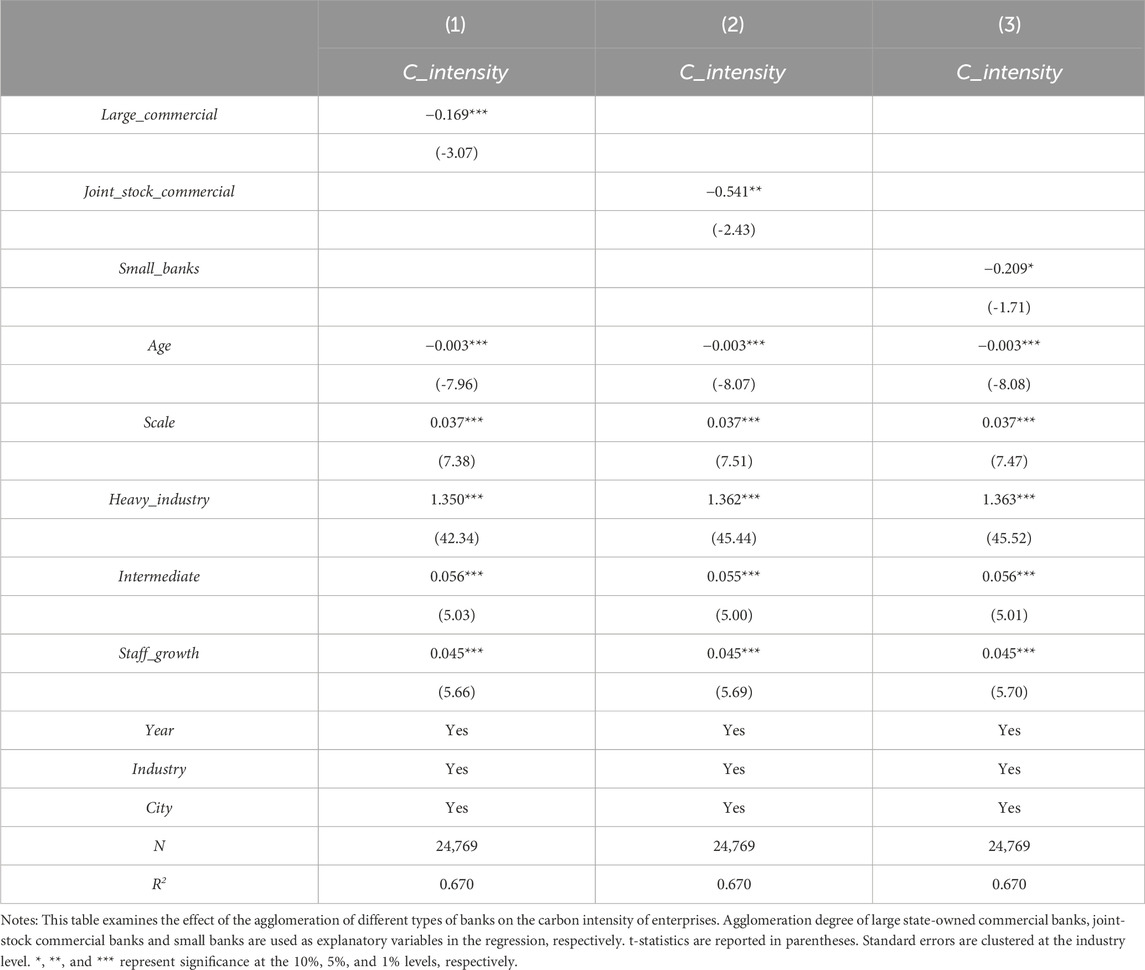
We separately examine the impact of the agglomeration of different types of banks on the carbon intensity of enterprises. Banks are categorized into three groups. The first category consists of large state-owned commercial banks1, which are directly controlled by the state. These 6 banks are substantial in size and have the most extensive branch networks in the country. The second category includes national joint-stock commercial banks, which are highly active in economic activities. The third category comprises other small banks that primarily provide services to local urban and rural enterprises and individuals. Following the bank agglomeration calculation method used in the baseline model, we separately calculate the agglomeration of large state-owned commercial banks, joint-stock commercial banks, and small banks within a 10 km radius of each enterprise. The agglomeration degrees of the three types of banks are then used as explanatory variables in the regression equation, with the results presented in Table 11.
The results show that all three types of banks have a significant negative impact on enterprise carbon intensity. Among them, the absolute value of the coefficient for joint-stock commercial bank agglomeration is the largest, suggesting that the concentration of joint-stock commercial banks around high-growth enterprises more effectively promotes carbon reduction. A possible explanation is that the ownership of joint-stock commercial banks is diversified, not limited to state ownership, which allows for more flexible and efficient operations. These banks can quickly respond to market needs, adapt to the low-carbon development trend of enterprises, provide green loans, and support companies in achieving green transformation.
4.5.3 High-energy-consuming industries and high-polluting industries
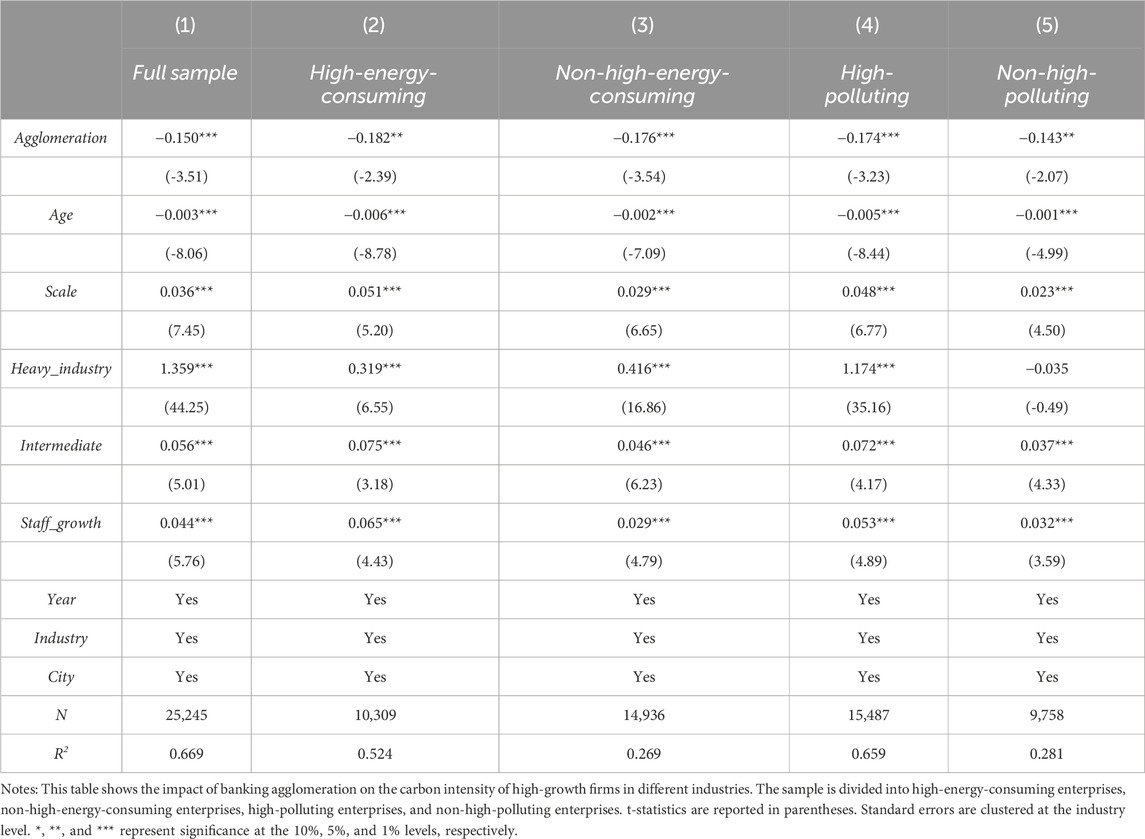
If bank agglomeration can facilitate a decline in carbon intensity within sectors characterized by elevated carbon emissions and pollution, it will serve to advance environmental conservation and sustainable development. To delve into the disparities among industries, the initial step necessitates distinguishing between industries with high carbon emissions and those with high pollution levels. Firstly, drawing from the high-energy-consuming industry roster delineated in the “2010 National Economic and Social Development Statistical Report” in China, the sample is divided into two sample groups: high-energy-consuming enterprises and non-high-energy-consuming enterprises. Subsequently, this paper re-estimates the baseline model for the subsample. The outcomes are summarized in columns (2) and (3) of Table 12. Notably, the coefficients of Agglomeration are positively significant in both columns, with a more pronounced magnitude observed in column (2). This underscores the discernible carbon reduction effect induced by bank agglomeration across both high-energy-consuming and non-high-energy-consuming enterprises, with a more pronounced impact observable within the former category.
Secondly, in 2008, the Ministry of Environmental Protection issued the “Classification and Management List of Environmental Protection Verification Industries for Listed Companies,” which delineated industries characterized by high levels of pollution. Based on this list, we categorize all enterprises into two groups: high-polluting enterprises and non-high-polluting enterprises. Subsequent regression analyses are conducted on these distinct sub-samples, with the resultant findings presented in columns (4) and (5) of Table 12. Consistent with the previous analysis, the coefficients associated with Agglomeration are markedly positive in both columns, with the absolute value of the coefficients in column (4) surpassing that in column (5). Thus, it is evident that bank agglomeration exerts a substantial carbon reduction influence on enterprises operating within both high-polluting and non-high-polluting industries, with the impact being more pronounced within the former category.
5 Mechanism analysis
The aforementioned discussion, through a series of tests, has demonstrated that increased bank competition is conducive to promotes the reduction of high-growth enterprise carbon intensity. However, the mechanism through which this influence operates remains unclear. Does it align with the theoretical hypothesis proposed in this paper, that bank competition can reduce the carbon intensity of firms by improving the level of enterprise innovation, changing the clean energy structure of enterprises and easing enterprise financing constraints? On this basis, this study further analyzes the possible mechanisms through the channels of “enterprise innovation,” “energy structure,” and “financing restriction” using a mediating effects model.
5.1 Enterprise innovation
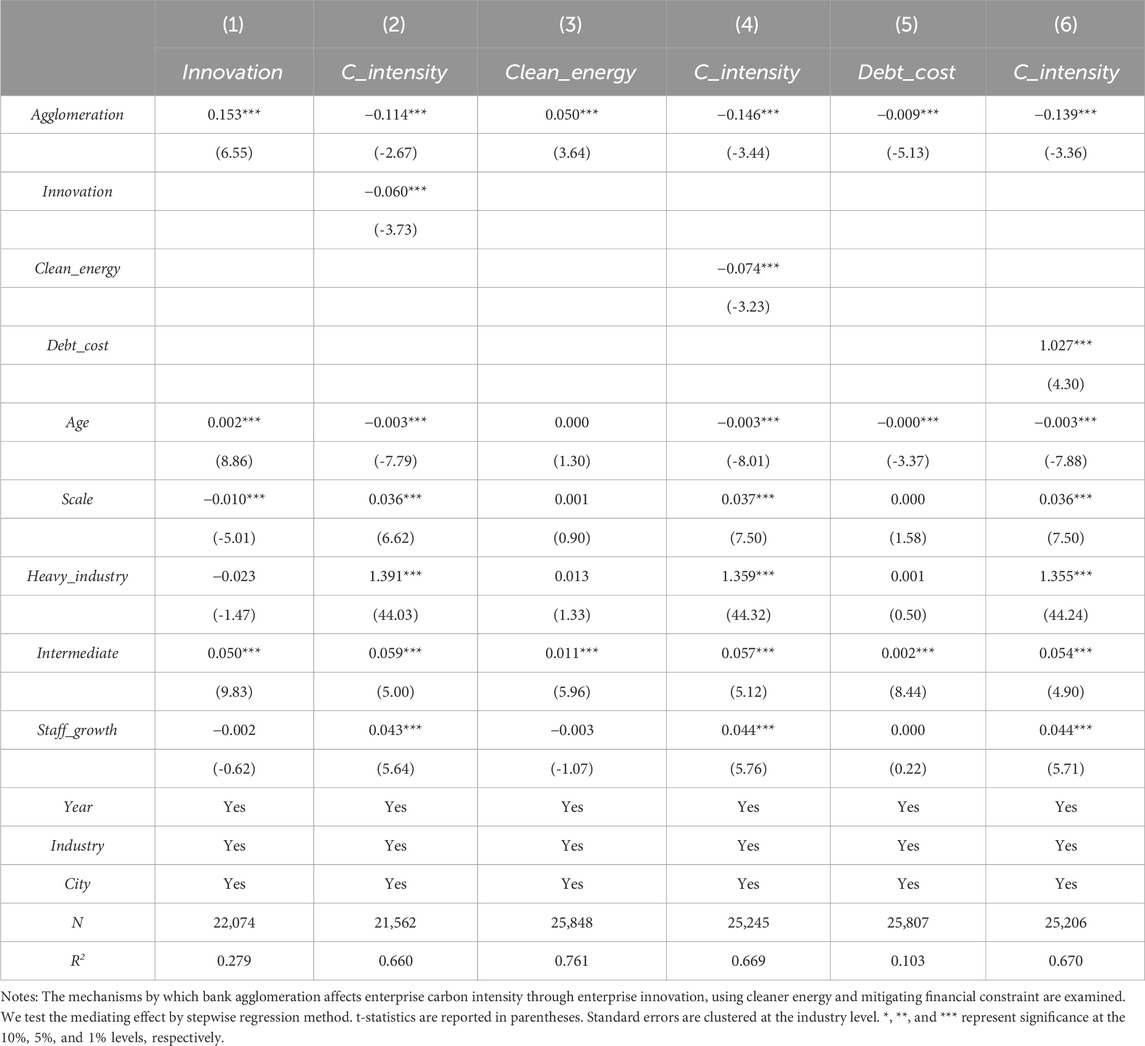
Bank agglomeration may affect the carbon intensity of high-growth enterprises by affecting their innovation. Given that not all industrial enterprises apply for patents, we use “whether there are new products” to represent the innovation ability of the enterprise (Xie and Gao, 2018; Yu et al., 2020). We construct a dummy variable Innovation that takes 1 when enterprise i has a new product in year t and 0 otherwise. The mediating effect model is used to test this mechanism. As shown in Equations 8–10.
The regression results are shown in columns (1) and (2) of Table 13. We find that the coefficient of Agglomeration in column (1) is significantly positive at the 1% level, indicating that bank agglomeration promotes enterprise innovation. The coefficient of Innovation in column (2) is significantly negative, displaying that innovation helps high-growth enterprise reduce carbon intensity. Moreover, after adding variable Innovation, the coefficient of Agglomeration is still significantly negative and its absolute value is less than the baseline model, indicating that bank agglomeration can promote high-growth enterprise carbon reduction by enhancing enterprise innovation (Hypothesis 2).
5.2 Energy structure
In order to verify that bank agglomeration affects high-growth enterprises’ carbon intensity by changing the clean energy structure of enterprises, we still use the intermediary effect model (Equations 8–10) for regression. An intuitive reflection of improving the clean energy structure of enterprises is replacing the use of coal and fuel oil with natural gas. We set the dummy variable Clean_energy, which takes 1 when enterprise i uses natural gas in year t and 0 in the rest of the cases. Replace Innovation in Equations 9,10, with Clean_energy, and the results are shown in columns (3) and (4) of Table 13. The coefficient of Agglomeration in column (3) is significantly positive at the 1% level, indicating that bank agglomeration promotes enterprises’ use of clean energy. The coefficient of Clean_energy in column (4) is significantly negative, revealing that using clean energy helps reduce the carbon intensity of enterprises. After adding Clean_energy, the coefficient of Agglomeration is still significantly negative and its absolute value is less than the baseline model, which reveals the establishment of Hypothesis 3.
5.3 Financing restriction
The connection between banks and industrial enterprises is mainly through credit. The agglomeration of bank branches helps to increase the supply of credit, thereby reducing the debt cost of enterprises and easing financing constraints (Li et al., 2020), which in turn affects the carbon intensity of enterprises. With reference to pertinent literature (Beck et al., 2006; Gorodnichenko and Schnitzer, 2013; Rakshit and Bardhan, 2023), Debt_cost is used to measure the degree of financing constraints faced by enterprises. Debt_cost is the ratio of interest expense to the total debt in an enterprise. Replace Innovation in Equations 9,10, with Debt_cost, and the results are shown in columns (5) and (6) of Table 13. The results show that the coefficient of Agglomeration in column (5) is significantly negative, while the coefficient of Debt_cost in column (6) is significantly positive. After adding Debt_cost to the model, the coefficient of Agglomeration is still significantly negative and its absolute value is less than the baseline model. The above evidence shows that the agglomeration of banks significantly promotes the reduction of enterprise debt cost, and then promotes the reduction of enterprise carbon intensity. The mechanism of bank agglomeration promoting enterprise carbon emission reduction by easing enterprise financing constraints (Hypothesis 4) has been verified.
6 Conclusion and policy implications
This paper studies the influence of banking agglomeration on the carbon intensity of enterprise. Instead of working with province-level or city-level spatial units, this paper uses a radius of 10 km as the spatial unit, focusing on evaluating the influence of bank competition around enterprises on high-growth enterprises’ CO2 emissions at the micro level. Overall, the findings indicate that increased bank agglomeration reduces the carbon intensity of high-growth enterprises. This effect is prominent in non-state-owned enterprises but not significant for state-owned enterprises. Additionally, the agglomeration of large state-owned commercial banks, joint-stock commercial banks and small banks all significantly reduce high-growth enterprise carbon intensity, with joint-stock commercial banks having the most substantial carbon reduction effect. Bank agglomeration has a notably strong impact on carbon reduction in enterprises within high-energy-consuming and high-polluting industries. Furthermore, the mechanism analysis shows that bank agglomeration reduces the carbon intensity of high-growth enterprises by promoting innovation, using more cleaner energy, and mitigating financial constraint. In order to mitigate the endogeneity problem, using instrumental variables, adding control variables, and excluding samples from specific years are adopted in this paper. A series of robustness tests are also conducted to strengthen the reliability of the conclusions.
These results suggest several policy implications that are critical for aligning economic development with environmental sustainability. First, while central and local policies are often geared towards fostering economic growth, it is imperative that these policies also consider their impact on CO2 emissions. The significant role of bank agglomeration in reducing carbon intensity highlights the need for policies that encourage the clustering of banks around enterprises. Second, the government should actively incentivize banks to expand their branch networks, particularly in industrial regions, and consider easing superfluous restrictions on foreign banks. This would not only enhance competition within the banking sector but also amplify the role of finance in combating global warming and achieving sustainable development. By fostering a more competitive financial environment, banks are more likely to support enterprise-level carbon emission reduction efforts. Moreover, banks should be encouraged to provide preferential interest rates for projects related to green technology innovation and environmental conservation. This would motivate enterprises to invest in upgrading their production equipment and implementing energy-saving and emission-reduction projects. Such financial incentives could play a pivotal role in mitigating greenhouse gas emissions and accelerating the global transition towards green development. Finally, specific policies should be developed to enhance the responsiveness of state-owned enterprises to bank agglomeration, potentially through reforms in their financial and governance structures. These recommendations, if implemented, could significantly contribute to the dual goals of economic growth and environmental sustainability, positioning the financial sector as a key player in the global fight against climate change.
Although this paper has explored the correlation between bank agglomeration and CO2 emissions of high-growth firms, there are some limitations in the research process. First, this paper only explores the impact of bank agglomeration on the carbon emissions of enterprises. The follow-up studies could further study other forms of financial agglomeration, such as securities and insurance. Second, although several factors that may lead to endogeneity have been considered in this paper and an instrumental variables method is used to identify the correlation relationship between bank competition and CO2 emissions of high-growth enterprises, There may still be other factors that interfere with the identification of this correlation. Future research could try to use exogenous shocks to identify this correlation relationship.
Data availability statement
The original contributions presented in the study are included in the article/Supplementary Material; further inquiries can be directed to the corresponding author.
Author contributions
LX: Conceptualization, Data curation, Formal Analysis, Investigation, Methodology, Resources, Software, Validation, Visualization, Writing–original draft, Writing–review and editing. DL: Conceptualization, Data curation, Formal Analysis, Investigation, Methodology, Software, Validation, Visualization, Writing–original draft, Writing–review and editing. JS: Conceptualization, Funding acquisition, Project administration, Resources, Supervision, Visualization, Writing–original draft, Writing–review and editing.
Funding
The author(s) declare that no financial support was received for the research, authorship, and/or publication of this article.
Conflict of interest
The authors declare that the research was conducted in the absence of any commercial or financial relationships that could be construed as a potential conflict of interest.
Publisher’s note
All claims expressed in this article are solely those of the authors and do not necessarily represent those of their affiliated organizations, or those of the publisher, the editors and the reviewers. Any product that may be evaluated in this article, or claim that may be made by its manufacturer, is not guaranteed or endorsed by the publisher.
Footnotes
1Commercial banks include the Industrial and Commercial Bank of China, Agricultural Bank of China, Bank of China, China Construction Bank, Postal Savings Bank of China, and Bank of Communications.
References
Ahlfeldt, G. M., Redding, S. J., Sturm, D. M., and Wolf, N. (2015). The economics of density: evidence from the Berlin wall. Econometrica 83, 2127–2189. doi:10.3982/ECTA10876
Al-Silefanee, R. R., Mamkhezri, J., Khezri, M., Karimi, M. S., and Khan, Y. A. (2022). RETRACTED: effect of islamic financial development on carbon emissions: a spatial econometric analysis. Front. Environ. Sci. 10, 850273. doi:10.3389/fenvs.2022.850273
Alt, J. E., and Dreyer Lassen, D. (2006). Fiscal transparency, political parties, and debt in OECD countries. Eur. Econ. Rev. 50, 1403–1439. doi:10.1016/j.euroecorev.2005.04.001
Anyadike-Danes, M., and Hart, M. (2018). All grown up? The fate after 15 years of a quarter of a million UK firms born in 1998. J. Evol. Econ. 28, 45–76. doi:10.1007/s00191-017-0549-x
Arzaghi, M., and Henderson, J. V. (2008). Networking off madison avenue. Rev. Econ. Stud. 75, 1011–1038. doi:10.1111/j.1467-937X.2008.00499.x
Barringer, B. R., Jones, F. F., and Neubaum, D. O. (2005). A quantitative content analysis of the characteristics of rapid-growth firms and their founders. J. Bus. Ventur 20, 663–687. doi:10.1016/j.jbusvent.2004.03.004
Beck, T., Demirguc-Kunt, A., Laeven, L., and Maksimovic, V. (2006). The determinants of financing obstacles. J. Int. Money Finan. 25, 932–952. doi:10.1016/j.jimonfin.2006.07.005
Bekhet, H. A., Matar, A., and Yasmin, T. (2017). CO2 emissions, energy consumption, economic growth, and financial development in GCC countries: dynamic simultaneous equation models. Renew. Sust. Energ. Rev. 70, 117–132. doi:10.1016/j.rser.2016.11.089
Berger, A. N., Miller, N. H., Petersen, M. A., Rajan, R. G., and Stein, J. C. (2005). Does function follow organizational form? Evidence from the lending practices of large and small banks. J. Financ. Econ. 76, 237–269. doi:10.1016/j.jfineco.2004.06.003
Bleda, M., and del Rio, P. (2013). The market failure and the systemic failure rationales in technological innovation systems. Res. Policy 42, 1039–1052. doi:10.1016/j.respol.2013.02.008
Brandt, L., Van Biesebroeck, J., and Zhang, Y. (2012). Creative accounting or creative destruction? Firm-level productivity growth in Chinese manufacturing. J. Dev. Econ. 97, 339–351. doi:10.1016/j.jdeveco.2011.02.002
Brown, R., Mawson, S., and Mason, C. (2017). Myth-busting and entrepreneurship policy: the case of high growth firms. Entrep. Reg. Dev. 29, 414–443. doi:10.1080/08985626.2017.1291762
Chen, P. (2023). Corporate social responsibility, financing constraints, and corporate carbon intensity: new evidence from listed Chinese companies. Environ. Sci. Pollut. Res. 30, 40107–40115. doi:10.1007/s11356-023-25176-5
Chen, Y., and Li, L. (2023). Differential game model of carbon emission reduction decisions with two types of government contracts: green funding and green technology. J. Clean. Prod. 389, 135847. doi:10.1016/j.jclepro.2023.135847
Chen, Y., and Zhu, Z. (2022). Liability structure and carbon emissions abatement: evidence from Chinese manufacturing enterprises. Environ. Resour. Econ. 83, 481–507. doi:10.1007/s10640-022-00649-2
Ciccone, A., and Hall, R. E. (1996). Productivity and the density of economic activity. Am. Econ. Rev. 86, 54–70. doi:10.3386/w4313
Daunfeldt, S.-O., and Halvarsson, D. (2015). Are high-growth firms one-hit wonders? Evidence from Sweden. Small Bus. Econ. Group 44, 361–383. doi:10.1007/s11187-014-9599-8
Di Addario, S., and Patacchini, E. (2008). Wages and the city. Evidence from Italy. Labour Econ. 15, 1040–1061. doi:10.1016/j.labeco.2007.09.003
Esso, L. J., and Keho, Y. (2016). Energy consumption, economic growth and carbon emissions: cointegration and causality evidence from selected African countries. Energy 114, 492–497. doi:10.1016/j.energy.2016.08.010
Fan, W., Wang, F., Liu, S., Chen, T., Bai, X., and Zhang, Y. (2023). How does financial and manufacturing co-agglomeration affect environmental pollution? Evidence from China. J. Environ. Manage. 325, 116544. doi:10.1016/j.jenvman.2022.116544
Feng, Y., Gao, Y., Meng, X., Shi, J., Shi, K., Hu, S., et al. (2023). The impacts of casual environmental regulation on carbon intensity in China: dual mediating pathways of energy low-carbon reconstitution and industrial structure upgrading. Environ. Res. 238, 117289. doi:10.1016/j.envres.2023.117289
Feng, Y., Zou, L., Yuan, H., and Dai, L. (2022). The spatial spillover effects and impact paths of financial agglomeration on green development: evidence from 285 prefecture-level cities in China. J. Clean. Prod. 340, 130816. doi:10.1016/j.jclepro.2022.130816
Gao, J., Hua, G., and Huo, B. (2024). Green finance policies, financing constraints and corporate ESG performance: insights from supply chain management. Oper. Manag. Res. doi:10.1007/s12063-024-00509-w
Gao, Y., and Xu, J. (2023). Bank competition and firm labor investment efficiency: evidence from China. Emerg. Mark. Financ. Trade 59, 2283–2297. doi:10.1080/1540496X.2023.2179875
Glaeser, E. L., and Maré, D. C. (2001). Cities and skills. J. Labor Econ. 19, 316–342. doi:10.1086/319563
Gorodnichenko, Y., and Schnitzer, M. (2013). Financial constraints and innovation: why poor countries don’t catch up. J. Eur. Econ. Assoc. 11, 1115–1152. doi:10.1111/jeea.12033
Grote, M. H. (2008). Foreign banks’ attraction to the financial centre Frankfurt - an inverted ’U’-shaped relationship. J. Econ. Geogr. 8, 239–258. doi:10.1093/jeg/lbm042
Hasegawa, T., Fujimori, S., Takahashi, K., Yokohata, T., and Masui, T. (2016). Economic implications of climate change impacts on human health through undernourishment. Clim. Change 136, 189–202. doi:10.1007/s10584-016-1606-4
Ho, C. S. T., and Berggren, B. (2020). The effect of bank branch closures on new firm formation: the Swedish case. Ann. Reg. Sci. 65, 319–350. doi:10.1007/s00168-020-00986-4
Hu, Y., Fang, Y., Feng, Z., and Zheng, X. (2009). “The relief degree of land surface and its correlation with population distribution in urban agglomerations of China,” in 2009 international conference on industrial and information systems (IEEE), 97–100. doi:10.1109/IIS.2009.52
Ji, Q., and Zhang, D. (2019). How much does financial development contribute to renewable energy growth and upgrading of energy structure in China? Energy Policy 128, 114–124. doi:10.1016/j.enpol.2018.12.047
Koster, H. R. A., van Ommeren, J., and Rietveld, P. (2014). Agglomeration economies and productivity: a structural estimation approach using commercial rents. Economica 81, 63–85. doi:10.1111/ecca.12038
Levine, R. (1997). Financial development and economic growth: views and agenda. J. Econ. Lit. 35, 688–726. Available at: https://www.jstor.org/stable/2729790.
Levine, R., and Zervos, S. (1998). Stock markets, banks, and economic growth. Am. Econ. Rev. 88, 537–558. Available at: https://www.jstor.org/stable/116848.
Li, S., Fu, H., Wen, J., and Chang, C.-P. (2020). Separation of ownership and control for Chinese listed firms: effect on the cost of debt and the moderating role of bank competition. J. Asian Econ. 67, 101179. doi:10.1016/j.asieco.2020.101179
Liu, Y., Li, Q., and Zhang, Z. (2022). Do smart cities restrict the carbon emission intensity of enterprises? Evidence from a quasi-natural experiment in China. Energies 15, 5527. doi:10.3390/en15155527
Love, I., and Peria, M. S. M. (2015). How Bank competition affects firms’ access to finance. World bank econ. Rev 29, 413–448. doi:10.1093/wber/lhu003
Madzarevic-Sujster, S. (2013). Croatia: a strategy for smart, sustainable and inclusive growth. Washington, DC: World Bank.
Matthews, H. S., and Small, M. J. (2000). Extending the boundaries of life-cycle assessment through environmental economic input-output models. J. Industrial Ecol. 4, 7–10. doi:10.1162/108819800300106357
Mei, B., Abu Sufyan Ali, M., Khan, I., and Luo, J. (2023). Analyzing the mediating role of industrial structure in the spatial spillover effects of financial agglomeration on carbon emission and regional heterogeneity. Environ. Sci. Pollut. Res. 31, 46669–46685. doi:10.1007/s11356-023-26786-9
Ottaviano, G. I. P., and Pinelli, D. (2006). Market potential and productivity: evidence from Finnish regions. Reg. Sci. Urban Econ. 36, 636–657. doi:10.1016/j.regsciurbeco.2006.06.005
Qu, C., Shao, J., and Shi, Z. (2020). Does financial agglomeration promote the increase of energy efficiency in China? Energy Policy 146, 111810. doi:10.1016/j.enpol.2020.111810
Rakshit, B., and Bardhan, S. (2023). Does bank competition affect the transmission mechanism of monetary policy through bank lending channel? Evidence from India. J. Asian Econ. 86, 101595. doi:10.1016/j.asieco.2023.101595
Riti, J. S., Shu, Y., Song, D., and Kamah, M. (2017). The contribution of energy use and financial development by source in climate change mitigation process: a global empirical perspective. J. Clean. Prod. 148, 882–894. doi:10.1016/j.jclepro.2017.02.037
Rosenthal, S. S., and Strange, W. C. (2008). The attenuation of human capital spillovers. J. Urban Econ. 64, 373–389. doi:10.1016/j.jue.2008.02.006
Sai, R., Lin, B., and Liu, X. (2023). The impact of clean energy development finance and financial agglomeration on carbon productivity in Africa. Environ. Impact Assess. Rev. 98, 106940. doi:10.1016/j.eiar.2022.106940
Saintpaul, G. (1992). Technological choice, financial-markets and economic-development. Eur. Econ. Rev. 36, 763–781. doi:10.1016/0014-2921(92)90056-3
Salahuddin, M., Alam, K., Ozturk, I., and Sohag, K. (2018). The effects of electricity consumption, economic growth, financial development and foreign direct investment on CO2 emissions in Kuwait. Renew. Sust. Energ. Rev. 81, 2002–2010. doi:10.1016/j.rser.2017.06.009
Shahbaz, M., Nasir, M. A., and Roubaud, D. (2018). Environmental degradation in France: the effects of FDI, financial development, and energy innovations. Energy Econ. 74, 843–857. doi:10.1016/j.eneco.2018.07.020
Shahbaz, M., Tiwari, A. K., and Nasir, M. (2013). The effects of financial development, economic growth, coal consumption and trade openness on CO2 emissions in South Africa. Energy Policy 61, 1452–1459. doi:10.1016/j.enpol.2013.07.006
Shahzad, S. J. H., Kumar, R. R., Zakaria, M., and Hurr, M. (2017). Carbon emission, energy consumption, trade openness and financial development in Pakistan: a revisit. Renew. Sust. Energ. Rev. 70, 185–192. doi:10.1016/j.rser.2016.11.042
Shi, M. (2022). Forecast of China’s carbon emissions under the background of carbon neutrality. Environ. Sci. Pollut. Res. 29, 43019–43033. doi:10.1007/s11356-021-18162-2
Sultana, N., Rahman, M. M., Khanam, R., and Islam, K. M. Z. (2022). The causative factors of environmental degradation in South Asia. J. Asian Econ. 79, 101452. doi:10.1016/j.asieco.2022.101452
Tadesse, S. (2002). Financial architecture and economic performance: international evidence. J. Financ. Intermed. 11, 429–454. doi:10.1006/jfin.2002.0352
Tamazian, A., and Rao, B. B. (2010). Do economic, financial and institutional developments matter for environmental degradation? Evidence from transitional economies. Energy Econ. 32, 137–145. doi:10.1016/j.eneco.2009.04.004
Verstraten, P., Verweij, G., and Zwaneveld, P. J. (2019). Complexities in the spatial scope of agglomeration economies. J. Reg. Sci. 59, 29–55. doi:10.1111/jors.12391
Wan, X., Jiang, T., Li, S., and Nie, J. (2021). China’s carbon emissions structure and reduction potential on the supply-side and demand-side of energy: under the background of four influencing factors. PLoS One 16, e0255387. doi:10.1371/journal.pone.0255387
Wang, F., and Yang, F. (2018). A review of research on China’s carbon emission peak and its forcing mechanism. Chin. J. Popul. Resour. Environ. 16, 49–58. doi:10.1080/10042857.2018.1433810
Wang, J., Wang, L., and Qian, X. (2021). Revisiting firm innovation and environmental performance: new evidence from Japanese firm-level data. J. Clean. Prod. 281, 124446. doi:10.1016/j.jclepro.2020.124446
Wang, S., and Liu, X. (2017). China’s city-level energy-related CO2 emissions: spatiotemporal patterns and driving forces. Appl. Energy 200, 204–214. doi:10.1016/j.apenergy.2017.05.085
Wang, X., and Zhang, Q. (2022). Impact of financial agglomeration on carbon emission efficiency under the economic growth pressure. China Popul. Resour. and Environ. 32. doi:10.12062/cpre.20220110
Wei, P., Li, Y., Ren, X., and Duan, K. (2022). Crude oil price uncertainty and corporate carbon emissions. Environ. Sci. Pollut. Res. 29, 2385–2400. doi:10.1007/s11356-021-15837-8
Wu, X., Zhou, S., Xu, G., Liu, C., and Zhang, Y. (2022). Research on carbon emission measurement and low-carbon path of regional industry. Environ. Sci. Pollut. Res. 29, 90301–90317. doi:10.1007/s11356-022-22006-y
Wu, Y., Peng, B., and Lao, Y. (2023). The emission reduction effect of financial agglomeration under China’s carbon peak and neutrality goals. Int. J. Environ. Res. Public Health 20, 950. doi:10.3390/ijerph20020950
Xiao, Y.-H., Jiang, Y.-P., Du, M., Gan, S.-J., Tan, Z.-T., Tan, X.-X., et al. (2021). A new carbon emission reduction mechanism: carbon Generalized System of Preferences (CGSP). Environ. Sci. Pollut. Res. 28, 1267–1274. doi:10.1007/s11356-020-11670-7
Xie, X., and Gao, Y. (2018). Strategic networks and new product performance: the mediating role of ambidextrous innovation. Technol. Anal. Strateg. Manage. 30, 811–824. doi:10.1080/09537325.2017.1380790
Ren, Y., You, W., and Cheng, X. (2010). Modern service industry competitiveness evaluation model and its application. J. Statistics Inf. Forum 25 (10), 65–69.
Yu, L., Duan, Y., and Fan, T. (2020). Innovation performance of new products in China’s high-technology industry. Int. J. Prod. Econ. 219, 204–215. doi:10.1016/j.ijpe.2019.06.002
Yu, S., Zheng, S., Li, X., and Li, L. (2018). China can peak its energy-related carbon emissions before 2025: evidence from industry restructuring. Energy Econ. 73, 91–107. doi:10.1016/j.eneco.2018.05.012
Yu, X., and Zhou, Y. (2023). Green credit policy and green transition of high-pollution enterprises: a perspective from emission reduction and development-all databases. Available at: https://webofscience.clarivate.cn/wos/alldb/full-record/CSCD:7493558.
Yuan, H., Zhang, T., Hu, K., Feng, Y., Feng, C., and Jia, P. (2022). Influences and transmission mechanisms of financial agglomeration on environmental pollution. J. Environ. Manage. 303, 114136. doi:10.1016/j.jenvman.2021.114136
Zhang, L. (2022). Bank competition, financing constraints, and enterprise innovation investment. Discrete Dyn. Nat. Soc. 2022, 7399321. doi:10.1155/2022/7399321
Zhang, Y.-J. (2011). The impact of financial development on carbon emissions: an empirical analysis in China. Energy Policy 39, 2197–2203. doi:10.1016/j.enpol.2011.02.026
Zhang, Z.-H., Ling, D., Yang, Q.-X., Feng, Y.-C., and Xiu, J. (2024). Central environmental protection inspection and carbon emission reduction: a tripartite evolutionary game model from the perspective of carbon neutrality. Pet. Sci. 21, 2139–2153. doi:10.1016/j.petsci.2023.11.014
Zhao, X., Jiang, M., and Zhou, Y. (2023). The impact of the digital economy on carbon emission intensity: evidence from China. Front. Environ. Sci. 11, 1119246. doi:10.3389/fenvs.2023.1119246
Ziolo, M., Kluza, K., and Spoz, A. (2019). Impact of sustainable financial and economic development on greenhouse gas emission in the developed and converging economies. Energies 12, 4514. doi:10.3390/en12234514
Appendix
Keywords: bank agglomeration, carbon intensity, carbon reduction, high-growth enterprise, energy structure, sustainable development
Citation: Xu L, Lu D and Shi J (2024) Impact and mechanism analysis of bank agglomeration on high-growth enterprise carbon intensity: evidence from China. Front. Environ. Sci. 12:1428522. doi: 10.3389/fenvs.2024.1428522
Received: 06 May 2024; Accepted: 30 September 2024;
Published: 24 October 2024.
Edited by:
Huwei Wen, Nanchang University, ChinaReviewed by:
Yanchao Feng, Zhengzhou University, ChinaYufeng Chen, Zhejiang Normal University, China
Copyright © 2024 Xu, Lu and Shi. This is an open-access article distributed under the terms of the Creative Commons Attribution License (CC BY). The use, distribution or reproduction in other forums is permitted, provided the original author(s) and the copyright owner(s) are credited and that the original publication in this journal is cited, in accordance with accepted academic practice. No use, distribution or reproduction is permitted which does not comply with these terms.
*Correspondence: Danning Lu, bHVkYW5uaW5nQHllYWgubmV0
 Ling Xu
 Danning Lu
 Jianxun Shi