 Wang Jing
 Zhang Yang1,3
94% of researchers rate our articles as excellent or good
Learn more about the work of our research integrity team to safeguard the quality of each article we publish.
Find out more
ORIGINAL RESEARCH article
Front. Environ. Sci. , 06 August 2024
Sec. Drylands
Volume 12 - 2024 | https://doi.org/10.3389/fenvs.2024.1425199
This article is part of the Research Topic Soil and Water Loss and Environmental Effects View all 8 articles
The Loess Plateau is an important region for soil and water conservation and ecological construction in China. Exploring the spatio-temporal variations in soil conservation and water conservation services and their relationships in Loess Plateau under the background of land consolidation projects is of great significance for ecological protection and quality development in the Yellow River Basin. Taking Yan’an city as the research area, this paper used the InVEST model to quantitatively evaluated spatio-temporal variation characteristics and trade-off/synergy relationship of the soil conservation and water conservation services from 2010 to 2018. According to the implementation data, the relationship between the gully control and land consolidation (GCLC) project in various counties of Yan’an city and soil conservation and water conservation service was analyzed. The results showed that the total amount of soil conservation services in Yan’an City were 4.07 × 10⁶ t and 3.75 × 10⁶ t in 2010 and 2018 with a decrease of 7.76%, and with low spatial clustering characteristic. The total amount of water conservation services were 2.01 × 1010 mm and 2.03 × 1010 mm in 2010 and 2018 with a increase of 0.56%, and with high spatial clustering characteristic. There is a synergistic relationship between soil conservation and water conservation services in most area of Yan’an city. From 2010 to 2018, the effect of the GCLC projects on soil conservation and water conservation services in Yan’an city is not significant. The GCLC project can effectively alleviate the situation of sharp decline of cultivated land area and insufficient food production capacity.
Ecosystem services refer to the biological resources, natural environmental conditions and utility provided for human survival through ecosystems and ecological processes (Costanza et al., 1997). Ecosystem service assessment plays an important role in regional development, ecological protection and human wellbeing. Ecosystem services are mainly divided into four types: supply, regulation, support and cultural services (Costanza et al., 1997; Ouyang and Wang, 2000). Among them, soil conservation and water conservation are two ecosystem service functions, which play important regulating and supporting roles in precipitation storage, runoff regulation, soil erosion prevention and groundwater replenishment, etc. (Costanza et al., 1998; MEA, 2005). It also plays an important role in the energy flow and material circulation of the ecosystem (Li et al., 2013). As different types of ecological services have different emphases on human well-being, and their spatial distribution is unbalanced, there are competition or mutually beneficial relations between ecological components and natural resources, and there are synergistic or tradeoff relations of mutual influence (Jopke et al., 2015). Therefore, exploring the temporal and spatial characteristics of soil conservation and water conservation ecosystem service functions and their relationships can provide scientific basis for the formulation of ecological protection policies and the implementation of ecological projects. A number of scholars have analyzed the characteristics of soil conservation and water conservation services changes and their relationships in different regions. Turner et al. (2014) studied the spatial distribution and interaction of 11 ecosystem services in Denmark, and analyzed the relationship between them and the cultural landscape of Denmark. Mousavi et al. (2023) regarded soil conservation and water conservation services as the two main ecosystem services provided by the rangeland ecosystem, and studied the external costs caused by the loss of rangeland ecosystem services in the central part of Iran. Gao and Zuo (2021) used models to evaluate and simulate the functions of soil conservation and water conservation at various scales in Beijing, China, and analyzed the trade-offs among them.
The Loess Plateau located in the middle of the Yellow River Basin, and it is the region with most serious soil and water loss in the world. According to the “Bulletin on Soil and Water Conservation in the Yellow River Basin (2021)” (Yellow River Conservancy Commission, 2022), the soil and water loss area of the Loess Plateau is 231,300 square kilometers, accounting for 89.2% of the soil and water loss area of the Yellow River Basin. It is also an important area of soil and water conservation and ecological construction in China, which plays a very important role in the ecological protection and high-quality development strategy of the Yellow River basin. Yan’an city is the most representative city on the Loess Plateau in northern Shaanxi province. As the key and demonstration area of “Grain for Green” (GFG) project, the largest ecological environment construction project in China in the 21st century, the vegetation area of the Yan’an city has been greatly increased during this period, effectively curbing soil erosion, greatly improving the natural ecological environment and the value of regional ecosystem services (He, 2015; Han et al., 2021). However, with the further advancement of the project, problems such as the reduction of cultivated land, the tension between people and land, and the prominent contradiction between people and grain in some areas have emerged (Chen et al., 2015). In view of the special geomorphology in the hilly and gully region of the Loess Plateau, in order to increase the cultivated land area and ensure food security, Yan’an city has carried out the The Gully Control and Land Consolidation (GCLC) project, which is a new management model that includes dam system construction, old dam restoration, saline-alkali land transformation, development and utilization of waste and unused land and ecological construction (Han et al., 2021). The comprehensive remediation of mountains, water, forests, fields, trees and villages aims to increase the cultivated land area in the Loess Plateau, ensure food security and solve the contradiction between people and land (Li et al., 2016).
At present, the research on the ecosystem service value in the Loess Plateau and Yan’an city mainly focuses on the period of the GFG projects, which is manifested as the improvement of regional ecosystem service value, such as the increase of soil conservation (Deng et al., 2020) and the synergistic development of relations (Wang et al., 2021). There are also some studies on ecological and environmental changes under the background of the GCLC projects, mainly focusing on soil fertility (Ma et al., 2020), hydrological changes (Jin et al., 2019) and vegetation cover changes (He et al., 2020). However, there are few quantitative studies on ecosystem services of soil conservation and water conservation.
Therefore, taking Yan’an city as the study area, this study used InVEST model and ArcGIS to quantitatively analyze the temporal and spatial distribution and variation characteristics of regional water conservation and soil conservation ecosystem service functions before and after the GCLC project from 2010 to 2018, and revealed their tradeoff/synergy relationship. On this basis, the study analyzes the relationship between the project and the change of two ecosystem services. The aim is to provides scientific basis and decision support for the ecological benefit evaluation, the formulation of ecological protection policy and the implementation of ecological projects of the Loess Plateau.
Yan’an city (35°20′39′−37°53′31′N, 107°38′59′−110°34′46′E) is located in the hinterland of the Loess Plateau, in the middle reaches of the Yellow River, and is 256 km wide from east to west and 236 km long from south to north, with a total area of 37,037 km2 (Figure 1). It is characterized by a semi-humid and semi-arid continental monsoon climate, with cold and dry winters and hot and rainy summers. The average annual precipitation is 562.1 mm, and is relatively concentrated in summer (July–September). The annual average temperature is 9°C, and the average frost-free period is 179 days. There is more than one crop but less than two crops a year. Yan’an city is a loess hilly and gully region, with high terrain in the northwest and low terrain in the southeast. The north is dominated by loess hills and gullies, accounting for 72% of the total area. The south is dominated by loess plateau gullies, accounting for 19% of the total area and stone mountains account for 9% of the total area. The main feature of the river system distribution in Yan’an city is a deep trunk with dense branches. There are 20,889 channels over 1,000 m in the territory. The terrain in the area is fragmented, with various gullies and ravines. The gully is strongly cut down by a large slope and serious soil erosion. Yan’an city has 1 district and 12 counties, 16 street offices, 84 towns and 12 townships, with a total population of 2.19 million.
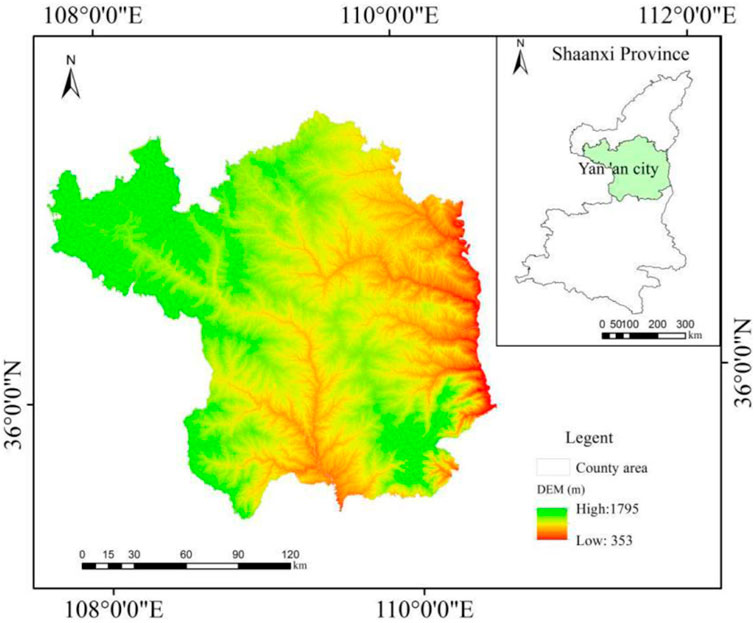
Figure 1. Location and elevation of the study area.
The GCLC project of Yan’an city was first piloted in Baota District, Zichang County and Yanchuan County in 2010. In September 2012, it was listed as a major national land consolidation project and given support. In November 2013, it was officially approved (Liu, 2013). The project involved 13 counties and districts of the city, with a total of 197 subprojects, which were implemented intensively from 2013 to 2017. The construction scale was 36,986.22 hm2, the new farmland area was 7,848.72 hm2, and the high-standard farmland area was 28,233.29 hm2, with an investment of 3.664 billion yuan (Table 1). At the same time, the GFG project in Yan’an city has entered the consolidation stage in 2010. The forest coverage rate of the city reached 36.6%, and the regional ecological environment was greatly restored. In 2013, Yan’an city carried out a new round of the GFG project, planning to gradually return all sloping farmland above 25° to forest, and achieve full afforestation of steep slopes and full forest and grass cover.
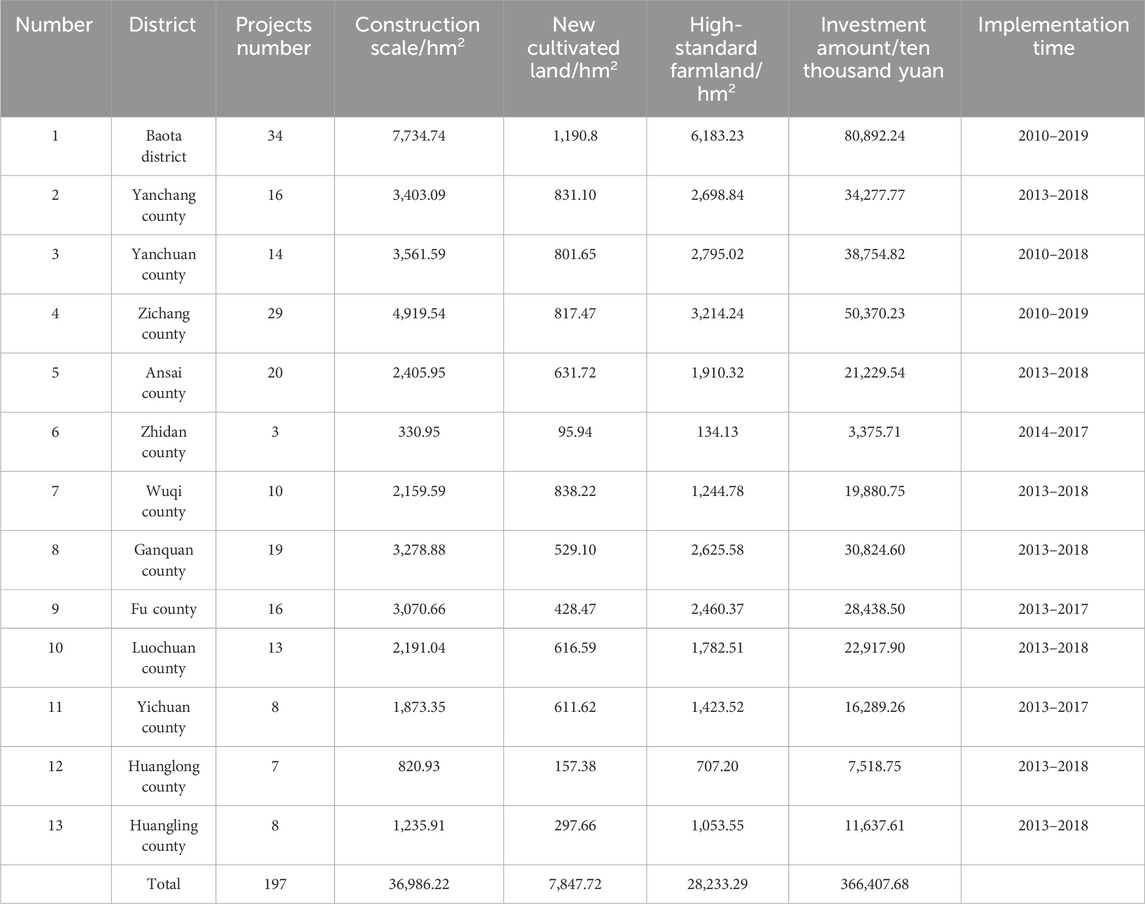
Table 1. Implementation scale of GCLC project in various counties of Yan’an city.
The basic data used in this study include land use data, elevation data, meteorological data, soil data, and data on the GCLC project. The land use data in 2010 and 2018 are from the Data Center for Resources and Environmental Sciences, Chinese Academy of Sciences (http://www.resdc.cn), with a spatial resolution of 30 m. According to the land use/land cover change (LUCC) classification system established by Liu (1996), land use types were divided into 6 primary classifications and 18 secondary classifications. Elevation data were obtained from the Geospatial Data Cloud Platform (http://www.gscloud.cn) (ASTER GDEM data product) with a spatial resolution of 30 m. The DEM was used to fill the depressions, calculate the flow direction, calculate the cumulative amount of convergence and other operations in ArcGIS to extract the vector map of sub-basins. Meteorological data were obtained from the National Scientific Data Center for the Tibetan Plateau (tpdc.ac.cn) -China 1 km resolution Monthly Precipitation Dataset (1901–2020), with a spatial resolution of 1 km. The soil data were from the Harmonized World Soil Database (HWSD) soil dataset (v1.2) of the National Scientific Data Center for the Tibetan Plateau (https://data.tpdc.ac.cn), which included soil texture, soil organic carbon content, vegetation available water content, root depth and other data, with a spatial resolution of 1 km. The data on the GCLC project are from The GCLC project leading group office of Yan’an city.
The SDR (sediment transport ratio) module of the InVEST model is used to calculate potential soil erosion based on terrain, climate and soil data, and actual soil erosion based on the cover-management factor and soil and water conservation factor. The difference between the two is the soil conservation amount on the raster unit. The calculation formulas are Equations 1–3:
where, RKLSi is the potential soil erosion of pixel i (t/hm2) and USLEi is the soil erosion amount of pixel i under the action of cover-management factors and soil and water conservation factors (t/hm2). SRi is the actual soil retention on pixel i(t/hm2); Ri is the rainfall erosivity factor, calculated by Wischmeier’s monthly scale formula (Wischmeier and Smith, 1958). Ki is the soil erodibility factor estimated by EPIC model (Williams, 1990); LSi is the slope length-gradient factor, which is calculated from DEM data; Ci is the cover-management factor and Pi is the soil and water conservation factor.
Based on the principle of the water cycle, the water conservation module of the InVEST model obtains water yield by calculating parameters such as precipitation, plant transpiration, surface evaporation, root depth and soil depth. The calculation formulas are Equations 4–10:
where, Yxj is the annual water yield (mm) in pixel x of land use type j; PX is the annual precipitation in pixel x (mm); AETxj is the annual actual evapotranspiration in pixel x (mm). ωX is the ratio of annual water requirement to annual precipitation on vegetation; Rxj is the Budyko dryness index in pixel x of land use type j, and represents the ratio of potential evaporation to precipitation. Z is the seasonal constant between 0 and 30; AWCX is the available water content of vegetation (mm). PAWCx is vegetation available water; SAN, SIL, CLA, and C are the contents of sand, silt, clay and organic carbon (%), respectively. kxj is the evapotranspiration coefficient of vegetation, representing the ratio of vegetation evapotranspiration ET and potential evapotranspiration ET0x at different growth stages. RA is the radiation from the top layer of the atmosphere (MJ/m2/d); Tavg is the average of the mean daily maximum temperature and the mean daily minimum temperature (°C). TD is the difference between the mean daily maximum temperature and the mean daily minimum temperature (°C).
Spatial autocorrelation is a quantitative description of the similarity degree and spatial correlation pattern of the attribute values of spatially adjacent regional units, which is used to reveal the spatial distribution characteristics of a certain geographical phenomenon between adjacent regions and the aggregation degree of variables. It is divided into global spatial autocorrelation and local spatial autocorrelation. This paper uses these two methods to further explore the spatial distribution of soil conservation and water conservation services in Yan’an city.
Global spatial autocorrelation analysis can identify the spatial correlation of regional overall ecological quality, which can be used to describe whether soil conservation and water conservation services has agglomeration effect in the whole region. In this paper, Moran’s I index is used to explore the spatial correlation, and the calculation formula is Equation 11 (Moran, 1950):
where xi and xj are the observed values of coordination efficiency;
Local autocorrelation can identify the association patterns of elements and attributes between local adjacent regions. In this paper, LISA (Local indicators of spatial associations) proposed by Anselin (1995) was used to identify the spatial difference degree and significance level between the soil conservation and water conservation services of each grid and its surrounding grid in Yan’an city, and reveal the agglomeration and dispersion characteristics of the same attribute value in space. The calculation formulas are Equations 12–14:
where: zi and zj are the standardization of the observed values in regions i and j, respectively.
LISA clustering analysis divided the spatial pattern of soil conservation and water conservation services into five types: H-H (high-high cluster), H-L (high-low outlier, high value surrounded by surrounding low value), L-H (low-high outlier, low value surrounded by surrounding high value), L-L (low-low cluster) and NS (not significant, there is no significant spatial clustering phenomenon). Among them, H-H and L-L are positive correlation types, while H-L and L-H are negative correlation types.
To further explore the trade-offs and synergistic relationships among the ecosystem services in the study area, correlation analysis was applied to calculate the amount of ecosystem service changes in each pixel between 2010 and 2018 to identify the interrelationships among the two ecosystem services. The formula is Equation 15:
where, Rxy is the correlation coefficient of two ecosystem services; xi, yi are the ith pixel values of ecosystem services x, y; ‾x, ‾y are the mean values of ecosystem services x, y; n is the time series of raster data. When the correlation result is positive, it indicates that there is a synergistic relationship between the two kinds of ecosystem services, that is, the increase of one kind of ecosystem service will promote another kind of ecosystem service, whereas there is a trade-off relationship, that is, the increase of one kind of ecosystem service will lead to the decrease of the supply of another kind of ecosystem service.
From the perspective of spatial distribution, the spatial differentiation characteristics of soil conservation service in 2010 and 2018 were relatively large. In 2010, the unit soil conservation amount in the eastern and southwestern regions was higher than that in the northwest (Figure 2A). It was higher in Yanchuan, Yanchang, Yichuan, and Huanglong counties in the east and Huangling county in the southwest, while it was lower in Wuqi, Zhidan, Ansai, and Zichang counties in the north. In 2018, the amount of soil conservation in Wuqi, Zhidan, Ansai, and Zichang counties in the northwest was higher than that in other areas (Figure 2B), and the gap between the highest and the lowest amount of soil conservation showed a trend of narrowing.
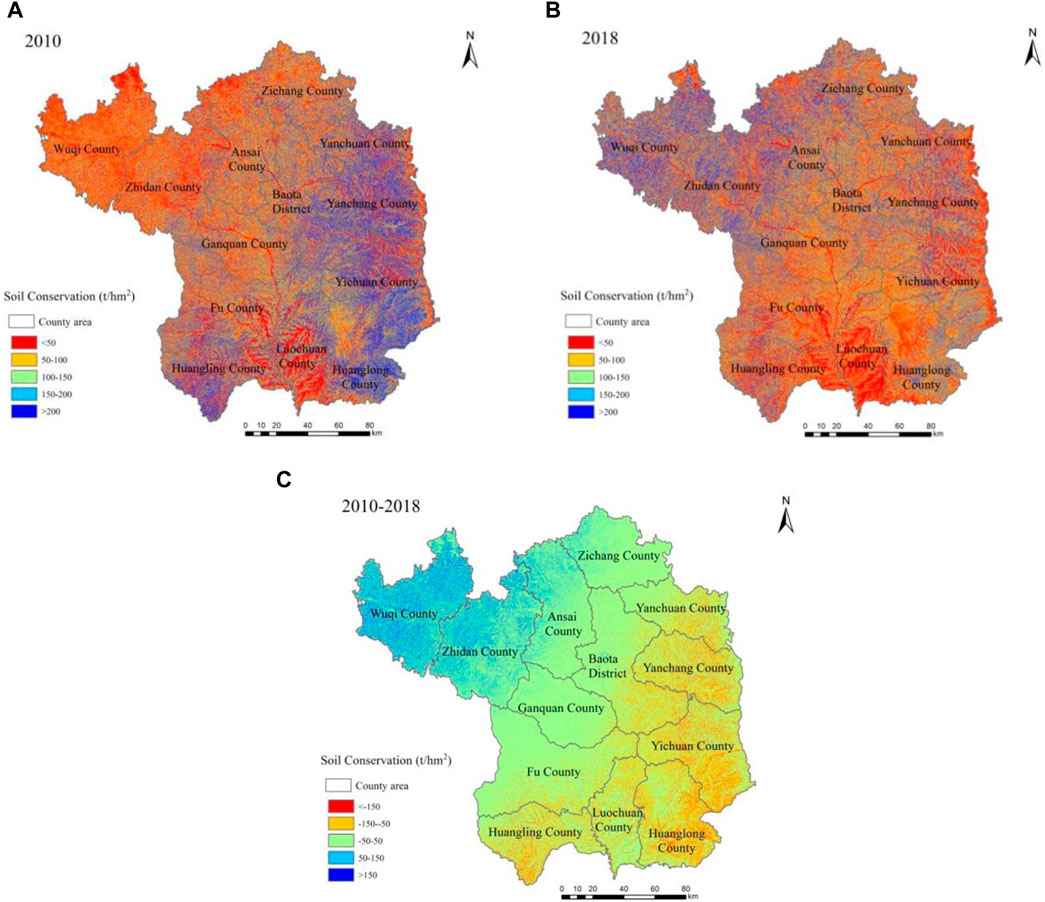
Figure 2. Spatial distribution of soil conservation services of Yan’an city in 2010 (A), 2018 (B) and the change (C).
From 2010 to 2018, the total amount of soil conservation in Yan’an city showed a decreasing trend. In 2010, the total amount of soil conservation in Yan’an city was 4.07 × 10⁶ t, with an average value of per unit area was 109.86 t/hm2. In 2018, the total amount of soil conservation in Yan’an city decreased to 3.75 × 10⁶ t, with an average value of per unit area was 101.33 t/hm2. That is a decrease of 7.76%.The basic trend of soil conservation value change was increasing in the northwest and decreasing in the southeast. According to grid statistics, 7.57% of the areas where soil conservation value increased by more than 50 t/hm2, 37.76% of the areas where soil conservation value decreased by more than 50 t/hm2, and 54.68% of the areas had small changes between 50 t/hm2. Except for Wuqi, Zhidan, Ansai, and Zichang counties, the amount of soil conservation decreased in all districts and counties. The area with the largest decrease was Huangling County, which decreased by 66.87 t/hm2, and the area with the largest increase was Wuqi County, which increased by 79.03 t/hm2 (Figure 2C).
Moran’s I index of soil conservation service in the study area was calculated by ArcGIS software. The Moran’s I index of soil conservation service in Yan’an in 2010 and 2018 was 0.1047 (p = 0, Z = 443) and 0.0707 (p = 0, Z = 359.17). This indicates that soil conservation service has a small positive spatial correlation, and there was a certain clustering characteristics in Yan’an city. The Moran’s I index in 2018 showed a decrease compared to 2010, indicating a dispersed trend in the spatial clustering of soil conservation.
According to the LISA clustering analysis (Figure 3), in 2010, the area of soil conservation service“H-H” accounted for 1.40% of the city’s area. The proportion of “H-L” area was very small, only 0.04%. The “L-H” area accounted for 5.19%, which was relatively concentrated in the eastern part of Yan’an city and Huangling County. The area of the “L-L” area accounted for 1.94%. More than 90% of the city has no significant clustering effect. From the perspective of time changes, from 2010 to 2018, the “H-H” area decreased by 0.43%, while the “H-L” area increased by 0.20%. The “L-H” area decreased by 0.21%, and the area shifted from the southeast to the northwest. The “L-L” area increased by 1.6%, with a increase in the northern counties.
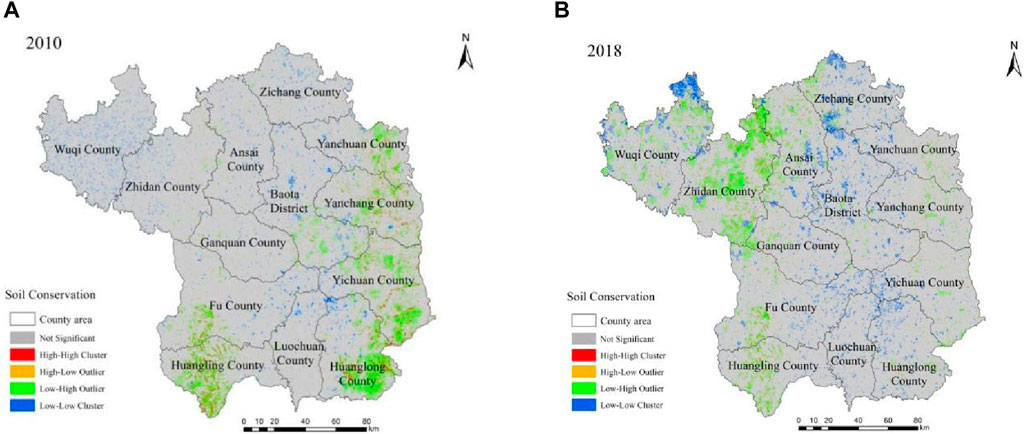
Figure 3. LISA clustering of soil conservation services of Yan’an city in 2010 (A) and 2018 (B).
The spatial distribution of water conservation service in Yan’an city is greatly affected by rainfall, and the water yield is larger in areas with relatively abundant rainfall. In 2010, the amount of water conservation showed a decreasing trend from south to north (Figure 4A), which was higher in Huanglong, Huangling and Luochuan counties in the south and lower in Wuqi, Zichang and Yanchuan counties in the north. In 2018, the spatial distribution of water conservation service in Yan’an city underwent significant changes, showing a trend of being higher in the southwest and lower in the northeast (Figure 4B). From 2010 to 2018, the amount of water conservation in Yan’an city showed an upward trend. In 2010, the total amount of water production was 2.01 × 1010 mm, with an average value of 489.52 mm per unit area. In 2018, the total amount increased to 2.03 × 1010 mm, with an average value of 492.30 mm per unit area, with an increase of 0.56%. In terms of spatial distribution, it mainly increased in the north and decreased in the south, and the gap between the highest and lowest tended to narrow. According to grid statistics, 25.97% of the areas have increased their water conservation service by more than 50 mm, mainly distributed in the northern counties of Wuqi, Zhidan, Ansai, and Zichang, with the largest increase of 82.46 mm in Wuqi. The decrease area accounted for 22.85%, mainly distributed in the south, and Huanglong County was the most significant, with a decrease of 90.60 mm. 51.18% of the regional change was between 50 mm (Figure 4C).
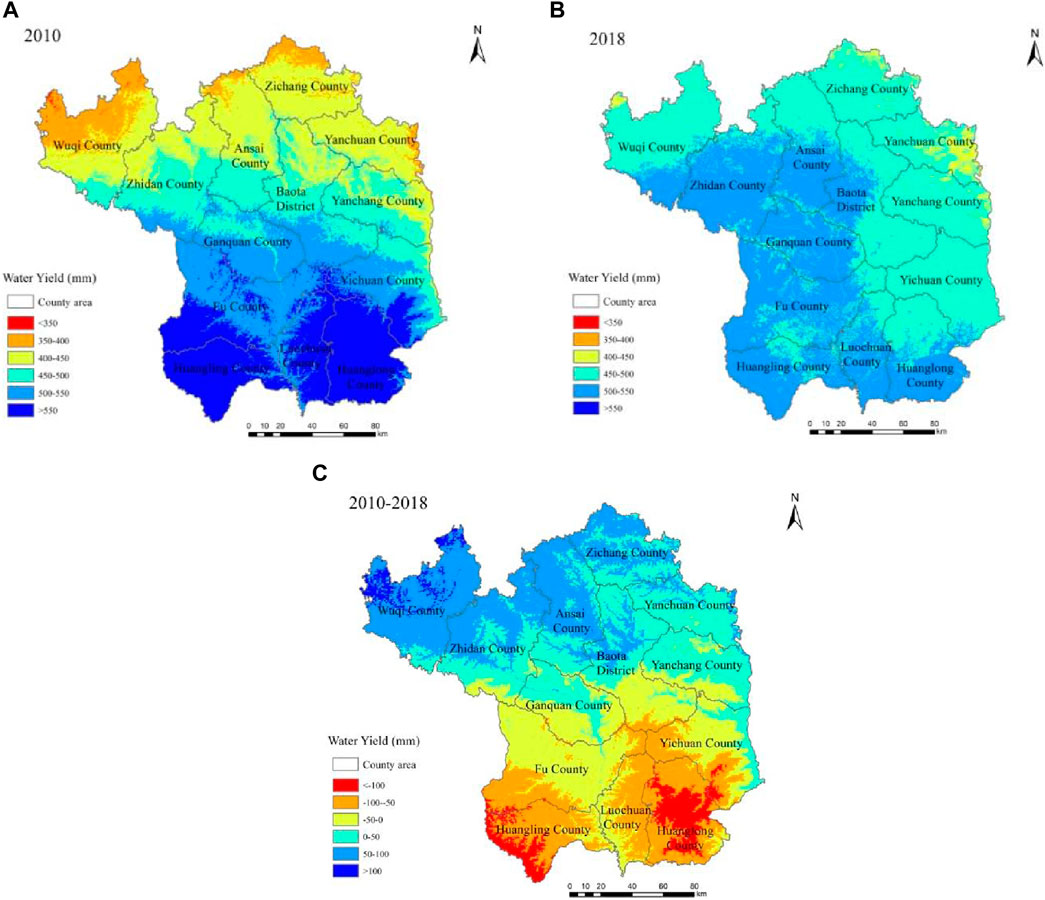
Figure 4. Spatial distribution of water conservation services of Yan’an city in 2010 (A), 2018 (B) and the change (C).
The Moran’s I index of water conservation service in Yan’an in 2010 and 2018 were 0.8044 (p = 0, Z = 379) and 0.6849 (p = 0, Z = 294.83), indicating a positive spatial correlation in the amount of water conservation in Yan’an city and a high spatial clustering feature. The Moran’s I index in 2018 was lower than that in 2010, indicating a dispersed trend in spatial clustering of water conservation service.
According to the LISA clustering analysis (Figure 5), water conservation service in Yan’an city was dominated by “H-H″ cluster and “L-L” cluster. In 2010, the “H-H” area and the “L-L” area accounted for 36.93% and 36.57% of the city. “H-H” was located in Huangling, Fuxian, Luochuan, and Huanglong counties in the southern while “L-L” was located in Zhidan, Zichang, Ansai, Yanchuan, and Yanchang counties in the northern of Yan’an city. The proportion of “H-L” and “L-H” areas was very small, only 0.04% and 0.006%, and the remaining 26.5% area has no significant cluster effect. From the perspective of time changes, the “H-H” area increased by 14.3%, while the “L-L” area decreased by 16.16% from 2010 to 2018, mainly due to the transformation from “L-L” area to “H-H” area in the northwest of Zhidan, Ansai counties, and Baota District. The changes in the “H-L” and “L-H” areas were not significant.
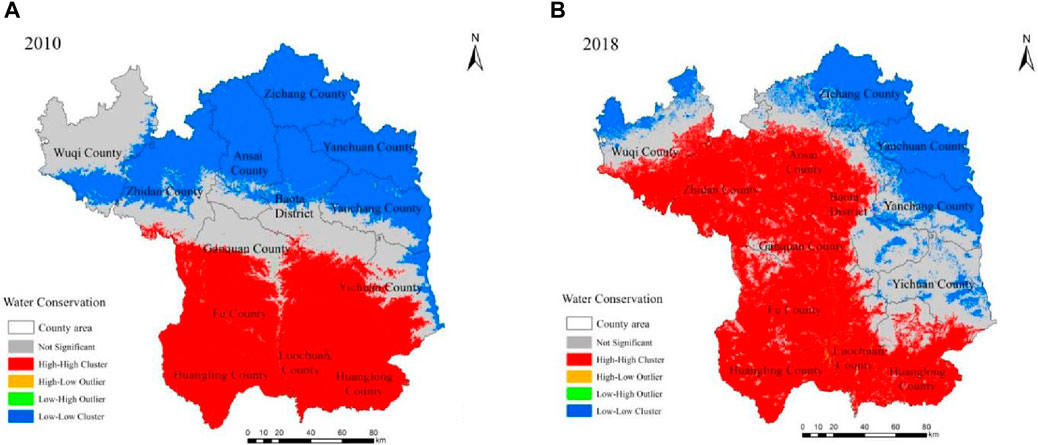
Figure 5. LISA clustering of water conservation services of Yan’an city in 2010 (A) and 2018 (B).
At the spatial pixel scale, the trade-off and synergistic relationship between soil conservation and water conservation services in Yan’an city were quantitatively analyzed. As shown in Figure 6, the area of the synergy relationship accounts for 77.05%, and that of the trade-off relationship is 22.95%. The synergy area is much larger than the trade-off area. In terms of spatial distribution, the trade-off relationship is mainly distributed in the northern of Yanchuan, Yanchang and Baota districts, while the synergy relationship are mainly distributed in other areas of Yan’an city.
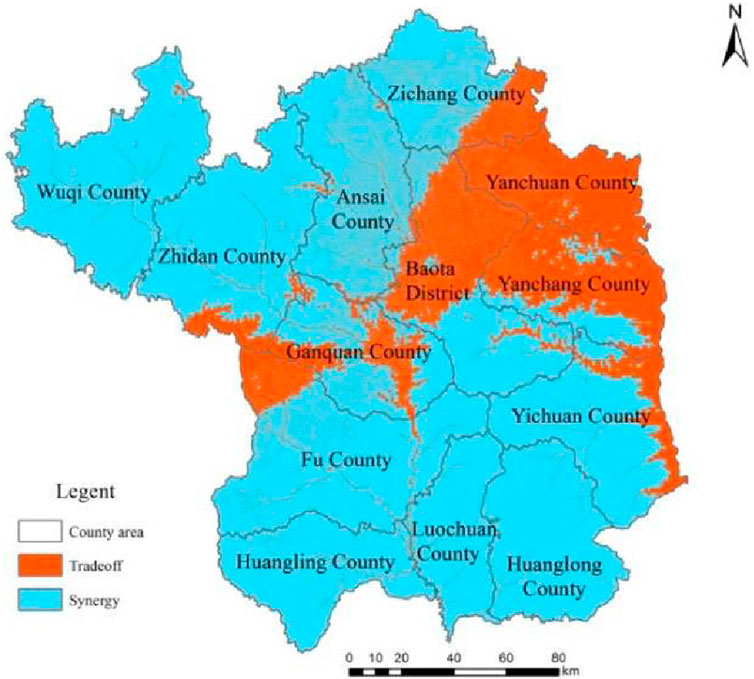
Figure 6. Distribution of trade-offs between soil conservation and water conservation services of Yan’an city.
Based on Pearson correlation coefficient, SPSS18.0 software was used to analyze the correlation between the implementation scale data of GCLC projects in 13 districts and counties of Yan’an city (Table 1) and the change values of soil conservation and water conservation. The results showed (Table 2) that from 2010 to 2018, there was a positive correlation between soil conservation services and the number of the projects, as well as the newly added cultivated land area. There was a negative correlation between soil conservation services and the construction scale, the construction scale of high-standard farmland, and the investment amount. There was a positive correlation between water conservation and the GCLC projects, but all correlations were not significant.
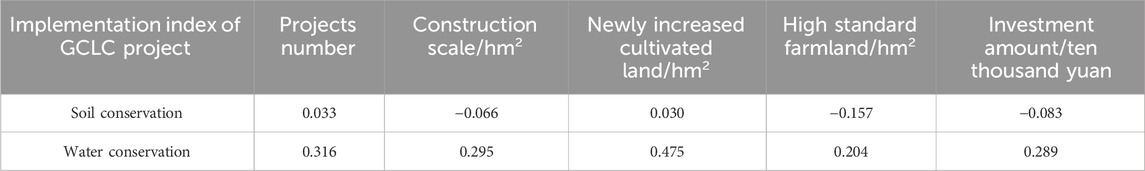
Table 2. Correlation between implementation index of GCLC project and soil conservation and water conservation service change.
According to the change values of soil conservation and water conservation in 13 districts and counties of Yan’an city (Figure 7), from 2010 to 2018, due to different natural conditions and habitat characteristics, each district and county in Yan’an played different roles in ecological protection, food security and economic development, and the implementation priorities of GCLC projects and their impacts on soil conservation and water conservation services changes were also different.
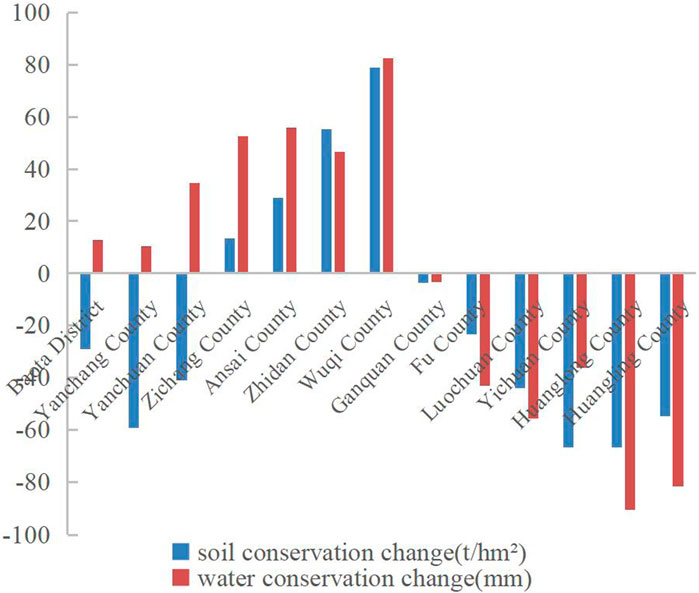
Figure 7. The soil conservation and water conservation services variations in different districts and counties of Yan’an city.
As the municipal government of Yan’an city is located, The rapid urbanization makes a large amount of cultivated land in Baota District occupied by construction land, so it is necessary to implement the GCLC project to develop agriculture intensively and improve the economic and population capacity. Baota District has the largest area of construction scale, and the newly added cultivated land in Yan’an city. The implementation of the project and urban construction made the the amount of soil conservation in Baota District has decreased.
In the east, Zichang, Yanchuan and Yanchang counties have low terrain, which is more suitable for the development of agriculture. Therefore, the implementation of GCLC projects covers a large area. Except for Zichang County, there was a slight decreased of soil conservation in Yanchuan and Yanchang counties.
The southeast and southwest of Yan’an city, especially, Huangling and Huanglong counties are important ecological protection and water conservation areas in the province. So the amount of water conservation and soil conservation has decreased due to the impact of the project. Although the scale and the new cultivated land of the project is small, the human disturbance and landscape fragmentation still cause a large degree of decline in water conservation and soil conservation.
Wuqi, Zhidan and Anseh counties in the north have poor ecological environment background conditions, high altitude and wide distribution of grassland. Although the scale of GCLC projects implemented is not large, they can effectively improve the level of agricultural infrastructure, fully guarantee and improve people’s livelihood, and play a positive role in the restoration of ecological environment. Therefore, the service functions of soil conservation and water conservation have been slightly improved.
From 2010 to 2018, the total amount of soil conservation in Yan’an city decreased by 7.7%, while the water conservation increased by 0.56%. The general trend of both is a decrease in the south and an increase in the north. Studies have shown that large-scale ecosystem service changes and their synergies and trade-offs are mainly caused by climate factors such as temperature and precipitation, while small-scale changes are caused by human activities and land use changes (Wang et al., 2021).
Precipitation is the biggest influencing factor of water conservation services (Wang X. et al., 2022). The spatial variation of water conservation services in Yan’an City was basically consistent with the variation trend of precipitation in Yan’an City during this period (Xu and Zhang, 2020), but the total amount of water conservation in Yan’an City remained stable. It may be that the increase in vegetation cover increased plant transpiration, so the total amount of water conservation did not increase much. In addition to precipitation, soil conservation is also closely related to topography and land use type, which affect soil conservation function by affecting rainfall erosivity (Xu and Zhang, 2020). The overall change of soil conservation service in Yan’an city is greater than that of water conservation service, which may be because human activities have changed the topography and land use types on a small scale, so the amount of soil conservation has decreased to a certain extent.
On the whole, there is a synergistic relationship between soil conservation and water conservation services, which is consistent with the research results of other scholars in the Loess Plateau region (Ren et al., 2022; Lan et al., 2023). Due to the consistent impact of precipitation, land use types, and vegetation cover, as well as relatively similar biophysical linkages and soil hydrological processes, the two services exhibit synergy (Li and Zhang, 2021; Wang S. et al., 2022). However, in the study area, Yanchuan, Yanchang and the northern part of Baota districts in the east of Yan’an city show a certain tradeoff. According to Table 1, the largest area of GCLC projects was implemented in this three areas. Therefore, this may be related to human disturbance. Xue et al. (2024) research in the Loess Plateau region also shows that places with low elevation are more susceptible to human disturbance. The higher the elevation, the stronger the synergistic effect between soil conservation and water conservation services (Xue et al., 2024).
The results showed that the effect of the GCLC projects on soil conservation and water conservation services in Yan’an city is not significant. Many studies have shown that land consolidation has a negative impact on soil and water loss and significantly increases the amount of soil erosion (Evrard et al., 2010; Chartin et al., 2013). On the other hand, the change of slope gradient in land leveling projects can increase infiltration, reduce runoff rate and soil erosion intensity (Gao et al., 2012; Liu et al., 2013; Liu et al., 2015). In terms of ecosystem services, most studies have shown that land consolidation improves food production services of ecosystems while weakening other services and total value (Zhao et al., 2004; Kindu et al., 2016). The Loess Plateau is vulnerable to erosion due to its broken topography and poor impact resistance, and the implementation of land consolidation project has a certain negative impact on soil conservation. Meanwhile, compared with the forest and grass ecosystem, the vegetation coverage of farmland is relatively lower, so the soil conservation service is relatively low (Sun et al., 2014). However, engineering measures such as hydraulic engineering effectively reduced the occurrence of drought and flooding events, promoted the protection of vegetation in the whole basin, and thus prevented soil and water erosion. Therefore, in general, the negative impact of the project on soil conservation is not large, and the changes of soil conservation and water conservation services in Yan’an city during the GCLC project are relatively stable.
Yin’s research shows that Nature-based Solution (NCS) practices can improve multiple ecosystem services. However, unsustainable NCS implementation such as over-afforesting may result in a trade-off of reduced water supply, grassland and farmland (Yin et al., 2023). The GCLC project implemented in Yan’an city after the GFG project can not only increase the quantity and quality of cultivated land, and ensure food security, but also provide relatively stable and coordinated soil conservation and water conservation services in Yan’an city during this period, achieving the effect of “expanding ecosystem area” to “improving ecosystem management efficiency.”
Based on the InVEST model, this study analyzed the temporal and spatial evolution of soil conservation and water conservation services in Yan’an city under the background of GCLC project. It could not only obtain quantitative analysis results, but also visually analyzed the results of ecosystem service value, providing a basis for the benefit assessment of regional GCLC project. However, the research on its impact mechanism was not deep enough in this paper. In addition, the scale of the study can also affect the results. Due to the influence of climate, terrain, land use and other conditions, the trade-offs among ecosystem services are spatial-heterogeneous and temporal-dynamic, and change with the passage of spatial-temporal scales (Ren et al., 2022). In the next step, on the basis of obtaining the spatial information of the project, the relationship between land consolidation at different scales and ecosystem service function should be further obtained by means of spatial analysis, and the influence mechanism and law of long-term comprehensive benefits after the implementation of the project should be revealed through reasonable model simulation. It provide a more effective theoretical basis for land consolidation technology innovation and ecological protection of the Loess Plateau.
The total amount of soil conservation decrease of 7.76% in Yan’an city between 2010 and 2018, and the basic trend of spatial variation was an increase in the northwest and a decrease in the southeast. The spatial clustering of soil conservation was relatively low. The total amount of water conservation in Yan’an city remained relatively stable, increasing by 0.56% in 8 years, with the basic trend of increasing in the north and decreasing in the south. There is a high spatial clustering feature in water conservation service. There is a synergistic relationship between soil conservation and water conservation services in most area of Yan’an city. From 2010 to 2018, the effect of the GCLC projects on soil conservation and water conservation services in Yan’an city is not significant. Due to the different natural conditions and habitat characteristics, the implementation focus of GCLC project and its impact on soil conservation and water conservation services are also different.
These results show that the GCLC project can effectively alleviate the situation of sharp decline of cultivated land area and insufficient food production capacity under the condition of maintaining relatively stable and coordinated regional soil conservation and water conservation services, ensure the red line of cultivated land and food security, and balance the conflict between ecological protection and farmers’ livelihood. The balanced between ecological security and food security, high-quality development and ecological protection has been achieved. Our work could be cited as a reference for other comprehensive ecological control projects in the Loess Plateau.
The original contributions presented in the study are included in the article/Supplementary Material, further inquiries can be directed to the corresponding author.
WJ: Conceptualization, Investigation, Writing–original draft, Writing–review and editing, Data curation, Formal Analysis. ZY: Methodology, Writing–review and editing. XL: Supervision, Validation, Writing–review and editing. LJ: Resources, Software, Writing–original draft. HH: Visualization, Writing–review and editing. LS: Funding acquisition, Writing–review and editing.
The authors declare that financial support was received for the research, authorship, and/or publication of this article. This work was funded by the Technology Innovation Center for Land Engineering and Human Settlements, Shaanxi Land Engineering Construction Group Co., Ltd. and Xi’an Jiaotong University (2024WHZ0238), the Open Foundation of the Key Laboratory of Natural Resource Coupling Process and Effects (No. 2023KFKTB008), the Key Research and Development Program of Shaanxi (No. 2022ZDLSF06-04), the project of Shaanxi Province Land Engineering Construction Group (No. DJTD-2022-4).
Authors WJ, ZY, XL, LJ, and LS were employed by Shaanxi Provincial Land Engineering Construction Group Co., Ltd.
The remaining author declares that the research was conducted in the absence of any commercial or financial relationships that could be construed as a potential conflict of interest.
All claims expressed in this article are solely those of the authors and do not necessarily represent those of their affiliated organizations, or those of the publisher, the editors and the reviewers. Any product that may be evaluated in this article, or claim that may be made by its manufacturer, is not guaranteed or endorsed by the publisher.
Anselin, L. (1995). Local indicators of spatial association-LISA. Geogr. Anal. 27, 93–115. doi:10.1111/j.1538-4632.1995.tb00338.x
Chartin, C., Evrard, O., Salvador-Blanes, S., Hinschberger, F., Van Oost, K., Lefèvre, I., et al. (2013). Quantifying and modelling the impact of land consolidation and field borders on soil redistribution in agricultural landscapes (1954–2009). Catena 110, 184–195. doi:10.1016/j.catena.2013.06.006
Chen, Y. P., Wang, K., Lin, Y., Shi, W., Song, Y., and He, X. (2015). Balancing green and grain trade. Nat. Geosci. 8 (10), 739–741. doi:10.1038/ngeo2544
Costanza, R., d’Arge, R., de Groot, R., Farber, S., Grasso, M., Hannon, B., et al. (1998). The value of the world’s ecosystem services and natural capital. Ecol. Econ. 25 (1), 3–15. doi:10.1016/s0921-8009(98)00020-2
Costanza, R., D’Arger, R., De Groot, R., Farber, S., Grasso, M., Hannon, B., et al. (1997). The value of the world's ecosystem services and natural capital. Nature 387 (6630), 253–315. doi:10.1016/s0921-8009(98)00020-2
Deng, Y. J., Hou, M. Y., Xie, Y. F., et al. (2020). Impact of the Grain for Green Project on the temporal and spatial evolution of ecosystem service value in northern Shaanxi. Acta Ecol. Sin. 40 (18), 6597–6612.
Evrard, O., Nord, G., Cerdan, O., Souchère, V., Le Bissonnais, Y., and Bonté, P. (2010). Modelling the impact of land use change and rainfall seasonality on sediment export from an agricultural catchment of the northwestern European loess belt. Agric. Ecosyst. Environ. 138 (1), 83–94. doi:10.1016/j.agee.2010.04.003
Gao, H. D., Li, Z. B., Li, P., et al. (2012). Influences of terrace construction and check dam silting-up on soil erosion. Acta Geogr. Sin. 67 (5), 599–608.
Gao, J. B., and Zuo, L. Y. (2021). Revealing ecosystem services relationships and their driving factors for five basins of Beijing. J. Geogr. Sci. 31 (1), 111–129. doi:10.1007/s11442-021-1835-y
Han, L., Huo, H., Liu, Z., Zhao, Y. H., Zhu, H. L., Chen, R., et al. (2021). Spatial and temporal variations of vegetation coverage in the middle section of Yellow River Basin based on terrain gradient: taking Yan’an City as an example. Chin. J. Appl. Ecol. 32 (5), 1581–1592. doi:10.13287/j.1001-9332.202105.014
He, C. X. (2015). The situation, characteristics and effect of the gully reclamation project in Yan'an. J. Earth Environ. 6, 255–260.
He, M. N., Wang, Y. Q., Tong, Y. P., Zhao, Y., Qiang, X., Song, Y., et al. (2020). Evaluation of the environmental effects of intensive land consolidation: a field-based case study of the Chinese Loess Plateau. Land Use Policy 94, 104523. doi:10.1016/j.landusepol.2020.104523
Jin, Z., Guo, L., Wang, Y. Q., Yu, Y., Lin, H., Chen, Y., et al. (2019). Valley reshaping and damming induce water table rise and soil salinizationon the Chinese Loess Plateau. Geoderma 339, 115–125. doi:10.1016/j.geoderma.2018.12.048
Jopke, C., Kreyling, J., Maes, J., and Koellner, T. (2015). Interactions among ecosystem services across Europe: bagplots and cumulative correlation coefficients reveal synergies, trade-offs, and regional patterns. Ecol. Indic. 49, 46–52. doi:10.1016/j.ecolind.2014.09.037
Kindu, M., Schneider, T., Teketay, D., and Knoke, T. (2016). Changes of ecosystem service values in response to land use/land cover dynamics in Munessa-Shashemene landscape of the Ethiopian highlands. Sci. Total Environ. 547, 137–147. doi:10.1016/j.scitotenv.2015.12.127
Lan, Y. Z., Sun, T. S., and Li, W. W. (2023). Trade-offs and synergies of farmland ecosystem services in Loess Plateau: a case study of Longdong Region, Northwest China. Trans. Chin. Soc. Agric. Eng. 39 (12), 238–246.
Li, S. C., Zhang, C. Y., Liu, J. L., et al. (2013). The tradeoffs and synergies of ecosystem services: research progress, development trend, and themes of geography. Geogr. Res. 32 (8), 1379–1390.
Li, Y. H., Du, G. M., and Liu, Y. S. (2016). Transforming the loess plateau of China. Front. Agric. Sci. Eng. 3 (3), 181–185. doi:10.15302/j-fase-2016110
Li, Z., and Zhang, Y. F. (2021). Spatiotemporal evolution of ecosystem services in the main and Tributaries of Weihe River basin based on InVEST model. J. Soil Water Conservation 35 (4), 178–185.
Liu, J. Y. (1996). Remote sensing macroscopic survey and dynamic study of resources and environment in China. Beijing: China Science and Technology Press.
Liu, S. L., Dong, Y. H., Li, D., Liu, Q., Wang, J., and Zhang, X. (2013). Effects of different terrace protection measures in a sloping land consolidation project targeting soil erosion at the slope scale. Ecol. Eng. 53, 46–53. doi:10.1016/j.ecoleng.2012.12.001
Liu, Y. S. (2013). Feasibility study report of major project of gully control and land consolidation in yan 'an city, Shaanxi province. Beijing: Institute of Geographic Sciences and Natural Resources Research, Chinese Academy of Sciences, 1–5.
Liu, Y. S., Guo, Y. J., Li, Y. R., et al. (2015). Gis-based effect assessment of soil erosion before and after gully land consolidation: a case study of wangjiagou project region, loess plateau. Chin. Geogr. Sci. 25 (2), 137–146. doi:10.1007/s11769-015-0742-5
Ma, J. F., Chen, Y. P., Wang, H. J., Wu, J., Su, C., et al. (2020). Newly created farmland should be artificially ameliorated to sustain agricultural production on the Loess Plateau. Land Degrad. Dev. 31 (17), 2565–2576. doi:10.1002/ldr.3618
MEA (2005). Ecosystems and human well-being: current state and trends. Washington, DC: Island Press.
Moran, P. A. P. (1950). Notes on continuous stochastic phenomena. Biometrika 37 (1/2), 17–23. doi:10.2307/2332142
Mousavi, S. A., Ghahfarokhi, M. S., and Koupaei, S. S. (2023). Negative impacts of nomadic livestock grazing on common rangelands' function in soil and water conservation - science Direct. Ecol. Indic. 110(3), 105946. doi:10.1016/j.ecolind.2019.105946
Ouyang, Z. Y., and Wang, R. S. (2000). Ecosystem services and their economic valuation. World Sci. Technol. Res. Dev. 22 (5), 45–50.
Ren, J., Zhao, X. Y., Xu, X. C., et al. (2022). Spatial-temporal evolution, tradeoffs and synergies of ecosystem services in the middle Yellow River. J. Earth Environ. 13 (4), 477–490.
Sun, W. Y., Shao, Q. Q., and Liu, J. Y. (2014). Assessment of soil conservation function of the ecosystem services on the Loess Plateau. J. Nat. Resour. 29 (3), 365–376.
Turner, K. G., Odgaard, M. V., Bøcher, P. K., Dalgaard, T., and Svenning, J. C. (2014). Bundling ecosystem services in Denmark: trade-offs and synergies in a cultural landscape. Landsc. Urban Plan. 125, 89–104. doi:10.1016/j.landurbplan.2014.02.007
Wang, S., Li, Y. W., Li, Q., et al. (2022b). Water and soil conservation and their trade-off and synergistic relationship under changing environment in Zhangjiakou-Chengde area. Acta Ecol. Sin. 42 (13), 5391–5403. doi:10.5846/stxb202105291417
Wang, X., Wu, J., Liu, Y., Hai, X., Shanguan, Z., and Deng, L. (2022a). Driving factors of ecosystem services and their spatiotemporal change assessment based on land use types in the Loess Plateau. J. Environ. Manag. 311, 114835. doi:10.1016/j.jenvman.2022.114835
Wang, X. Z., Wu, J. S., Wu, P. X., et al. (2021). Spatial and temporal distribution and trade-off of water conservation, soil conservation and NPP services in the ecosystems of the loess plateau from 2000 to 2015. J. Soil Water Conservation 35 (4), 114–121.
Williams, J. R. (1990). The erosion-productivity impact calculator (EPIC) model: a case history. Philosophical Trans. R. Soc. B-Biological Sci. 329 (1255), 421–428.
Wischmeier, W. H., and Smith, D. D. (1958). Rainfall energy and its relationship to soil loss. Trans. Am. Geophys. Union 39, 285–291.
Xu, E. Q., and Zhang, H. Q. (2020). Change pathway and intersection of rainfall, soil, and land use influencing water-related soil erosion. Ecol. Indic. 113, 106281. doi:10.1016/j.ecolind.2020.106281
Xue, Z. H., Gao, Y. Y., Lu, P. D., et al. (2024). Spatial distribution and tradeoff synergy-independence relationships of ecosystem services based on land use and topography. Res. Soil Water Conservation 31 (2).
Yellow River Conservancy Commission (2022). Bulletin of soil and water conservation in the Yellow River Basin (2021) [R]. Zhengzhou Yellow River Conservancy Comm. Ministry Water Resour.
Yin, C. C., Pereira, P., Zhao, W. W., and Barcelo, D. (2023). Natural climate solutions. The way forward. Geogr. Sustain. 4 (2), 179–182. doi:10.1016/j.geosus.2023.03.005
Keywords: soil conservation, water conservation, gully control and land consolidation, spatiotemporal variations, trade-offs, Yan’an city
Citation: Jing W, Yang Z, Longfei X, Jianfeng L, Huan H and Siqi L (2024) Soil conservation and water conservation services and trade-offs following the land consolidation project: a case study of Yan’an city, China. Front. Environ. Sci. 12:1425199. doi: 10.3389/fenvs.2024.1425199
Received: 29 April 2024; Accepted: 12 July 2024;
Published: 06 August 2024.
Edited by:
Xudong Peng, Guizhou University, ChinaReviewed by:
Fengling Gan, Chongqing Normal University, ChinaCopyright © 2024 Jing, Yang, Longfei, Jianfeng, Huan and Siqi. This is an open-access article distributed under the terms of the Creative Commons Attribution License (CC BY). The use, distribution or reproduction in other forums is permitted, provided the original author(s) and the copyright owner(s) are credited and that the original publication in this journal is cited, in accordance with accepted academic practice. No use, distribution or reproduction is permitted which does not comply with these terms.
*Correspondence: Wang Jing, d2FuZ2ppbmcwNzIyQDEyNi5jb20=
Disclaimer: All claims expressed in this article are solely those of the authors and do not necessarily represent those of their affiliated organizations, or those of the publisher, the editors and the reviewers. Any product that may be evaluated in this article or claim that may be made by its manufacturer is not guaranteed or endorsed by the publisher.
Research integrity at Frontiers
Learn more about the work of our research integrity team to safeguard the quality of each article we publish.