 Chenxing Fu
 Hongke Hao1
 Fang Yang
- 1Yangling Vocational and Technical College, Yangling, China
- 2College of Basic Medical Science, Inner Mongolia Medical University, Inner Mongolia Key Lab of Molecular Biology, Hohhot, China
- 3State Key Laboratory of Environmental Criteria and Risk Assessment, Chinese Research Academy of Environmental Sciences, Beijing, China
Extreme high and low temperatures both exert impacts on terrestrial ecosystems. However, current research still lacks a precise assessment of the risk of vegetation loss under simultaneous consideration of different temperature stresses and lag effects. To this end, we propose a methodology for assessing the risk of vegetation loss under temperature stress that incorporates lag effects, based on weekly normalized difference vegetation index and temperature data. Quantified risk probabilities of different terrestrial ecosystems to warming and cooling stresses in Heilongjiang Province, China. The results of the study revealed a strong association between vegetation and temperature change during the growing season, reaching the most sensitive state around 9 weeks and 23 weeks lag, respectively, with high spatial consistency. The study identifies the eastern and western edges of the study area as high-risk zones for vegetation loss, while the risk is comparatively lower in the northwestern and central regions. The probability of risk increased by about 0.5% for every 1°C of warming in average temperatures and by about 0.7% for every 1°C of cooling. This indicates that cooling has a greater impact on vegetation than warming. Farmland ecosystems had a higher change in risk to temperature stress and forest ecosystems had the least. This study provides new perspectives for understanding the specific impacts of temperature extremes on different ecosystems and provides a scientific basis for developing adaptive management measures.
1 Introduction
Amidst global change, climate warming has provoked global concern, especially regarding its potential impacts on terrestrial ecosystems. Warmer temperatures may lead to impaired plant physiology and dysfunctional ecological balance, which may have far-reaching impacts on biodiversity (Khan et al., 2013), soil and water conservation (Jia et al., 2022), and the global carbon cycle (Hoover et al., 2022). On the other hand, vegetation serves as an indicator of global climate change, not only maintaining the Earth’s biodiversity but also regulating atmospheric carbon dioxide levels. It is a key component in sustaining the Earth’s life systems (National Research Council, Division of Behavioral, Policy Division, Board on Environmental Change, Committee on the Human Dimensions of Global Change, and Committee on Global Change Research, 1999; Rani et al., 2020). Therefore, assessing and understanding the response of vegetation to climate change under the backdrop of global warming, particularly the potential risk of vegetation loss, is crucial for predicting and mitigating the impacts of climate change.
The response of vegetation to environmental changes often exhibits a temporal lag, and this lag effect may lead to an underestimation of vegetation’s response to extreme climatic events. In many instances, vegetation may require an extended period to manifest physiological and ecological responses to environmental changes (Becklin et al., 2016; Gillison, 2019). For example, extreme high temperatures may affect plant photosynthesis immediately, but changes in plant growth and community structure may not be apparent until several subsequent seasons or even years later (De Boeck et al., 2011). Additionally, rising temperatures may further affect vegetation status by altering soil moisture evaporation and plant transpiration processes, which can also exhibit delayed effects. Conversely, extreme low temperatures can significantly affect multiple physiological processes in vegetation (Reyer et al., 2013). Low temperatures decrease the activity of enzymes within plants, thereby slowing metabolic rates and leading to reduced growth rates (Bhattacharya, 2022). Particularly under conditions of extreme low temperatures, the structure of plant cells may be directly damaged, leading to cell death. However, current research focuses more on high temperature conditions and ignores the effects of low temperatures on vegetation. Therefore, this study addresses both warming and cooling conditions and their impacts on vegetation, aiming to comprehensively assess and quantify the lag effects of different temperatures on vegetation and the probability of associated risks.
Indeed, in areas with scarce precipitation and higher latitudes, temperature is a key factor influencing vegetation growth (Fu et al., 2014; Zhao et al., 2018). Wang et al., 2021 research found that compared to vegetation in humid regions, vegetation in semi-arid areas responds more quickly to precipitation changes. Deciduous broadleaf forests exhibit a response lag of approximately 1 month to temperature changes, and as this lag time increases, the correlation coefficient also rises (Lu et al., 2020). These studies provide valuable references for understanding vegetation dynamics and their response to temperature changes, but they predominantly focus on the monthly scale interactions between vegetation and temperature variations. In fact, different types of vegetation exhibit variations in the lag time of their response to temperature changes, which may manifest on decadal, weekly, or even daily scales. It remains difficult to characterize the lagged effect of vegetation on temperature change on finer time scales.
Based on this, this study selected Heilongjiang province (HLJ), which has the highest latitude in China. Not only does it experience significant annual temperature variations, but its rich diversity of ecosystems also provides favorable conditions for studying responses to temperature changes. Particularly, as HLJ serves as China’s largest commodity grain base (ZHOU and CHENG, 2015), assessing the risk of vegetation loss due to temperature changes is especially urgent and critical. To this end, we develop a risk assessment model for vegetation loss that takes into account temperature lag effects. Using high-resolution climate and vegetation data, we have developed a framework that comprehensively evaluates the risk of vegetation loss under conditions of both warming and cooling stress. The research methodology and results are expected to provide a more accurate tool for relevant sectors such as agriculture and risk management to help them better understand and manage potential risks to vegetation under temperature change. This will in turn help to develop effective ecological conservation and climate adaptation strategies.
2 Materials and methods
2.1 Study region
The HLJ is located in the northeast of China, is China’s northernmost and highest latitude province, with a total area of 473,105 km2 (Figure 1). The HLJ belongs to the cold temperate and temperate continental monsoon climate. It is characterized by low temperatures and dryness in spring, hot and rainy summers, prone to flooding and early frost in autumn, and cold and lengthy winters with a short frost-free period. The regional climatic differences across the province are significant. The annual average temperature in HLJ ranges from −4–5°C, with average precipitation exceeding 500 mm. The climate transitions from temperate in the south to cold temperate in the north, and exhibits distinct monsoonal characteristics. The province hosts a diverse array of vegetation types, with forests and agricultural ecosystems constituting a significant proportion (Liu and Li, 2024). In addition, the HLJ is located in one of the world’s three largest black land areas, with the largest arable land area in the country (Pan et al., 2018). Studying the effects of temperature change on vegetation is key to securing food production.
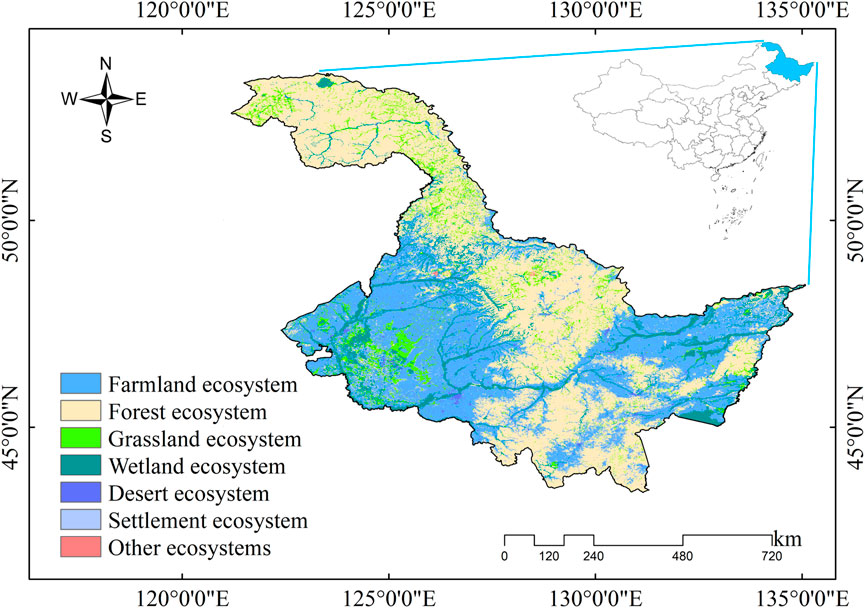
Figure 1. Location of the study area and ecosystem delineation.
2.2 Data
The daily maximum temperature data are sourced from the Climate Prediction Center Global Unified Temperature dataset, with a spatial resolution of 0.5° on a daily scale (https://psl.noaa.gov/data/gridded/data.cpc.globaltemp.html). The gridded daily Normalized Difference Vegetation Index (NDVI) is derived from the National Oceanic and Atmospheric Administration) Climate Data Record of Advanced Very High Resolution Radiometer NDVI Version 5 (https://www.ncei.noaa.gov). The data features a spatial resolution of 0.05°. To better align with the temperature data, we have interpolated the NDVI data to a resolution of 0.25°. In addition, considering the climatic period of vegetation growth within the year, only data from the growing season (NDVI from the 15th to 39th week of the year) were selected for this study. Ecosystem delineation data from Resource and Environmental Science Data Platform’s 2020 1 km resolution (https://www.resdc.cn/DOI/DOI.aspx?DOIID=131).
2.3 Methodology
To comprehensively assess the impacts of both warming and cooling on vegetation, the Spearman correlation between temperature and NDVI was calculated at various lag times. Additionally, the optimal lag times for both periods were determined by identifying the maximum and minimum correlation coefficients. Further, a copula function was employed to jointly model the temperature and NDVI variables at their optimal lag times for both periods. A copula function is a flexible method for representing multivariate joint distributions, unconstrained by the marginal distributions of random variables or the types of their joint distribution functions. This avoids assumptions about linearity or underlying probability distributions (Sklar, 1959; Nelsen, 2006). For any two random variables and, the corresponding joint distribution is expressed as follows
where C represents the cumulative copula distribution function;
Further, the kernel functions are employed to fit the marginal distributions, as described in Eq. 2. Given the properties of different types of copula functions and the fact that this study is mainly concerned with the risk scenarios of warming and cooling on vegetation loss. We used Clayton (Eq. 3) and Gaussian copula functions (Eq. 4) to fit the joint probability distribution, respectively.
where
where
Based on the joint distribution of the two copula functions constructed, the Bayesian conditional probability approach can then be used to assess the conditional probability of the risk of vegetation loss under temperature stress. In this study, scenarios combining temperature and vegetation are configured using percentile-based measures. Given the extensive and patterned nature of the scenario outcomes, we focus here on the vegetation loss scenarios at the 40th and 10th percentiles during cooling at the 40th, 30th, 20th, and 10th percentiles. For better comparison, the warming corresponds to the 60th, 70th, 80th, and 90th percentile scenarios, respectively. In this case, the conditional probabilities
3 Results and discussion
3.1 Lag effect of NDVI on temperature
In general, vegetation growth is subject to a combination of climate change and environmental factors. Especially for vegetation at higher latitudes, the effect of temperature is relatively more pronounced (Huang et al., 2017). Vegetation will vary in its sensitivity to temperature with different lag times, especially during the growing season period of vegetation (Wu et al., 2015). Figure 2A shows the variation of correlation coefficients between vegetation and temperature changes in HLJ at different weekly time scales. It is apparent that the maximum positive correlation (r = 0.56, p < 0.01) and the minimum negative correlation (r = −0.57, p < 0.01) are achieved at 9 weeks and 23 weeks, respectively. Figures 2B,C show in detail the changes of NDVI versus temperature in Heilongjiang Province with a lag of 9 and 23 weeks. In the period of positive correlation, NDVI shows a synchronous and stable trend as the temperature increases and decreases. The negative correlation period shows the opposite change. Relative to changes in temperature, the variations in NDVI were more pronounced around the year 2014, beginning with a notable increase from that year onward.
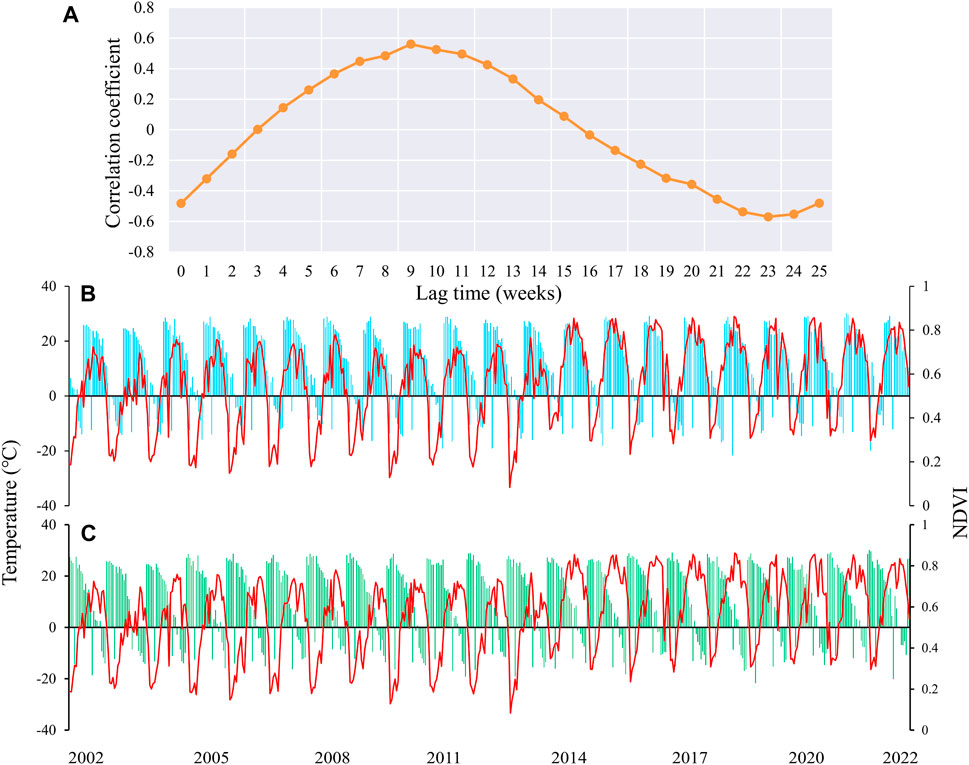
Figure 2. Correlation coefficients between NDVI and temperature at different lag times (A), along with changes in NDVI (B) and temperature (C) at extreme values.
On the spatial scale, the positive and negative correlation two periods (Figures 3A,B) showed significance at the 0.05 level for almost all image elements. They exhibit similar spatial distribution characteristics, with lower correlation coefficients (regardless of the direction of correlation) in the central region of HLJ. In the western and eastern regions, there is a higher level of correlation (direction of correlation not considered). However, the differences in lag times are more pronounced. During the period of positive correlation (Figure 3C), most of the lag times are concentrated within 10 weeks. In contrast, during the period of negative correlation (Figure 3D), most lag times exceed 20 weeks, with a noticeable acceleration in lag as latitude increases. Furthermore, the strong sensitivity between NDVI and temperature forms the foundation for constructing bivariate Copula functions, where the direction of correlation directly influences the outcomes of vegetation loss risk under various temperature stresses. Therefore, the changes in correlations illustrated in Figures 2, 3 also provide a good opportunity to explore the risk of vegetation loss under different warming and cooling scenarios.
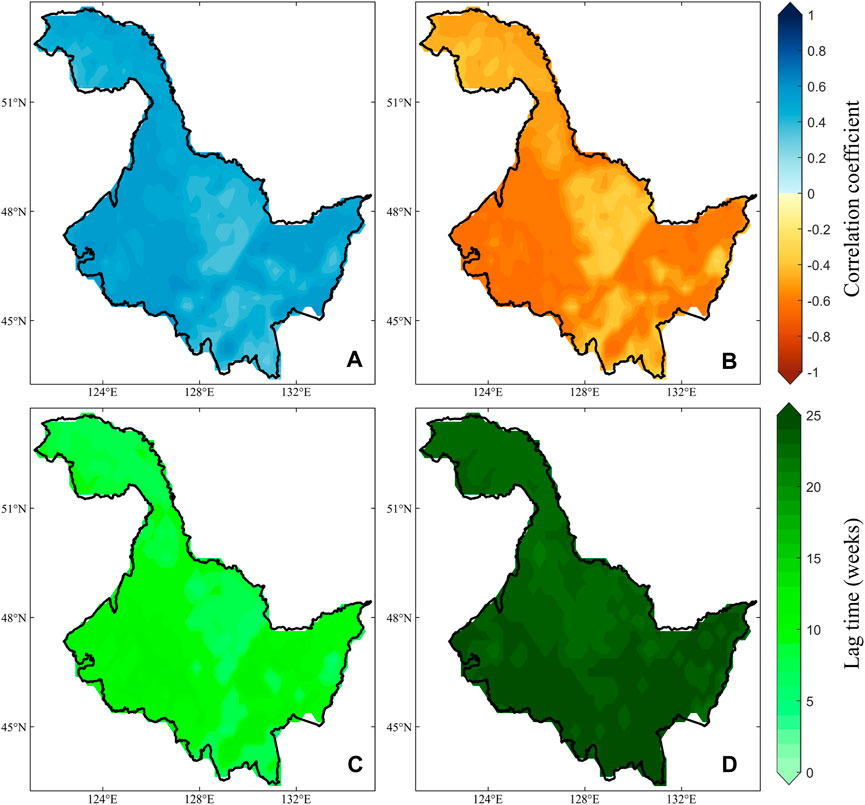
Figure 3. Correlation coefficients between NDVI and temperature under periods of positive (A, C) and negative correlation (B, D) and their spatial variation in lag time.
3.2 Risk assessment of vegetation loss under different levels of temperature stress
Given the complexity and stochastic nature of risk loss (Blauhut, 2020), we have conducted detailed analyses of the probabilities of vegetation loss at various levels under different temperature stresses during periods of both positive and negative correlation. During the period of positive correlation, changes in the probability of vegetation loss risk as temperatures decrease are displayed (Figure 4). It can be observed that as the degree of temperature reduction intensifies, the risk probability of vegetation loss at the 40th percentile exhibits a significant increasing trend, with the color deepening to dark red. On the other hand, when the degree of vegetation loss was at the 10th percentile, it increased with temperature stress. Although the probability of risk also tended to increase, it was significantly lower than the probability at the 40th percentile. Overall, the spatial distribution of risk probabilities under different scenarios shows a high degree of consistency during the period of positive correlation. In particular, it tends to have higher probability values in the eastern and western parts of HLJ, and lower probability values in the northwestern and central parts of HLJ.
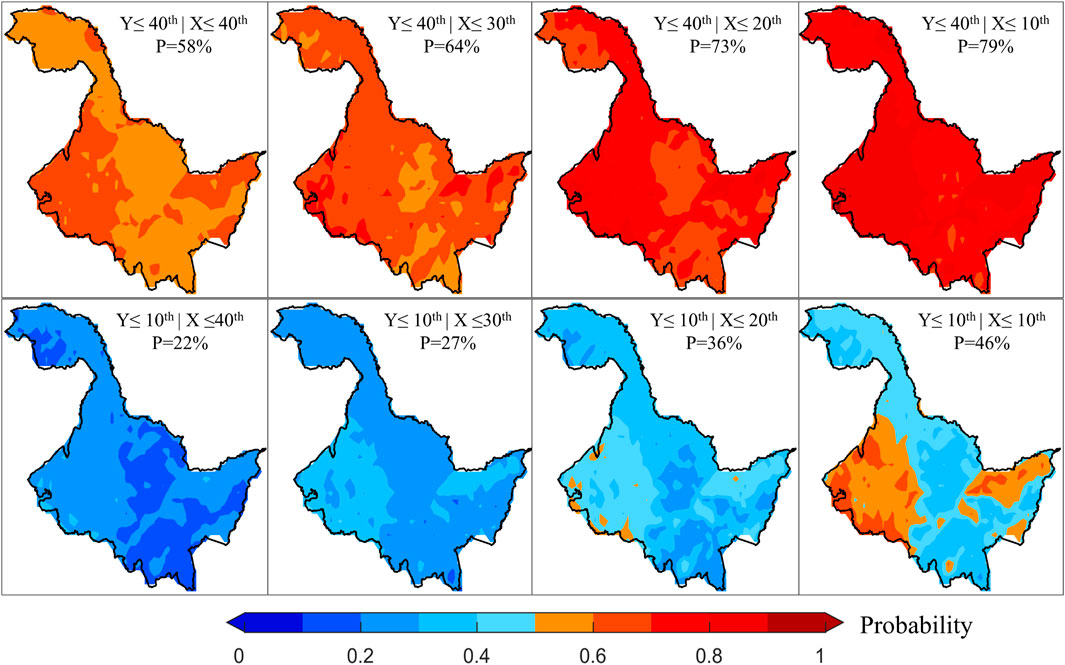
Figure 4. Changes in risk probability of causing different levels of vegetation loss under different levels of temperature stress during the positive correlation period. Here, X and Y represent temperature and NDVI, respectively, and P denotes the average risk probability value.
During periods of negative correlation, an increase in temperature will inhibit vegetation growth. For this reason, we also discussed the changes in the risk probabilities of vegetation loss due to increases in temperature (Figure 5). Similar to the results during the period of positive correlation, as the degree of temperature stress intensifies, the risk probability of vegetation loss shows an increasing trend. Moreover, the higher the extent of vegetation loss, the lower the risk probability becomes. Additionally, the risk probability values across different scenarios exhibit a high degree of spatial similarity, mirroring the spatial variations observed in Figures 3A,B. This suggests that in areas where vegetation is more sensitive to temperature changes, the risk of loss due to temperature stress is greater. When we further compare the risk probabilities between the two periods, it is evident that cooling has a more substantial impact on vegetation than warming, and the extent of this impact intensifies as the level of temperature stress increases. Particularly, when cooling reaches the 10th percentile and warming reaches the 90th percentile, the average difference in the risk probability of vegetation loss at the 10th percentile is as high as 17%. Risk probability values are greater than 50% for eastern and western HLJ during cooling. As a result, vegetation growth conditions in the region are significantly affected by temperature, warranting increased attention and heat prevention in the area.
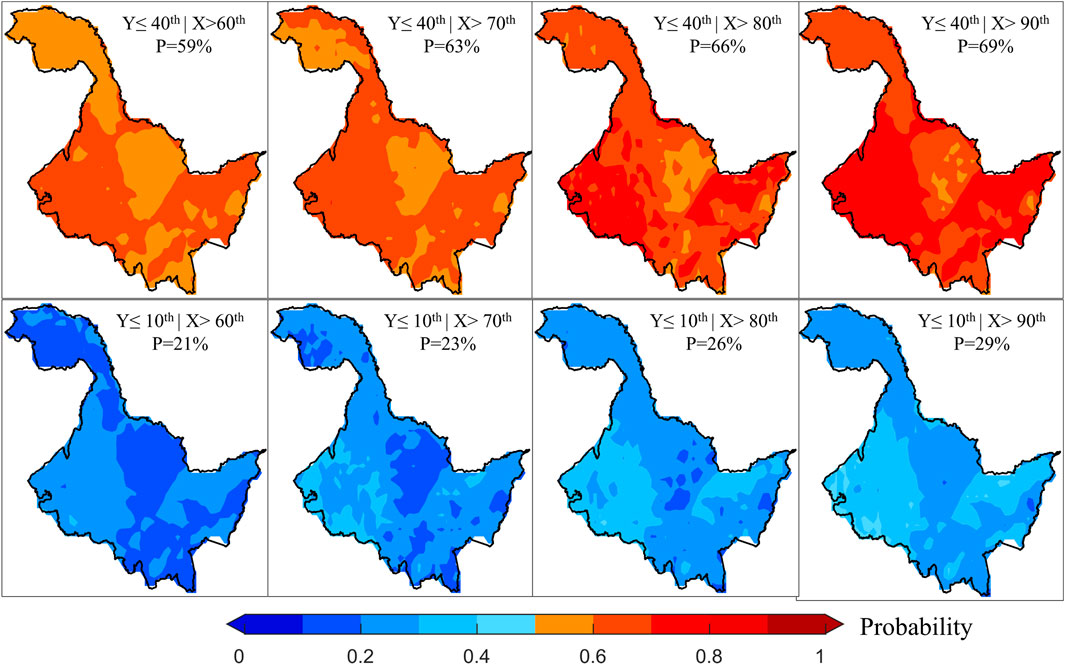
Figure 5. Changes in the risk probabilities of vegetation loss at various degrees under different temperature stresses during periods of negative correlation.
3.3 Effects of warming and cooling changes on ecosystems
In fact, although Figures 4, 5 provide detailed representations of vegetation loss risk under various scenarios. However, for government officials and farmers, they might be more concerned about the specific magnitude of temperature changes and their impact on vegetation. Therefore, we further quantified the risk changes of vegetation loss at the 40th percentile within each pixel, when temperatures increase or decrease by 1°C–4°C based on the mean temperature change (Figure 6). For each 1°C increase in temperature, the average risk probability increases by approximately 0.5%, while each 1°C decrease in temperature reduces the risk by about 0.7%. This indicates that cooling has a greater impact on vegetation than warming. Furthermore, the areas most affected by both warming and cooling are on the eastern and western sides of the study area, with the smallest impact observed in the northwest and central regions. These findings are highly consistent with earlier conclusions and serve to indirectly validate the accuracy and reliability of this study.
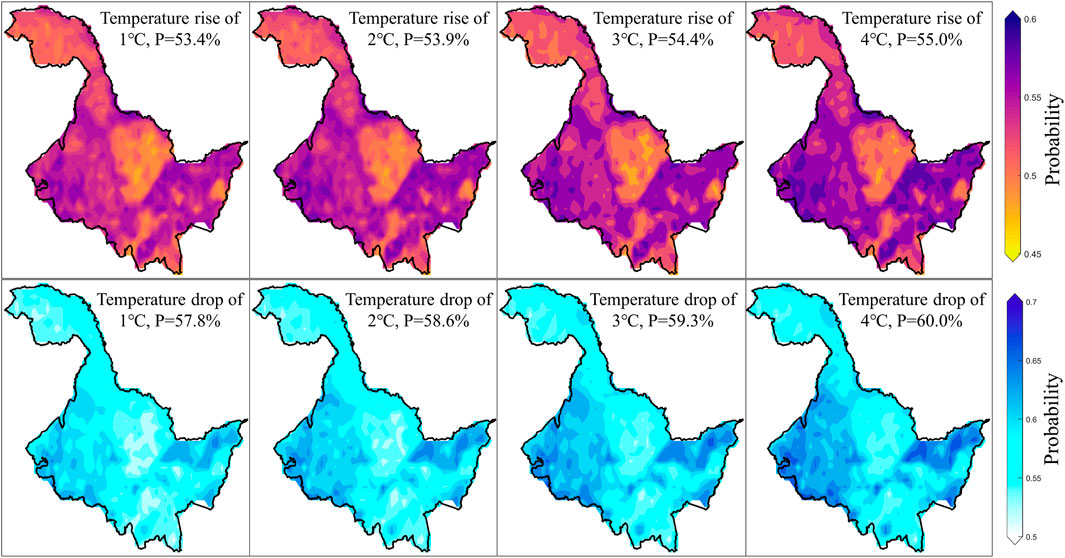
Figure 6. Changes in risk at the 40th percentile of vegetation loss for warming and cooling of 1°C–4°C compared to average temperatures.
Moreover, we conducted detailed risk analyses for farmland, forest, grassland and wetland ecosystems separately (Figure 7). Pixel counts for remaining ecosystem types constitute only about 5% of the total in the study area, and hence were not considered in this analysis. In both scenarios, distinct differences in the risk of loss due to temperature stress are evident across different ecosystems, exhibiting highly consistent patterns. Among these, the sensitivity to temperature changes ranked from highest to lowest is farmland, wetlands, grasslands, and forests. The risk probabilities for each ecosystem increase in a linear fashion. Simultaneously, this indicates that farmland has the lowest resilience to temperature stress, while forests exhibit the highest resilience. It has been shown that farmland ecosystems tend to have low carbon sequestration capacity and biodiversity, and a relatively weak resilience in the face of extreme climate events (Seddon et al., 2021). In contrast, systems such as forests have a higher carbon sequestration capacity and richer biodiversity. They are more resilient to climate change, especially in terms of climate and water regulation (Roy et al., 2022), and thus relatively less exposed to risk. These difference not only reveals the vulnerability of different ecosystems to future climate change, but emphasizes the need to consider the characteristics of different ecosystems when proposing measures or strategies such as climate change adaptation.
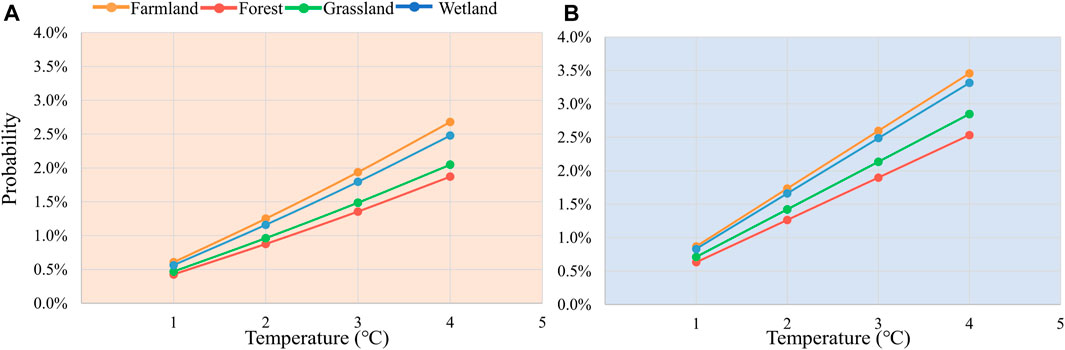
Figure 7. Changes in risk at the 40th percentile of ecosystem loss for different ecosystems for warming (A) and cooling (B) 1°C–4°C.
3.4 Reliability and limitations of the risk assessment framework
Traditional methods of assessing vegetation risk are common, but they often rely on deterministic approaches and single-scenario methods. In contrast to other natural variables such as soil moisture, runoff, and groundwater, vegetation dynamics are severely dependent on unilateral changes in precipitation or temperature. For example, lower precipitation and higher temperatures tend to cause a decrease in the above variables, thus exacerbating the risk (Han et al., 2021; Han et al., 2023b). However, vegetation can adjust its state in response to environmental changes, thus adapting to the evolution of natural conditions. To this end, this study proposes a model for assessing the risk probability of vegetation loss from warming and cooling changes. The risk probability of causing a certain level of vegetation loss under any temperature stress can be accurately quantified.
Further, we randomly selected a pixel (123.875°E, 46.375°N) and assessed the reliability of the framework by applying Gaussian and Clayton copulas to the NDVI and vegetation for both periods (Figure 8). It can be seen that the distribution of most observations and simulations results is more consistent, i.e., during periods of positive (negative) correlation, the modelled point changes also show positive (negative) correlation. More importantly, based on the properties of the copula function, it can be seen that the Calyton copula function has a more sensitive lower tail characteristic. Thus, the loss of vegetation under the cooling scenario can be better captured (Figure 8B). However, several limitations must also be acknowledged in this study. Firstly, although we chose different copula functions for different scenarios. However, the uncertainty inherent in the copula model itself also affects and is passed on to the assessment of the probability of risk (Leng and Hall, 2019). Secondly, we will only focus on the effect of temperature on vegetation and lack of consideration of other environmental factors. Therefore, more environmental factors as well as more appropriate methods can be considered in future studies.
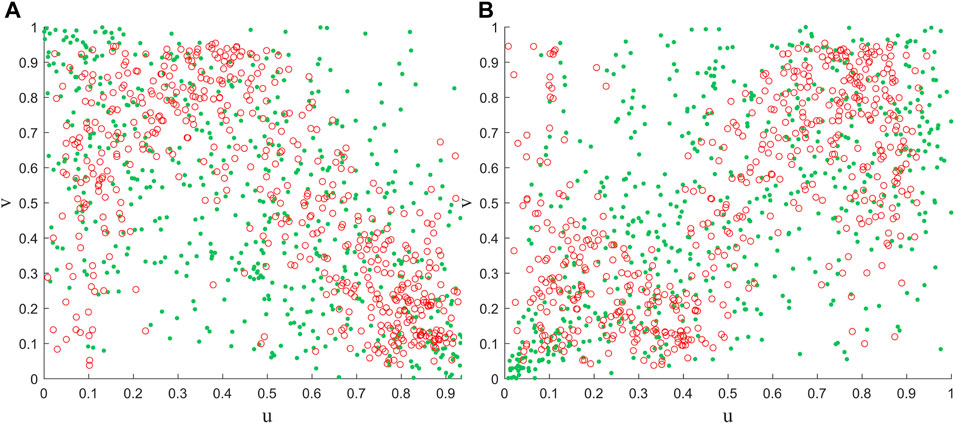
Figure 8. Comparison of observed combinations of air temperature and NDVI with simulated random variables using Gaussian (A) and Clayton copula (B), respectively. Where the red circles and green dots indicate the results of observations and simulations, respectively.
Overall, this study quantifies in detail the effects of warming and cooling on vegetation loss. It also explores the variability in the response of different ecosystems to changes in temperature. These provide new insights into the status of vegetation loss under temperature stress.
4 Conclusion
In this study, two copula functions with Bayesian conditional probabilities were used to assess the probability of risk to different vegetation losses under temperature stress in HLJ. While accounting for lag effects, this study quantified the impact of temperature increases and decreases of 1°C–4°C on vegetation loss across different ecosystems. The research identified that lag effects play a critical role in the risk of vegetation damage, with varying lag times leading to different sensitivities and risks of vegetation loss due to temperature changes. This study shows that at around 9 weeks and 23 weeks of lag, there is a maximum positive correlation and a minimum negative correlation with temperature, respectively. The correlation and risk loss scenarios in HLJ have a similar spatial distribution. The eastern and western parts of the province are the most sensitive areas in terms of vegetation response to temperature and are also at high risk of loss. Further analysis of the risk changes under warming and cooling stresses indicates that cooling has a greater impact on vegetation than warming. Different ecosystems exhibit varied probabilities of risk under temperature stress, with agricultural ecosystems showing lower resistance to temperature stress, while forest ecosystems demonstrate higher resilience.
These findings emphasize the practical importance of integrating the lagged effects of temperature stress for accurate assessment of vegetation damage in the context of global climate change. Additionally, future research should delve deeper into the interactions between different types of vegetation and their intrinsic mechanisms for climate adaptability. This would enable a more comprehensive understanding and prediction of vegetation responses to temperature stress. Such efforts will provide a scientific basis for the sustainable management and conservation of ecosystems.
Data availability statement
The original contributions presented in the study are included in the article/Supplementary material, further inquiries can be directed to the corresponding authors.
Author contributions
CF: Writing–original draft. HH: Validation, Writing–review and editing. TL: Formal Analysis, Writing–review and editing. YL: Supervision, Writing–review and editing. FY: Funding acquisition, Writing–original draft.
Funding
The author(s) declare financial support was received for the research, authorship, and/or publication of this article. This research was supported by the Foundation of Important Science and Technology Specific Projects of Ordos (ZD20232301).
Conflict of interest
The authors declare that the research was conducted in the absence of any commercial or financial relationships that could be construed as a potential conflict of interest.
Publisher’s note
All claims expressed in this article are solely those of the authors and do not necessarily represent those of their affiliated organizations, or those of the publisher, the editors and the reviewers. Any product that may be evaluated in this article, or claim that may be made by its manufacturer, is not guaranteed or endorsed by the publisher.
References
Becklin, K. M., Anderson, J. T., Gerhart, L. M., Wadgymar, S. M., Wessinger, C. A., and Ward, J. K. (2016). Examining plant physiological responses to climate change through an evolutionary lens. Plant physiol. 172 (2), 635–649. doi:10.1104/pp.16.00793
Bhattacharya, A. (2022). “Effect of low temperature stress on photosynthesis and allied traits: a review,” in Physiological processes in plants under low temperature stress (Springer Nature), 199–297.
Blauhut, V. (2020). The triple complexity of drought risk analysis and its visualisation via mapping: a review across scales and sectors. Earth-Science Rev. 210, 103345. doi:10.1016/j.earscirev.2020.103345
De Boeck, H. J., Dreesen, F. E., Janssens, I. A., and Nijs, I. (2011). Whole-system responses of experimental plant communities to climate extremes imposed in different seasons. New Phytol. 189 (3), 806–817. doi:10.1111/j.1469-8137.2010.03515.x
Fu, Y. H., Piao, S., Zhao, H., Jeong, S. J., Wang, X., Vitasse, Y., et al. (2014). Unexpected role of winter precipitation in determining heat requirement for spring vegetation green-up at northern middle and high latitudes. Glob. change Biol. 20 (12), 3743–3755. doi:10.1111/gcb.12610
Gillison, A. N. (2019). Plant functional indicators of vegetation response to climate change, past present and future: I. Trends, emerging hypotheses and plant functional modality. Flora 254, 12–30. doi:10.1016/j.flora.2019.03.013
Han, Z., Huang, S., Huang, Q., Leng, G., Liu, Y., Bai, Q., et al. (2021). GRACE-based high-resolution propagation threshold from meteorological to groundwater drought. Agric. For. Meteorology 307, 108476. doi:10.1016/j.agrformet.2021.108476
Han, Z., Huang, S., Peng, J., Li, J., Leng, G., Huang, Q., et al. (2023b). GRACE-based dynamic assessment of hydrological drought trigger thresholds induced by meteorological drought and possible driving mechanisms. Remote Sens. Environ. 298, 113831. doi:10.1016/j.rse.2023.113831
Han, Z., Huang, S., Zhao, J., Leng, G., Huang, Q., Zhang, H., et al. (2023a). Long-chain propagation pathways from meteorological to hydrological, agricultural and groundwater drought and their dynamics in China. J. Hydrology 625, 130131. doi:10.1016/j.jhydrol.2023.130131
Hoover, D. L., Hajek, O. L., Smith, M. D., Wilkins, K., Slette, I. J., and Knapp, A. K. (2022). Compound hydroclimatic extremes in a semi-arid grassland: drought, deluge, and the carbon cycle. Glob. Change Biol. 28 (8), 2611–2621. doi:10.1111/gcb.16081
Huang, M., Piao, S., Janssens, I. A., Zhu, Z., Wang, T., Wu, D., et al. (2017). Velocity of change in vegetation productivity over northern high latitudes. Nat. Ecol. Evol. 1 (11), 1649–1654. doi:10.1038/s41559-017-0328-y
Jia, G., Hu, W., Zhang, B., Li, G., Shen, S., Gao, Z., et al. (2022). Assessing impacts of the ecological retreat project on water conservation in the yellow river basin. Sci. Total Environ. 828, 154483. doi:10.1016/j.scitotenv.2022.154483
Khan, M. I. R., Asgher, M., and Khan, N. A. (2013). Rising temperature in the changing environment: a serious threat to plants. Clim. Change Environ. Sustain. 1 (1), 25–36. doi:10.5958/j.2320-6411.1.1.004
Leng, G., and Hall, J. (2019). Crop yield sensitivity of global major agricultural countries to droughts and the projected changes in the future. Sci. Total Environ. 654, 811–821. doi:10.1016/j.scitotenv.2018.10.434
Liu, Z., and Li, J. (2024). Responses of temporal and spatial changes of vegetation to climate factors in Heilongjiang Province from 2000 to 2020. For. Eng. 40 (1), 85–97.
Lu, Q., Jiang, T., and Liu, D. (2020). The response characteristics of NDVI with different vegetation cover types to temperature and precipitation in China. Ecol. Environ. Sci. 29 (1), 23–34.
National Research Council, Division of Behavioral, Policy Division, Board on Environmental Change, Committee on the Human Dimensions of Global Change, and Committee on Global Change Research (1999). Human dimensions of global environmental change: research pathways for the next decade. Washington, DC: National Academies Press.
Pan, D., Jiang, F., and Liu, W. (2018). On the grain production capacity and safeguard measures of Heilongjiang province. Mod. Agric. Res. (05), 11–13.
Rani, G., Kaur, J., Kumar, A., and Yogalakshmi, K. (2020). “Ecosystem health and dynamics: an indicator of global climate change,” in Contemporary environmental issues and challenges in era of climate change (Springer Nature), 1–32.
Reyer, C. P., Leuzinger, S., Rammig, A., Wolf, A., Bartholomeus, R. P., Bonfante, A., et al. (2013). A plant's perspective of extremes: terrestrial plant responses to changing climatic variability. Glob. change Biol. 19 (1), 75–89. doi:10.1111/gcb.12023
Roy, P. S., Ramachandran, R. M., Paul, O., Thakur, P. K., Ravan, S., Behera, M. D., et al. (2022). Anthropogenic land use and land cover changes—a review on its environmental consequences and climate change. J. Indian Soc. Remote Sens. 50 (8), 1615–1640. doi:10.1007/s12524-022-01569-w
Seddon, N., Smith, A., Smith, P., Key, I., Chausson, A., Girardin, C., et al. (2021). Getting the message right on nature-based solutions to climate change. Glob. change Biol. 27 (8), 1518–1546. doi:10.1111/gcb.15513
Wang, L., Huang, S., Huang, Q., Leng, G., Han, Z., Zhao, J., et al. (2021). Vegetation vulnerability and resistance to hydrometeorological stresses in water-and energy-limited watersheds based on a Bayesian framework. Catena 196, 104879. doi:10.1016/j.catena.2020.104879
Wu, D., Zhao, X., Liang, S., Zhou, T., Huang, K., Tang, B., et al. (2015). Time-lag effects of global vegetation responses to climate change. Glob. change Biol. 21 (9), 3520–3531. doi:10.1111/gcb.12945
Zhao, L., Dai, A., and Dong, B. (2018). Changes in global vegetation activity and its driving factors during 1982–2013. Agric. For. Meteorology 249, 198–209. doi:10.1016/j.agrformet.2017.11.013
Keywords: temperature stress, lag time, vegetation loss, risk assessment, heilongjiang province
Citation: Fu C, Hao H, Li T, Li Y and Yang F (2024) Lag effects of vegetation of temperature stress on and its ecological risk assessment. Front. Environ. Sci. 12:1424578. doi: 10.3389/fenvs.2024.1424578
Received: 28 April 2024; Accepted: 13 May 2024;
Published: 27 May 2024.
Edited by:
Jing Zhao, Xi’an University of Technology, ChinaReviewed by:
Panxing He, Henan Normal University, ChinaXiaoyu Meng, Henan University, China
Xiaojing Qin, Henan Polytechnic University, China
Copyright © 2024 Fu, Hao, Li, Li and Yang. This is an open-access article distributed under the terms of the Creative Commons Attribution License (CC BY). The use, distribution or reproduction in other forums is permitted, provided the original author(s) and the copyright owner(s) are credited and that the original publication in this journal is cited, in accordance with accepted academic practice. No use, distribution or reproduction is permitted which does not comply with these terms.
*Correspondence: Yuxin Li, MjAyMDAwNDNAaW1tdS5lZHUuY24=; Fang Yang, eWFuZy5mYW5nQGNyYWVzLm9yZy5jbg==