- College of Economics and Management, Northwest A&F University, Yangling, China
The selection of effective carbon reduction strategies and the management of agricultural greenhouse gas (GHG) emissions are critical issues in climate change mitigation. Different climate actions can lead to varied pathways for agricultural GHG emissions. This study constructs a Computable General Equilibrium (CGE) model for Chinese agriculture to identify which measures can contribute to achieving established climate governance objectives, exploring potential net emission pathways for agricultural GHG. On this basis, we provide a rationale for selecting emission reduction measures. Our findings indicate that: (1) Carbon taxation is an indispensable climate action for achieving China’s “dual carbon” goals and net-zero emissions, necessitating combination with other mitigation strategies; (2) Carbon sequestration, non-agricultural carbon taxation, and CCUS measures can alter the net emission trajectory of agricultural GHG, and carbon sequestration shows the most significant impact; (3) Based on the ‘dual carbon’ or net-zero emission goals, China’s agricultural GHG emission pathway might exhibit a flat M-shaped characteristic, whereas intensifying carbon sequestration efforts could lead to an inverted V-shaped trajectory. Our results offer decision-making support for the formulation of GHG emission reduction measures in China.
1 Introduction
Global warming is a major climate change problem. China, demonstrating its responsibility as a major nation, reiterated its commitment to the goals and principles of the “United Nations Framework Convention on Climate Change”and the “Paris Agreement” at the 28th Conference of the Parties (COP28), actively implementing policy and systemic arrangements to address climate change. China has implemented the national strategy of actively responding to climate change, and has taken measures to adjust industrial structure, optimize energy structure, strive to improve energy efficiency, promote the development of carbon markets, and increase forest carbon sequestration. To this end, China has proposed climate strategic targets of achieving “dual carbon” and “net-zero emission”. The dual carbon target refers to China’s goal of reaching peak carbon dioxide emission before 2030 and striving to achieve carbon neutrality before 2060 (Sun et al., 2022). The net-zero emission target means taking actions to offset greenhouse gas emission (Liu Z. et al., 2023). Clearly, the net-zero emission target is more stringent than the dual carbon target, which is an aspirational goal to be strived for, while the dual carbon target is a commitment.
Common emission reduction measures include administrative orders, carbon taxes, carbon emissions trading, carbon sequestration, and CCUS (Carbon Capture, Utilization, and Storage). Except for carbon tax, these measures have been implemented in China. There is a wealth of research on these emission reduction strategies. Nordhaus (1992) found through the Dynamic Integrated Climate-Economy model (DICE) that administrative orders could lead to significant economic costs, whereas a moderate carbon tax is an effective method for emission reduction. Zhang et al. (2016) used a Computable General Equilibrium (CGE) model to simulate the impact of carbon tax across various regions in China, revealing that while a carbon tax might negatively affect provincial economies, a moderate tax rate could be an effective emission reduction policy. Huang et al. (2022) analyzed carbon emissions trading and carbon tax in terms of emission reduction effectiveness, costs, and implementation barriers, providing strong theoretical support for the Chinese government in choosing and developing carbon reduction tools. Academic research on carbon sinks primarily focuses on total volume estimation (Xia et al., 2023) and carbon storage potential assessment (Zhang et al., 2023). Piao et al. (2022) investigated the evolution of carbon sinks in China’s terrestrial ecosystems, offering a scientific basis for the country’s afforestation and carbon enhancement measures. CCUS technology, encompassing carbon capture, storage, and reuse, represents an effective technical measure for carbon reduction. Dou et al. (2023) systematically reviewed the development trends of the CCUS industry domestically and internationally, noting that China is at a critical juncture transitioning from field trials to industrialization, with a focus on improving recovery rates. All of the above studies focus on a single measure and do not discuss the combination of measures. Recently, some scholars have begun to study multiple emission reduction measures at the same time. For example, Jiang et al. (2023), Jiang et al. (2024) used the CGE model to evaluate the impact of four emission reduction methods to achieve carbon neutrality on China’s macro economy and environment, and specifically studied the impact of different technological changes on the overall social economy and energy environment.
Agriculture, one of the industries most sensitive to climate change, is a significant source of GHG emissions, particularly non-CO2 GHG (Zhao et al., 2022). In China, agricultural GHG emissions are estimated to be around 800 million tons annually, a figure that cannot be overlooked in emission reduction efforts. Current literature on agricultural GHG mitigation focuses on three main areas: 1. Composition and accounting of agricultural emissions: Research by Zhang T. et al. (2022) using a dynamic computable general equilibrium model has shed light on the structure and trends of China’s agricultural emissions. Similarly, studies by Hu et al. (2023) have estimated the peak and potential future decline of agricultural GHG, while Luo et al. (2019) have analyzed the spatiotemporal patterns of China’s N2O emissions. 2. Factors influencing agricultural emissions: Various studies have explored the determinants of agricultural GHG outputs, including vegetation cover (Chen et al., 2020), production methods (Pu et al., 2022; Du et al., 2023), input factors (Liu and Zhang, 2011; Gong et al., 2022), utilization of crop residues (Shi et al., 2023), and trade networks (Zhao et al., 2020). 3. Mitigation measures: Research has also focused on strategies to reduce agricultural GHG emissions, such as improving crop production methods (Wang et al., 2016; Yu et al., 2022), optimizing animal manure management (Xue et al., 2019; He et al., 2023), and developing bioenergy (Shi et al., 2023; Yu et al., 2024).
One notable limitation of existing research is the failure to integrate non-agricultural carbon mitigation measures with agricultural GHG emissions within a unified research framework. Considering agricultural reduction measures and research solely from an agricultural perspective may overlook the top-down characteristics inherent in climate strategic planning. Ignoring a global perspective means neglecting the systemic thinking required for climate strategy development. Furthermore, according to data from the National Bureau of Statistics, in 2022, agriculture accounted for no more than 7.3% of the tertiary sector and is on a declining trend. Given agriculture’s vulnerability, it is imperative not to overlook the impact of other industries on agriculture when analyzing agricultural climate change issues. It is because that the upstream and downstream industries of agriculture may have a significant impact on agriculture through the input-output relationship. Therefore, a general equilibrium analysis method based on systemic thinking holds significant application value. Additionally, existing studies have not adequately considered the impact of the “dual carbon” (Sun et al., 2022) and net-zero emission climate strategic goals (Liu Z. et al., 2023) on the agricultural GHG emission trajectory.
Accordingly, this paper aims to carry out the following studies: First, this paper employs a computable general equilibrium model, taking into account the influences of various industries, especially the energy sector, to explore the feasibility of achieving “dual carbon” targets and net-zero emission strategies through carbon sequestration, CCUS, carbon taxation, and their combined measures. Next, it investigates the net emission trajectory of agricultural GHG under baseline scenarios and potential measures. Then, it examines the necessary subsidy costs for farmers to offset welfare losses and mitigate urban-rural disparities, and last, summarizes and analyzes the merits and demerits of potential measures, proposing a basis for measure selection using the entropy weight method.
The main contributions of this paper are as follows: First, this paper integrates non-agricultural carbon mitigation measures with agricultural GHG emissions within a unified research framework to analyze agricultural climate change issues from a global perspective. Second, this paper explores in depth the impact of the “dual carbon” and net-zero emission climate strategic goals on the agricultural GHG emission trajectory. Third, in this paper, the combination measures of carbon tax, carbon sink, and ccus are studied.
2 Model and data
2.1 The China agricultural computable general equilibrium model
The Computable General Equilibrium (CGE) model, grounded in general equilibrium theory, employs mathematical equations to represent the economic activities of an entire society. This model delineates the interactions among various sectors and variables within an economic system through a set of simultaneous equations, focusing on how the supply and demand of various goods and production factors reach an equilibrium state through price adjustment mechanisms. The CGE model utilized in this study is developed based on insights from the CEEEA2.0 (Jia and Lin, 2022) and CHINAGEM-E models, comprising fundamental modules such as production, income and expenditure, trade, equilibrium and macro closure, and energy and environment. Compared with these models, our model can analyze the problems of agricultural greenhouse gas emissions in China.
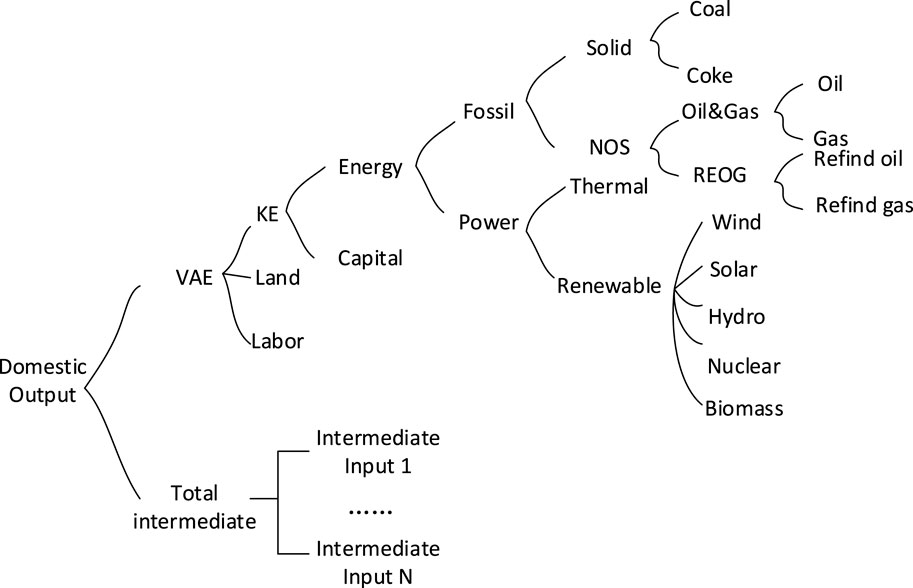
In the production module, this study employs a seven-tier nested production technology (as illustrated in Figure 1), incorporating Leontief’s production technology for composite intermediate inputs, with other input components treated as CES production technology. The model categorizes input factors into labor, capital, and land; it further subdivides the agricultural sector into 14 sub-sectors, including rice, wheat, maize, soybeans, potatoes, oil crops, cotton, sweeteners, vegetables, fruits, other crops, forestry products, livestock products, and fisheries. The energy sector comprises coal, petroleum, natural gas, refined petroleum, refined natural gas, and electricity departments, with the electricity department further divided into thermal, hydro, wind, nuclear, solar, and biomass energy sub-departments. Drawing from CEEEA2.0, the model incorporates a mechanism for firms to adjust production efficiency in response to energy-environmental policies and energy price shocks.
The income-expenditure module provides a detailed account of cash flows among households, businesses, governments, and international entities. Households acquire income from the factor market through labor remuneration and investment returns, and receive transfer payments from the government, which they then allocate towards consumption, savings, and taxation. Business revenues are primarily derived from product market sales, capital gains in the factor market, and government transfer payments. Capital gains not only circulate to businesses and households but also partially flow abroad. The income obtained by businesses is chiefly used for labor compensation, capital returns, and taxation. Government revenue originates from various taxes, including direct taxes on households, indirect taxes on businesses, carbon taxes, and tariffs. Income for other global regions stems from domestic imports and capital gains, with expenditures related to domestic exports and capital repayments. Within the income-expenditure module, the Linear Expenditure System (LES) demand function is utilized for the long-term simulation of household demand, reflecting changes in consumption structure.
In the trade module, “the Armington assumption” is followed, employing the Constant Elasticity of Substitution (CES) function to describe the imperfect substitutability between domestic and imported goods. Moreover, the Constant Elasticity of Transformation (CET) function is used to depict the allocation decisions between exports and domestic sales for domestically produced goods.
In the equilibrium and macroeconomic closure module, market clearing is ensured by equating the demand and supply of each element. Given that the scenario designs in this study are intended for long-term simulation, a neoclassical closure condition is adopted for the macroeconomic closure.
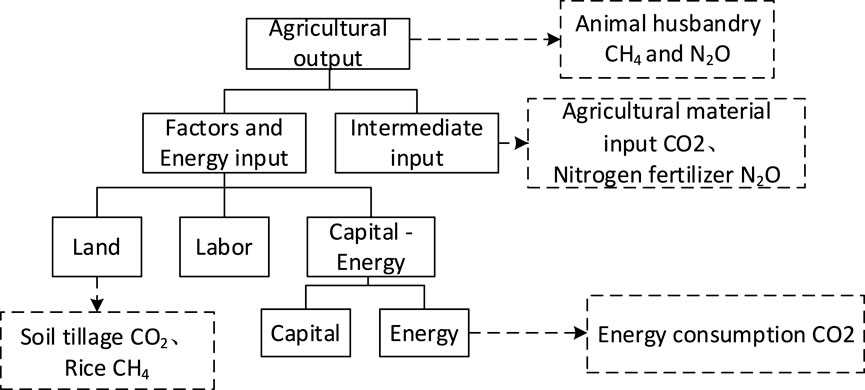
The energy-environment module delineates GHG emissions. As illustrated in Figure 2, agricultural GHG emissions are primarily designed with reference to Zhang X. et al. (2022) and CHINAGEM-E. Emissions from the crop sector are composed of three parts: ① carbon emissions induced by the input of agricultural materials, specifically including fertilizers, pesticides, and agricultural films in the intermediate input side, and energy inputs in the agricultural sector comprising coal, oil, natural gas, and electricity, along with arable land; ② methane emissions from rice cultivation; and ③ nitrous oxide emissions from the use of nitrogenous fertilizers at the intermediate input stage. Livestock emissions predominantly consist of: ① CO2 from energy inputs; ② CH4 emissions from enteric fermentation in livestock; and ③ CH4 and N2O emissions from manure management systems. Other industries are considered only for carbon emissions induced by energy inputs. To integrate a realistic physical account of GHG emissions into the CGE model, this study, drawing upon CHINAGEM-E and Zhao et al. (2022), assumes that the emission growth rate of each product is equal to its demand growth rate, as follows:① emission growth rate induced by factors equals the growth rate of factor demand; ② emission growth rate induced by intermediate inputs equals the growth rate of intermediate input demand; ③ emission growth rate induced by output equals the growth rate of output demand.
2.2 Data
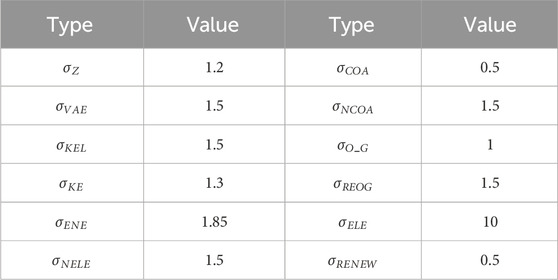
In this study, we expanded the SAM(Social accounting matrix) based on the “China Input-Output Table” (2020) consolidating 153 industrial sectors into 39. This integration and segmentation drew inspiration from the construction methodology employed in the GTAP database (Peters et al., 2011), specifically for the agriculture and electricity sectors. In this paper, the CGE model is used for country level analysis, while the GTAP model is used for global level analysis. However, since they are both CGE models, the database construction method is the same. The agricultural sector is split based on cost-benefit data and values of production. The power sector is split on the basis of output values. Due to inconsistencies in data sources, we applied the RAS method for adjustments. The agricultural data were derived from the “China Rural Statistical Yearbook” (2021), import data for various products were obtained from the official website of the General Administration of Customs of China, and electricity data were sourced from the “China Electricity Statistical Yearbook” (2021). The baseline data for 2020 GHG physical accounts were calculated using emission factors, with specific reference to carbon emission factors from Wei et al. (2022) and Li et al. (2011), and CH4 and N2O emission factors from Tian and Zhang (2013) The parameters involved in the model refer to CEEEA2.0 and CHINAGEM-E models (Table 1).
3 Scenario assumptions
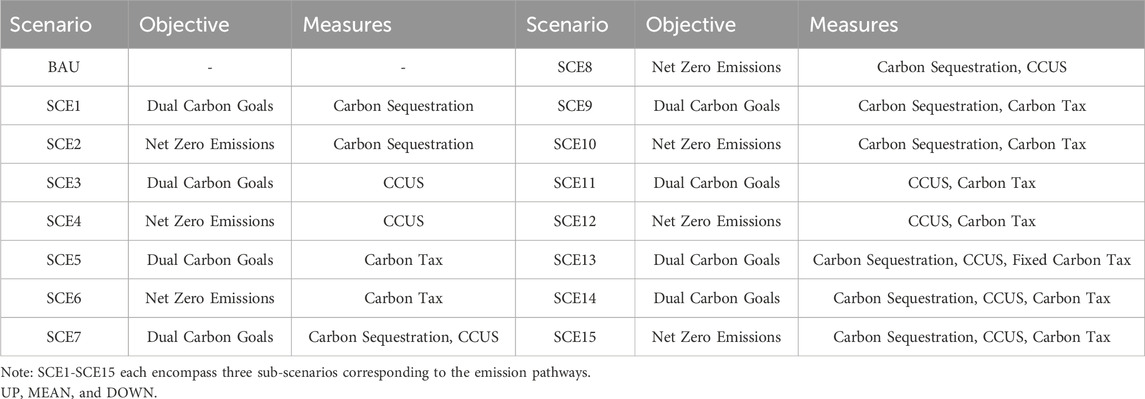
This study delineates 46 distinct scenarios as outlined in Table 2. The 46 scenarios are based on different combinations of climate targets, types of measures, and intensity of measures’ implementation. These encompass: a baseline scenario (BAU); six individual measure scenarios achieving “dual carbon” goals or net-zero emissions through carbon sequestration, CCUS, and carbon taxation; six scenarios combining two out of the three measures to achieve both types of goals; and three scenarios integrating all three measures to attain the specified objectives. Notably, in these scenarios, the carbon tax rate is dynamically adjusted, with an additional scenario incorporating a fixed carbon tax rate for comparative analysis. In the scenario of dynamic adjustment of carbon tax rate, the carbon tax rate is changed into endogenous variable, and the optimal carbon tax rate can be obtained by solving the cge model. Excluding the baseline, the remaining 15 scenarios each include three emission trajectories: optimistic (UP), moderate (MEAN), and pessimistic (DOWN), thus forming 46 scenarios in total.
The baseline scenario is set with reference to Jia and Lin (2022). Under the baseline scenario, without the intervention of the three emission reduction measures, carbon emissions are projected to peak in 2035, followed by a gradual decline to 8,490,664.2 thousand tons by 2060. For scenarios with emission reduction interventions, to facilitate comparative analysis, uniform optimistic (UP), moderate (MEAN), and pessimistic (DOWN) emission trajectories are established. The optimistic trajectory requires the least cumulative emission reduction effort in the later stages, whereas the pessimistic trajectory necessitates the greatest. All three trajectories peak in 2030 and reach net-zero emissions by 2060, each modeled with a quadratic function. The carbon sink trajectory is based on the research by Piao et al. (2009), Piao et al. (2022), while the CCUS trajectory is derived from studies by Everbright Securities. The fitted curves of the carbon sink path and the CCUS path are incorporated into the CGE model. The emission reductions at key times are shown in Table 3. The carbon tax measure exempts the agricultural sector. Additionally, it is assumed that carbon sequestration measures are in place by 2020, with CCUS and carbon tax measures commencing in 2024.
4 Simulation results
4.1 Model validation
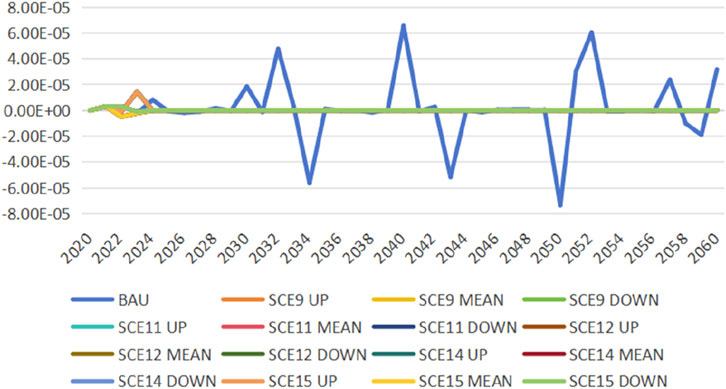
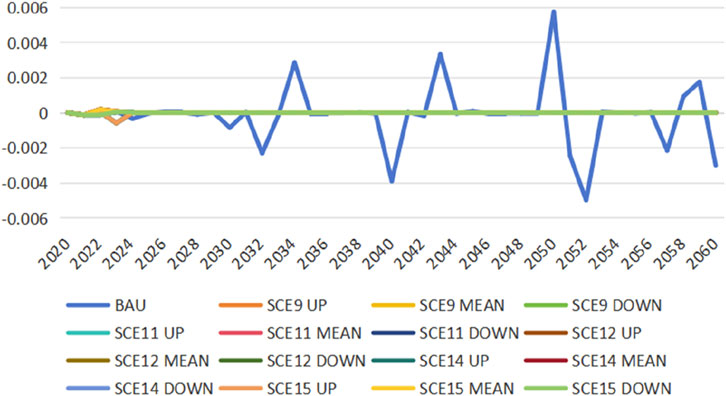
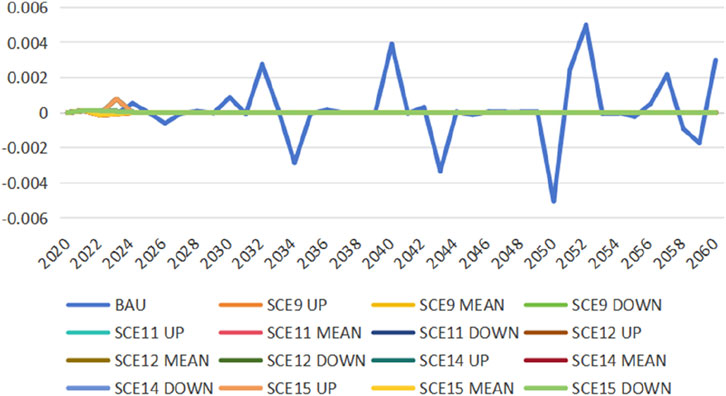
The model validation method is referred to Jia and Lin (2022). To verify the correctness of the model’s configuration, this study introduces three dummy variables: Walras, GDPCHK1, and GDPCHK2. The Walras variable, when equal to or nearly zero, indicates an equilibrium in the product market where total supply equals total demand. This means that the model is set correctly. The GDP measurement employs three accounting methods: the expenditure approach, the production approach, and the income approach. GDPCHK1 is calculated as the difference between the expenditure and production approaches, while GDPCHK2 is derived from the difference between the production and income approaches. A model is considered accurately configured when these three variables are equal to or approach zero. Figures 3–5 sequentially present the simulation results for the Walras, GDPCHK1, and GDPCHK2 variables, respectively, in scenarios with feasible solutions. The observed outcomes affirm the model’s validity because all three variables are very close to zero. Although the fluctuation of the three variables in the BAU scenario is large, they are very close to zero, so the model is still set correctly.
4.2 BAU
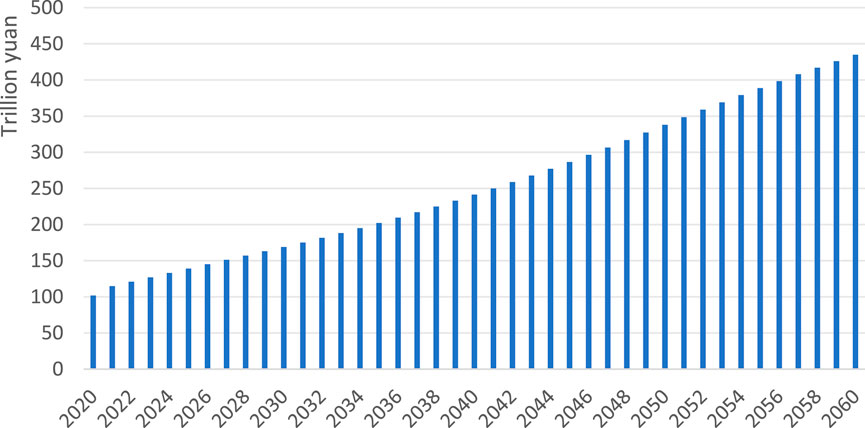
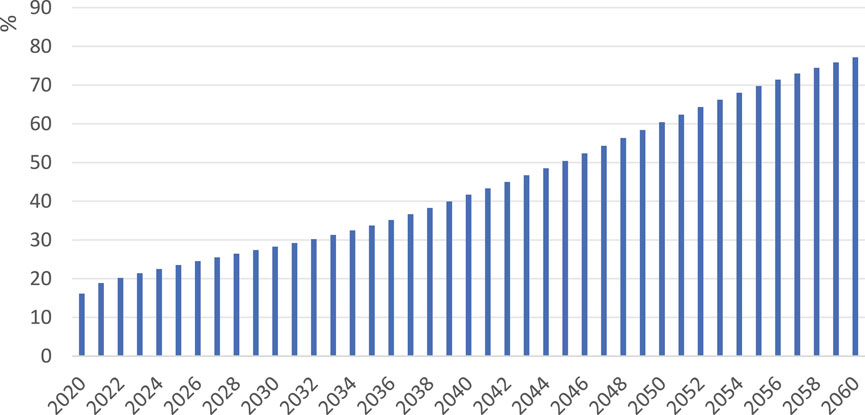
In the BAU, GDP increases year by year (Figure 6). Among them, the GDP will reach 139 trillion yuan in 2025, 169 trillion yuan in 2030, 338 trillion yuan in 2050 and 435 trillion yuan in 2060. In terms of energy structure (Figure 7), the proportion of new energy in BAU shows an increasing trend year by year. Among them, the proportion of new energy will reach 24% in 2025, 28% in 2030, 60% in 2050 and 77% in 2060.
4.3 Feasibility analysis
In simulating 46 scenarios, feasible solutions were identified only for 15 scenarios corresponding to SCE9, SCE11, SCE12, SCE14, and SCE15. Under the SCE13 scenario, simulations of a fixed real carbon tax incrementing from 0 to 1,000 yuan per ton in 3,000 iterations failed to achieve the dual carbon goals and the net-zero emission target. This indicates that a fixed real carbon tax model, adjusted solely based on the inflation rate, is not suitable for China. Instead, a dynamic, counter-cyclical adjustment model for carbon tax is more appropriate. The absence of feasible solutions for SCE1-SCE8 suggests that individual carbon sequestration, CCUS, carbon taxation or combined measures of carbon sequestration, CCUS are inadequate to meet the dual carbon goals and the net-zero emission target. Similarly, the lack of a feasible solution for SCE10 indicates that the combination of carbon sequestration and carbon tax measures does not suffice to achieve the net-zero emission target. These simulation results collectively underscore that carbon taxation is indispensable and must be integrated with other emission reduction measures to achieve the set objectives.
4.4 Pathways for net GHG emissions in agriculture
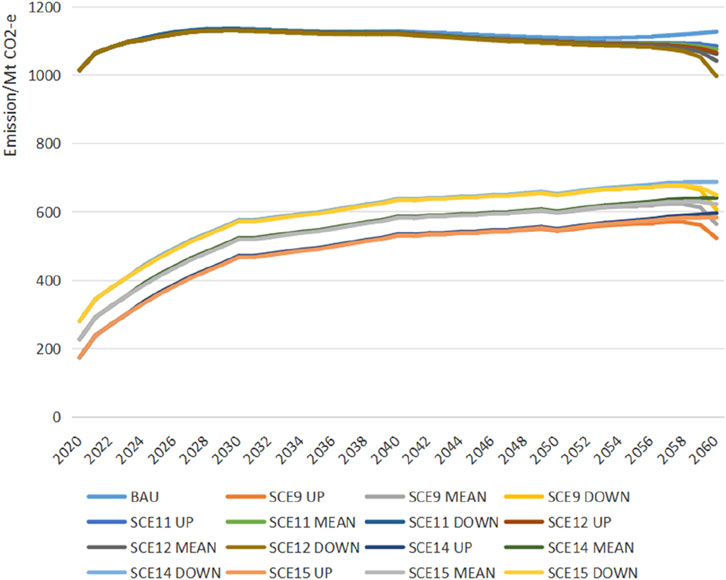
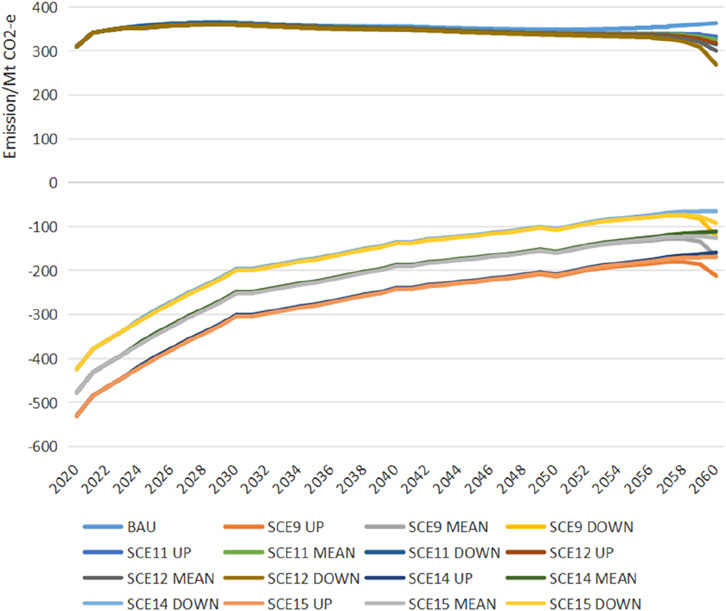
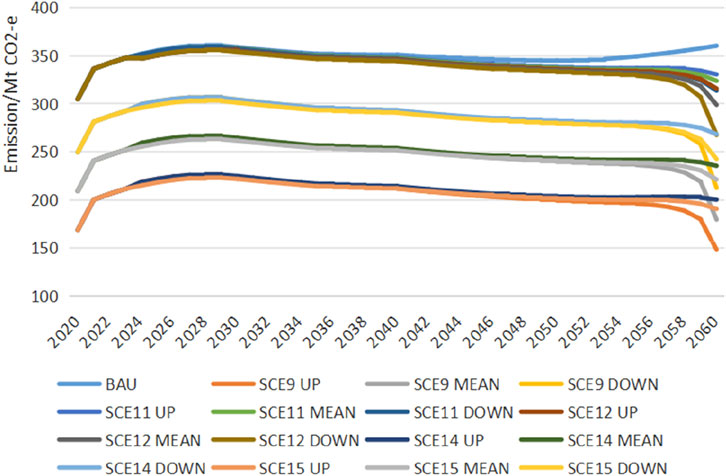
Figure 8 illustrates the pathways of net GHG emissions in agriculture under a baseline scenario and various emission reduction scenarios. In the baseline scenario, the pathway of net agricultural GHG emissions exhibits a flattened M-shape, with peaks occurring in 2029 and 2040, and troughs in 2035 and 2052, followed by a continuous rise post-2052. The pathways under scenarios SCE11 and SCE12 maintain this flattened M-shape characteristic, yet post-2052, they no longer rebound after hitting the bottom. A sharp decline post-2058 indicates that concentrated efforts in a short span around 2058 are imperative to achieve the dual-carbon or net-zero emission targets. Conversely, the pathways under scenarios SCE9, SCE14, and SCE15 resemble an inverted V-shape, peaking around 2059. Overall, the long-term effects of emission reduction measures manifest as initially most significant, diminishing over time, with signs of recovery around 2059. A comparison between scenarios SCE9, SCE14, SCE15, and SCE11, SCE12 reveals that, compared to carbon tax and CCUS measures, carbon sequestration strategies can significantly alter the pathway of net agricultural GHG emissions, demonstrating more pronounced effects. Furthermore, under the UP, MEAN, and DOWN emission pathways, the corresponding net agricultural GHG emission pathways under different reduction measures exhibit variations. This indicates that focusing reduction efforts in the early, late, or spreading them evenly across stages can lead to varying degrees of modification in the net agricultural GHG emission pathways.
A comparative analysis between Figures 8, 9 reveals that the pathways for net carbon emissions in agriculture align closely with those for net GHG emissions. This alignment suggests that the characteristics of the net GHG emission pathways are similar to those of the net carbon emission pathways. The inclusion of CH4 and N2O accounting does not alter the pathway shape but affects the timing and magnitude of the peaks and troughs. Under the baseline scenario, the flattened M-shaped pattern is characterized by peaks in 2028 and 2041 and troughs in 2039 and 2050. A comparison of scenarios SEC11, SEC12 with SEC14, SEC15 in Figure 8 indicates that, with carbon sequestration measures in place, agricultural carbon sinks exceed sources until 2060, contributing to the offset of GHG emissions from energy sources, although this offsetting capacity diminishes over time.
Analyzing the agricultural carbon emission structure reveals that planting industry is the principal source of carbon emissions, thus fundamentally shaping the net GHG emission pathways in agriculture. The flattened M-shaped trajectory observed in Figure 10 substantiates this assertion. It is also noted that carbon emissions from the planting industry subsector consistently exceed carbon sequestration, indicating that the agricultural sector’s contribution to carbon sequestration in the energy sector predominantly originates from the forestry subsector.
4.5 Cost of subsidies for farmers
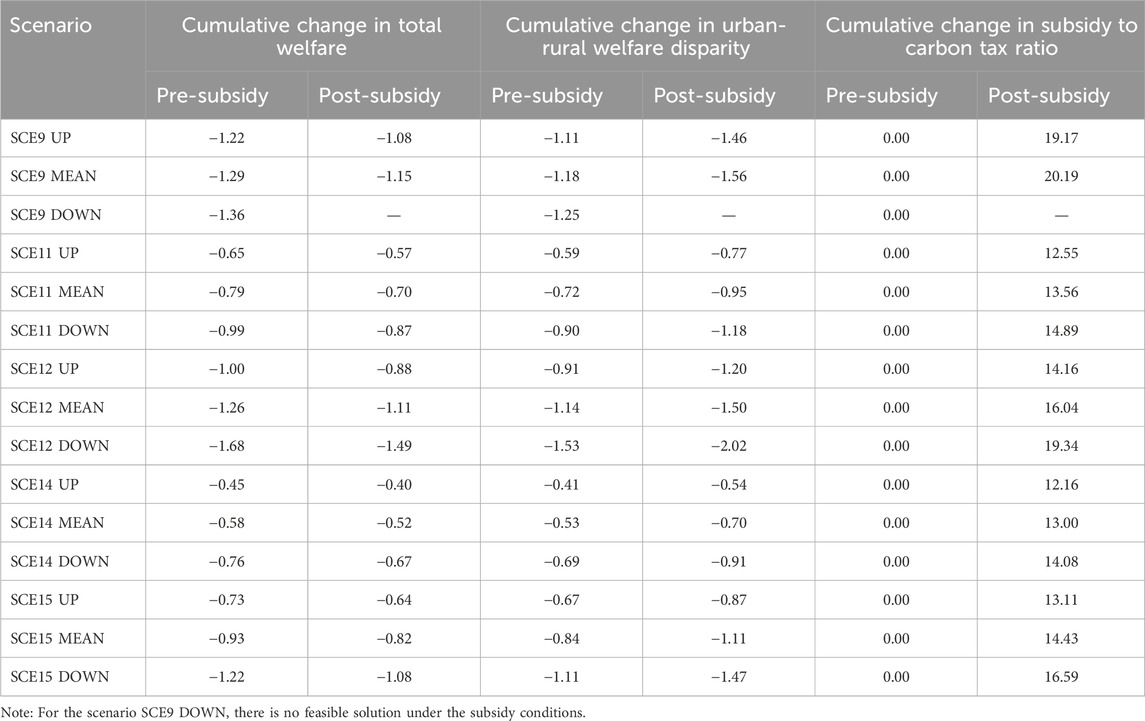
Under the baseline scenario, the cumulative economic welfare ratio between urban and rural areas is projected to be 6.59:1.00 by 2,060, indicating a disadvantaged position for farmers. The first and second columns of Table 4 illustrates that in scenarios SCE9, SCE11, SCE12, SCE14, and SCE15, the total welfare of urban and rural residents decreases, yet the interventions can mitigate the disparity in economic welfare between these two groups. To counteract the trend of urban-rural polarization and offset the potential welfare losses for farmers due to these measures, it is essential to provide additional subsidies to farmers. The subsidy scenario simulations (Table 4) demonstrate that the subsidy costs required to offset the welfare losses for farmers are less than 21% of the cumulative carbon tax revenue, suggesting substantial room for adjustment in using carbon tax schemes to support farmers and promote urban-rural equity. The unfeasibility of the SCE9 DOWN subsidy scenario indicates that when coordinating farmer subsidies, the intensity of emission reduction through carbon taxes and carbon sink measures should not be disproportionately allocated to later stages but rather distributed more evenly across different periods or focused on earlier stages.
4.6 Selection of Emission Reduction Measures
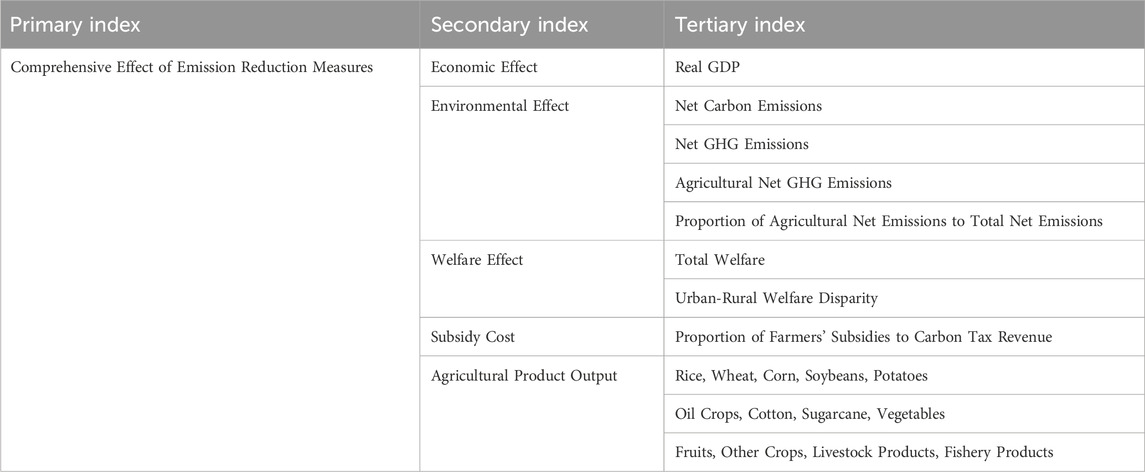
To facilitate a comparative analysis of the merits and demerits of various emission reduction measures, this study has developed an evaluation index system for emission reduction measures based on the simulation results of CGE model variables (as shown in Table 5). The evaluation index system considers the overall impact of emission reduction measures from the perspectives of efficiency and equity, encompassing economic, environmental, and welfare effects. It also takes into account the implications for agriculture, including subsidy costs and agricultural output, thereby laying the groundwork for subsequent qualitative and quantitative comparative analyses. The results of qualitative comparison can be used as a reference for the formulation of measures to achieve specific governance objectives, while the results of quantitative comprehensive comparison can be used as a reference for the formulation of measures to achieve comprehensive governance objectives.
Our qualitative comparison reveals that various measures contribute to narrowing the urban-rural welfare disparity, with carbon sequestration strategies being particularly effective in reducing agricultural GHG emissions. However, these measures generally lead to decreases in total welfare, real GDP, and agricultural output, while CCUS (Carbon Capture, Utilization, and Storage) strategies are counterproductive in mitigating agricultural GHG emissions. Table 6 provides a comparative overview of these measures, where a grading scale from one to five reflects the extent of farmers’ cost subsidies and the reduction in other variables, offering a reference for selecting measures based on specific objectives. The variables in Table 6 are derived from the three-level indicators in Table 5. According to the comparison of the CGE simulation results of each variable, the score values of 1–5 grades are determined. It is evident that the combination of carbon sequestration and carbon tax strategies, aimed at dual carbon goals, are most favorable for reducing agricultural GHG emissions but result in a greater reduction in real GDP. In contrast, the combination of CCUS and carbon tax measures, aimed at dual carbon goals, despite incurring the second-lowest loss costs, are least effective in emission reduction. Measures combining CCUS and carbon tax, aimed at net-zero emissions, optimally balance urban-rural welfare equity and show improved emission reduction compared to their dual carbon goal counterparts, yet they incur the highest total welfare loss. Strategies that combine carbon sequestration, CCUS, and carbon tax, targeting dual carbon goals, result in the least reduction in real GDP, total welfare, and agricultural output, with the lowest subsidy costs for farmers, but offer moderate emission reduction effectiveness. Lastly, measures integrating carbon sequestration, CCUS, and carbon tax, aimed at net-zero emissions, exhibit the highest emission reduction efficacy, with moderate loss costs.
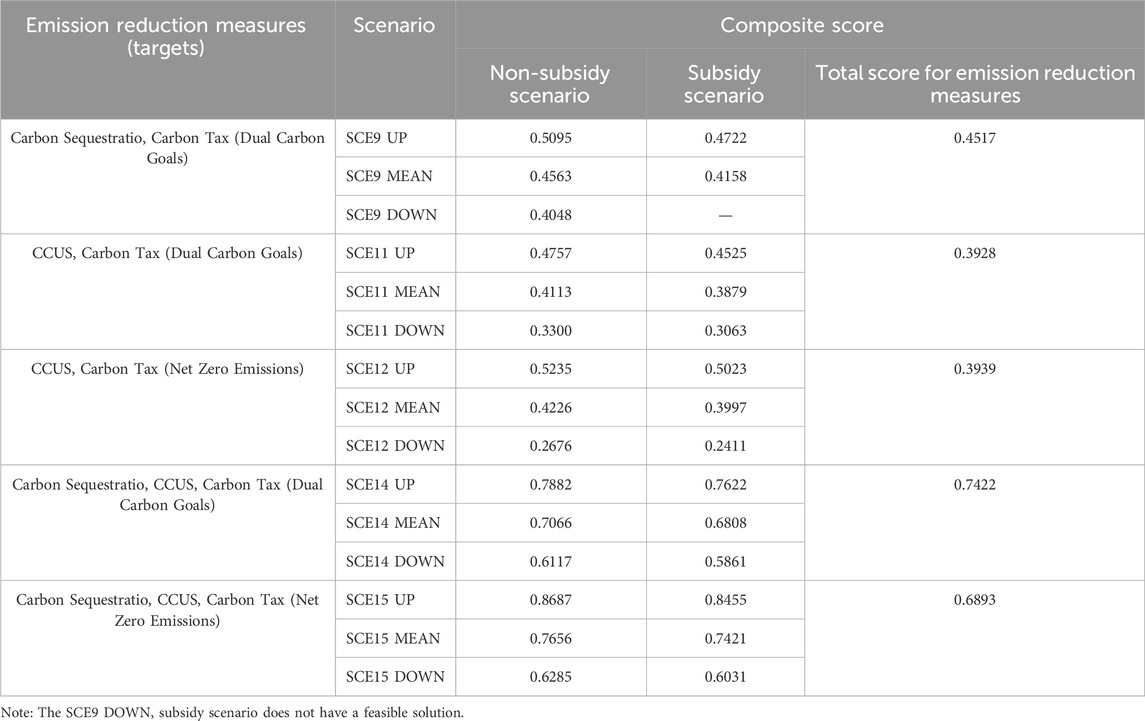
Quantitative comprehensive comparison employs the entropy weight method to calculate the composite score (as shown in Table 7). The results in Table 7 are calculated by the index system in Table 5 using the entropy weight method. The index values are derived from CGE simulation results. The comprehensive scores of emission reduction measures can be used to compare the advantages and disadvantages of various measures when considering the overall effects, while the composite scores of scenarios can be used to compare the comprehensive effects of various measures under different intensities of allocation measures in different periods.
5 Discussion
Through the feasibility analysis of 46 scenarios, this paper found that carbon tax was indispensable for China to achieve the dual carbon goal or net zero emission goal. Tan and Sun. (2019) found that carbon tax had a medium and long-term effect on carbon emission reduction. The same findings are found in this paper. And through the simulation of the fixed carbon tax scenario, this paper found that China was more suitable for the dynamically adjusted carbon tax rate. Consistent with Zhang T. et al. (2022), if China implements carbon tax measures, it should improve the coordination between the carbon tax system and other low-carbon transformation policies to promote the coordinated realization of economic growth and carbon emission reduction targets. Existing studies on carbon sink focus on the measurement of total amount (She et al., 2017; Jia et al., 2024), while those on CCUS focus on the assessment of contribution to emission reduction (Li et al., 2016; Liu M. et al., 2023). However, existing studies have not studied the effect of the combination of carbon tax, carbon sink and CCUS, such as the impact on agricultural greenhouse gas emissions. In this study, we found that carbon sink, non-agricultural carbon tax and CCUS measures would change the path characteristics of agricultural net greenhouse gas and net carbon emissions, and carbon sink measure was more powerful in changing the path trend.
Further, it is found that the combination of carbon sink, non-agricultural carbon tax and CCUS will lead to the decline of real GDP and the output of various agricultural products. Among the five emission reduction measures in Selection of Emission Reduction Measures, the combination of carbon sink, CCUS and carbon tax based on the dual carbon target will lead to the smallest decline in real GDP and agricultural product output, but the combination of carbon sink and carbon tax based on the dual carbon target will lead to the largest decline in real GDP and agricultural product output.
In addition, it can be seen from Table 4 that in SEC9, SEC11, SEC12, SEC14 and SEC15, farmers’ subsidies accounted for less than 21% of the total carbon tax revenue, which fully indicates that there is still a large adjustment space for carbon tax combination emission reduction measures to feed farmers and promote equity between urban and rural areas. Further observation shows that the subsidy required by SEC9 MEAN accounts for the largest proportion of the total carbon tax revenue (20.19%), while the subsidy required by SEC14 UP accounts for the smallest proportion of the total carbon tax revenue (12.16%). This indicates that if a part of the tax revenue is used to subsidize farmers in order to hedge the welfare loss caused by emission reduction measures, the combined measures of carbon sink, CCUS and carbon tax based on the dual carbon target and mainly distributing the measure intensity in the early stage will have the smallest cost, but the combined measures of carbon sink and carbon tax based on the dual carbon target and evenly distributing the measure intensity in each period will have the largest cost. This further suggests that CCUS may be beneficial in reducing farmers’ subsidy costs. It may also indicate that the concentrated distribution of measures in the early stage is conducive to reducing the cost of farmers’ subsidies.
Previous studies predominantly focused on the impact of specific agricultural carbon reduction measures on net GHG emission trajectories in agriculture. However, The contribution of this paper is to uniquely explore the impact of non-agricultural emission reduction measures on these trajectories. On this basis, it explores the potential emission pathways of China’s agricultural net GHG under the dual carbon or net-zero emission climate strategies. Limitations of this study include the exclusion of carbon trading as an emission reduction measure and an insufficiently deep examination of agricultural emission reduction measures in relation to agricultural GHG emissions.
6 Conclusion and policy implications
This study employs a computable general equilibrium model to simulate and analyze emission reduction scenarios involving carbon sequestration, CCUS, carbon taxes, and their combined measures. The findings reveal:
(1) To achieve the dual carbon goals and potentially net-zero emissions, the implementation of carbon tax measures is indispensable and must be synergistically integrated with other emission reduction strategies. The combination of carbon taxes with other measures may lead to a reduction in farmers’ welfare. However, even after compensating for these losses through subsidy, there remains a significant potential for carbon tax revenues to be channeled back to farmers, fostering equitable development between urban and rural areas.
(2) Carbon sinks, non-agricultural carbon taxes, and CCUS measures will alter the trajectory characteristics of net GHG and carbon emissions in agriculture, with carbon sequestration measures having a notably more pronounced effect on the direction of these pathways. The distribution of emission reduction intensities of various measures over different periods will modify the net agricultural GHG emission trajectories. Therefore, in studying the processes of net GHG and carbon emission trajectories in agriculture and designing emission reduction strategies, the direct and indirect impacts of non-agricultural emission reduction measures must be given significant consideration.
(3) The characteristics of agricultural net GHG emission trajectories are contingent upon those of net carbon emission trajectories in agriculture, which, in turn, are rooted in the planting industry’s net carbon emission trajectory patterns. Under the dual carbon or net-zero emission climate strategies, China’s agricultural net GHG emission trajectories may exhibit a flattened M-shape, but an increase in the intensity of carbon sequestration measures could lead to a reversed V-shape.
Accordingly, the following policy implications can be obtained:
(1) China can try to impose a carbon tax, but it should pay attention to the compensation of farmers’ welfare losses. The combination of carbon sink, CCUS and carbon tax has the smallest compensation cost and is worth recommending. However, it is necessary to focus on mainly distributing the measure intensity in the early stage. A reasonable taxation system and accounting basis should be set up to levy carbon tax, and a sound monitoring, reporting and verification system should be established to ensure the accuracy and transparency of emission reduction data. In addition, the setting of carbon tax rates in the Chinese context needs to follow a dynamic and flexible adjustment pattern. The tax system design should follow the principle of progressive implementation and differentiated tax rate. A lower tax rate could be set initially and gradually increased over time to reduce sudden shocks to the economy. At the same time, different tax rates can be set according to the carbon emissions and emission reduction difficulties of different industries, and high-emission industries shuold be encouraged to give priority to emission reduction.
(2) Policymakers need to have an in-depth understanding of the advantages and disadvantages of individual and combined emission reduction measures, and conduct a rigorous evaluation and review of the effectiveness of various measures. In this paper, we think we should try our best to avoid the independent implementation of various emission reduction measures. We should pay attention to the combination of emission reduction measures and increase the synergistic effect of each emission reduction measure. According to the research results, under the current economic conditions, the combined measures of carbon sink, CCUS and carbon tax have the best comprehensive effect, and the required economic cost is the least. Therefore, it is feasible to consider the coordination and implementing this combined measure to mitigate emissions. A cross-sectoral coordination group could be considered to be responsible for the integration and optimization of carbon sink, CCUS and carbon tax measures to ensure maximum policy synergies, while conducting periodic assessments and adjusting strategies and specific measures in a timely manner based on the results of the assessments.
Data availability statement
The original contributions presented in the study are included in the article/supplementary material, further inquiries can be directed to the corresponding author.
Author contributions
ZG: Writing–original draft. XH: Writing–review and editing.
Funding
The author(s) declare that no financial support was received for the research, authorship, and/or publication of this article.
Conflict of interest
The authors declare that the research was conducted in the absence of any commercial or financial relationships that could be construed as a potential conflict of interest.
Publisher’s note
All claims expressed in this article are solely those of the authors and do not necessarily represent those of their affiliated organizations, or those of the publisher, the editors and the reviewers. Any product that may be evaluated in this article, or claim that may be made by its manufacturer, is not guaranteed or endorsed by the publisher.
References
Chen, L., Chen, Z., Jia, G., Zhou, J., Zhao, J., and Zhang, Z. (2020). Influences of forest cover on soil freeze-thaw dynamics and greenhouse gas emissions through the regulation of snow regimes: a comparison study of the farmland and forest plantation. Sci. TOTAL Environ. 726, 138403. doi:10.1016/j.scitotenv.2020.138403
Dou, L., Sun, L., Lyu, W., Wang, M., Gao, F., Gao, M., et al. (2023). Trend of global carbon dioxide capture, utilization and storage industry and challenges and countermeasures in China. Pet. Explor. Dev. 50, 1246–1260. doi:10.1016/S1876-3804(23)60463-X
Du, C., Hu, L., Yuan, S., Xu, L., Wang, W., Cui, K., et al. (2023). Ratoon rice-duck co-culture maintains rice grain yield and decreases greenhouse gas emissions in central China. Eur. J. Agron. 149, 126911. doi:10.1016/j.eja.2023.126911
Gong, H., Guo, Y., Wu, J., Wu, H., Nkebiwe, P. M., Pu, Z., et al. (2022). Synergies in sustainable phosphorus use and greenhouse gas emissions mitigation in China: perspectives from the entire supply chain from fertilizer production to agricultural use. Sci. TOTAL Environ. 838, 155997. doi:10.1016/j.scitotenv.2022.155997
He, Z., Zhang, Y., Liu, X., de Vries, W., Ros, G. H., Oenema, O., et al. (2023). Mitigation of nitrogen losses and greenhouse gas emissions in a more circular cropping-poultry production system. Resour. Conserv. Recycl. 189, 106739. doi:10.1016/j.resconrec.2022.106739
Hu, Y., Su, M., and Jiao, L. (2023). Peak and fall of China’s agricultural GHG emissions. J. Clean. Prod. 389, 136035. doi:10.1016/j.jclepro.2023.136035
Huang, W., Wang, Q., Li, H., Fan, H., Qian, Y., and Klemeš, J. J. (2022). Review of recent progress of emission trading policy in China. J. Clean. Prod. 349, 131480. doi:10.1016/j.jclepro.2022.131480
Jia, L., Wang, M., Yang, S., Zhang, F., Wang, Y., Li, P., et al. (2024). Analysis of agricultural carbon emissions and carbon sinks in the yellow river basin based on LMDI and tapio decoupling models. Sustainability 16, 468. doi:10.3390/su16010468
Jia, Z., and Lin, B. (2022). CEEEA2.0 model: a dynamic CGE model for energy-environment-economy analysis with available data and code. Energy Econ. 112, 106117. doi:10.1016/j.eneco.2022.106117
Jiang, H.-D., Dong, K., Qing, J., and Teng, Q. (2023). The role of technical change in low-carbon transformation and crises in the electricity market: a CGE analysis with R&D investment. Energy Econ. 125, 106897. doi:10.1016/j.eneco.2023.106897
Jiang, H.-D., Pradhan, B. K., Dong, K., Yu, Y.-Y., and Liang, Q.-M. (2024). An economy-wide impacts of multiple mitigation pathways toward carbon neutrality in China: a CGE-based analysis. Energy Econ. 129, 107220. doi:10.1016/j.eneco.2023.107220
Li, B., Zhang, J. B., and Li, H. P. (2011). Temporal and spatial characteristics of agricultural carbon emissions in China and their influencing factors. China Popul. Resour. Environ. 21, 80–86.
Li, Q., Chen, Z. A., Zhang, J.-T., Liu, L.-C., Li, X. C., and Jia, L. (2016). Positioning and revision of CCUS technology development in China. Int. J. Greenh. Gas. Control 46, 282–293. doi:10.1016/j.ijggc.2015.02.024
Liu, M., Zhang, Y., Lan, H., Huang, F., Liang, X., and Xia, C. (2023). Assessing the cost reduction potential of CCUS cluster projects of coal-fired plants in Guangdong Province in China. Front. Earth Sci. 17, 844–855. doi:10.1007/s11707-022-1030-1
Liu, X., and Zhang, F. (2011). Nitrogen fertilizer induced greenhouse gas emissions in China. Curr. Opin. Environ. Sustain. 3, 407–413. doi:10.1016/j.cosust.2011.08.006
Liu, Z., Wild, O., Doherty, R. M., O’Connor, F. M., and Turnock, S. T. (2023). Benefits of net-zero policies for future ozone pollution in China. Atmos. Chem. Phys. 23, 13755–13768. doi:10.5194/acp-23-13755-2023
Luo, Z., Lam, S. K., Fu, H., Hu, S., and Chen, D. (2019). Temporal and spatial evolution of nitrous oxide emissions in China: assessment, strategy and recommendation. J. Clean. Prod. 223, 360–367. doi:10.1016/j.jclepro.2019.03.134
Nordhaus, W. D. (1992). An optimal transition path for controlling greenhouse gases. Science 258, 1315–1319. doi:10.1126/science.258.5086.1315
Peters, G. P., Andrew, R., and Lennox, J. (2011). Constructing an environmentally-extended multi-regional input–output table using the gtap database. Econ. Syst. Res. 23, 131–152. doi:10.1080/09535314.2011.563234
Piao, S., Fang, J., Ciais, P., Peylin, P., Huang, Y., Sitch, S., et al. (2009). The carbon balance of terrestrial ecosystems in China. Nature 458, 1009–1013. doi:10.1038/nature07944
Piao, S., Yue, C., Ding, J., and Guo, Z. (2022). The role of carbon sinks in terrestrial ecosystems in the goal of carbon neutrality. Sci. China Earth Sci. 52, 1419–1426. doi:10.1360/SSTe-2022-0011
Pu, C., Chen, J.-S., Wang, H.-D., Virk, A. L., Zhao, X., and Zhang, H.-L. (2022). Greenhouse gas emissions from the wheat-maize cropping system under different tillage and crop residue management practices in the North China Plain. Sci. TOTAL Environ. 819, 153089. doi:10.1016/j.scitotenv.2022.153089
She, W., Wu, Y., Huang, H., Chen, Z., Cui, G., Zheng, H., et al. (2017). Integrative analysis of carbon structure and carbon sink function for major crop production in China’s typical agriculture regions. J. Clean. Prod. 162, 702–708. doi:10.1016/j.jclepro.2017.05.108
Shi, W., Fang, Y. R., Chang, Y., and Xie, G. H. (2023). Toward sustainable utilization of crop straw: greenhouse gas emissions and their reduction potential from 1950 to 2021 in China. Resour. Conserv. Recycl. 190, 106824. doi:10.1016/j.resconrec.2022.106824
Sun, L.-L., Cui, H.-J., and Ge, Q.-S. (2022). Will China achieve its 2060 carbon neutral commitment from the provincial perspective? Adv. Clim. Change Res. 13, 169–178. doi:10.1016/j.accre.2022.02.002
Tan, L., and Sun, K. (2019). Effect analysis of China's three types of carbon emission reduction policies based on DSGE model. Enterp. Econ. 38, 41–47. doi:10.13529/j.cnki.enterprise.economy.2019.10.005
Tian, Y., and Zhang, J. (2013). A study on agricultural carbon emission equity at provincial level in China. Chinese Population. Resour. Environ. 23, 36–44.
Wang, Z., Zhang, H., Lu, X., Wang, M., Chu, Q., Wen, X., et al. (2016). Lowering carbon footprint of winter wheat by improving management practices in North China Plain. J. Clean. Prod. 112, 149–157. doi:10.1016/j.jclepro.2015.06.084
Wei, Y., Long, F., and Yue, X. (2022). Changes in rural carbon emissions and emission reduction strategies in the context of rural revitalization. Agric. Econ., 62–73. doi:10.13246/j.cnki.iae.2022.09.008
Xia, X., Ren, P., Wang, X., Liu, D., Chen, X., Dan, L., et al. (2023). The carbon budget of China: 1980–2021. Sci. Bull. 69, 114–124. doi:10.1016/j.scib.2023.11.016
Xue, Y., Luan, W., Wang, H., and Yang, Y. (2019). Environmental and economic benefits of carbon emission reduction in animal husbandry via the circular economy: case study of pig farming in Liaoning, China. J. Clean. Prod. 238, 117968. doi:10.1016/j.jclepro.2019.117968
Yu, L., Liu, S., Wang, F., Liu, Y., Liu, H., Wang, Q., et al. (2022). Strategies for agricultural production management based on land, water and carbon footprints on the Qinghai-Tibet Plateau. J. Clean. Prod. 362, 132563. doi:10.1016/j.jclepro.2022.132563
Yu, Z., Zhang, F., Gao, C., Mangi, E., and Ali, C. (2024). The potential for bioenergy generated on marginal land to offset agricultural greenhouse gas emissions in China. Renew. Sustain. Energy Rev. 189, 113924. doi:10.1016/j.rser.2023.113924
Zhang, D., Zhao, Y., and Wu, J. (2023). Assessment of carbon balance attribution and carbon storage potential in China’s terrestrial ecosystem. Resour. Conserv. Recycl. 189, 106748. doi:10.1016/j.resconrec.2022.106748
Zhang, T., Hou, Y., and Zhang, Z. (2022). The impact of low-carbon transition policies on macroeconomic analysis based on DSGE model. Rev. Industrial Econ., 57–70. doi:10.19313/j.cnki.cn10-1223/f.2022.06.003
Zhang, X., Guo, Z., Zheng, Y., Zhu, J., and Yang, J. (2016). A CGE analysis of the impacts of a carbon tax on provincial economy in China. Emerg. Mark. Finance Trade 52, 1372–1384. doi:10.1080/1540496X.2016.1152801
Zhang, X., Wu, L., Ma, X., and Qin, Y. (2022). Dynamic computable general equilibrium simulation of agricultural greenhouse gas emissions in China. J. Clean. Prod. 345, 131122. doi:10.1016/j.jclepro.2022.131122
Zhao, M., Shi, R., and Yao, L. (2022). Analysis and path to achieve carbon neutrality in Chinese agriculture. Agric. Econ. Probl., 24–34. doi:10.13246/j.cnki.iae.20220913.002
Keywords: carbon reduction strategies, agricultural GHG emissions, computable general equilibrium (CGE) model, dual carbon goals, net-zero emission targets
Citation: Gong Z and Huo X (2024) Assessing the impact of carbon mitigation strategies on agricultural GHG emissions: insights from a dynamic CGE model analysis. Front. Environ. Sci. 12:1424076. doi: 10.3389/fenvs.2024.1424076
Received: 27 April 2024; Accepted: 02 December 2024;
Published: 16 December 2024.
Edited by:
Minhas Akbar, COMSATS University Islamabad, PakistanReviewed by:
Hong-Dian Jiang, China University of Geosciences, ChinaYantuan Yu, Guangdong University of Foreign Studies, China
Copyright © 2024 Gong and Huo. This is an open-access article distributed under the terms of the Creative Commons Attribution License (CC BY). The use, distribution or reproduction in other forums is permitted, provided the original author(s) and the copyright owner(s) are credited and that the original publication in this journal is cited, in accordance with accepted academic practice. No use, distribution or reproduction is permitted which does not comply with these terms.
*Correspondence: Xuexi Huo, eHVleGlodW9AbndhZnUuZWR1LmNu
 Zeyu Gong
 Xuexi Huo*