 Shao-Jun Chen
 Qi Dai
 Xiao-Yan Liu3
- 1School of Public Administration, Hohai University, Nanjing, China
- 2National Research Center for Resettlement, Hohai University, Nanjing, China
- 3College of Economics and Management, Nanjing Forestry University, Nanjing, China
Introduction: Urban contraction brings about certain impacts on the advancement of urbanization.
Methods: This paper explores the coupling coordination (CCD) and geographical distribution of land urbanization (LU) and population urbanization (PU) in Jiangsu Province through a CCD model and a spatial autocorrelation model from the perspective of shrinking cities. The Panel Vector Autoregression (PVAR) model is constructed to deeply investigate the complex interaction between the PU-LU in 13 cities, 2007-2020.
Results: The study found that the PU-LU CCD in each of the above-mentioned cities shows a synergistic incremental evolution during the study period in terms of time series. In addition, in terms of spatial characteristics, the CCD of PU and LU shows significant positive global spatial autocorrelation, and the CCD of cities with high population size growth is much larger than that of cities with continuous population size. Last, there is an interactive response relationship between PU and LU. PU influences LU, however, PU itself is influenced by its own system’s internal structure. The impact of PU on LU shows a positive cumulative effect of the “inverted U shape.”
Discussion: Furthermore, this paper proposes that policies be created to ensure the coordinated growth of PU-LU based on the differences in resource endowments of cities with 3 types of urban shrinkage. The link between floating population and construction land for cities should be established through enhancing the extent of intensive land use and reforming household registration.
1 Introduction
Since the beginning of the 21st century, urban shrinkage has become one of the most concerned issues around the world. This concept, developed by German researchers (Lampen and Owzar, 2008), indicates that urban regions are undergoing a decrease in population and a reduction in commercial activity. Urban shrinkage is an inevitable phase of urbanization, with 50% of the world’s population presently resides in urban areas. In line with the United Nations Sustainable Development Agenda, the worldwide urbanization rate is projected to climb by roughly 60% by 2030. On the one hand, population movement plays a significant role in urbanization. In particular, the decline in the attractiveness of cities will inevitably lead to a shrinkage in the size of the population. Therefore, to achieve high-quality urban advancement, it is necessary to pay attention to the pressure and crisis caused by the decrease of population size (Luo et al., 2018; Sun and Zhao, 2018). On the other hand, global population increase and urbanization will rise the demand for construction lands, accompanied by a shortage of infrastructure supply. Unlike the previously mentioned mechanisms of population urbanization, urban land use often varies due to factors such as government planning and regional resource endowments (Pallagst, 2010; Martinez-Fernandez et al., 2012). Therefore, achieving the balance of intercity population flow and land use framework is a common target of all countries and is necessary for city sustainability.
It is believed that all human activities are carried out according to land use practices; thus, population size and land construction for cities are closely related. LU is typically reflected by the expansion of build-up area, which aims to provide an adequate land reserve for urban development (Liu et al., 2018; Wang et al., 2019b; Yu et al., 2019). In addition, PU is the core of urbanization (Gu, 2019) and is the movement of people in rural areas, agglomeration, and integration into cities (Sato and Yamamoto, 2005). With a deepening comprehending of the notion of urban sustainable advancement, multiple studies have discussed content of coordination in the context of urban shrinkage from population and land perspectives. The issue of decoupling between PU and LU is particularly prominent in China. According to the Three Stages of Cities theory (Northam, 1975), China is presently experiencing a period of swift urbanization, which is centered on the movement and agglomeration of the population to cities. China’s LU can be characterized by the blind expansion of construction land, the extensive usage of urban land, and the low efficiency of ecological land. The phenomenon of local city shrinkage intensifies the burden of population management in the economically developed areas, and then the PU-LU processes are inconsistent.
Jiangsu aims to reach the urbanization rate more than 75% (Jiangsu “14th Five-Year” New Urbanization Plan, 2021), showing Jiangsu’s great ambition in urban advancement. PU-LU are complicate and open systems, which provide a key framework for determining the factors of coordinated urbanization from the economic and social level (Williamson, 1990). Nevertheless, there has been limited exploration of the relationships between PU-LU. Existing research predominantly concentrating on the measurement of macro urbanization level, and has not explored the heterogeneity of CCD of PU-LU via different contraction types. Based on this, the aims of this study are outlined as follows: 1) To categorize the various forms of contraction types in each city within Jiangsu, so as to summarize the common patterns of PU and LU coupling in different types of cities. 2) The spatial autocorrelation approach was used to analyze the temporal and spatial heterogeneity (SHM) of urban PU and LU CCD in Jiangsu Province. 3) The PVAR model is designed to assess the interactive response relevance between the PU-LU in various sorts of cities.
2 Literature review
In terms of the identification of shrinking city types, some researchers (Schiavina et al., 2022; Siciliano, 2012) noted that 180 Chinese cities saw negative population growth between 2000 and 2010. The number and size of contracting cities are still growing. The triggers for contracting cities in China can be attributed to the improvement of infrastructure development and the opening of household registration restrictions. Nevertheless, there is a scarcity of literature that offers a comprehensive examination of shrinking cities from the perspective of urbanization levels. Moreover, currently literature mainly concentrates on the dominant factors of urbanization, such as the area and rate of urban growth, and lacks relevant research of the multidimensional demographic of urban advancement (Mahtta et al., 2022; Luo et al., 2023). Consequently, for accomplishing the aims of sustainable land utilization and superior social advancement, we need a more comprehensive understanding of the CCD and the interaction response between PU and LU (Zhang and Song, 2003).
CCDM reveals the interactions between different systems compared to a single-dimensional analysis. Initially, some physicists found that coupling phenomena occur between two or more subsystems, and CCDM can reflect the level of synchronized progress among subsystems (Ren and Yu, 2021). In recent years, researchers (Venkatesan et al., 2011) have not only integrated CCDM to examine the association between urban areas and their natural surroundings but also expanded the research field to society and economy (Yin et al., 2014) to evaluate the interactions between various systems. The interaction between the PU-LU is widely acknowledged, and there is an apparent connection between the two. Hence, conducting a thorough investigation into the extent of CCD is crucial for promoting the advancement of urbanization theories and addressing the urban contraction puzzle (Dadashpoor et al., 2019). In the spatial characteristics of CCD, multiple studies analyzed the characteristics of spatio-temporal coupling of human-land relations from a macro-qualitative perspective (Fernández -Nogueira and Corbelle-Rico, 2019; Kuang et al., 2020). Many researchers find that areas with high social comprehensive advancement degree and mankind livelihood index have higher population attraction and land usage efficiency, thus, the CCD of PU-LU is also higher (Zhao et al., 2022). Moreover, some researchers (Cohen, 2008), through a systematic evaluation of the urbanization and economic development levels of typical city clusters in China, found that the CCD is higher in China’s metropolitan areas and surrounding coastal cities.
In the evaluation of the interaction between the PU-LU systems, some studies (Cao et al., 2014) adopted a comprehensive measurement of the degree of urbanization via the three elements of population, land use, and industrial structure in the urbanization process. In the process of new urbanization, PU-LU are not a simple one-way relationship, but an interactive process (Deng et al., 2020; Li et al., 2021b). In terms of PU, rapid urbanization will increase the attractiveness of the central city to the surrounding population, which will cause the imbalance of regional population flow. Some researchers (Lin et al., 2015) constructed a conceptual framework for the speed of the LU development process using data from 656 Chinese cities. The results indicated that LU has a more rapid rate of development compared to PU. Notably, the pressure of population flow inevitably leads to the expansion of urban space and the change of land use structure (Biggs et al., 2010; Chen et al., 2013). This indicates that LU is a direct reflection of CCD spatial projection, and also affects the process of PU to a certain extent (Fan et al., 2016; Peerzado et al., 2018). In this regard, the regional imbalance of PU-LU has become an obstacle that must be overcome to obtain high-quality urban advancement.
The research framework of this paper is shown in (Figure 1). First of all, according to the calculation results (Roak et al., 2016; Mallach et al., 2017), the 13 cities are classified into three categories: continuous shrinking contraction, high-speed growth type, and sustained growth type based on the characteristics of the city’s population size. In addition, CCDM is constructed to evaluate the CCD of the PU-LU in Jiangsu from 2007 to 2020.This research adopts spatial autocorrelation model to measure Moran’s I. The reciprocal relationship between PU-LU is analyzed through PVAR model. Ultimately, we also propose corresponding discussion, conclusions and implications to ensure the coordinated development of population and land in Jiangsu’s sustainable urbanization process.
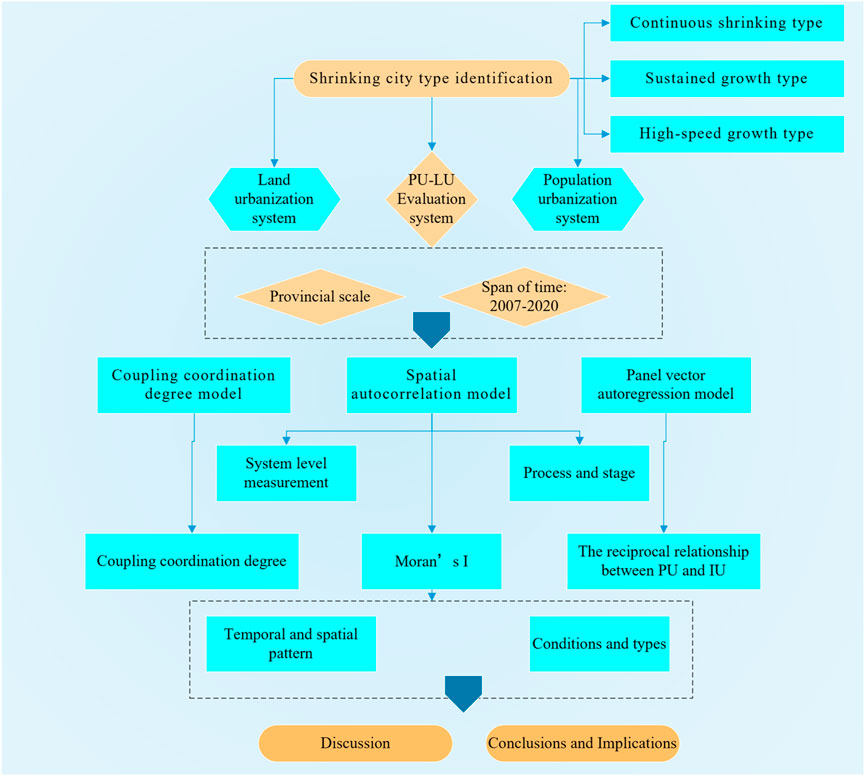
Figure 1. Research framework.
3 Data and research method
3.1 Indicator system construction and weight calculation
In this study, Jiangsu in China is selected as the research object (Figure 2), which has a total area of 107,200 km2, is located in the eastern coast of mainland China (World Economic Research Office, Institute of Economics, Chinese Academy of Sciences, 1962), and is a core part of the Yangtze River Delta urban agglomeration. Jiangsu Province currently has the most advanced extent of comprehensive development in China. The data in this paper principally come from the China Urban Statistical Yearbook, the Jiangsu Provincial Statistical Yearbook, and other related data. To ensure the feasibility of the study, the indicators included in this paper are screened and compiled based on the data from 2007 to 2020 Statistical Yearbook, and the data involved in the Yearbook are directly used as indicators, while the indicators not directly involved, such as per capita indicators, per capita ratio, per capita proportions, etc., are all computed based on the Statistical Yearbook, and some missing data are computed by the interpolation method.
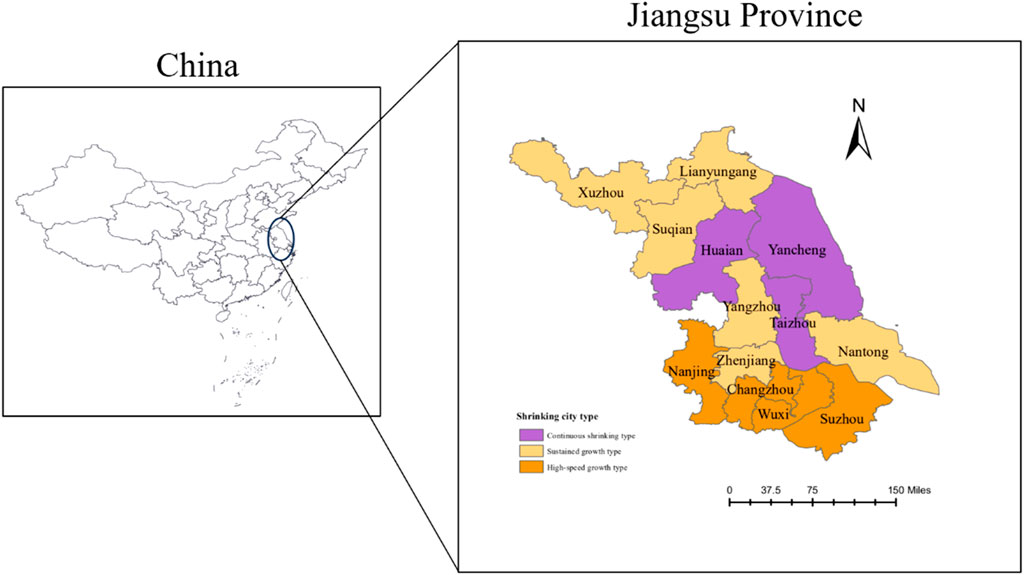
Figure 2. Overview of the study area.
Drawing on previous research (Wu and Niu, 2012; Sun et al., 2013; Li et al., 2014), following the principles of systematicity and feasibility, the indicator system is divided into three levels, namely, system level, evaluation level, and indicator level, and is constructed as follows (Table 1). The indicators such as per capita financial expenditure and per capita financial income are calculated by dividing the corresponding values of the indicators by the land region of Jiangsu. This study applies the technique of great value standard to unify the raw data. The weights of the variables are determined using the TOPSIS model.
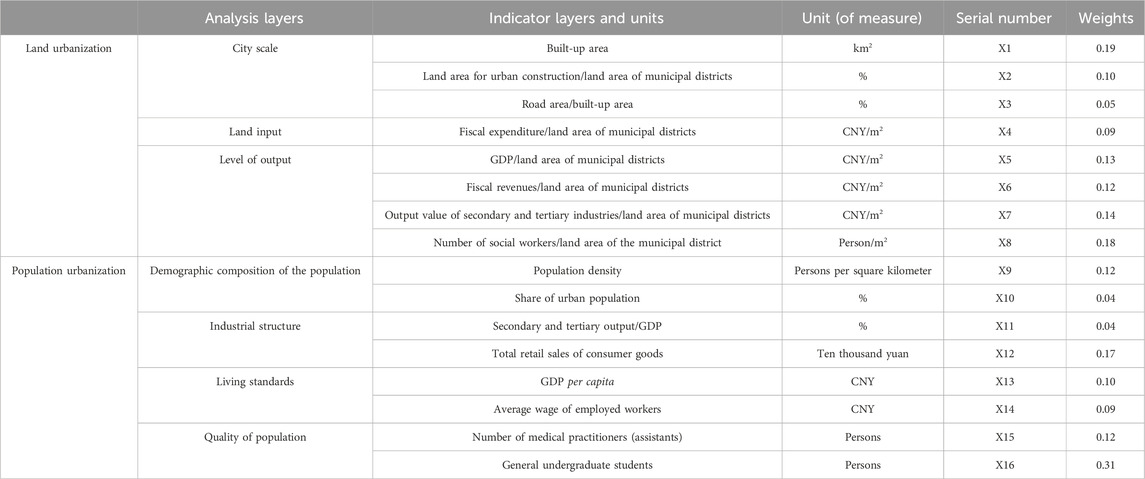
Table 1. Index system and weight.
3.2 Descriptive statistics
In PU and LU index system, we choose 6 representative variables, compute their maximum, minimum, mean, and standard deviation, and round off the outcomes to two decimal places without altering the original meaning. See (Figure 3) for details.
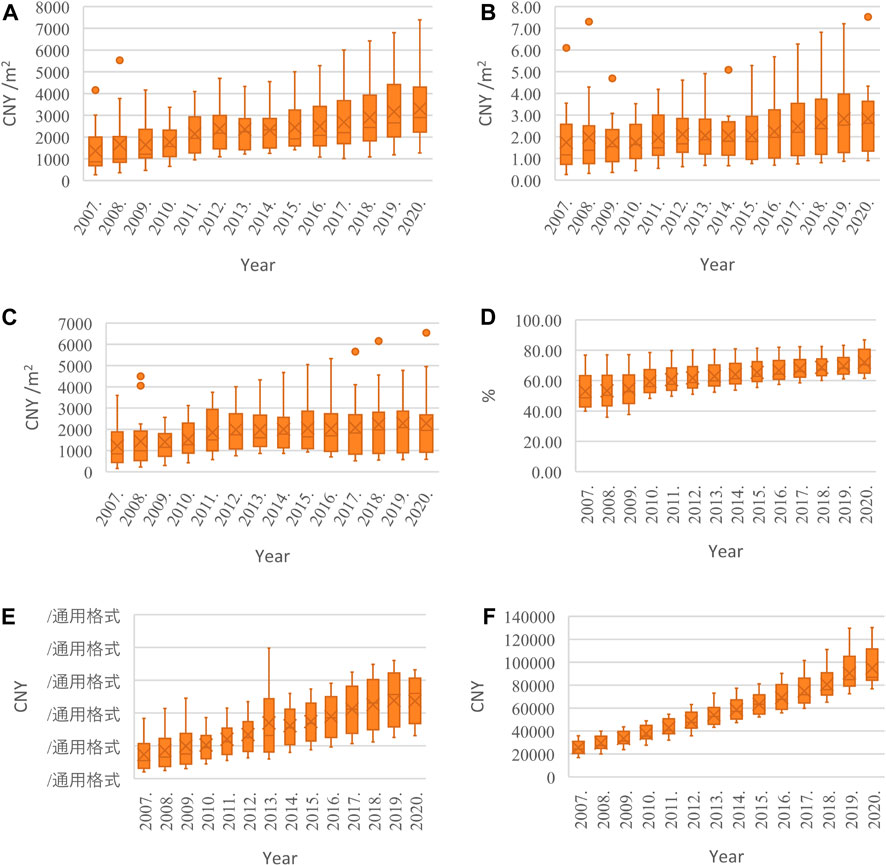
Figure 3. Statistical Analysis of Representative Variables (A) Fiscal expenditure/land area of municipal districts; (B) GDP/land area of municipal districts; (C) Fiscal revenues/land area of municipal districts; (D) Share of urban population; (E) GDP per capita; (F) Average wage of employed workers.
We see the statistics of fiscal expenditure/land area of municipal districts (Figure 3A), GDP/land area of municipal districts (Figure 3B), and fiscal revenues/land area of municipal districts (Figure 3C) all show a decreasing trend from 2007 to 2010, and then a significant increase after 2010. This was closely related to the policies implemented at that time to curb the growth of construction land area. Moreover, the maximum and mean degrees of share of urban population (Figure 3D) change steadily. This suggests that urban population density levels remain relatively constant over the research duration. Unlike the change in urban population, the average and SD of GDP per capita (Figure 3E) and average wage of employed workers (Figure 3F) show a tendency to increase significantly in the volatility. Meanwhile, the wage level in cities is more volatile. This indicates that the socio-economic level and employment situation of different years and regions in Jiangsu Province vary greatly.
3.3 Measure the level of coupling coordination
The coupling degree model is utilized to quantify the degree of information or parameter reliance between systems. Normally, the quantification of the extent of interaction among two systems is achieved using the equation that follows (Xing et al., 2019):
Here S1 represents the composite index of LU, S2 represents the composite index of PU, C is the extent of interaction between the PU-LU system; the larger C is, the more coordinated the development of the PU-LU system is.
Coupled Coordination Degree Model: The model is used in the research of the coupled coordination relationship between two or more systems. The model can not only reflect the interrelationship between two systems but also provide a quantitative measurement of the measure of coordinated progression among systems (Wang et al., 2019b).
Here: D is the CCD of the population-land systems in Jiangsu, the value range is 0 ≤ D ≤ 1; T is the thorough measurement index of coordinated development; 0 ≤ T ≤ 1; w1 and w2 are the weights of the coupled coordination relationship between the PU-LU. Since this paper considers that land urbanization and population urbanization have the same extent of importance in the urbanization process, w1 = w2 = 0.5 in the coupling coordination model (Eqs 1–3). Drawing on existing research results and combining them with the current status quo of urbanization development level in Jiangsu Province, the D and the comprehensive measurement indexes S1 and S2 are classified as follows (Table 2).
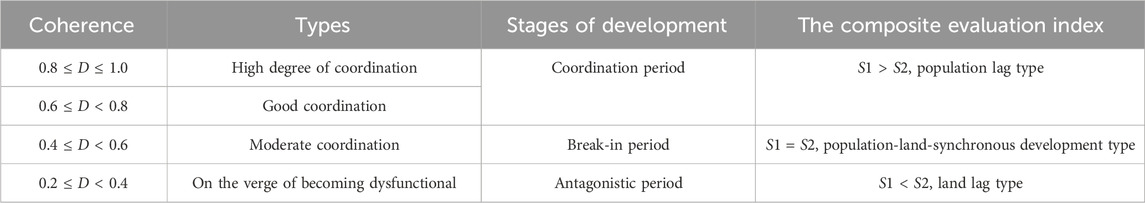
Table 2. Criteria for classifying the CCD.
3.4 Investigative spatial analysis of data
At present, global spatial autocorrelation and local spatial autocorrelation are the primary techniques utilized for investigative spatial analysis (Anselin, 1996). Global spatial autocorrelation is primarily employed for evaluating if a phenomenon displays spatial clustering features and frequently quantified by Moran’s I (Eq. 4). Local spatial autocorrelation is an approach applied to detect and evaluate particular trends of spatial relationships in an area by local Moran’s I, which is determined using a certain calculation (Eqs 5, 6):
Here:
3.5 Panel vector autoregressive model
Holtz-Eakin proposed the PVAR model, which separates the shock effects and variance contributions between other variables and endogenous variables through orthogonal impulse response functions, which is helpful in revealing the interactive response relationships of variables in panel data (Holtz-Eakin et al., 1988; Love and Zicchino, 2006).
Here
4 Empirical analyses
4.1 Analysis of PU and LU coupling coordination degree results in Jiangsu
4.1.1 Timing characterization
From the time dimension (Figure 4), the CCD of most regions in Jiangsu from 2017 to 2020 exhibits the characteristic of incremental increase over the study period, with most of them reaching the level of good coupling and above in 2020, and showing a very obvious aggregation. The average change level of the overall CCD in Jiangsu Province is within the range of 0.4–0.6. Based on the changing trend depicted in the heat map, it is clear that the CCD level of certain cities within the study period surpasses the overall average value of Jiangsu Province, such as Nanjing, Wuxi, Suzhou and Changzhou among the non-contracting cities. While the CCD of Huaian and Yancheng among the contracting cities is significantly less than the average value of Jiangsu, which can be seen that the construction of Suzhou-Wuxi-Changzhou urban agglomeration and Nanjing metropolitan area has a certain promoting effect for the coordinated growth of individuals and territory in Jiangsu Province. This shows that the construction of Suzhou-Wuxi-Changzhou City Cluster and Nanjing Metropolitan Area has promoted the coordinated growth of individuals and territory in Jiangsu. The concentration of advantageous resources in economically developed cities accelerates the movement of population, while the concentration of labor and other resources promotes the reallocation of land and other resources. The reason is that cities with a high extent of economic development can provide more job opportunities, which in turn promotes the flow of population. At the same time, the urbanization extent of these regions is more mature, and the land use efficiency is also higher. Therefore, the level of urban advantageous resources determines the attractiveness of cities, which affects urban growth.
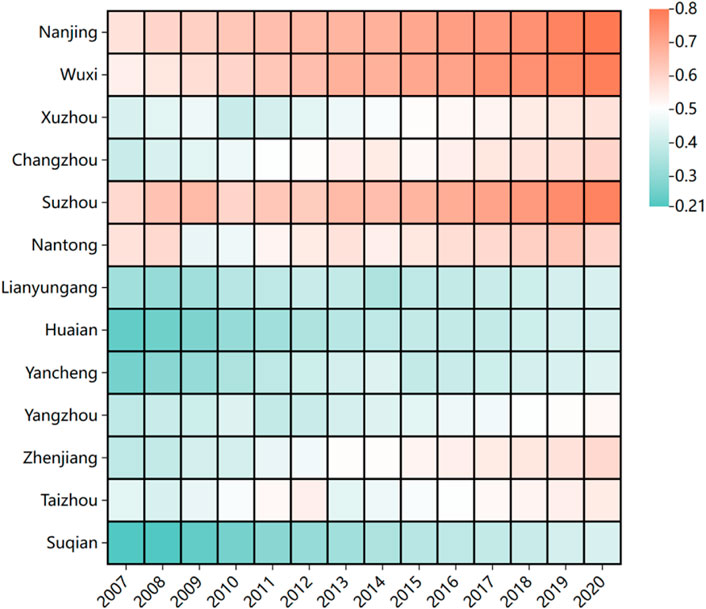
Figure 4. Heat map for clustering of changes in coupling coordination degree.
4.1.2 Characterization of geographical distribution
To more intuitively represent the spatial change characteristics of PU-LU coordination in Jiangsu, this paper selects 2007, 2013, and 2020 as representative years and presents the geographical distribution maps of the CCD of each city through the ArcGIS software (Figure 5).
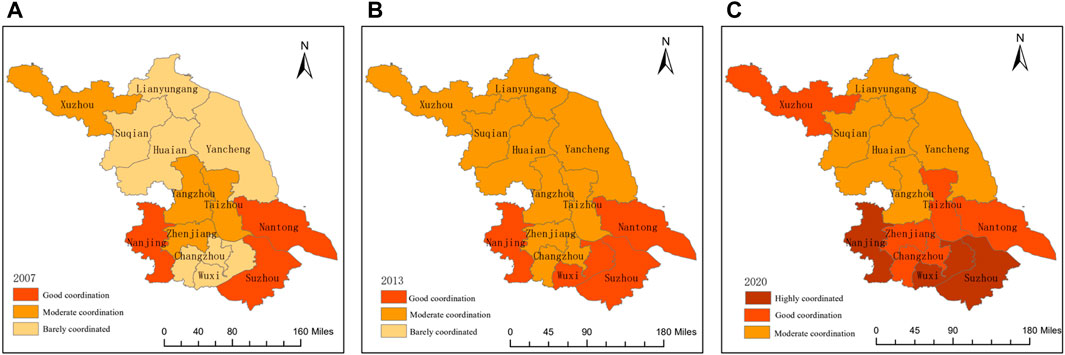
Figure 5. Geographical distribution of coupling coordination degree among cities in Jiangsu (A) Spatial distribution characteristics of coupling coordination degree in 2007; (B) Geographical distribution characteristics of coupling coordination degree in 2013; (C) Geographical distribution of coupling coordination degree in 2020.
First of all, the CCD of cities in southern Jiangsu is generally high. Therefore, the spatial distribution of CCD of PU and LU in Jiangsu shows a pattern of highest in the south, high in the center, and low in the north, with obvious spatial differentiation. Among them, the overall CCD of areas with high population growth is at a high level, with Nanjing and Wuxi showing better development trends in recent years, and the LU is at a highly coordinated level compared with the PU. New urbanization development strategies such as optimizing the spatial layout of urbanization and building metropolitan areas in southern Jiangsu have objectively promoted the concentration of population, intensive use of land resources, and industrial agglomeration and upgrading, resulting in a noticeable rise in the degree of PU-LU in southern Jiangsu.
In addition, the CCD in the region of sustained population size growth was mostly of the moderate coordination type in 2007, with a small portion of it on the verge of dislocation, and only after 2013 did it begin to enter the stage of good coordination, with a more synchronous level of development of PU and LU. The reason for this is that the region’s strong endowment of natural resources, deep industrial base, and natural harbor advantages have made its self-sufficient production mode able to meet the needs of economic development to a certain extent. However, due to its extremely limited radiation-driven effect on the neighboring areas, the development potential of the area with continuous population growth lags significantly behind that of other investment hotspots.
Lastly, the CCD of the region with continuous population size contraction type is gradually raised from the verge of dislocation in 2007 to the stage of moderate coordination in 2020, and the LU of Yancheng, Huaian, and Taizhou in this time period is relatively lagging behind in comparison with the PU, which is caused by the reason for this phenomenon and the flow for the pattern of economic advancement in Jiangsu. The optimization of the policy of returning talents and the gathering of industrial parks have accelerated the population flow of migrant workers, and the return of population has greatly facilitated the advancement of urban regions and accelerated the rate of LU.
4.1.3 Characterization of geographical agglomeration
From the perspective of the whole, the global spatial clustering characteristics of CCD between PU and LU for the three representative years of 2007, 2013, and 2020 were analyzed by using the global Moran’s I through the Geoda software. From (Table 3), it is evident that the PU-LU coordination in Jiangsu Province shows significant positive global spatial autocorrelation, and there is a significant positive correlation between the CCD of PU-LU in each prefecture-level city, which indicates that there is a strong clustering characteristic in the region. The Moran’s I exhibit a growing trend, rising from 0.376 in 2007 to 0.424 in 2013, and further to 0.407 in 2020. This shows the presence of positive spatial autocorrelation characteristics in the CCD during the last decade or so. The smooth evolution of Moran’s I implies that the PU-LU between cities in Jiangsu Province are becoming more and more closely linked.

Table 3. Global Moran’s I results of coupling coordination degree in prefecture-level cities in Jiangsu.
From a local perspective, the local spatial correlation of CCD between PU and LU in Jiangsu Province is depicted by Moran’s I index scatter plot and cluster plot, and it is found that the spatial agglomeration of CCD in Jiangsu Province is increasing in the study interval. As shown in (Figure 6), the CCD of PU-LU in Jiangsu from 2007 to 2020 shows obvious regional heterogeneity effects, in which the “high-high” agglomeration type is mainly focused in the non-contracting urban regions, reflecting the fact that the southern region of Jiangsu, centered on the Nanjing, Suzhou, Wuxi, and Changzhou metropolitan areas, is the most important area in the world. The “high-high” agglomeration type is mainly concentrated in non-contracting urban areas, reflecting the development advantages of the Nanjing Metropolitan Area in Southern Jiangsu. The “low-low” homogeneous type is concentrated in shrinking urban areas, indicating that these areas need to urgently enhance the efficiency of municipal land use.
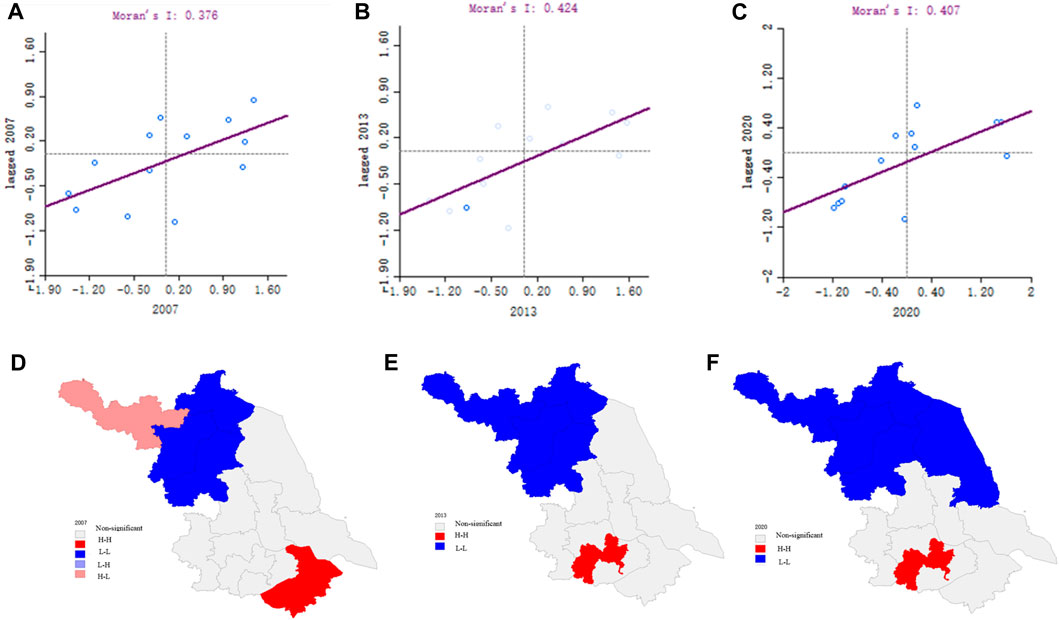
Figure 6. Scatterplot and cluster diagram of Local Moran’s I for each city in Jiangsu (A) Local Moran’s I scatterplot in 2007; (B) Scatterplot of local Moran’s I in 2013; (C) Local Moran’s I scatterplot in 2020; (D) LISA cluster figure in 2007; (E) LISA cluster diagram in 2013; (F) LISA cluster figure in 2020.
To be specific, taking the 2020 Moran scatterplot as an example, in the first quadrant (HH) region, it is mainly concentrated in the regions with high population size growth, which indicates that the coordination of PU and LU in these regions has an obvious correlation in spatial distribution. In the second quadrant (LH) region, it mainly includes Taizhou, which indicates that the level of agglomeration between the CCD of PU and LU in shrinking cities in Jiangsu Province is not high and slightly below the standard level of nearby cities. In the third quadrant (LL) region, it mainly includes local contraction areas and some areas with continuous population size growth types, specifically the six areas of Xuzhou, Lianyungang, Huaian, Yancheng, Yangzhou, and Suqian. This means that there is a lack of a high extent of coordination between the coupled coordination extent of PU-LU in these cities, resulting in restricted regional development. In the fourth quadrant (HL), there is only Nanjing, which is mainly due to the fact that Nanjing has a high extent of coupled urbanization and has the “siphoning effect” on its neighboring cities, but some of its neighboring districts do not have a high level of CCD, i.e., the districts with a high rate of population growth are surrounded by the districts with a continuous contraction.
4.2 Analysis of the dynamic interaction effects of PU and LU in Jiangsu
As seen above, there are noteworthy spatio-temporal synergistic evolution characteristics of PU and LU in each prefecture-level city in Jiangsu Province, so the spatio-temporal dynamic interaction between the two systems during the period of 2007–2020 is deeply analyzed by using the econometric PVAR model, and the results of the dynamic interaction analyses are as follows:
4.2.1 Smoothness test and Granger causality test
The PU and LU indices were first logarithmized to obtain the land urbanization index (LNL) and the population urbanization index (LNP), and the data of the variables were tested for smoothness before the parameter estimation of the PVAR equation. First, the raw data were processed by first-order differencing to obtain the variables DLNL and DLNP, after which the tests were conducted using the three methods of LLC, IPS, and HT, respectively. The results of their smoothness tests are displayed in (Table 4):

Table 4. Stationarity test of variables.
Via the three criteria of AIC and BIC, the optimal lag order of both variables DLNL and DLNP is determined to be first order; after that, the PVAR model is built with first lag order and GMM estimation is carried out, and the results are as follows (Table 5).
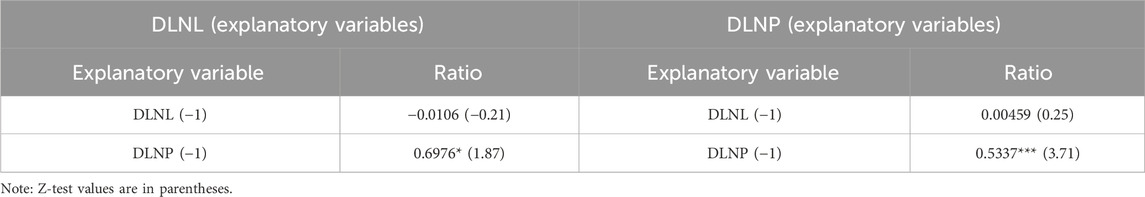
Table 5. PVAR model estimation results based on GMM.
Firstly, there is a certain interaction-response relationship between PU and LU in Jiangsu Province. Among them, the effect of PU lagged by 1 period on the current period is significantly positive, and the elasticity coefficient is 0.5337, which indicates that there is a time-accumulation effect of PU in Jiangsu Province. Secondly, the causality test results show that DLNL and DLNP are Granger causes for each other at a 10% significant level, which indicates that the land management performance in the urbanization process in Jiangsu is motivated by the demand for construction space.
4.2.2 Impulse response function analysis of the PVAR model
The PVAR model can determine the dynamic response process of each effect on DLNL and DLNP through the shock response function. As shown in (Figure 7), the shock response of PU to itself shows a significant positive effect and peaks in period 1, gradually weakening over time and converging to zero in period 10. For the population urbanization index with a standard deviation of 1, the LU of Jiangsu Province shows a significant positive impulse response in period 1, peaks in period 2, and then converges to zero in periods 2 to 10 tends to 0. Overall, the impact of PU on LU shows an “inverted U-shaped” positive cumulative effect. The effect of LU on PU lagged behind the first period, which was positive but failed the significance test. In general, PU is affected by the internal structure of its own system, and LU is mainly affected by PU, which may be due to the fact that the enhancement of urban land management performance will lead to some sort of increase in the cost of living for the migratory population. This will slow down the effect of population agglomeration, while the positive promotion effect of LU on PU fails to pass the test of significance, which suggests that the advancement of PU in the short term affects the demand for land management and stimulates short-term demand and prioritizes the exploration of land potential in the later period. Moreover, the demand for land will be somewhat lower in the later period when more attention is paid to exploiting land potential. Hence, during the process of urbanization, it is crucial to avoid indiscriminate expansion of construction land.
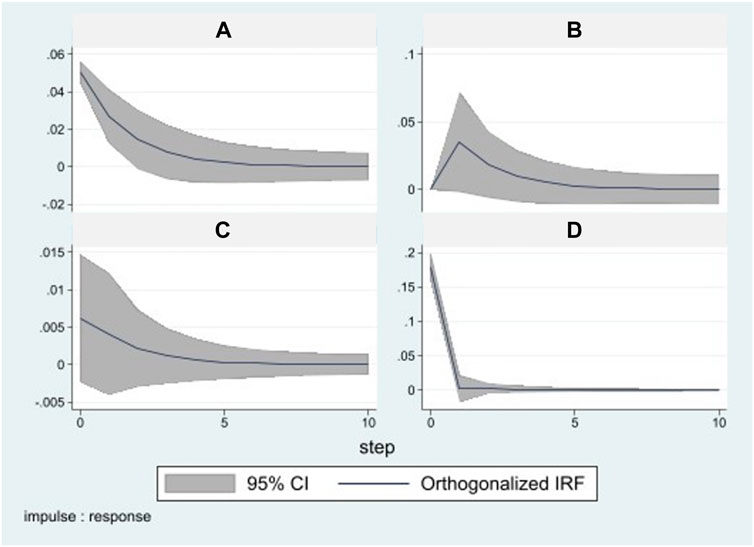
Figure 7. The impulse response of population urbanization and land urbanization (A) The impulse response of DLNP to DLNP; (B) Response of DLNP to DLNL; (C) The impulse response of DLNL to DLNP; (D) Response of DLNL to DLNL.
4.2.3 PU and LU prediction variance decomposition results
Using the variance decomposition model to reveal the cumulative contribution of the impact of each variable shock, the results show (Table 6) that both LU and PU are affected by their own structural shocks and display a decreasing trend, from the first to the 10th period, the contribution of PU-LU themselves is reduced from 100% to 98.5%–94.9% and 98.3%, respectively; and the contribution of LU to PU is showing an increase in trend, which indicates that the LU’s driving force begins with government-led behaviour, which stems from the governments’ reliance on economic development through the increase of build-up area, which in turn accelerates population agglomeration. Therefore, local governments can promote the increase in PU rates through the intensive and economical use of urban land.
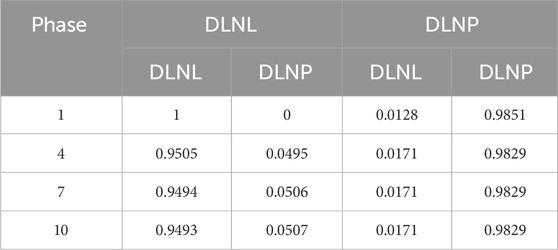
Table 6. Variance decomposition results based on PVAR model estimation.
5 Discussion
Urban growth and urban contraction are two sides of the same coin, and the phenomenon of localized urban contraction, characterized by population loss at its core, is prevalent in economically developed provinces. Taking Jiangsu as the study area, CCDM model, spatial autocorrelation analysis and PVAR model are combined to conduct geographical and temporal multi-dimensional analysis. The PU-LU coordination in each city of Jiangsu during the study interval grows in fluctuation and is overall at a high level of CCD. However, the heterogeneity of different types of shrinking cities and the underlying causes are still worth pondering.
5.1 Discrepancies and role in CCD trends
Our research illustrates the significant role of the CCD concept in the process of new urbanization. According to the empirical research in this paper, the overall urbanization degree of Jiangsu is high. In addition, the comprehensive performance of CCD of PU-LU in the southern cities of Jiangsu performed better than the other regions. Importantly, the steady rise in CCD trends illustrates that the urbanization process may shift towards a more balanced direction with socio-economic advancement (Zhao et al., 2022). Admittedly, large towns and municipalities—Nanjing and Suzhou in this paper, for example—account for their high managerial abilities phases, which ensure the effective conversion of results in output in addition to rich resource bases, advanced technological system. Such advantages also greatly motivate the CCD of PU-LU. In these cities, the initial geographical and resource advantages paved the way for the later CCD of PU-LU.
On the contrary, due to the unreasonable industrial structure, imperfect infrastructure construction and inadequate public service supply, the CCD of PU-LU in economically underdeveloped areas often lags behind that in economically developed areas (Wu, 2022; Yang et al., 2021; Yin et al., 2014). This difference is particularly evident in the changing trend of population mobility, which may be due to the greater attractiveness of talent in economically developed regions. These phenomena and challenges can be confirmed in previous studies (Min and Hu, 2013), which have shown that areas with higher levels of urbanization tend to be concentrated in areas with higher levels of social development, such as the eastern coast and provincial capitals.
In addition, the rapid urbanization stage since 2013 has revealed the rationality of policies to promote balanced urban advancement and efficient land use in Jiangsu. These findings illustrate that regional cooperation and government intervention can effectively improve the CCD of PU-LU, which is consistent with the conclusions of previous studies (Zhang et al., 2022). These results support the point of sustainable urbanization, where land use structure optimization and balanced movement of population are not necessarily conflicting objectives (Zhou et al., 2023).
5.2 Geographical disparities in CCD
The difference of CCD reflects the significant heterogeneity of urbanization advancement. This research classifies study area into three categories: continuous shrinking contraction, high-speed growth type, and sustained growth type based on the characteristics of the city’s population size. The high-speed growth type urban located in the south of Jiangsu, because of its huge labor force and high land use efficiency, its CCD score is among the best in the whole province (Henderson et al., 2017; Huang et al., 2019; Prettner, 2014). The continuous shrinking contraction and sustained growth type cities in central and northern Jiangsu have lower CCD degrees. This is mainly due to the fact that these cities have experienced large-scale population outflow, irrational land use structure and inadequate infrastructure construction, which highlights the important impact of regional advancement and urban planning differences on urbanization advancement (Saidi and Mbarek, 2017). This aligns with previous literature showing that urbanization processes often fluctuate due to changes in population size (Yu et al., 2022). These results highlight the need for governments to adopt more targeted strategies when planning for different shrinkage types of cities, taking into account the unique spatial and socio-economic characteristics of different regions.
5.3 Evolution and spatial aggregation in CCD
The spatial aggregation of three different urban contraction types and individual cities of CCD is also noteworthy. The root causes of these differences lie in the imbalance of regional development, the impact of land use policies and the concentration of labor resources. Currently, the majority of China’s urbanization-related CCD assessment occurs in prosperous or metropolitan locations. For example, Nanjing has a high extent of coupled urbanization and has the “siphoning effect” on its neighboring cities. The CCD of regions with a high-speed population growth are surrounded by the cities with a continuous contraction population size. Conversely, the “low-low” unity type tends to occur in the declining urban regions in the northern region, suggesting that it is necessary to boost the municipal land use efficiency and optimizing the urban land use pattern in these areas (Ahmad and Zhao, 2018).
This pattern of “strong central city, weak peripheral city” highlights the significant difference of CCD of PU-LU spatial agglomeration effect, which is particularly obvious in Nanjing. This central effect reveals the potential spatial impact of the uneven advancement of PU-LU - and, if left unaddressed, the growing disparity in regional urbanization levels. This is consistent with the conclusions of previous studies (Peng et al., 2017) and reminds people to pay attention to the spatial heterogeneity of urbanization development. This suggests that policymakers should take timely intervention measures to improve the attractiveness and influence of core cities on the surrounding areas, so as to play the role of core regions as regional pillars, and thus narrow the regional advancement gap. Therefore, governments need to formulate a more inclusive and balanced urban development strategy according to local conditions and refrain a “one-size-fits-all” method (Luo et al., 2023). In addition, policymakers have the capacity to reduce regional inequalities and imbalances via preferential policies, to strengthen the CCD of PU-LU throughout the area.
5.4 Coordination challenges between the PU-LU
The calculation results of PAVR model indicate that there is a significant dynamic interaction response between the PU-LU. Although the contribution of LU to PU shows an increasing trend, the positive promotion effect of LU on PU fails the significance test, probably due to the increase of city land use performance will increase the cost of living of the migrant population to a certain extent. This trend indicates that the CCD of PU-LU needs some adjustment time, which reflects the dynamic nature of the PU-LU coupling coordination process (Zang et al., 2023). Moreover, this interaction is further complicated by regional differences in CCD. The CCD level of PU-LU in high-speed growth type regions is higher, which reflects the coordinated urbanization advancement model of land use and population size in these cities. Previous studies have also shown that the simultaneous advancement of PU-LU promotes sustainable urbanization (Anser et al., 2020). In contrast, due to the restriction of economic and industrial structure, the regional CCD is lower in the cities with contraction phenomenon, indicating that urban land policy and economic structure usually significantly affect the CCD of PU-LU.
5.5 Policy implications
Based on the results of this study, policymakers should promote the balanced development of regional urbanization as much as possible, and play a role in population management and sustainable use of land resources.
1. First of all, according to the differences in resource endowments of cities with 3 types of urban shrinkage, the relevance between population agglomeration and increased land demand should be coordinated according to local conditions (Prastiyo et al., 2020).
2. From the terms of land-use planning, governments should strengthen the scientific and rationality of land planning, take advantage of the multiple national key “metropolitan areas” in Jiangsu, and adopt the planning mode of “multi-cluster” in space (Zang et al., 2023). This is important for the rational usage of space in other Chinese regions. Local governments should also avoid blind explosion of construction land and improve the performance of intensive land use to improve the extent of urbanization.
3. From the management of the floating population, local governments ought to emphasize the facilitation and focus on demographic factors while managing mobile populations. Referring to the classical push-pull theory of population mobility (Rapp, 1996; Zheng et al., 2014), to increase the appeal of urban jobs, it is essential that governments promote the urban employment environment and boost its attractiveness. Moreover, the metrics regarding land use are continually updated to heighten local governments’ anticipation for absorbing population, so promoting coordinated growth in PU and LU. Overall, the future trend of coordinated human-land development in Jiangsu is to reduce regional development imbalances and promote high-quality coordinated regional development.
5.6 Limitations
In this study, we analyzed the CCD of PU-LU using the panel data of Jiangsu from 2007 to 2020. Due to the time lag in obtaining statistical data, it is unable to use the latest year for the time being. In addition, the phenomenon of local urban shrinkage in economically developed regions is obvious, and the government should publish more data on population size in the future. Therefore, the assessment of urbanization levels for cities with different shrinkage types can be discussed in more detail than in this study. At the same time, future studies can try to construct a broader PU-LU indicator system, such as add indicators that reflect the quality of life of residents and the ecology of the land to explore other factors that determine the process of urbanization.
6 Conclusion
This paper combines econometric and spatial analysis tools to investigate the spatial disparities of the CCD of PU-LU in Jiangsu from 2007 to 2020 by using the CCDM model, the PVAR and the geographical autocorrelation model from the perspective of shrinking cities. From the perspective of temporal and spatial variation, the PU-LU coordination in each prefecture-level city of Jiangsu during the study interval grows in fluctuation and is overall at a high level of CCD. However, the phenomenon of local urban contraction has appeared in Jiangsu, and there has been a trend of gradual alleviation in recent years.
Moreover, the PU-LU coordination in Jiangsu shows obvious SHM characteristics. The CCD of the 13 cities also shows the pattern of the highest in the southeast, high in the center, and the significant improvement characteristics of “urban agglomeration.” This illustrates that a reasonable urbanization model will promote the high-quality coupling between PU-LU systems. In addition, the spatial agglomeration characteristics of Jiangsu show significant global spatial positive autocorrelation, in which the “high-high” agglomeration type is primarily found in non-contracting urban areas, which underlines the socioeconomic advantages of the southern region of Jiangsu, which comprises including the Nanjing Municipal Zone. In other words, the level of CCD is higher in metropolitan areas and provincial cities. In addition, there is an interactive response relevancy between the PU-LU systems in Jiangsu, in which the LU is influenced by the PU, while the PU is influenced by the internal structure of its own system, and the PU’s impact on the LU shows an “inverted U-shape” positive cumulative effect. This indicates that the population flow trend caused by urban shrinkage phenomenon will restrict land use transformation and optimization.
In summary, it is a complex system engineering to realize the high-level coupling of PU-LU, which requires a deep understanding of the dynamic interaction between the two systems. Based on this, policymakers should formulate policies that are more balanced and regionally specific, taking into account factors such as industrial advancement and ecological space. Therefore, subsequent research should aim to investigate the interacting relevance between nature and socio-economic systems so as to objectively assess the relationship between land-ecological environment, and economic society (Wichowska, 2021). In addition, future research could be expanded to analyze provinces in other developing countries to investigate whether variations in different locations result in divergent results and offer direction for the purposes of planning, administration, and decision-making.
Data availability statement
The datasets presented in this study can be found in online repositories. The names of the repository/repositories and accession number(s) can be found in the article/Supplementary Material.
Author contributions
S-JC: Supervision, Writing–review and editing. QD: Conceptualization, Data curation, Investigation, Writing–original draft, Writing–review and editing. Xiaoyan X-YL: Methodology, Writing–review and editing.
Funding
The author(s) declare that financial support was received for the research, authorship, and/or publication of this article. This work is funded by the Major Program of National Fund of Philosophy and Social Science of China (Fund No. 21 & ZD 183), Community Governance and Post-relocation Support in Cross-district Resettlement, the Fundamental Research Funds for the Central Universities (Fund No. B240207112) and the Fundamental Research Funds for the Central Universities (Fund No. B240207032).
Conflict of interest
The authors declare that the research was conducted in the absence of any commercial or financial relationships that could be construed as a potential conflict of interest.
Publisher’s note
All claims expressed in this article are solely those of the authors and do not necessarily represent those of their affiliated organizations, or those of the publisher, the editors and the reviewers. Any product that may be evaluated in this article, or claim that may be made by its manufacturer, is not guaranteed or endorsed by the publisher.
Supplementary material
The Supplementary Material for this article can be found online at: https://www.frontiersin.org/articles/10.3389/fenvs.2024.1423221/full#supplementary-material
Abbreviations
PU (Population Urbanization), LU (Land Urbanization), CCD (Coupling Coordination Degree), CCDM (Coupling Coordination Degree Model), PVAR (Panel Vector Autoregression), GDP (Gross Domestic Product), SHM (Spatial Heterogeneity), CNY (Chinese Yuan).
References
Ahmad, M., and Zhao, Z. Y. (2018). Empirics on linkages among industrialization, urbanization, energy consumption, CO2 emissions and economic growth: a heterogeneous panel study of China. Environ. Sci. Pollut. Res. 25, 30617–30632. doi:10.1007/s11356-018-3054-3
Anselin, L. (1996). Interactive techniques and exploratory spatial data analysis. Regional Research Institute Working Papers, 200. Available at: researchrepository.wvu.edu/rri_pubs/200.
Anser, M. K., Alharthi, M., Aziz, B., and Wasim, S. (2020). Impact of urbanization, economic growth, and population size on residential carbon emissions in the SAARC countries. Clean. Techn Environ. Policy 22, 923–936. doi:10.1007/s10098-020-01833-y
Biggs, T. W., Atkinson, E., Powell, R., and Ojeda-Revah, L. (2010). Land cover following rapid urbanization on the US–Mexico border: implications for conceptual models of urban watershed processes. Landsc. Urban Plan. 96 (2), 78–87. doi:10.1016/j.landurbplan.2010.02.005
Cao, S., Lv, Y., Zheng, H., and Wang, X. (2014). Challenges facing China’s unbalanced urbanization strategy. Land Use Policy 39, 412–415. doi:10.1016/j.landusepol.2013.12.004
Chen, M., Liu, W., and Tao, X. (2013). Evolution and assessment on China’s urbanization 1960-2010: under-urbanization or over-urbanization? Habitat Int. 38, 25–33. doi:10.1016/j.habitatint.2012.09.007
Cohen, B. (2008). Urbanization in developing countries: current trends, future projections, and key challenges for sustainability. Technol. Soc. 28, 63–80. doi:10.1016/j.techsoc.2005.10.005
Dadashpoor, H., Azizi, P., and Moghadasi, M. (2019). Land use change, urbanization, and change in landscape pattern in a metropolitan area. Sci. Total Environ. 655, 707–719. doi:10.1016/j.scitotenv.2018.11.267
Deng, F., Fang, Y., Xu, L., and Li, Z. (2020). Tourism, transportation and low-carbon city system coupling coordination degree: a case study in Chongqing Municipality, China. Int. J. Environ. Res. Public Health 17 (3), 792. doi:10.3390/ijerph17030792
Fan, P., Chen, J., and John, R. (2016). Urbanization and environmental change during the economic transition on the Mongolian Plateau: hohhot and Ulaanbaatar. Environ. Res. 144, 96–112. doi:10.1016/j.envres.2015.09.020
Fernández-Nogueira, D., and Corbelle-Rico, E. (2019). Determinants of land use/cover change in the iberian peninsula (1990-2012) at municipal level. Land 9, 5. doi:10.3390/land9010005
Gu, C. L. (2019). Urbanization: processes and driving forces. Sci. China (Earth Sci.) 62 (9), 1351–1360. doi:10.1007/s11430-018-9359-y
Henderson, J. V., Storeygard, A., and Deichmann, U. (2017). Has climate change driven urbanization in Africa? J. Dev. Econ. 124, 60–82. doi:10.1016/j.jdeveco.2016.09.001
Holtz-Eakin, D., Newey, W., and Rosen, H. S. (1988). Estimating vector autoregressions with panel data. Econom. J. Econom. Soc. 56, 1371–1395. doi:10.2307/1913103
Huang, Z. H., Du, X. J., and Castillo, C. S. Z. (2019). How does urbanization affect farmland protection? Evidence from China. Resour. Conservation Recycl. 145, 139–147. doi:10.1016/j.resconrec.2018.12.023
Kuang, B., Lu, X., Han, J., and Zuo, J. (2020). How urbanization influence urban land consumption intensity: evidence from China. Habitat Int. 100, 102103. doi:10.1016/j.habitatint.2019.102103
Li, W., Wang, Y., Xie, S., and Cheng, X. (2021b). Coupling coordination analysis and spatiotemporal heterogeneity between urbanization and ecosystem health in Chongqing municipality, China. China. Sci. Total Environ. 791, 148311. doi:10.1016/j.scitotenv.2021.148311
Li, Y., Wang, J., Liu, Y., and Long, H. (2014). Problem regions and regional problems of socioeconomic development in China: a perspective from the coordinated development of industrialization, informatization, urbanization and agricultural modernization. J. Geogr. Sci. 24, 1115–1130. doi:10.1007/s11442-014-1142-y
Lin, X., Wang, Y., Wang, S., and Wang, D. (2015). Spatial differences and driving forces of land urbanization in China. J. Geogr. Sci. 25, 545–558. doi:10.1007/s11442-015-1186-7
Liu, Y. L., Zhang, X. H., Kong, X. S., Wang, R., and Chen, L. (2018). Identifying the relationship between urban land expansion and human activities in the Yangtze River Economic Belt, China. Appl. Geogr. 94, 163–177. doi:10.1016/j.apgeog.2018.03.016
Love, I., and Zicchino, L. (2006). Financial development and dynamic investment behavior: evidence from panel V AR. Q. Rev. Econ. Financ. 46, 190–210. doi:10.1016/j.qref.2005.11.007
Luo, J. J., Zhang, X. L., Wu, Y. Z., Shen, J. H., Shen, L. Y., and Xing, X. S. (2018). Urban land expansion and the floating population in China: for production or for living? Cities 74, 219–228. doi:10.1016/j.cities.2017.12.007
Luo, X., Tong, Z., Liu, Y., Xiong, Q., Wu, Z., and Chen, H. (2023). Revealing the formation mechanism of rural housing hollowing via considering the nonlinear effects of spatial factors and planning variables. Appl. Geogr. 155, 102957. doi:10.1016/j.apgeog.2023.102957
Mahtta, R., Fragkias, M., Güneralp, B., Mahendra, A., Reba, M., Wentz, E. A., et al. (2022). Urban land expansion: the role of population and economic growth for 300+ cities. npj Urban Sustain 2, 5. doi:10.1038/s42949-022-00048-y
Mallach, A., Haase, A., and Hattori, K. (2017). The shrinking city in comparative perspective: contrasting dynamics and responses to urban shrinkage. Cities 69, 102–108. doi:10.1016/j.cities.2016.09.008
Martinez-Fernandez, C., Wu, C. T., Schatz, L. K., Taira, N., and Vargas-Hernández, J. G. (2012). The shrinking mining city: urban dynamics and contested territory. Int. J. Urban Reg. Res. 36, 245–260. doi:10.1111/j.1468-2427.2011.01094.x
Min, M., and Hu, T. (2013). “Analysis on coordination development between population urbanization and land n urbanization in hubei province,” in Proceedings of the Second International Conference on Agro-Geoinformatics, USA, 12–16 August 2013 (Fairfax), 378–381.
Pallagst, K. (2010). Viewpoint: The planning research agenda: shrinking cities – a challenge for planning cultures. Rev 81, i–vi. doi:10.3828/tpr.2010.22
Peerzado, M. B., Magsi, H., and Sheikh, M. J. (2018). Land use conflicts and urban sprawl: conversion of agriculture lands into urbanization in Hyderabad, Pakistan. J. Saudi Soc. Agric. Sci. 18, 423–428. doi:10.1016/j.jssas.2018.02.002
Peng, J., Zhao, M., Guo, X., Pan, Y., and Liu, Y. (2017). Spatial-temporal dynamics and associated driving forces of urban ecological land: a case study in Shenzhen City, China. Habitat Int. 60, 81–90. doi:10.1016/j.habitatint.2016.12.005
Prastiyo, S. E., Hardyastuti, S., and Jamhari, H. (2020). How agriculture, manufacture, and urbanization induced carbon emission? The case of Indonesia. Environ. Sci. Pollut. Res. 27 (33), 42092–42103. doi:10.1007/s11356-020-10148-w
Prettner, K. (2014). The non-monotonous impact of population growth on economic prosperity. Econ. Lett. 124 (1), 93–95. doi:10.1016/j.econlet.2014.04.031
Rapp, L. (1996). Public service or universal service? Telecommun. Policy 20, 391–397. doi:10.1016/0308-5961(96)81167-0
Ren, F., and Yu, X. (2021). Coupling analysis of urbanization and ecological total factor energy efficiency——a case study from Hebei province in China. Sustain. Cities Soc. 74, 103183. doi:10.1016/j.scs.2021.103183
Roak, M., Hospers, G. J., and Reverda, N. (2016). Searching for social sustainability: the case of the shrinking city of heerlen, The Netherlands. Sustainability 8, 382. doi:10.3390/su8040382
Saidi, K., and Mbarek, M. B. (2017). The impact of income, trade, urbanization, and financial development on CO2 emissions in 19 emerging economies. Environ. Sci. Pollut. Res. 24, 12748–12757. doi:10.1007/s11356-016-6303-3
Sato, Y., and Yamamoto, K. (2005). Population concentration, urbanization, and demographic transition. J. Urban Econ. 58 (1), 45–61. doi:10.1016/j.jue.2005.01.004
Schiavina, M., Melchiorri, M., Freire, S., Florio, P., Ehrlich, D., Tommasi, P., et al. (2022). Land use efficiency of functional urban areas: global pattern and evolution of development trajectories. Habitat Int. 123, 102543. doi:10.1016/j.habitatint.2022.102543
Siciliano, G. (2012). Urbanization strategies, rural development and land use changes in China: a multiple-level integrated assessment. Land Use Policy 29, 165–178. doi:10.1016/j.landusepol.2011.06.003
Sun, P., Song, W., Xiu, C., and Liang, Z. (2013). Non-coordination in China’s urbanization: assessment and affecting factors. Chin. Geogr. Sci. 23, 729–739. doi:10.1007/s11769-013-0634-5
Sun, Y., and Zhao, S. Q. (2018). Spatiotemporal dynamics of urban expansion in 13 cities across the Jing-Jin-Ji Urban Agglomeration from 1978 to 2015. Ecol. Indic. 87, 302–313. doi:10.1016/j.ecolind.2017.12.038
Venkatesan, A. K., Ahmad, S., Johnson, W., and Batista, J. R. (2011). Systems dynamic model to forecast salinity load to the Colorado River due to urbanization within the Las Vegas Valley. Sci. Total Environ. 409, 2616–2625. doi:10.1016/j.scitotenv.2011.03.018
Wang, J. Y., Wang, S. J., Li, S. J., and Feng, K. (2019b). Coupling analysis of urbanization and energy-environment efficiency: evidence from Guangdong province. Appl. Energy 254, 113650. doi:10.1016/j.apenergy.2019.113650
Wichowska, A. (2021). Economic aspects of shrinking cities in Poland in the context of regional sustainable development. Sustainability 13, 3104. doi:10.3390/su13063104
Williamson, J. G. (1990). Coping with city growth during the British industrial revolution: did britain’s cities grow too fast? Cambridge, UK: Cambridge University Press.
World Economic Research Office, Institute of Economics, Chinese Academy of Sciences (1962). Economic statistics of major capitalist countries (1848–1960); world knowledge pres. India: Tarkeshwar.
Wu, F. (2022). Land financialisation and the financing of urban development in China. Land Use Policy 112, 104412. doi:10.1016/j.landusepol.2019.104412
Wu, W., and Niu, S. (2012). Evolutional analysis of coupling between population and resource-environment in China. Procedia Environ. Sci. 12, 793–801. doi:10.1016/j.proenv.2012.01.350
Xing, L., Xue, M., and Hu, M. (2019). Dynamic simulation and assessment of the coupling coordination degree of the economy–resource–environment system: case of Wuhan City in China. J. Environ. Manag. 230, 474–487. doi:10.1016/j.jenvman.2018.09.065
Yang, R., Luo, X., Xu, Q., Zhang, X., and Wu, J. (2021). Measuring the impact of the multiple cropping index of cultivated land during continuous and rapid rise of urbanization in China: a study from 2000 to 2015. Land 10, 491. doi:10.3390/land10050491
Yin, K., Wang, R. S., An, Q. X., Yao, L., and Liang, J. (2014). Using eco-efficiency as an indicator for sustainable urban development: a case study of Chinese provincial capital cities. Ecol. Indic. 36, 665–671. doi:10.1016/j.ecolind.2013.09.003
Yu, S., Miao, Y., Li, M., Ding, X., Wang, C., and Dou, W. (2022). Theoretical development model for rural settlements against rural shrinkage: an empirical study on pingyin county, China. Land 11 (8), 1238. doi:10.3390/land11081238
Yu, W. J., Zhang, Y. J., Zhou, W. Q., Wang, W. M., and Tang, R. (2019). Urban expansion in Shenzhen since 1970s: a retrospect of change from a village to a megacity from the space. Phys. Chem. Earth, Parts A/B/C 110, 21–30. doi:10.1016/j.pce.2019.02.006
Zang, Y., Zhu, J., Han, X., and Lv, L. (2023). Dynamics between population growth and construction land expansion: evidence from the Yangtze River economic belt of China. Land 12 (7), 1288. doi:10.3390/land12071288
Zhang, K. H., and Song, S. F. (2003). Rural-urban migration and urbanization in China: evidence from time-series and cross-section analyses. China Econ. Rev. 14, 386–400. doi:10.1016/j.chieco.2003.09.018
Zhang, X., Wang, J., Song, W., Wang, F., Gao, X., Liu, L., et al. (2022). Decoupling analysis between rural population change and rural construction land changes in China. Land 11 (2), 231. doi:10.3390/land11020231
Zhao, J., Xiao, Y., Sun, S., Sang, W., and Axmacher, J. C. (2022). Does China’s increasing coupling of ‘urban population’ and ‘urban area’ growth indicators reflect a growing social and economic sustainability? J. Environ. Manag. 301, 113932. doi:10.1016/j.jenvman.2021.113932
Zheng, H., Wang, X., and Cao, S. (2014). The land finance model jeopardizes China’s sustainable development. Habitat Int. 44, 130–136. doi:10.1016/j.habitatint.2014.05.008
Keywords: shrinking cities, land urbanization, population urbanization, coupled coordination, spatial autocorrelation
Citation: Chen S-J, Dai Q and Liu X-Y (2024) Coupling coordination and interactive relationship between population urbanization and land urbanization from the perspective of shrinking cities: a case study of Jiangsu province, China. Front. Environ. Sci. 12:1423221. doi: 10.3389/fenvs.2024.1423221
Received: 25 April 2024; Accepted: 14 June 2024;
Published: 15 July 2024.
Edited by:
Diogo Guedes Vidal, University of Coimbra, PortugalReviewed by:
Maria Alzira Pimenta Dinis, Fernando Pessoa University, PortugalIacopo Zetti, University of Florence, Italy
Copyright © 2024 Chen, Dai and Liu. This is an open-access article distributed under the terms of the Creative Commons Attribution License (CC BY). The use, distribution or reproduction in other forums is permitted, provided the original author(s) and the copyright owner(s) are credited and that the original publication in this journal is cited, in accordance with accepted academic practice. No use, distribution or reproduction is permitted which does not comply with these terms.
*Correspondence: Qi Dai, ZGFpcWkxMjhAaGh1LmVkdS5jbg==