- 1School of Finance and Economics, Henan Polytechnic University, Jiaozuo, China
- 2College of Business Administration and Accountancy, De La Salle University-Dasmariñas, Dasmariñas, Philippines
Introduction: Energy is the fundamental driving force for world economic and social development. However, the growth of carbon dioxide emissions and increasing environmental challenges are becoming increasingly problematic, limiting the pace of economic development.
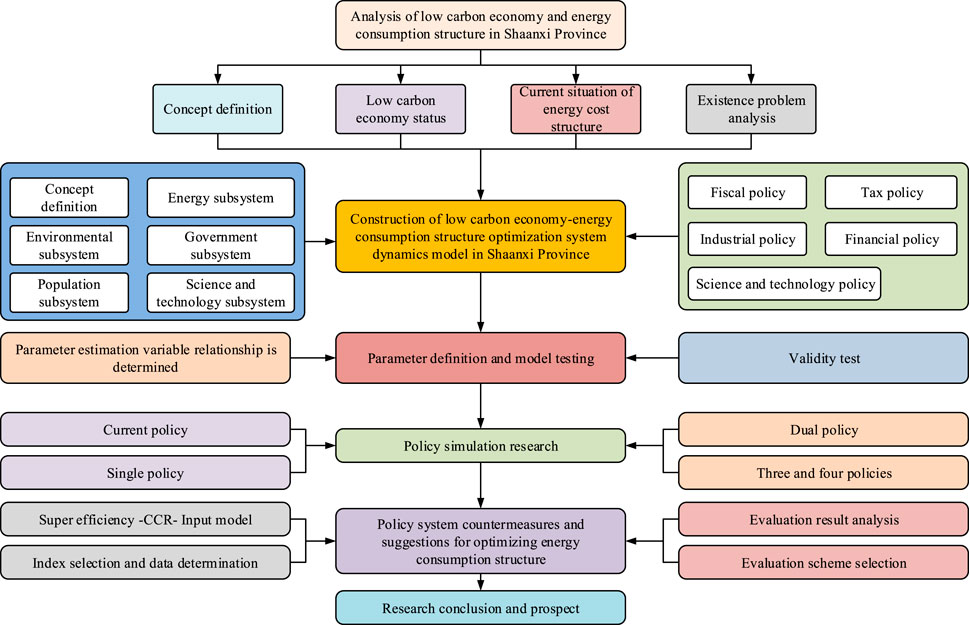
Methods: To optimize the energy consumption structure and promote the development of low-carbon economy, this study took Shaanxi Province as an example to analyze the impact of low-carbon economy policy variables on the energy consumption structure dominated by coal. The purpose of this study is to examine the influence of policy variables on the evolution of energy consumption structure by constructing a system dynamics model. In addition, this study will explore policy optimization issues.
Results: The error of simulation results was within ±10%. The consumption of non-fossil energy increased from 2,196,400 tons of standard coal in 2009 to 22.578 million tons in 2030, which is in line with the development trend. Under these four policy combinations, the share of coal will fall to 57.8 percent by 2030. In addition, the share of non-fossil energy sources will increase to 21 percent and the share of natural gas will reach 16 percent.
Discussion: The policy suggestions put forward in this paper are of great significance to the optimization of energy structure led by coal. The model constructed can be effectively applied to practical policy simulation and adjustment, and can provide reference for the development of low-carbon economic policies in other regions.
1 Introduction
Energy has become an indispensable fundamental factor in the advancement of the world economy and society. Since entering the industrial era, mineral energy has occupied a major proportion. When promoting social development, it also releases a large amount of carbon dioxide (CO2), resulting in consistently high CO2 concentrations in the atmosphere (Oh, 2023; Li et al., 2024). With the consumption of energy, social and economic development (ED) has been promoted, and a series of ecological and environmental problems have become increasingly prominent. Moreover, the result is that global warming has been unanimously recognized by the international community (Yuan and Pan, 2023). The global climate change issue appears to be an environmental issue on the surface, but behind it is essentially an energy issue, the fundamental reason being the transformation of ED models. The essence of global climate change governance is the issue of low-carbon (LC) development in the global economic model. China is currently in a critical stage of industrialization and urbanization, facing enormous pressure in terms of ED and energy conservation and emission reduction. To gain a voice internationally, promote economic transformation and development, and alleviate the pressure on resources and the environment, it is urgent to enhance the efficiency of LC ED to achieve a virtuous cycle with the global economy (Liu et al., 2024; Huang et al., 2023). However, current research on LC economy and energy consumption structure (ECS) is mostly optimized on the grounds of constructing multi-objective models or individual predictions. Few scholars, from the perspective of systems theory, use the consumption of heterogeneous energy as an output variable to construct a system dynamics model (SDM) to explore the influence of policy variables on the evolution trend of ECS and the optimization of ECS from a policy perspective. The concept of LC economy was first proposed by the academic community, and a research framework was constructed for the CO2 emissions trajectory of the energy industry sector in different policy choices of countries around the world. It is believed that both developed and developing countries need to take early action for controlling the concentration of CO2 in the atmosphere to twice or lower than pre-industrial levels (Zhang et al., 2023). The research on ECS mainly focuses on the influencing factors of ECS, LC evaluation of ECS, and optimization of ECS (Zeng and Wang, 2023). By analyzing the panel data on 282 cities in China, Ding et al. (2024) explored the relationship between network infrastructure expansion and LC development. The study employed the quasi-natural experiment of “Broadband China” to investigate the impact of network infrastructure expansion on LC development. The findings suggest that such expansion can significantly enhance the prospects of LC development, primarily by optimizing the industrial structure and promoting technology investment. In addition, the study revealed the dual impact of network infrastructure expansion on the efficiency of LC technologies, and the policy effects vary across cities (Ding et al., 2024). Using a non-linear ARDL model and wavelet analysis based on monthly data from 1992 to 2017, Fatima et al. found that global energy prices have an asymmetric effect on CO2 emissions. Wavelet analysis showed that this relationship varied across time scales and sectors, and ignoring non-linearity could lead to misleading conclusions (Fatima et al., 2021). Meo MS confirmed the asymmetric relationship between temperature and CO2 emission by using the NARDL method. In the short term, energy use, population growth, and economic growth (EG) increased emissions. In the long term, energy consumption and EG continued to push up emissions, with a 1% drop in temperature reducing emissions by 5%. The study also supported policies to increase renewable energy consumption (Meo et al., 2023). Adebayo et al. (2021) summarized the relation in CEs, EG, and technological innovation in Brazil, focusing on the optimization of ECS and the advancement of LC economy. This effectively promoted the optimization of Brazil’s ECS and the advancement of LC economy (Adebayo et al., 2021).
In addition, Raihan and Tuspekova (2022) conducted in-depth research on the advancement of LC economy and ECS by using econometric methods and dynamic ordinary least squares method to address the current issues related to global environmental quality improvement and sustainable development. This provided assistance in proposing sustainable development strategies and mitigating environmental degradation. Ullah et al. (2022) addressed the issue of CEs in the transportation sector and constructed an EC prediction model using machine learning algorithms. This effectively promoted the optimization of ECS in the transportation industry and provided development ideas for sustainable development (Ullah et al., 2022). Qu et al. (2021) addressed the issue of greenhouse gas emissions in sustainable development by constructing centralized and decentralized game models using Stackelberg theory. This effectively promoted the optimization of ECS in the supply chain and provided corresponding data reference for the advancement of LC economy (Qu et al., 2021).
The extant research on the LC economy and ECS is primarily concerned with the construction of multi-objective models or single forecasts. However, these studies tend to lack an overarching perspective informed by system theory and do not fully account for the heterogeneous nature of energy consumption. Second, when analyzing the evolution trend of ECS, most studies fail to effectively combine the influence of policy variables on energy structure, resulting in low accuracy of trend analysis. In addition, most of the existing studies focus on the optimization analysis of a single policy and fail to fully explore the comprehensive effects of multiple policy combinations. With the promotion of the global LC economy, the energy structure of Shaanxi Province, which is highly dependent on fossil fuels, has become more unreasonable, and there is a gap with the national optimization trend. Subsequently, optimizing the ECS of Shaanxi Province is crucial for the regional and national LC transition. Therefore, this study makes up for the above shortcomings by constructing the system dynamics model. From the perspective of system theory, this study takes heterogeneous energy consumption as the output variable and comprehensively analyzes the influence of different policy variables on the evolution of ECS in Shaanxi Province. Furthermore, this study examines the influence of diverse policy combinations and determines the most efficacious policy combinations, thereby offering a novel perspective for the optimization of ECS in theory and a scientific foundation for the formulation of regional LC economic policies in practice. The main contributions of the research are as follows: the system dynamics model suitable for Shaanxi Province is proposed, which significantly improves the accuracy and applicability of policy simulation. At the same time, through the policy combination analysis, the effective path to optimize the regional ECS is identified. These innovations provide important support for further optimizing regional energy policies and promoting LC ED.
2 Methodology
Shaanxi Province is a significant energy-producing region in China, endowed with substantial coal and natural gas reserves. Its EG has historically been closely tied to the energy sector, particularly coal. However, with the promotion of LC economy across the country, Shaanxi faces the challenge of industrial structure transformation, especially in the case of unreasonable ECS. The examination of LC policy practices in middle and middle ecologically fragile regions, which are susceptible to environmental consequences resulting from energy consumption, is beneficial in achieving equilibrium between energy development and environmental conservation. At present, the ECS of Shaanxi Province is extremely unreasonable, mainly coal, and the optimization space is large. An investigation into the evolution of ECSs in Shaanxi Province has the potential to offer insights that can inform LC transformations in other resource-dependent regions. Additionally, the findings may serve as a point of reference for similar regions worldwide.
The optimization of ECS in Shaanxi Province is a multifaceted endeavor, encompassing a range of interrelated factors, including ED, energy consumption, environmental impact, and policy implementation. The system dynamics model can handle this complex system with multiple variables and layers and study its impact on the ECS by simulating the dynamic relationship between these factors. The influence of policy variables on the development trend of ECS is studied in a more systematic way. Therefore, the system dynamics model can fill this gap and study the influence of policy on the evolution of energy structure more systematically. Statistical data are used to build models for verification so as to improve the reliability of prediction and provide a new perspective for the theoretical study of LC economy.
2.1 Analysis of the energy consumption structure and low-carbon economy in Shaanxi Province
At present, there is a problem that the analysis of the evolution trend of regional ECS using LC economic policy variables has not been conducted from a systematic perspective, resulting in poor accuracy in trend analysis. Therefore, this study takes Shaanxi Province as an example and analyzes the evolution trend of regional ECS by constructing a SDM. It is widely believed worldwide that the emergence of the LC economy is mainly aimed at addressing issues such as the greenhouse effect and chemical energy reserves. In the context of economic globalization, the LC economy has gone beyond the scope of technology and economy and has risen to a political level. It is also a game played by countries to fight for the discourse power of future ED (VE et al., 2021; Sheng et al., 2023; Luderer et al., 2022). This study believes that the essence of LC economy is to decrease the consumption of high-carbon energy through various means. Meanwhile, it improves energy utilization efficiency by optimizing the structure of energy and can continuously reduce the concentration of CO2. This approach is the optimal means of attaining a harmonious development of the economy, society, resources, and environment while simultaneously minimizing EC and CO2 emissions and maximizing economic output benefits. The ECS includes primary EC, terminal EC, and partial ECS, and the studied ECS is primary ECS (Pell et al., 2021; Zhang et al., 2022; Jahanger et al., 2022).
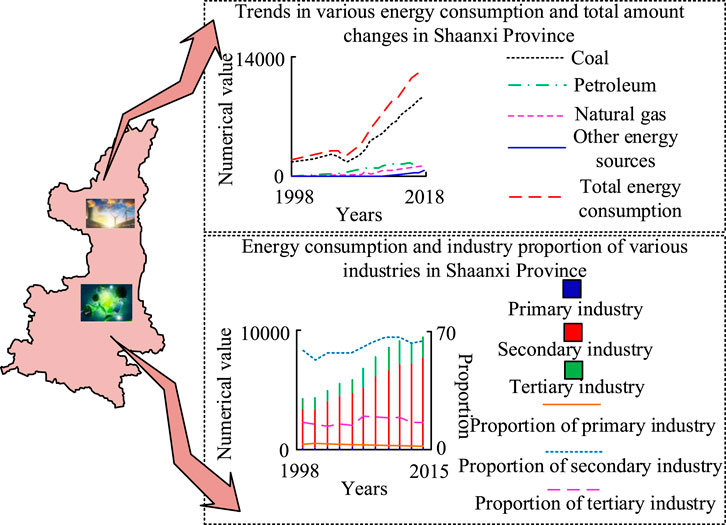
On the grounds of this, the study mainly analyzes the current ED status of Shaanxi Province from the overall economic status and industrial structure. It also analyzes its overall ECS from the perspectives of total EC, EC of various industries, and ECS. The analysis of the current ED status of Shaanxi Province from the overall economic conditions and industrial structure is shown in Figure 1.
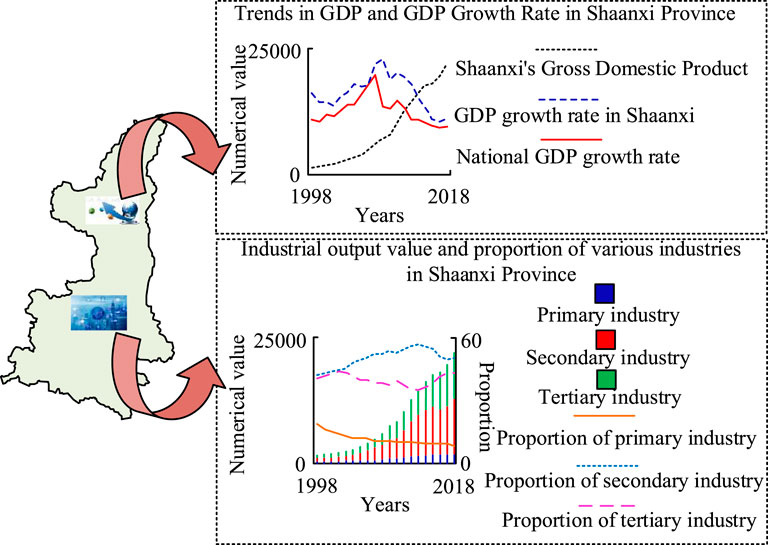
Figure 1. Analysis results of the current ED status of Shaanxi Province on the grounds of the overall economic situation and industrial structure.
Figure 1 shows that Shaanxi Province, with its energy advantage, has increased its gross domestic product (GDP) from approximately 31.4 billion yuan in 1988 to approximately 24.438 billion yuan in 2018, a growth of only 77.7 times in 30 years. From the perspective of GDP growth rate, the average annual growth rate of GDP in Shaanxi Province has exceeded the national average in the past 20 years and has shown a development trend that is basically in line with the same period in the country. This demonstrates that the economic situation of Shaanxi Province is closely relevant to the macroeconomic situation of the country. Taking 2008 as the dividing line, the GDP of Shaanxi Province maintained an overall growth trend before 2008 but showed an overall decline trend after 2008. The main reason is that after the 2008 global economic crisis, the world economy continued to be sluggish, and China’s EG rate also slowed down. The EG rate of Shaanxi Province also began to decline. In 2014, China entered a new normal, and its traditional advantages gradually weakened. The country was in a stage of medium- to high-speed development, transitioning from extensive development to intensive development and from factor-driven to innovation-driven. Meanwhile, Shaanxi Province has also encountered the same problems during the same period and urgently is essential to transform toward a green and LC development mode to promote economic transformation and upgrading.
The proportion of the primary industry in Shaanxi Province is continuously decreasing in terms of industrial structure. Before 2001, there was a certain growth in the proportion of the tertiary industry (TI). From 2001 to 2014, the proportion of the TI showed a continuous decline. After 2014, the proportion of the TI increased. This is mainly due to the fact that the ED of Shaanxi Province before 2014 mainly relied on the secondary industry. Although the number of the TI is increasing every year, its growth rate is slower than that of the secondary industry, so its proportion in the province continues to decrease. In 2014, China’s economy entered a “new normal”, and Shaanxi Province achieved a transformation of its industrial structure by decreasing the proportion of the secondary industry and growing the proportion of the TI. Since 2014, the proportion of the secondary industry has also shown a trend of first increasing and then decreasing. The secondary industry is mainly resource-dependent. Moreover, the unique energy resources in Shaanxi Province also have the conditions for the western development. The current situation of ECS in Shaanxi Province is shown in Figure 2.
From the perspective of total EC, Shaanxi Province has a unique advantage in energy resources, with various energy resource reserves ranking first in the country. However, there are significant differences in the consumption of various types of energy, and EC will continue to be the main driving force for ED in the future. From the perspective of EC in various industries, the EC of the secondary industry has been continuously increasing, maintaining a proportion of around 60% recently. The EC of the TI continues to remain relatively low, at a level of 15%–20%. The EC level of the primary industry is not high. From the ECS, there are generally unreasonable aspects in the ECS of Shaanxi Province, mainly dominated by coal and maintained at around 70% for a long time. The overall consumption of crude oil has increased first and then decreased, falling below 10%. The consumption of gas has steadily increased, currently exceeding 10%. Although the proportion of other energy sources is steadily increasing, it is still at a relatively low level. In addition, due to the high coal consumption in Shaanxi Province, analyzing its CE status is an overall analysis of its implementation of LC economic policies. Due to the lack of a unified calculation method for CO2 emissions in China, this study drew on the relevant calculation formulas in the National Greenhouse Gas Inventory Guidelines released by the United Nations Intergovernmental Panel on Climate Change in 2016 for calculation. Its expression is shown in Equation 1.
In Equation 1,
2.2 Construction of the energy consumption structure system model in Shaanxi Province
In response to the problems in the ECS of Shaanxi Province, this study constructs a system model of ECS in Shaanxi Province from the perspective of systems theory. The system model constructed by the research is a complex system with multiple elements, levels, and loops, in which many elements interact and constrain each other, forming a dynamic and complicated causal cycle. Compared to traditional economic energy environmental systems, the systems involved in research are more extensive. It includes multiple subsystems such as human beings, technology, economy, energy, environment, and government, and each subsystem is not isolated but affects and restricts each other. In these subsystems, with the government at the center, various powerful policies are implemented to effectively regulate various subsystems such as population, science and technology, economy, energy, and environment. This has led to dynamic changes in the overall system, and it is also a key element that dominates the formulation and implementation of LC economic policies. Therefore, the overall architecture of the constructed system model is shown in Figure 3.
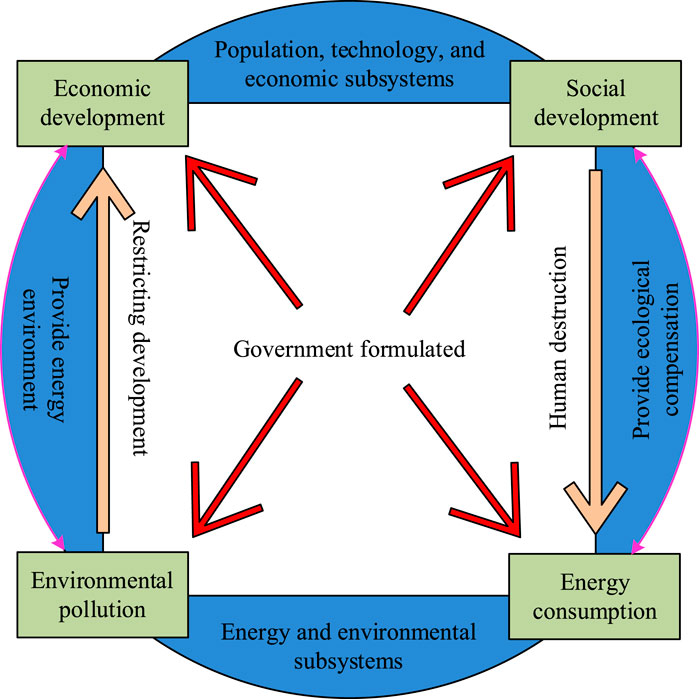
Figure 3. Schematic diagram of the overall architecture of the ECS system model in Shaanxi Province on the grounds of system theory.
In Figure 3, the system model is built on four key assumptions, one of which is that the energy conversion system (ECS) in the system model relies entirely on non-fossil energy sources. This means that all energy supply and conversion processes in the model are assumed to be provided by renewable or other non-fossil energy sources. The CO2 emissions in the system model come from coal, oil, and natural gas, which enter the atmosphere after complete combustion. The hindrance variables of non-mineral resources are not considered in the system model. The heterogeneous EC involved in the system model includes both productive EC and domestic EC. Figure 3 shows that the system model includes five subsystems, namely, population, technology, economy, energy, and environment, with each subsystem mutually constraining and influencing each other. The economic subsystem is the study of the effects of economic aggregate and GDP growth on the energy subsystem, which, in turn, affects the environmental subsystem. The population subsystem refers to the reasonable total population under the relatively stable conditions of subsystems such as economy, energy, and environment. The technology subsystem mainly studies the impact on the energy and environment subsystems under the condition of an increasing technological level. The energy subsystem studies the impact of different types of EC and their changes on the environment and economic subsystems under certain ED levels and population conditions. The environmental subsystem is on the grounds of a certain level of ED and EC and analyzes the impact of CO2 emissions caused by different types of EC on population and EG.
The role of the government subsystem is to analyze the influence of LC economic policy changes on the output variables of subsystems such as economy, energy, and technology. The research model includes the relationships between different variables in population, technology, economy, energy, and government, which constitute the ECS model of Shaanxi Province. The research model takes 2009–2030 as the simulation year for LC economic policies and simulates the impact of simulation schemes composed of relevant policy changes on ECS. The data are sourced from the statistical yearbook and economic statistical bulletin of Shaanxi Province from 2009 to 2022. In addition, mathematical calculation methods, development trend prediction methods, regression analysis methods, and other methods are utilized for determining the parameter settings and relationships between variables in the dynamic model of the system. This is to ensure that the system model can better simulate the relationships between variables and make it more consistent with reality. Among them, the GDP growth rate of the economic subsystem is determined by combining the Cobb Douglas production function with the Solow residual method, and the relevant expression is shown in Equation 2 (Zeytoon-Nejad et al., 2023; Tsachtsiris et al., 2022; Dańska-Borsiak, 2022).
In Equation 2, the second row is obtained by taking the logarithm of the first row and differentiating it separately while keeping the scale return constant. Among them,
In Equation 3,
In Equation 4,
The ECS in the energy subsystem mainly consists of four types: coal, oil, natural gas, and non-fossil energy. This study establishes panel data models with random effect coefficients for various types of EC and major influencing factors on the grounds of stationary and cointegration methods, using F-statistics and similarity tests. The calculation expressions of the four mathematical models are shown in Equations 5, 6.
In Equation 5,
In Equation 6,
3 Results
The simulation values of important variables in the model (such as total population, GDP, and energy consumption) are compared with historical data to check the relative errors of each variable. Through policy simulation, the change trend of ECS and carbon emission under different policy combinations is predicted. In this study, simulations are carried out under existing policies, single policies, and combination policies to verify the impact of policies on ECS. A sensitivity analysis is employed to ascertain the impact of disparate policy schemes on the model output, thereby identifying the optimal policy combination.
3.1 Policy simulation of the consumption structure system
Before simulating the consumption structure system, aiming at verifying the effectiveness of the model, this study first tested the constructed system model. It mainly conducted historical tests on eight important variables in the model, namely, total population (10,000 people), GDP (100 million yuan), coal consumption (10,000 tons of standard coal), natural gas consumption (10,000 tons of standard coal), oil consumption (10,000 tons of standard coal), non-fossil EC (10,000 tons of standard coal), researchers (people), and CEs (10,000 tons), represented by R, L, Q, P, M, U, S, and T, respectively. The test period is from 2016 to 2018, with a step size of 1 year. The historical test results of variables R, L, S, and T are shown in Figure 5.
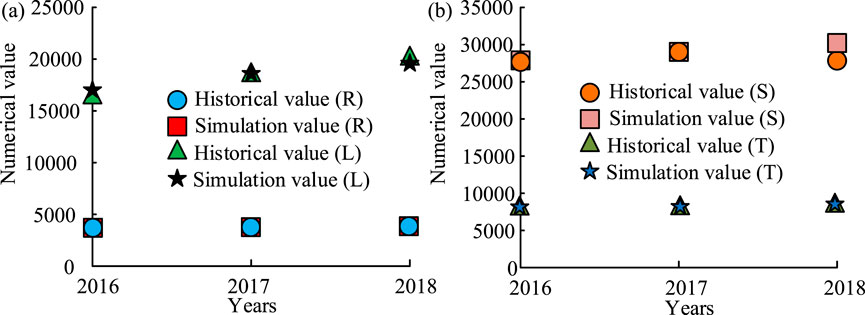
Figure 5. Historical test results for variables R, L, S, and T. (A) Historical test results for variables R and L. (B) Historical test results for variables S and T.
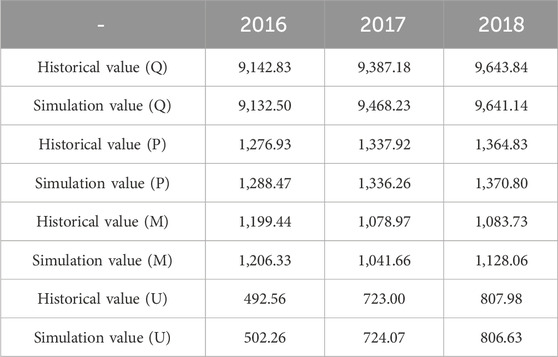
Figure 5A shows that the relative error of variable R is maintained between −0.2707 and −0.2578, and the relative error of variable L is maintained between −0.0162 and 0.0045. Figure 5B shows that the relative error of variable S is maintained between −0.0001 and −0, and the relative error of variable T is maintained between 0.0176 and 0.4628. The historical test results of variables Q, P, M, and U are shown in Table 1.
Table 1 shows that the relative error of variable Q is maintained between −0.1129 and 0.8635, while the relative error of variable P is maintained between −0.1233 and 0.9045. Figure 5B shows that the relative error of variable M is maintained between −3.4570 and 4.0914, while the relative error of variable U is maintained between −0.1658 and 1.9713. According to Figure 5 and Table 1, after historical testing, the relative errors of each variable are less than ±10%, indicating that the model has good fitting ability, can reflect the actual situation well, and can predict the ECS of Shaanxi Province. Therefore, in the simulation of consumption structure system policies, research is conducted to verify from three aspects: maintaining existing policies, single policies, and combination policies. The simulation results of ECS, heterogeneous EC, total EC, and CEs in Shaanxi Province under existing policies are shown in Figure 6.
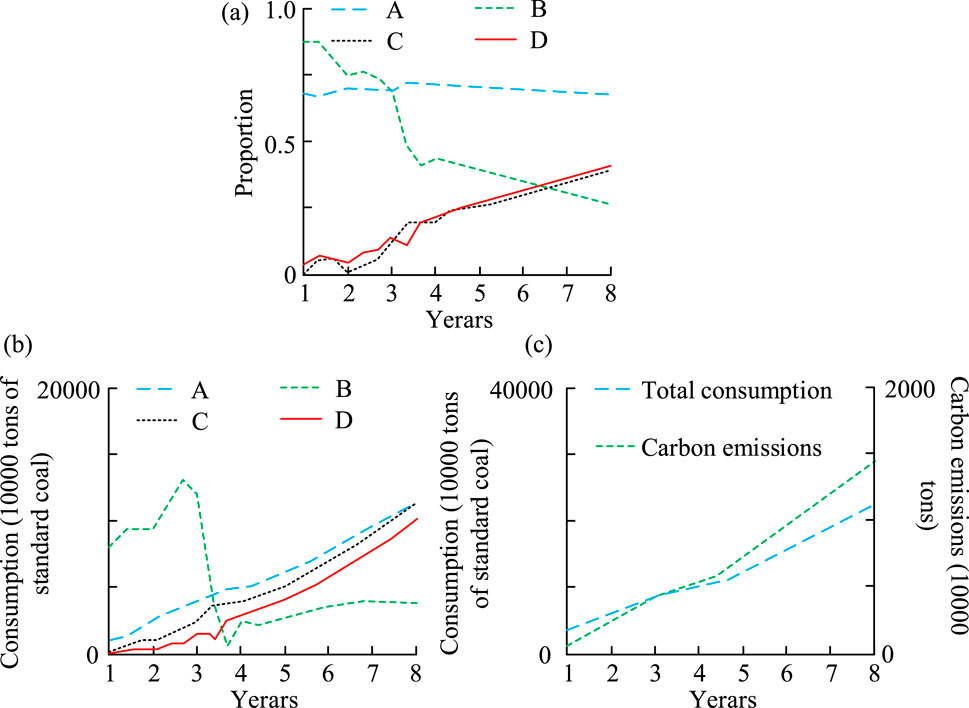
Figure 6. Verification results of system models under existing policies. (A) Changes in the energy consumption structure in Shaanxi Province. (B) Results of changes in consumption of heterogeneous energy sources. (C) Results of changes in total energy consumption and carbon emissions.
In Figure 6, 1–8 represent the years 2009–2030, with a 3-year interval. A ∼ D, respectively, represent coal, oil, natural gas, and non-fossil fuels. Figure 6A shows that the proportion of coal consumption is gradually decreasing, but the decline is not significant, basically maintaining around 70%. The proportion of oil has shown a significant decline since 2018. The proportion of natural gas and non-fossil fuels continues to rise, but it is relatively slow. From the current policy perspective, the evolution of ECS in Shaanxi Province in the coming years is basically consistent with the current development trend. By 2030, the proportion of coal consumption in Shaanxi Province will reduce to below 58%, the proportion of natural gas consumption will reach over 15%, and the proportion of non-fossil EC will reach around 20%. This result indicates that under the implementation of existing policies, it is hard for achieving the goal of optimizing the ECS. Figure 6B shows that various types of EC in Shaanxi Province have shown a certain growth trend, meeting the needs of future ED. Among them, by 2030, the consumption of coal, natural gas, and non-fossil fuels will increase to 157.443 million tons of standard coal, 33.0373 million tons of standard coal, and 22.578 million tons of standard coal. The slow increase in oil consumption is in line with the overall development trend. Figure 6C shows that under the current policy support, the total EC and CEs in Shaanxi Province are continuously increasing.
Overall, the system model is effective and scientific, and the actual simulation structure is basically consistent with the trend. However, relying on current policies is difficult to optimize the consumption structure, so research has begun to implement single and combination policies on the system and explore the degree of ECS optimization under government macroeconomic regulation. A single policy includes a single fiscal, industrial, financial, tax, and technology policy. Plan 1 and Plan 2 are set in the implementation of a single fiscal policy. The ratio of energy-saving and environmental protection investment to new energy investment in Plan 1 is 0.05 and 0.03, respectively. Option 2 is 0.06 and 0.04, respectively, while the existing policies are 0.04 and 0.02. Therefore, the simulation results of ECS, heterogeneous EC, total EC, and CEs in Shaanxi Province under the implementation of a single fiscal policy are shown in Figure 7.
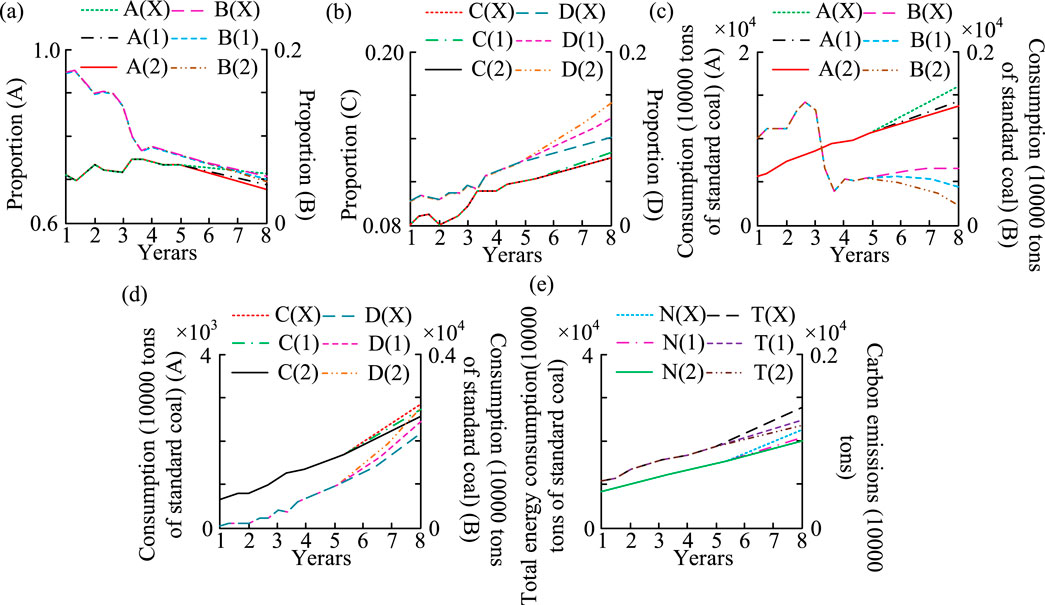
Figure 7. Simulation results under a single fiscal policy implementation. (A) Proportion of energy A and B, (B) proportion of energy C and D, (C) consumption of energy A and B, (D) consumption of energy C and D, and (E) results of indicators N and T.
In Figure 7, X represents existing policies and N represents total EC. Figures 7A, B show that the ECS after the implementation of the policy has significantly optimized compared to the current policy, with a decrease in the proportion of coal, oil, and natural gas. Among them, Plan 2 has experienced the largest decline, with coal accounting for less than 69% by 2030, while the proportion of non-fossil fuels has increased. As time goes on, the gap between the curves becomes larger and the optimization effect becomes more significant. Figures 7C, D show that under a single fiscal policy, the consumption of energy A ∼ C relative to existing policies is decreasing, while the consumption of energy D is continuously increasing, with a basic gap maintained at approximately 8 million tons of standard coal. Figure 7E shows that with the implementation of a single fiscal policy, both the total EC and CEs are decreasing, and over time, the curve gap is also widening, but the magnitude of the reduction is limited. Overall, the implementation of fiscal policies can effectively change the consumption of various energy sources and undoubtedly optimize the ECS through fiscal policies.
In the single industry policy, Plan 3 and Plan 4 are formed by adjusting the proportion of the TI, which are 47% and 50%, respectively, while the current policy has a proportion of 43% for the TI. Therefore, the simulation results of ECS and heterogeneous EC in Shaanxi Province under the implementation of a single industry policy are shown in Figure 8.
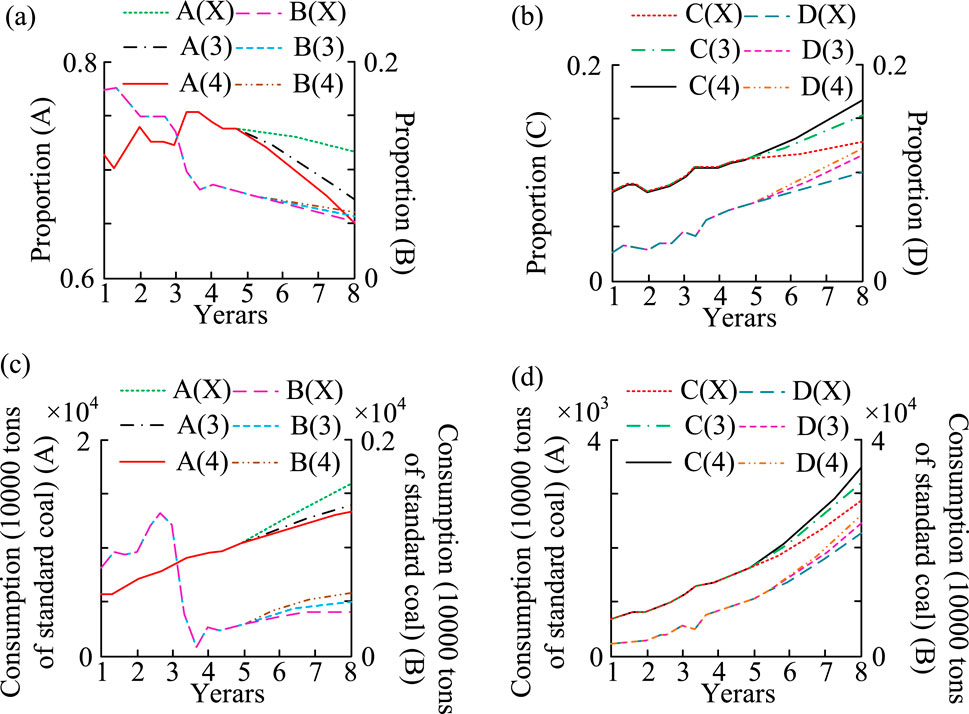
Figure 8. Simulation results under the implementation of a single industry policy. (A) Proportion of energy A and B, (B) proportion of energy C and D, (C) consumption of energy A and B, and (D) consumption of energy C and D.
Figures 8A, B show that under the implementation of schemes 3 and 4, the proportion of coal and oil continues to decrease, while scheme 4 will have a minimum of 65% and 5% by 2030, both lower than the implementation results of existing policies. The proportion of natural gas and non-fossil fuels continues to increase, with Plan 4 reaching a maximum of 17% and 12.5% by 2030, which is higher than the implementation results of existing policies. Figures 8C, D show that the increase in coal consumption under the implementation of schemes 3 and 4 is lower than the increase under the existing policy implementation. The consumption growth of oil, natural gas, and non-fossil fuels is higher than the growth under existing policy implementation. Among them, oil as a whole is in a trend of decreasing first and then slowly increasing, which is basically in line with the ED situation. Overall, implementing a single industry policy will help change the consumption of heterogeneous energy. Moreover, with the passage of time, the effect of industrial policies continues to emerge, and the distance between their curves is also further expanding. Therefore, implementing this policy helps optimize the consumption energy structure. In the implementation of a single financial policy, Schemes 5 and 6 are proposed by adjusting loan interest rates, with loan interest rates floating at +3% and −3%, respectively. The current policy loan interest rate fluctuates to 0. Therefore, the simulation results of ECS, heterogeneous EC, and CEs in Shaanxi Province under the implementation of a single financial policy are shown in Figure 9.
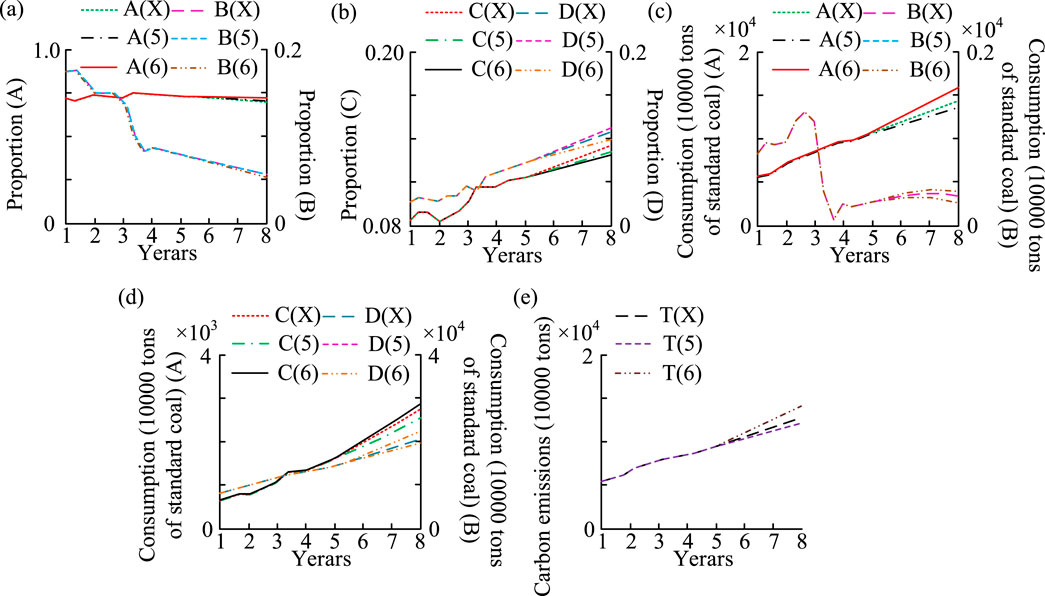
Figure 9. Simulation results under a single financial policy implementation. (A) Proportion of energy A and B, (B) proportion of energy C and D, (C) consumption of energy A and B, (D) consumption of energy C and D, and (E) results of indicators T.
Figures 9A, B show that under the implementation of schemes 5 and 6, the proportion of coal has not changed much, maintaining around 72%, and the rate of decline is lower than the current policy. The proportion of oil is continuously decreasing, with Plan 6 reaching a minimum of 5% by 2030, which is lower than the current policy results. The proportion of natural gas and non-fossil energy is also increasing, but both are below 14%, and the growth of natural gas is below the existing policy growth. Only Scheme 5 for non-fossil energy is higher than the existing policy growth. Figures 9C, D show that under the implementation of Plan 5, the coal consumption, natural gas consumption, and total EC have all decreased compared to existing policies, and the effect has become increasingly apparent over time. However, in terms of oil consumption, the EC between 2023 and 2025 is higher than the current policy and gradually decreases toward equality, while Plan 6 is the opposite. Figure 9E shows that the CO2 growth under Scheme 6 is significantly higher than other schemes. Overall, the rational utilization of financial policies has a promoting influence on the optimization of ECS. In a single tax policy, schemes 7 and 8 are formed by adjusting the tax rates of energy tax and carbon tax, respectively. Scheme 7 has an energy tax and carbon tax rate of +3%, Scheme 8 has a tax rate of +5%, and the current policy is 0. Therefore, the simulation results of ECS, heterogeneous EC, and CEs in Shaanxi Province under the implementation of a single tax policy are shown in Figure 10.
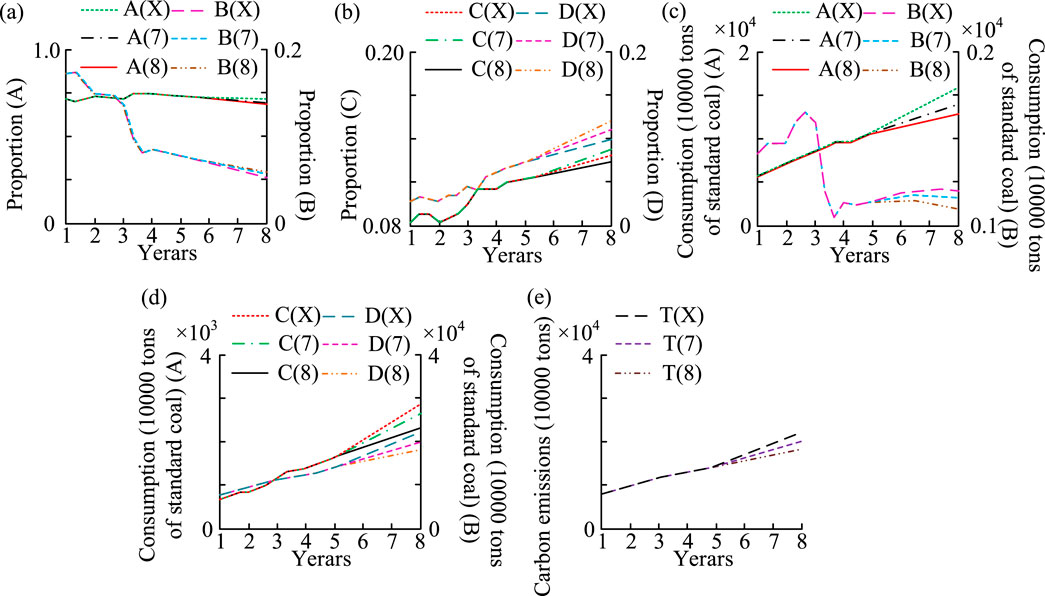
Figure 10. Simulation results under a single tax policy implementation. (A) Proportion of energy A and B, (B) proportion of energy C and D, (C) consumption of energy A and B, (D) consumption of energy C and D, and (E) results of indicators T.
Figures 10A, B show that the proportion of coal and oil is decreasing under the implementation of schemes 7 and 8. However, the downward trend of coal is relatively slow, maintaining around 75%, and the rate of decline in oil is lower than the current policy decline. The proportion of natural gas and non-fossil fuels is constantly increasing. Figures 10C, D show that the consumption of coal, oil, and natural gas, as well as the total EC, has significantly decreased since 2020, and over time, the gap between the consumption and the current policy has become larger. Figure 10E shows that when the carbon tax and energy tax rates rise, CO2 emissions will reduce. When the carbon tax and energy tax rates further rise, CO2 emissions will further decrease. Overall, implementing a single tax policy can effectively reduce fossil EC, and as the intensity increases, the effect becomes better. In the implementation of a single technology policy, Plan 9 and Plan 10 are proposed by changing the factors of the talent introduction policy and R&D investment ratio. Among them, the talent introduction policy factor and R&D investment ratio of Plan 9 are 1.2 and +3%, respectively. Plan 10 is 1.3 and +5%, and the current policy is 1.0 and 0. Therefore, the results of ECS and heterogeneous EC in Shaanxi Province under the implementation of a single technology policy are shown in Figure 11.
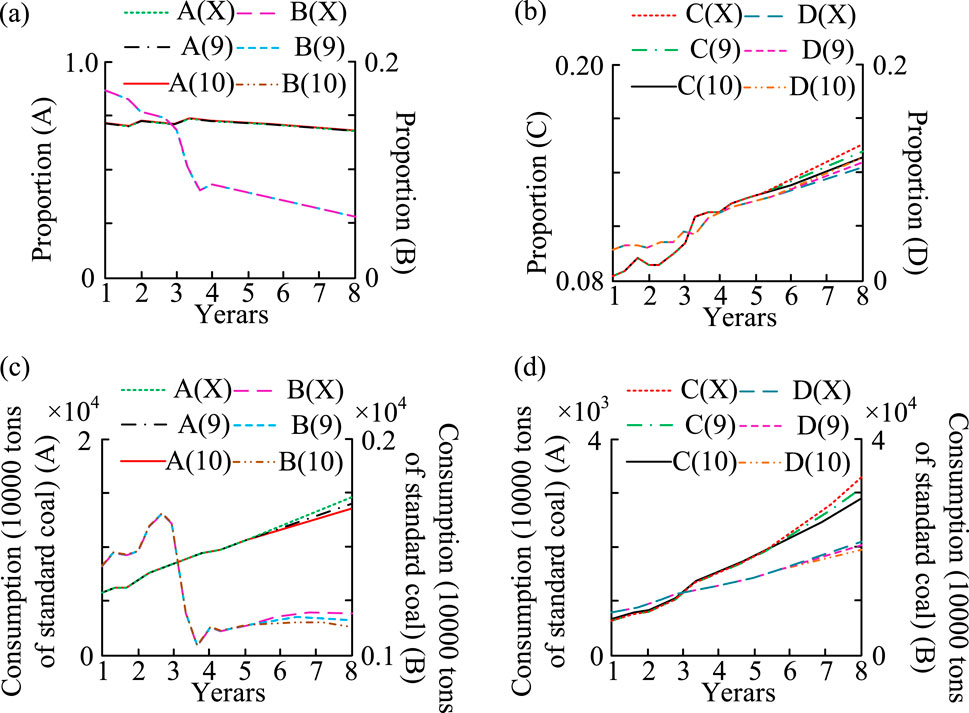
Figure 11. Simulation results under the implementation of a single technology policy. (A) Proportion of energy A and B, (B) proportion of energy C and D, (C) consumption of energy A and B, and (D) consumption of energy C and D.
Figures 11A, B show that the changes in the proportion of different energy sources under the implementation of schemes 9 and 10 are not significant compared to current policies, with only natural gas showing the largest change of about 5%. This result indicates that the optimization effect of technology policies on energy structure is limited in the short term. Figures 11C, D show that with the implementation of Scheme 9 and Scheme 10, the changes in EC and total EC are not significant, and their policy effects are weak. However, over time, the gap gradually widens. This result indicates that the implementation of science and technology policies has a certain lag.
Overall, the system model proposed in the study is effective in single policy simulation and can provide reference for optimizing the energy organizational structure in Shaanxi Province. However, the role of technology policy in a single policy is relatively weak, so it is excluded from the combination of three and four policies and used to form fiscal industry finance, fiscal industry tax, industry finance tax, fiscal finance tax, and fiscal industry finance tax policies, which are respectively set as E ∼ I. The parameter values under the relevant combination policies are selected from the data of the second policy in Figures 6–10. The simulation results of the ECS and heterogeneous EC in Shaanxi Province under the combination of policies 3 and 4 are shown in Figure 12.
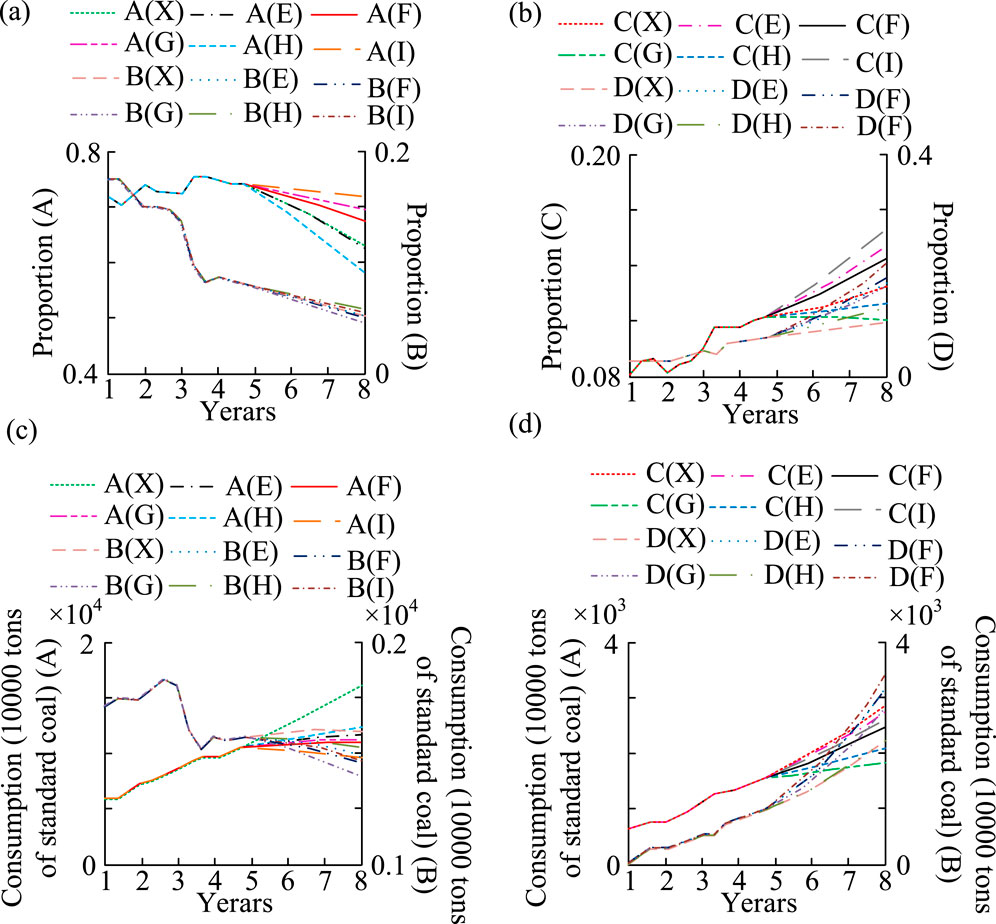
Figure 12. Simulation results under the implementation of the combination of three and four policies. (A) Proportion of energy A and B, (B) proportion of energy C and D, (C) consumption of energy A and B, and (D) consumption of energy C and D.
Figures 12A, B show that with the increase in policy combinations, the ECS changes significantly, and different policy combinations have different impacts on each energy source. With the combination of four policies, by 2030, the proportion of coal will decrease to 57.8%, while the proportion of non-fossil fuels will increase to 21% and the proportion of natural gas will decrease to 16%. The fundamental reason for this phenomenon is the close relationship between the change in ECS and each type of EC. It is not only related to its own consumption but also closely relevant to the consumption of other energy sources. Figures 12C, D show that as the quantity of combined policies grows, the consumption of heterogeneous energy sources changes significantly. Among them, under the four policy combinations, coal consumption is the lowest and renewable EC is the highest. However, in terms of renewable EC, a single fiscal and tax policy will increase consumption. Nevertheless, the separate finance and taxation have not undergone any changes. Therefore, the influence of renewable EC is the same across the four policy combinations and remains unchanged across different policy combinations. The continuous implementation of policies as a whole has become increasingly effective.
3.2 Policy scheme evaluation and consumption structure optimization simulation
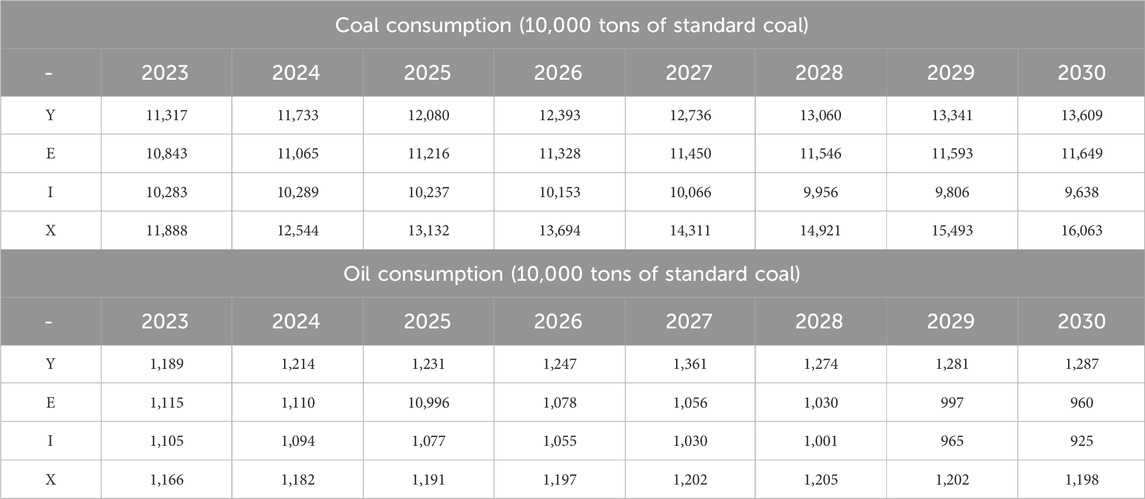
The sensitivity of different variables in the system model to policies varies in different policy scenario simulations, resulting in different impacts of the same policy scenario on different variables. Therefore, it is difficult to judge the advantages and disadvantages of different schemes separately on the grounds of their ECS. The study takes the number of labor force, fixed-assets investment, coal consumption, oil consumption, natural gas consumption, and non-fossil EC as input indicators. GDP and CEs are used as output indicators, and the relevant data are generated from the SDM. The simulation time interval is from 2023 to 2030. Taking coal and oil consumption as examples, the simulation data on industrial policy-related evaluation indicators are shown in Table 2.
In Table 2, Y represents industrial policies. Table 2 shows that the simulation data show that the coal consumption under the four combination policies is continuously decreasing, reaching 96.38 million tons of standard coal by 2030. The implementation of the three and four policies on oil consumption has decreased to 9.6 million tons of standard coal and 9.25 million tons of standard coal by 2030, with significant changes. In this simulation data, the evaluation of various schemes is preferred, and the evaluation index is selected as the LC economic efficiency value. The results are shown in Figure 13.
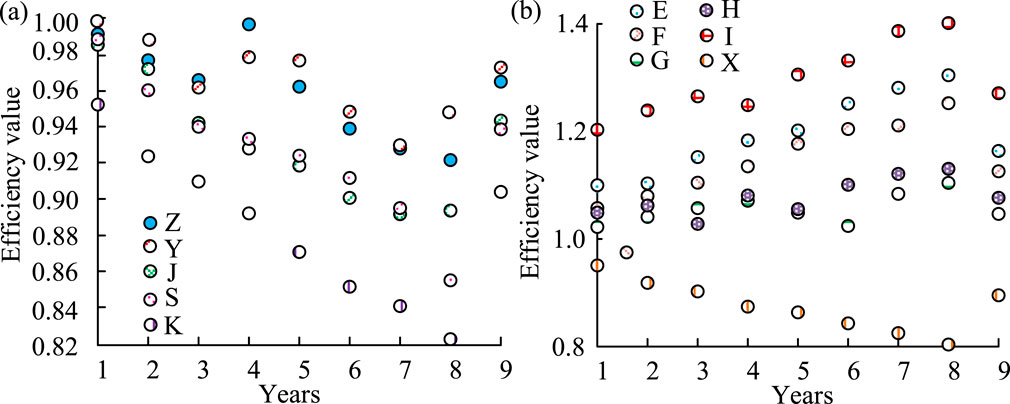
Figure 13. LC economic efficiency values of each evaluation scheme. (A) Low-carbon economic efficiency value of a single policy solution. (B) Low-carbon economic efficiency value of combined policy solutions.
In Figure 13, J, S, Z, and K represent a single fiscal, financial, tax, and technology policy, respectively. The horizontal axis 1–8 represents the years 2023–2030, and 9 represents the average value. Figure 13 shows that the average LC economic efficiency of a single fiscal, industrial, financial, tax, and technology policy is 0.9635, 0.9723, 0.9425, 0.9399, and 0.9043, respectively. The average LC economic efficiency of combination policies E, F, G, H, and I is 1.1651, 1.1246, 1.0481, 1.0753, and 1.2724, respectively, while the average LC economic efficiency of current policies is 0.8953. Overall, the overall value of a single policy is higher than the current policy, with the optimal combination of four policies. This policy takes into account the future LC ED of Shaanxi Province, making the coordinated development of the economy, energy, and environment in Shaanxi Province better. It can be regarded as the best policy solution for optimizing the ECS in Shaanxi Province, and the ECS is optimal under this policy combination. On the grounds of this, the ECS results of Shaanxi Province from 2023 to 2030 under this policy combination are shown in Table 3.
Table 3 shows that the proportion of coal consumption will decrease to 57.79% by 2030, and the decline will be faster in the later stage than in the earlier stage. The proportion of non-fossil EC will increase to 20.73% by 2030, and the growth rate will be relatively fast in the coming period. Throughout the process, the proportion of natural gas consumption has been increasing. Overall, with the support of this plan, the optimization of the ECS dominated by coal is essential, and the system model constructed through research has strong applicability.
4 Discussion
The comprehensive effects of fiscal, industrial, tax, and financial policies are analyzed from the perspective of LC economic benefits, and the potential of energy structure optimization and ecosystem sustainable development under multiple policy combinations is revealed. The research method is similar to the results of Aalizadeh R et al., which can better predict and promote the development of local ECS and LC (Aalizadeh et al., 2021). Compared with the system dynamics model in this study, Ding et al. (2024) mainly focused on causal analysis of statistical data rather than system simulation. Fatima et al. (2021) used the non-linear ARDL model and wavelet analysis to study the impact of global energy prices on CO2 emissions. This method focuses on the volatility analysis of time-series data, which is different from the global analysis of policy changes simulated by the system dynamics model in this study. This study uses a more specific policy mix simulation to optimize the energy structure by region, which is more operable than the macro summary in Adebayo et al. (2021). Qu et al. (2021) used the game model to study the optimization of LC supply chain. The game model is concerned with the interaction between different decision makers, while this study is more concerned with the dynamic changes of the whole system. Adjustments in fiscal, industrial, and tax policies could significantly optimize Shaanxi’s ecosystem and reduce its dependence on high-carbon energy sources. Although a single policy may have a beneficial impact on the energy mix, the effect of a combination of policies is more pronounced.
It is found that the combination of fiscal, industrial, tax, and financial policies can significantly improve the optimization effect of energy structure, which is better than the current policy. Under the optimal policy mix, by 2030, the proportion of coal, natural gas, and non-fossil energy consumption will reach 57.8%, 16%, and 21%, respectively, significantly reducing coal dependence and increasing the use of clean energy. Compared with the current policy focus on the improvement of a single area, the policy mix of this study is more forward-looking and systematic, focusing on the synergies of policies in multiple areas and promoting the overall economic transformation. Through the system dynamics model, the global impact of policy mix on energy structure and economic environment is studied and simulated and more operational suggestions are provided for policymakers.
5 Conclusion
At present, there is a dearth of systematic analysis of the evolution trend of regional ECS using LC economic policy variables. This has resulted in an inability to accurately discern trends. Therefore, this study used Shaanxi Province as an example to construct a SDM and analyzed its effectiveness. The experimental results showed that the relative errors of each variable in the historical test were less than ±10%, indicating that the model had good fitting ability. It reflected the actual situation well and could predict the ECS of Shaanxi Province. In the analysis of a single industry policy, Plan 2 experienced the largest decline, with coal accounting for less than 69% by 2030, while the proportion of non-fossil fuels increased. The implementation of a single technology policy had certain lag and short-term limitations. Therefore, by 2030, after implementing the combination policy, the proportion of coal decreased to 57.8%, while the proportion of non-fossil fuels increased to 21% and the proportion of natural gas decreased to 16%. In the evaluation of the plan and simulation optimization of consumption structure, the average LC economic efficiency of the four combination policies was 1.2724, which was better than other plan policies. Overall, the SDM constructed in the study was effective and applicable in the optimization model of ECS in Shaanxi Province. However, the study only analyzed Shaanxi Province and did not explore other regional energy provinces. Therefore, other research methods could be applied to optimize the model and apply it to other regional energy provinces in the future. Although the study offers a system model and policy simulation for optimizing ECS in Shaanxi Province, it is important to acknowledge the limitations to this approach. First of all, it only focuses on Shaanxi and does not consider the differences in other regions or international energy policies. Second, the policy variables do not fully take into account the impact of global market fluctuations, and the environmental and social benefits are evaluated in a single way. It would be beneficial for future studies to be expanded to other regions in order to enhance their applicability. Furthermore, the introduction of more detailed ecological and social benefit assessment indicators would provide a more comprehensive and reasonable basis for policy recommendations in light of global market changes.
6 Recommendations
In light of the aforementioned analysis, it can be posited that the following policies and fiscal policies play a pivotal role in optimizing the ECS. In particular, the support for energy conservation, environmental protection, and the new energy industry is of paramount importance as it facilitates enhanced energy efficiency and curtails the reliance on fossil energy sources. It is therefore recommended that financial investment in energy-saving and environmental protection industries be increased, that the stability and sustainability of funds be ensured, and that support for LC industries, such as new energy vehicles, be enhanced. In addition, the subsidy mechanism should be improved and the development of a LC transportation system promoted. By reducing the proportion of the secondary industry (such as energy and chemical industry) and promoting the development of low-energy TI such as information technology and service industry, it will help reduce the dependence of high-energy industries and promote green transformation. Green finance policy represents a crucial instrument for optimizing the ECS. The establishment of a green credit mechanism and financial incentive system can effectively steer enterprises toward LC transformation. It is advised to reinforce the green credit data sharing and accountability system to guarantee the transparency and efficacy of the utilization of funds. Tax policies, such as energy taxes and carbon taxes, can encourage companies to reduce carbon emissions, and it is recommended that the scope of the tax be gradually expanded to encourage the use of renewable energy. The combined effect of comprehensive fiscal, industrial, tax, and green finance policies can markedly enhance the energy structure, augment the proportion of non-fossil energy utilization, and facilitate the optimization of regional energy structures and the comprehensive advancement of a LC economy.
According to the simulation and evaluation results, research will provide optimization strategies for the formulation of related policies and schemes of ECS in Shaanxi Province in the next year from the following four policy aspects. The initial step will be to augment the input of fiscal policy. From 2014 to 2018, China has continuously increased its fiscal expenditure on energy conservation and environmental protection industries, and the trend is rising. Shaanxi needs to increase such investment as a share of GDP and focus on R&D of equipment in key industries such as energy and chemicals. Concurrently, it is imperative to reinforce the policy governing the special fund in order to guarantee the stability of the financial resources in question. The field of new energy vehicles should also increase financial support, optimize the subsidy evaluation system, and promote industrial development. Second, it should adjust industrial policy. For Shaanxi Province, it should reduce the proportion of the secondary industry, increase the proportion of the tertiary industry, develop low-energy, high-quality industries, and promote the green transformation of the industrial structure of Shaanxi Province. The objective is to enhance the efficacy of green finance policies. It is mainly to build a green credit data-sharing mechanism, implement the green credit accountability system, and strengthen the incentive and constraint functions of green credit. Third, it is imperative that tax policy is optimized. It would be advisable for Shaanxi Province to implement a carbon tax and extend the range of energy taxes that it collects. Through tax collection, enterprises are forced to carry out energy conservation and emission reduction, reduce fossil fuel consumption, and increase non-fossil energy consumption. Fourth, it should promote green finance, build a system for sharing green letter data and an accountability mechanism, and enhance incentives. Fifth, it should optimize tax policy. Shaanxi Province should carry out the general work of carbon tax collection, expand the scope of energy tax, promote conservation, and clean energy use.
Data availability statement
The original contributions presented in the study are included in the article/Supplementary Material; further inquiries can be directed to the corresponding author.
Author contributions
XS: investigation, supervision, and writing–review and editing. WO: investigation and writing–original draft.
Funding
The author(s) declare that financial support was received for the research, authorship, and/or publication of this article. This work was supported by the Fundamental Research Funds for the Universities of Henan Province–Cost control and optimization of new energy vehicle manufacturing enterprises based on TDABC (No. NSFRF210436); The Training Program for Young Backbone Teachers at Henan Polytechnic University–A two-stage supply chain coordination strategy for new energy vehicles based on carbon quota trading (No. 2022XQG-11).
Conflict of interest
The authors declare that the research was conducted in the absence of any commercial or financial relationships that could be construed as a potential conflict of interest.
Publisher’s note
All claims expressed in this article are solely those of the authors and do not necessarily represent those of their affiliated organizations, or those of the publisher, the editors, and the reviewers. Any product that may be evaluated in this article, or claim that may be made by its manufacturer, is not guaranteed or endorsed by the publisher.
References
Aalizadeh, R., Alygizakis, N. A., Schymanski, E. L., Krauss, M., Schulze, T., Ibanez, M., et al. (2021). Development and application of liquid chromatographic retention time indices in HRMS-based suspect and nontarget screening. Anal. Chem. 93 (33), 11601–11611. doi:10.1021/acs.analchem.1c02348
Adebayo, T. S., Adedoyin, F. F., and Kirikkaleli, D. (2021). Retracted Article: toward a sustainable environment: nexus between consumption-based carbon emissions, economic growth, renewable energy and technological innovation in Brazil. ESPR 28 (37), 52272–52282. doi:10.1007/s11356-021-14425-0
Cai, H., Shang, X., Hu, Y., Wang, Z., and Xu, Y. (2023). Dietary analysis of qin people in the spring and autumn period from the matengkong site in xi'an, Shaanxi province. Quat. Sci. 43 (5), 1493–1502. doi:10.11928/j.issn.1001-7410.2023.05.26
Dańska-Borsiak, B. (2022). GDP and TFP in poviats of the łódzkie voivodeship. Estimation and analysis of differentiation. ECONOMET 26 (1), 14–30. doi:10.15611/eada.2022.1.02
Ding, C. J., Chen, H., Liu, Y., Hu, J., Hu, M., Chen, D., et al. (2024). Unleashing digital empowerment: pioneering low-carbon development through the broadband China strategy. Energy 295, 131034. doi:10.1016/j.energy.2024.131034
Fatima, T., Karim, M. Z., and Meo, M. S. (2021). Sectoral CO2 emissions in China: asymmetric and time-varying analysis. J. Environ. Plann. Manage. 64 (4), 581–610. doi:10.1080/09640568.2020.1776691
Huang, X., Gao, J., and Zhang, H. (2023). Low-carbon eco-city development policy in China: a bibliometric analysis of policy documents. KYBERNETES 52 (2), 601–624. doi:10.1108/K-02-2022-0230
Ikeo, A. (2021). Review of jeff E. Biddle's progress through regression: the life story of the empirical cobb-douglas production function. Cambridge. Camb. Univ. Press 15 (2), 183–188. doi:10.23941/ejpe.v15i2.705
Ito, K., Piantham, C., and Nishiura, H. (2022). Relative instantaneous reproduction number of Omicron SARS-CoV-2 variant with respect to the Delta variant in Denmark. J. Med. Virol. 94 (5), 2265–2268. doi:10.1002/jmv.27560
Jahanger, A., Usman, M., and Ahmad, P. (2022). A step towards sustainable path: the effect of globalization on China’s carbon productivity from panel threshold approach. ESPR 29 (6), 8353–8368. doi:10.1007/s11356-021-16317-9
James Peter, O., Ojo, M. M., Viriyapong, R., and Abiodun Oguntolu, F. (2022). Mathematical model of measles transmission dynamics using real data from Nigeria. J. Differ. Equ. Appl. 28 (6), 753–770. doi:10.1080/10236198.2022.2079411
Jiang, L. (2021). Research on low carbon financial support strategies from the perspective of eco-environmental protection. Ecol. Chem. Eng. S. 28 (4), 525–539. doi:10.2478/eces-2021-0035
Li, H., Su, Y., Ding, C. J., Tian, G. G., and Wu, Z. (2024). Unveiling the green innovation paradox: exploring the impact of carbon emission reduction on corporate green technology innovation. Technol. Forecast. Soc. Change 207, 123562. doi:10.1016/j.techfore.2024.123562
Liu, B., Ding, C. J., Ahmed, A. D., Huang, Y., and Su, Y. (2024). Carbon emission allowances and green development efficiency. J. Clean. Prod. 142246 (July), 142246. doi:10.1016/j.jclepro.2024.142246
Luderer, G., Madeddu, S., Merfort, L., Ueckerdt, F., Pehl, M., Pietzcker, R., et al. (2022). Impact of declining renewable energy costs on electrification in low-emission scenarios. Nat. ENERGY 7 (1), 32–42. doi:10.1038/s41560-021-00937-z
Meo, M. S., Nathaniel, S. P., Khan, M. M., Nisar, Q. A., and Fatima, T. (2023). Does temperature contribute to environment degradation? Pakistani experience based on nonlinear bounds testing approach. Glob. Bus. Rev. 24 (3), 535–549. doi:10.1177/0972150920916653
Oh, C. (2023). Exploring the way to harmonize sustainable development assessment methods in article 6.2 cooperative approaches of the Paris agreement. GLCE 1 (3), 121–129. doi:10.47852/bonviewGLCE32021065
Pell, R., Tijsseling, L., Goodenough, K., Wall, F., Dehaine, Q., Grant, A., et al. (2021). Towards sustainable extraction of technology materials through integrated approaches. Nat. Rev. EARTH Env. 2 (10), 665–679. doi:10.1038/s43017-021-00211-6
Qu, S., Yang, H., and Ji, Y. (2021). Low-carbon supply chain optimization considering warranty period and carbon emission reduction level under cap-and-trade regulation. Environ. Dev. SUSTAIN 23 (12), 18040–18067. doi:10.1007/s10668-021-01427-8
Raihan, A., and Tuspekova, A. (2022). Nexus between emission reduction factors and anthropogenic carbon emissions in India. Anthropol. Sci. 1 (2), 295–310. doi:10.1007/s44177-022-00028-y
Saepudin, T., and Amalia, A. (2022). Analysis of rice production approach to Cobb Douglas production function in tambakdahan sub-district subang district. AGR Econ. 22 (2), 121–127. doi:10.21776/ub.agrise.2022.022.2.6
Sheng, H., Feng, T., and Liu, L. (2023). The influence of digital transformation on low-carbon operations management practices and performance: does CEO ambivalence matter? IJPR 61 (18), 6215–6229. doi:10.1080/00207543.2022.2088426
Tsachtsiris, G., Magoutas, A., and Papadogonas, T. (2022). ICT and economic growth in EU: a macro level comparison of estimated ICT output elasticities. J. Glob. Inf. Tech. Man. 25 (3), 202–216. doi:10.1080/1097198X.2022.2094182
Ullah, I., Liu, K., Yamamoto, T., Al Mamlook, R. E., and Jamal, A. (2022). A comparative performance of machine learning algorithm to predict electric vehicles energy consumption: a path towards sustainability. ENERG ENVIRON-UK 33 (8), 1583–1612. doi:10.1177/0958305X211044998
Ve, S., Shin, C., and Cho, Y. (2021). Efficient energy consumption prediction model for a data analytic-enabled industry building in a smart city. Build. Res. Inf. 49 (1), 127–143. doi:10.1080/09613218.2020.1809983
Yuan, S., and Pan, X. (2023). The spatiotemporal effects of green fiscal expenditure on low-carbon transition: empirical evidence from China’s low-carbon pilot cities. Ann. Reg. Sci. 70 (2), 507–533. doi:10.1007/s00168-022-01159-1
Zeng, S., and Wang, M. (2023). Theoretical and empirical analyses on the factors affecting carbon emissions: case of Zhejiang Province, China. Environ. Dev. SUSTAIN 25 (3), 2522–2549. doi:10.1007/s10668-022-02148-2
Zeytoon-Nejad, A., Goodwin, B. K., and Ghosh, S. (2023). Generalizing the General: generalizing the CES production function to allow for the viability of input thresholds. Appl. Econ. 55 (37), 4331–4347. doi:10.1080/00036846.2022.2128294
Zhang, L., Huang, F., Lu, L., Ni, X., and Iqbal, S. (2022). Retracted Article: energy financing for energy retrofit in COVID-19: recommendations for green bond financing. ESPR 29 (16), 23105–23116. doi:10.1007/s11356-021-17440-3
Zhang, S., Zhou, Z., Luo, R., Zhao, R., Xiao, Y., and Xu, Y. (2023). A low-carbon, fixed-tour scheduling problem with time windows in a time-dependent traffic environment. IJPR 61 (18), 6177–6196. doi:10.1080/00207543.2022.2153940
Keywords: low-carbon economy, energy consumption system, system dynamics model, coal, Shaanxi Province
Citation: Sun X and Onuh WO (2024) Regional energy consumption policy practice to promote low-carbon economy. Front. Environ. Sci. 12:1423009. doi: 10.3389/fenvs.2024.1423009
Received: 25 April 2024; Accepted: 17 September 2024;
Published: 25 October 2024.
Edited by:
Jiachao Peng, Wuhan Institute of Technology, ChinaReviewed by:
Chante Jian Ding, University of Malaya, MalaysiaMuhammad Saeed Meo, Sunway University, Malaysia
Copyright © 2024 Sun and Onuh. This is an open-access article distributed under the terms of the Creative Commons Attribution License (CC BY). The use, distribution or reproduction in other forums is permitted, provided the original author(s) and the copyright owner(s) are credited and that the original publication in this journal is cited, in accordance with accepted academic practice. No use, distribution or reproduction is permitted which does not comply with these terms.
*Correspondence: Xiaoting Sun, c3VueGlhb3RpbmdAaHB1LmVkdS5jbg==
 Xiaoting Sun
 Willington O. Onuh2