 Jinzhao Zou
 Yanan Wei2
 Yong Zhang
 Hongyan Chen
 Peng Liu
94% of researchers rate our articles as excellent or good
Learn more about the work of our research integrity team to safeguard the quality of each article we publish.
Find out more
ORIGINAL RESEARCH article
Front. Environ. Sci. , 20 June 2024
Sec. Environmental Informatics and Remote Sensing
Volume 12 - 2024 | https://doi.org/10.3389/fenvs.2024.1420557
Remote sensing has become an effective way for regional soil organic matter (SOM) quantitative analysis. Topographic factors affect SOM content and distribution, also influence the accuracy of SOM remote sensing inversion. In large region with complex topographic conditions, characteristic topographic factors of SOM in different topographic regions are unknown, and the effect of combining characteristic topographic factors with spectral parameters on improving SOM inversion accuracy remains to be further studied. Three typical topographic regions of Shandong Province in China, namely Western plain region (WPR), Central and southern mountain region (CSMR), Eastern hilly region (EHR), were selected. Topographic factors, namely Elevation, Slope, Aspect and Relief Amplitude, were introduced. Respectively, the characteristic topographic factors and spectral parameters of SOM in each region were identified. The SOM inversion models were built separately for each region by integrating spectral parameters with topographic factors. The results revealed that as for the characteristic topographic factors of SOM, none was in the WPR, E, RA, and S were in the CSMR, E and RA were in the EHR. In combination with characteristic topographic factors, the accuracy of SOM spectral inversion models improved, the calibration R2 increased by 0.075–0.102, the RMSE (Root mean square error) decreased by 0.162–0.171 g/kg, the validation R2 increased by 0.067–0.095, the RMSE decreased by 0.236–0.238 g/kg, and RPD (Relative prediction deviation) increased by 0.129–0.169. The most significant improvement was observed in the CSMR with the calibration R2 of 0.725, the validation R2 of 0.713 and the RPD of 1.852, followed by the EHR. This study not only contributes to the advancement of soil quantitative remote sensing theory but also offers more precise data support for the development of green, low-carbon, and precision agriculture.
As an important component of soil and a key index in the global carbon cycle (Wood and Baudron, 2018; Gu et al., 2019; Wang et al., 2023), soil organic matter (SOM) plays a key role in analyzing soil fertility and evaluating cropland quality (Gao et al., 2019; Pouladi et al., 2019; Wu et al., 2019; Luo et al., 2022; Luo et al., 2022). Accurately estimating and monitoring changes in SOM are highly significant for calculating carbon pools calculation and enhancing agricultural production (Li et al., 2019; Thaler et al., 2019; Wu et al., 2019; Wang and Zhou, 2023). The traditional laboratory analysis method for SOM is not only time-consuming and laborious, but also cannot provide continuous spatial distribution with discrete sample points, which makes it difficult to apply in large regions (Chen et al., 2019; Gao et al., 2019; Xu et al., 2023). With the development and maturity of remote sensing technology, remote sensing inversion based on multi-spectral satellite images has become an effective approach for quantitatively analyzing SOM contents (Kumar et al., 2018; Wang et al., 2018; Dou et al., 2019; Liu et al., 2023; Ma et al., 2023; Wang and Zhou, 2023; Zhou et al., 2023; Rajabi et al., 2024).
In the quantitative inversion of SOM utilizing multi-spectral satellite remote sensing, two primary methodologies are predominant. The first approach is only based on remote sensing inversion (Sun et al., 2022; Wei et al., 2022). In this method, spectral indexes are constructed using different mathematical combinations of the bands, and the characteristic spectral parameters of SOM are optimized, to build the spectral inversion model (Kahaer et al., 2019). For example, Dindaroglu et al. (Dindaroglu et al., 2022) built the spectral parameters and SOM inversion model based on Sentinel-2A MSI images at the research station of Kahramanmaras Sutcu Imam University in Turkey. Tang et al. (Tang et al., 2022) employed Multiple Linear Stepwise Regression (MLSR) and Partial Least Square (PLSR), and built the SOM model based on Sentinel-2 MSI satellite images in the Middle Songnen plain, Heilongjiang Province, China, which demonstrated that the MLSR model provided the best prediction and inversion results. It can be seen that existing scholars have carried out a lot of research based on such methods; the spectral characteristics of SOM were explored, and the SOM inversion models were built, which certified the SOM inversion feasibility based on multi-spectral satellite remote sensing data, and a series of achievements were obtained. However, this method did not take into account the influence of topography, precipitation, and other environmental factors on SOM, so the accuracy of model was not very good and needed to be improved. There are environmental factors, for example topographic factors, which not only affect SOM content and distribution, but also influence the accuracy of SOM remote sensing inversion. Therefore the applicability of the above mentioned method to regions with diverse topographies and environmental conditions becomes challenging.
The second type of method is a combination of spectral data and environmental factors. Auxiliary variables representing environmental characteristics, such as topography, hydrology, and other environmental factors, are included to build the SOM inversion model. For example, Pan et al. (Pan et al., 2022) selected the black soil region of Songnen Plain, Hailun City, Northeast China, as the research area and established a prediction model based on SOM content, spectrum, and topographic characteristics, which demonstrated that the SOM prediction accuracy was significantly improved. Based on Landsat 8 ETM+ and Global Digital Elevation Model (GDEM) data, Hamedani et al. (Hamedani et al., 2022) selected topographic factors such as relative elevation, elevation, mid slope position, and vertical and horizontal orientation as auxiliary data and utilized the regression tree method (Nilashi et al., 2021) to predict the distribution of SOM in the northern mountains of Iran, which revealed that the relative elevation and mid slope position contributed a lot to the SOM prediction model. Compared to the first type of method, this method incorporates topography and other environmental factors into the modeling process, resulting in improved accuracy for SOM remote sensing inversion (Belenok et al., 2023). However, in most existing studies, single topographic factors were introduced according to the single or a few terrains with small scale. In large regions with complex and varied topographic features, such as provinces with diverse topography, topography is one of the main influencing factors of SOM, the SOM content and distribution differ greatly among different topographic features, and the characteristic topographic factors of SOM in different topographic regions may be different, and remains to be studied. The effect of the combination characteristic topographic factors with spectral parameters on improving the accuracy of SOM inversion for different topographic regions remains to be further verified.
Based on the above analysis, without considering topography and other environmental factors, the remote sensing inversion only on spectral data can realize quantitative analysis of regional SOM content, but the accuracy of the analysis needs to be improved. By incorporating both spectral data and topographic factors, the accuracy of SOM analysis was improved; however, most studies only considered single or a few topographies, which was not suitable for large areas with complex topography. In complex and dynamic topographic regions, the characteristic topographic factors of SOM may be different and should be explored in different topographic regions. The combination of characteristic spectra and topographic factors in different topographic regions should improve the accuracy and practicability of regional SOM inversion, which can provide a fresh perspective for large-scale SOM inversion.
Taking Shandong Province in China as the study area, three topographic regions, namely the Western plain region (WPR), Central and southern mountain region (CSMR), Eastern hilly region (EHR) were selected, the SOM spectral characteristics, indices and topographic factors in different topographic regions were analyzed and compared, then the SOM inversion models were built. The effectiveness of combining topographic variables with spectral indices for regional SOM inversion in different topographic regions was also explored. This study aims to achieve high-precision SOM inversion over large areas with complex topography, which can not only enrich the theoretical knowledge of soil quantitative remote sensing inversion, but also provide accurate data support for the investigation of cropland quality, carbon cycle research, and precision agriculture development in large areas.
Shandong Province is located in the east coast of China, the lower reaches of the Yellow River, which is adjacent to the Bohai Sea to the north and the Yellow Sea in the east. The geographical coordinates of the areas are 34°22.9′-38°24.01′N latitude, 114°47.5′-122°42.3′E longitude (Figure 1). The region has a temperate monsoon climate with four distinct seasons: the winter is cold and dry, while the summer is hot and humid.
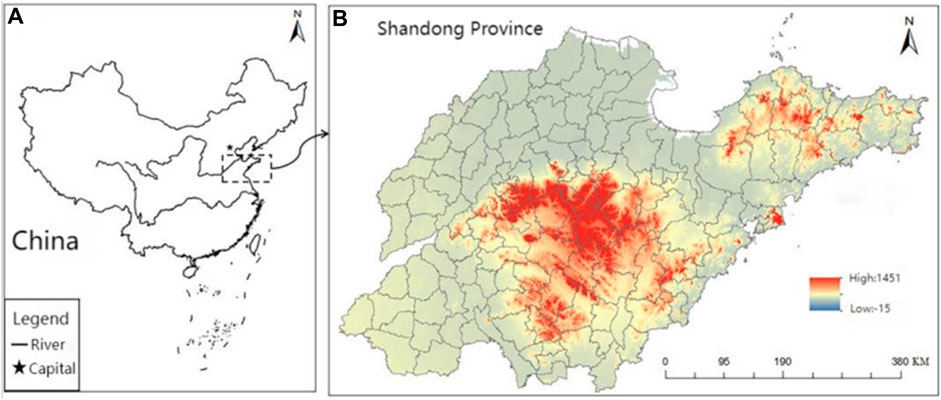
Figure 1. Location of the research area: (A) China; (B) DEM data of Shandong Province.
The main types of landforms in Shandong are plains, mountains, and hills; the central mountains protrude, while the southwest and northwest are low-lying, and the east is hilly and undulating. Among these regions, the first zone is the plain, which accounts for 65.56% of the total area, primarily located in the northwest and southwest of Shandong Province, mostly formed by the alluvial Yellow River, also known as the yellow flood plain; the second zone is the mountainous area, which makes up 14.59% of the area, mainly distributed in the central and southern parts of Shandong; the third zone is the hills, which occupy 15.39% of the total area, mainly found in the eastern part of Shandong and belongs to the tectonic uplift zone. In addition, there are small terrace area in the eastern region, accounting for 4.46% of the total area.
According to the above-mentioned geomorphologic characteristics of Shandong Province, taking the integrity of the administrative divisions into account, the three main topographic regions (Western plain region (WPR), Central and southern mountain region (CSMR), Eastern hilly region (EHR)) were selected to be studied in Shandong Province. Three kinds of major topography (plain, mountain and hills) account for 95.54% of the total area in Shandong Province, so these three districts (WPR, CSMR and EHR) can fully represent the whole Province.
To begin with, the study area was initially divided into different topographic regions based on the main topographic characteristics. Soil samples were then collected in the field, followed by indoor measurement of soil organic matter (SOM) content. Furthermore, Sentinel-2A MSI images and DEM data from the same period were acquired and preprocessed. After that, the study uses several techniques, including the extraction of topographic factors, the selection of sensitive bands for SOM, the building and optimization of SOM’s spectral parameters, and the utilization of characteristic topographic factors. Subsequently, to evaluate the effectiveness of SOM inversion models with topographic factors, the inversion models were built and compared to determine the best inversion models for each topographic region. Finally, the spatial distribution of SOM in the study areas was analyzed. Figure 2 is the methodological flowchart.
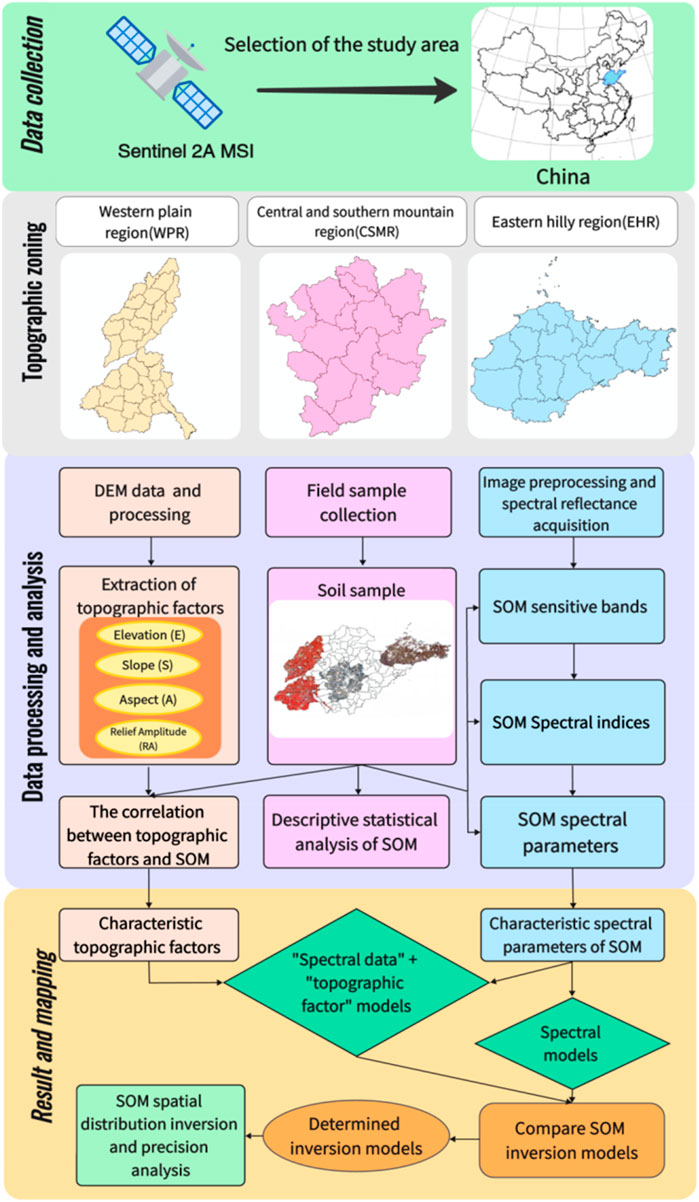
Figure 2. Methodological flowchart.
From mid-September to mid-October in the North China Plain, corn had been harvested, while wheat had been recently sown but had not yet sprouted. As a result, most of the soil surface was left bare. Therefore, the field soil samples were collected from September 20 to 28 in 2017, the geographic coordinates and basic information of the sampling points were recorded through the handheld Global Positioning System (GPS). A total of 288 soil samples (96, 90, 102 respectively in the WPR, CSMR, and EHR) were collected at depths of 0–20 cm (Liao et al., 2013; Jiang et al., 2019; Li et al., 2021; Pusch et al., 2021; Xu et al., 2023) in the three topographic regions (Figure 3). Then, soil samples were stored in separate sealed bags and brought back to the laboratory to remove weeds, stones, and other impurities, soil samples were naturally air dried and sifted through a 2 mm screen. Finally, the content of SOM was determined by potassium dichromate volumetric method.
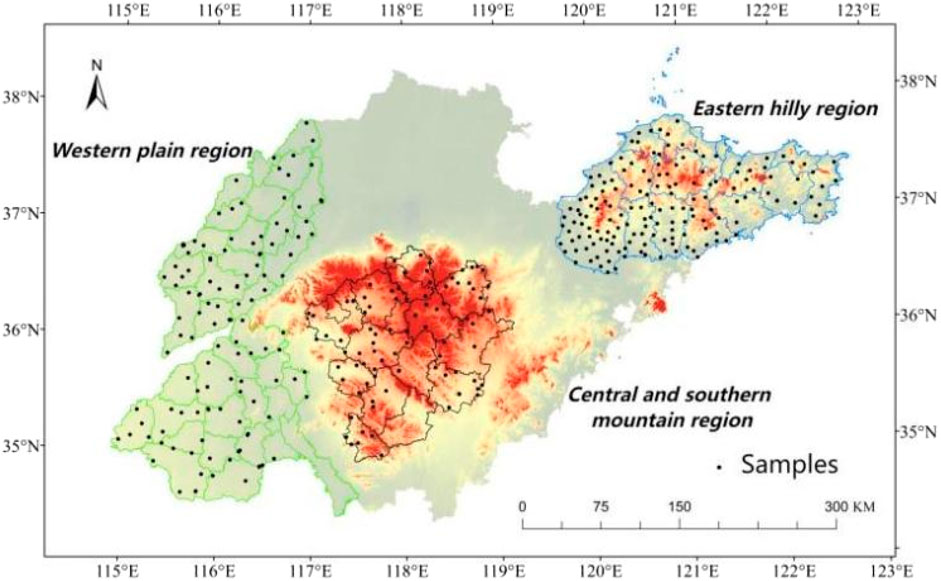
Figure 3. Topographic partition of the study areas with the sample locations.
First, the cloudless Sentinel 2A Multi-Spectral Instrument (MSI) images with 13 spectral bands were acquired on the GEE cloud platform (https://code.earthengine.google.com/). The images of 21 September 2017 are the mains, supplemented by images of similar periods. Second, Sentinel-2A MSI images acquired on GEE cloud platform had been processed radiometric calibration and atmospheric correction, the surface reflectance was extracted. Considering the needs of SOM inversion and the characteristics of the image bands, we resampled to the resolution of 10 m. Finally, the images after band synthesis were mosaicked in ENVI 5.3 software, and the Sentinel-2A MSI image of the study area was obtained by clipping according to the regions of western Shandong, central and eastern Shandong. Then based on Normalized Difference Vegetation Index (NDVI), the cropland in the study area was extracted by supervisory classification method.
The correlations between the SOM content and the spectral reflectance were analyzed on a band-by-band basis, and the bands with absolute values of correlation coefficients greater than 0.52 were selected as the SOM characteristic bands (Hong et al., 2017; Kahaer et al., 2019; Chen et al., 2021; Wang et al., 2022). Additionally, the spectral indices were constructed by various mathematical combinations of the characteristic band reflectance values, such as difference, square root and normalized index based on the formulas shown in Table 1. In each topographic region, correlation analysis between the SOM content and the spectral indices was then performed, and as with the selection of characteristic bands, the characteristic spectral parameters associated with SOM were selected and analyzed in different topographic areas.
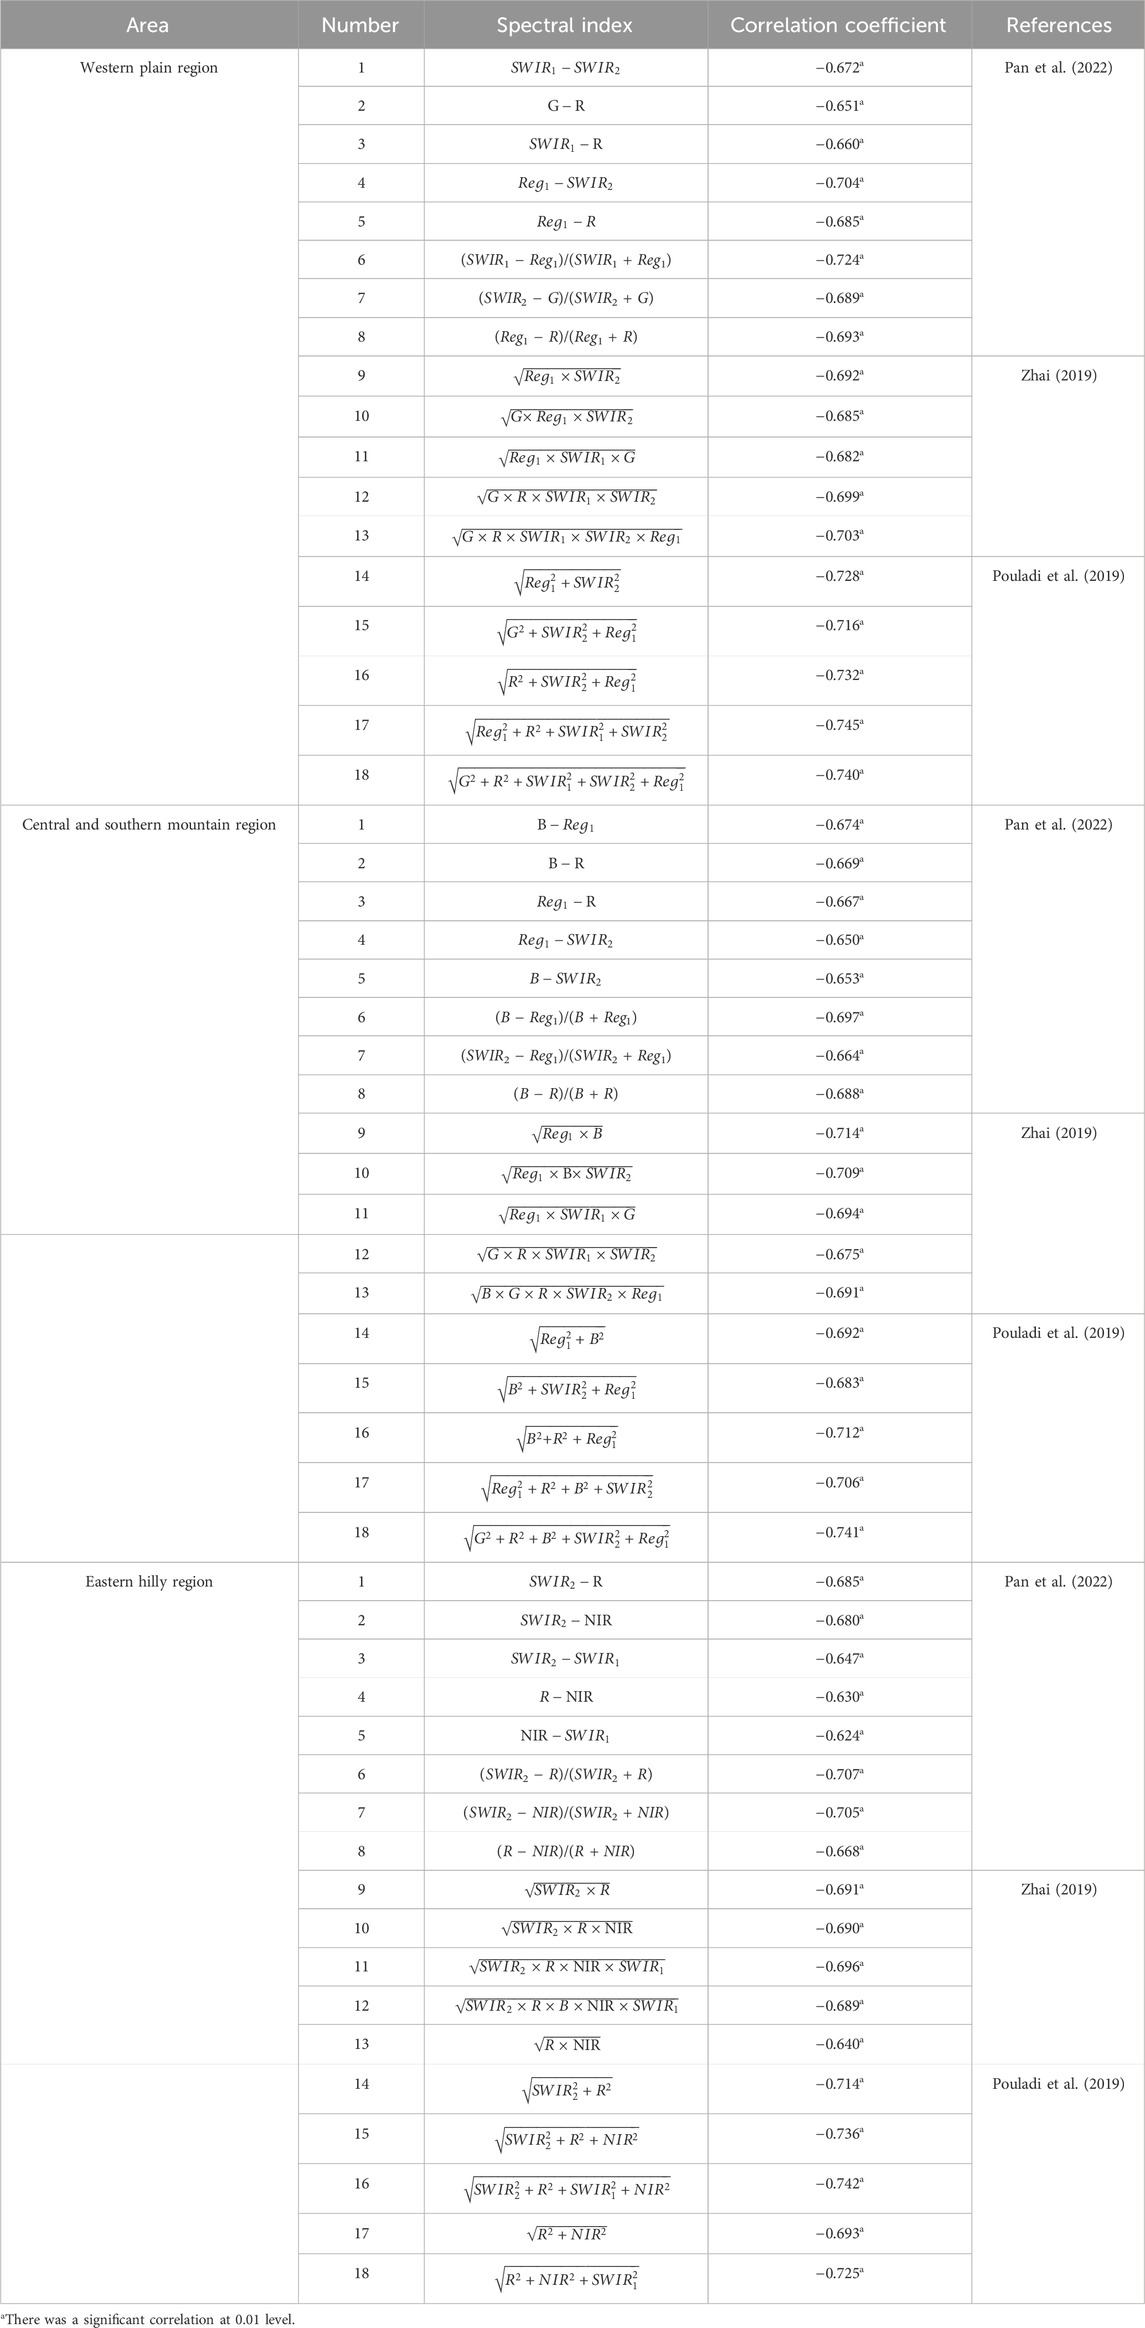
Table 1. Correlation between spectral indices and SOM in three topographic regions.
The Digital Elevation Model (DEM) used was derived from the ASTER GDEM, which is a global 1-arcsec elevation dataset developed jointly by the METI (Ministry of Economy, Trade, and Industry) of Japan and the NASA, and generated through image matching for the optical images collected by the ASTER imaging sensors. The DEM data was preprocessed according to the cropland range in the study area, and then resampled to a resolution of 10 m. Based on the relevant studies (Piccini et al., 2020; Mallick et al., 2022; Medeiros et al., 2022) and the actual situation of Shandong Province, the common topographic factors including Elevation (E), Slope (S), Aspect (A) and Relief Amplitude (RA) were calculated from the DEM data in ArcGIS 10.2. The correlation between topographic factors and SOM in each was respectively analyzed and compared in each topographic region.
Initially, the samples were grouped by the SOM contents in each topographic region, two-thirds of the samples were selected for the calibration set, and the remaining samples were used as the validation set. Secondly, respectively based on spectral parameters, “spectral parameters + topographic factors”, Multiple linear stepwise regression (MLSR) was employed to build SOM inversion models for each topographic region, where the significant level of variance of the variables was established at 0.05 as the determination and exclusion levels for the models in SPSS software. Thirdly, in order to assess the effectiveness of SOM inversion with topographic factors, the kinds of models based on “spectral parameters + topographic factors” were compared with the spectral models only on the spectral parameter. The model accuracy was evaluated by determination coefficient (R2), Root Mean Square Error (RMSE) and Relative Prediction Deviation (RPD) (Chen et al., 2019; Ma et al., 2020). Finally, the model with the highest R2, RPD, and the lowest RMSE was determined the best SOM inversion model for different topographic areas.
The whole province was zoned as Western plain region, Central and southern mountain region and Eastern hilly region according to the topography. Based on the best SOM inversion model and the Sentinel-2A MSI imagery of different topographic areas, by applying the Band Math tool in the ENVI 5.3 software, the SOM inversion map of each topographic areas and the whole province was obtained, where SOM content was classified into 6 grades using the decision tree approach in ENVI Classic. Feature selection and decision tree generation was carried out according to the SOM classification criteria (Wang et al., 2016; Guo et al., 2021) and the actural situation of the study area. Then the final SOM grade distribution map was generated and compared with the classification of samples to verify the SOM analytical precision.
Western plain region (WPR) is located in the Yellow River basin, a portion of the North China Plain. Geomorphologically, it consists of Yellow River Flood plains and piedmont inclined plains, the landscape is primarily flat and the rivers mostly flow eastward. Because of the favorable irrigation conditions and the natural advantage of flat terrain, the cropland has higher nutrient contents.
Central and southern mountain region (CSMR) is characterized as the highest and most mountainous area in Shandong province. It is situated to the west of the Yishu Great Fracture Zone, south of both the Yellow River and Xiaoqing River, and east of the Beijing-Hangzhou Grand Canal. Due to its northern location, it exhibits a steep north slope contrasted with a gradual southern slope. Beyond the middle and lower mountains lies a gradually descending terrain, forming a flat “square mountain” topography with elevations ranging from 500 to 600 m.
Eastern hilly region (EHR) is located in the eastern region of the Shuhe River and Weihe Valley, encompassed by the sea on three sides. Apart from Laoshan, Kunyu Mountain, Ai Mountain, and a few other mountains that stand above 700 m above sea level, most of the undulating hills range between 200 and 300 m above sea level with gentle slopes and wide valleys. The soil layer is thick, while the climate remains warm and humid throughout the year.
Based on statistical principle, descriptive statistics were conducted on soil samples collected in the three major topographic regions, as shown in Table 2. It is apparent that the statistical distribution features of both the calibration set and validation set samples within each region exhibit similarities with the overall sample set. In comparison, as the primary grain-producing area of Shandong Province, the WPR demonstrates a relatively high SOM content, which is due to the accumulation of rich SOM through long-term reasonable cultivation. Conversely, the overall level of SOM in the CSMR presents a low overall SOM level due to its irregular topography, which includes higher altitudes and slopes susceptible to soil erosion and nutrient loss. In the EHR located along the coast, some areas are affected by soil salinization, however, the overall SOM level remains within normal ranges.
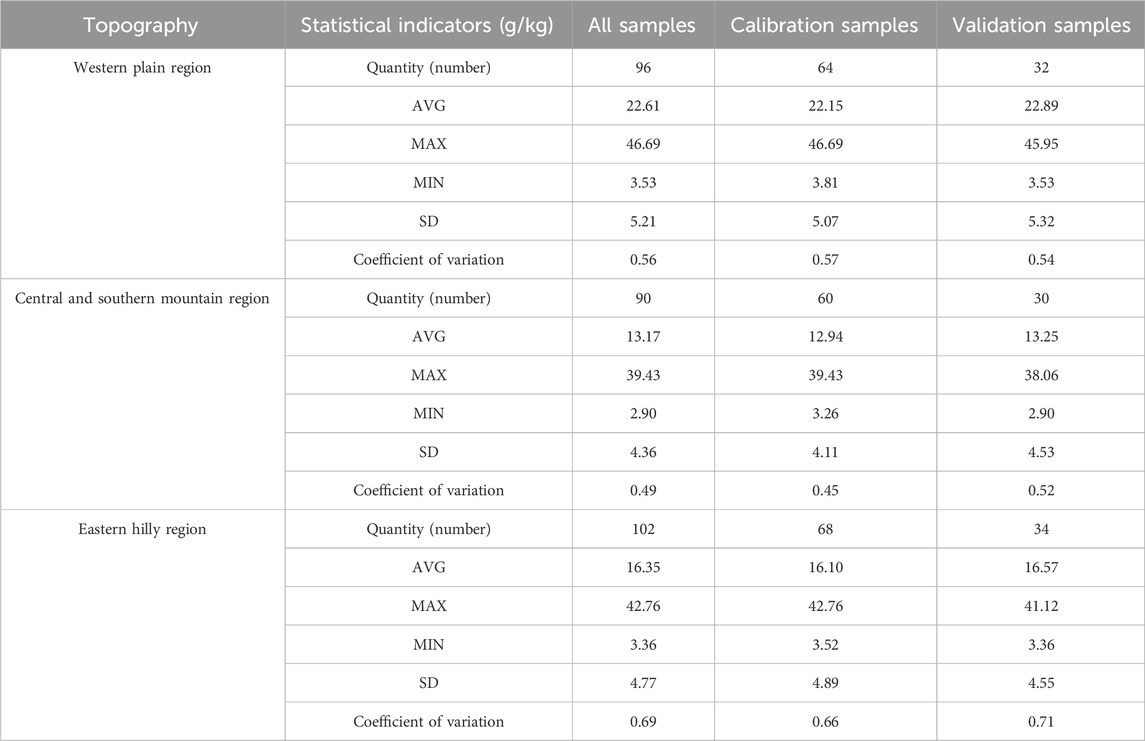
Table 2. SOM descriptive statistical analysis in three topographic regions.
The correlation coefficients between SOM content and spectral reflectance of Sentinel-2A MSI image in the three topographic regions are shown in Figure 4. The trend of the correlation curves of three topographic regions were consistent in the most band range, which ranged from −0.102 to −0.683, indicating a negative correlation. These bands that the absolute values of correlation coefficients were greater than 0.52, were selected as sensitive bands to participate in the construction of spectral indices.
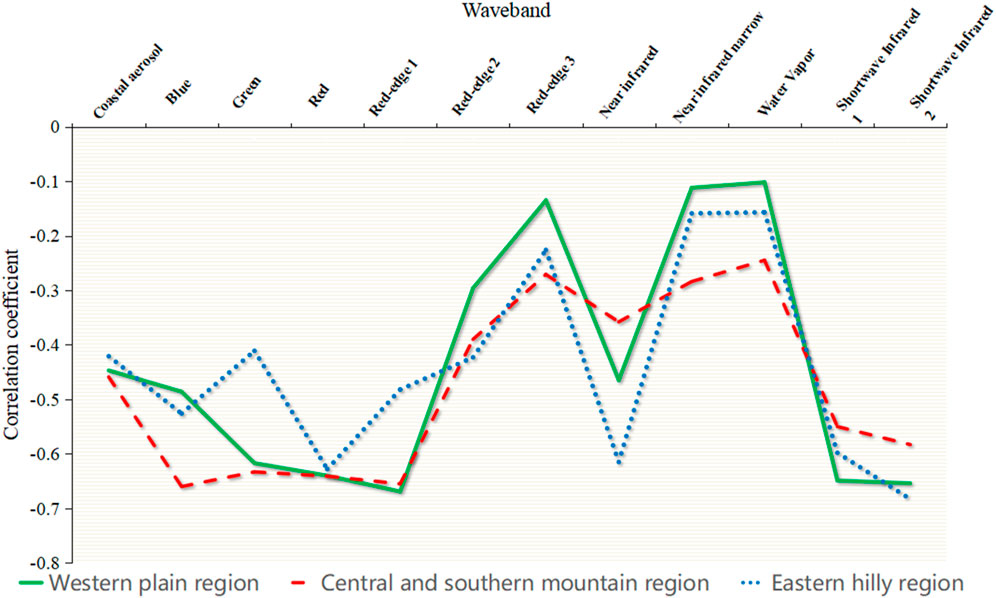
Figure 4. Correlation between SOM and spectral reflectance in three topographic regions.
The SOM sensitive bands identified in the WPR were Red-edge1 (Reg1), Shortwave Infrared 2 (SWIR2), Shortwave Infrared 1 (SWIR1), (Red) (R), and Green (G), with respective correlations of −0.669, −0.654, −0.649, −0.640, and −0.617. In the CSMR, there were B, Reg1, R, G, SWIR2, and SWIR1, with correlation coefficients respectively of −0.660, −0.655, −0.633, −0.641, −0.583, and −0.550. In the EHR, there were SWIR2, R, NIR, SWIR1, and B, with correlation coefficients of −0.683, −0.628, −0.615, −0.598, and −0.526, respectively. It was observed that the spectral responses of SOM in different topographic regions were relatively consistent with some partial differences, R and SWIR were the common sensitive bands in the three topographic regions.
Based on the selected sensitive bands, the spectral reflectance was mathematically calculated to construct the spectral indices, and the correlation between the spectral indices and SOM was from −0.624 to −0.745, which indicated that the correlation was improved effectively compared to the single band. The spectral indices with good correlation were
The correlation coefficients between topographic factors and SOM are presented in Table 3. In the WPR, the correlation was not significant, with absolute values below 0.3 observed, indicating the absence of distinct characteristic topographic factors. Notably, in addition to A, the topographic factors E, RA, and S displayed a good correlation to SOM with absolute values of correlation coefficients above 0.33 in the CSMR. In the EHR, the correlation coefficient of RA reached the highest value of −0.395, followed by E (−0.327), S and A were less than 0.3, which could be seen that the E and RA had a strong correlation to SOM.
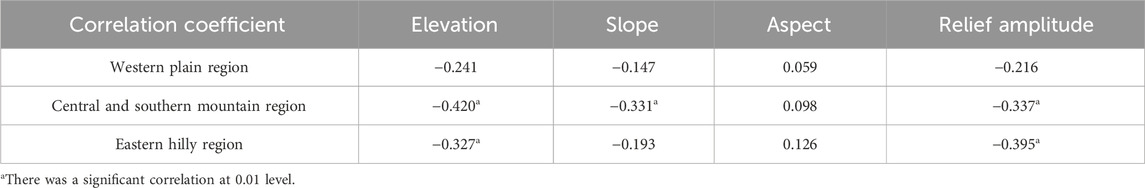
Table 3. Correlation between topographic factors and SOM in three topographic regions.
From Table 4, the SOM characteristic spectral parameters were
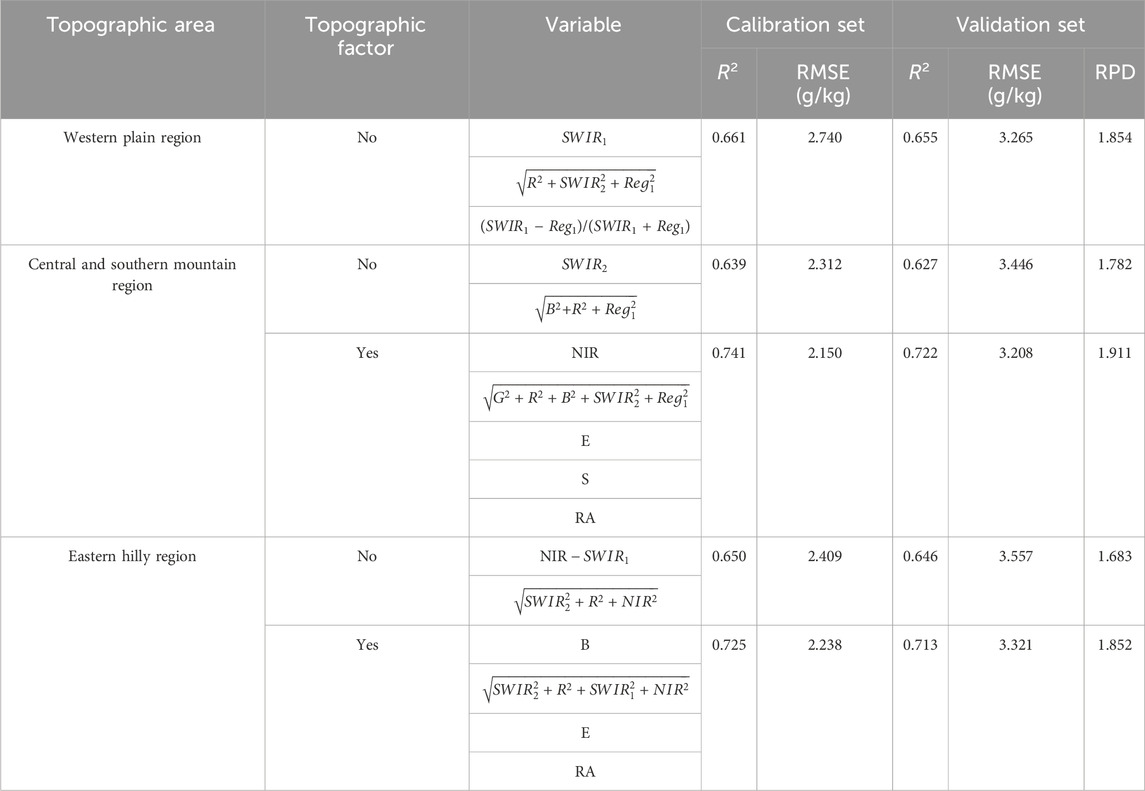
Table 4. SOM inversion models of three topographic regions.
As for the characteristic topographic factor of SOM, none was in the WPR, E, RA and S were in the CSMR, E and RA were in the EHR.
The SOM inversion models were built and compared, as presented in Table 4. Modeling only based on spectral parameters, the accuracy of SOM inversion models in the three topographic areas was very similar, and the calibration set R2 was better than 0.639, the validation set R2 was more than 0.627, and the RPD was greater than 1.683, all of which can be used for the spatial distribution analysis of SOM in a single topographic region. It could be seen that the modeling accuracy of the plain area was slightly higher.
After incorporating the topographic factor into the modeling process, in the CSMR, the calibration R2 increased by 0.102, and RMSE decreased by 0.162 g/kg, the validation R2 improved by 0.095, RMSE decreased by 0.238 g/kg, and RPD increased by 0.129. In the EHR, the calibration R2 improved by 0.075, RMSE decreased by 0.171 g/kg, the validation set demonstrated an improvement of 0.067 in the R2, a decrease of 0.236 g/kg in the RMSE, and an increase of 0.169 in the RPD. The results indeed confirm that the introduction of topographic factors effectively improves the inversion accuracy of SOM in both the CSMR and EHR. Utilizing the “spectral parameter + topographic factor” approach, the calibration R2 of the SOM inversion model in both the CSMR and EHR exceeds 0.725, the validation R2 surpasses 0.713, and the RPD value exceeds 1.852. The result demonstrates an efficient improvement in the models’ accuracy.
In summary, the model based solely on spectral parameters is determined to be the SOM inversion model in the WPR, the spectral model in combination with E, RA and S is in the CSMR, and the spectral model in combination with E and RA is in the EHR.
Based on the determined models, the inversion values of SOM in the three major topographic regions show a good linear relationship with the measured values in Figure 5. The scatter diagram shows that most of the soil samples were close to the 1:1 line., which indicates that SOM can be predicted using the determined model in these topographic areas.
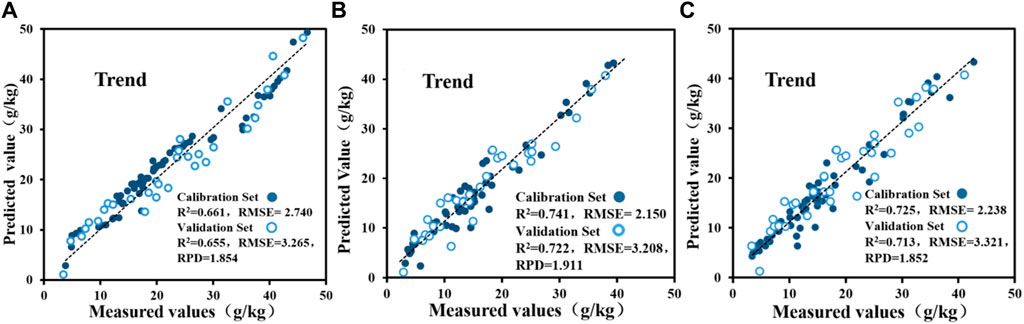
Figure 5. The scatter diagram of the SOM inversion value and measured value based on the determined model in the WPR (A), the CSMR (B) and the EHR (C).
SOM inversion was conducted in the three topographic regions based on the determined model, the SOM inversion maps and statistical analysis are shown in Figure 6 and Table 5, which presents that the inversion results are in good agreement with the actual situation.
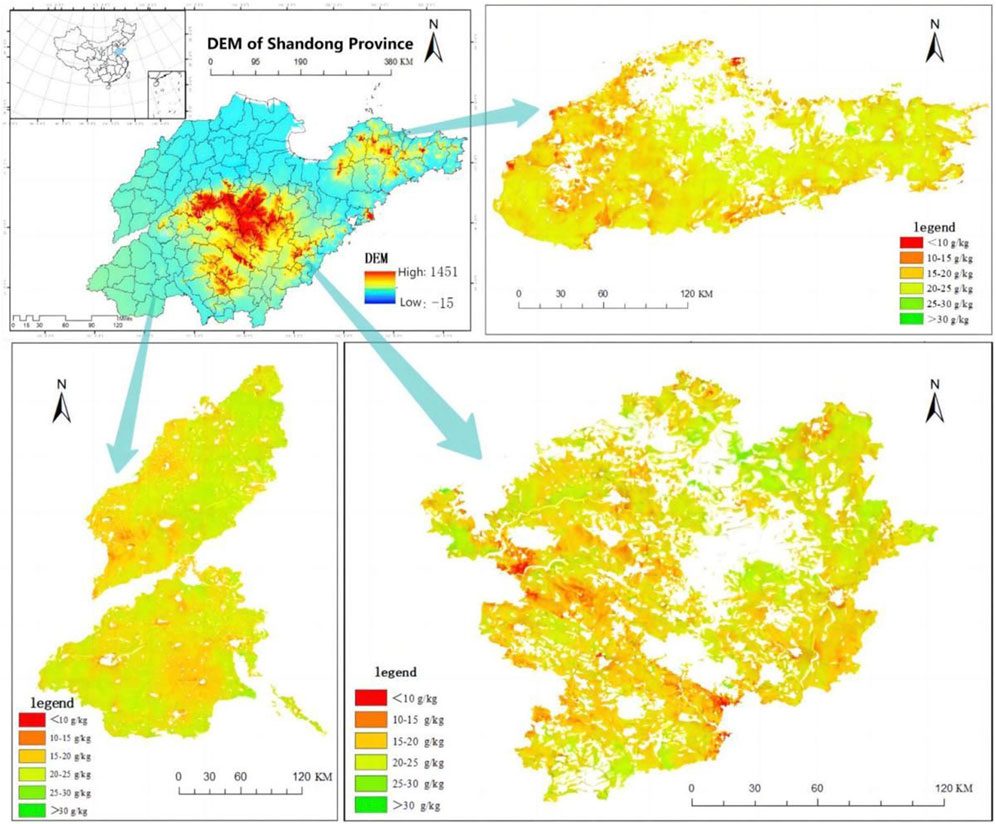
Figure 6. DEM data of Shandong Province (A); Inversion map of SOM content in the EHR (B); the WPR (C) and the CSMR (D).
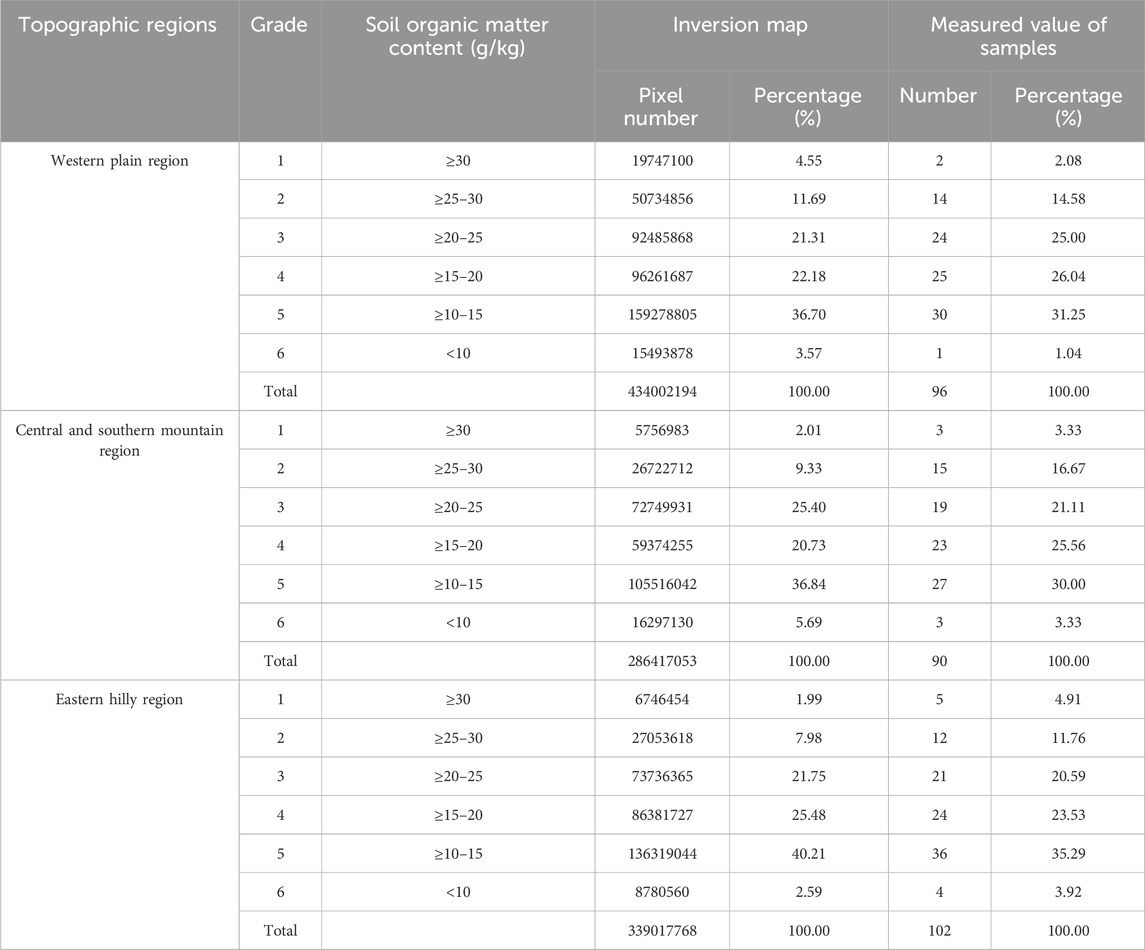
Table 5. Statistical analysis of SOM grades in three topographic regions.
In the WPR, the SOM inversion content ranged from 1.24 to 56.37 g/kg, with an average value of 22.31 g/kg. In terms of spatial distribution, in the southwest SOM content was higher around and lower in the middle, while in the northwest it was higher in the east, but lower in the west. Additionally, the SOM content was high near the Yellow River and low near the urban. Overall, the S, A and RA in this area were generally low, the overall SOM content was high and the transition was gentle.
In the CSMR, the range of SOM inversion content was between 0.39 and 49.91 g/kg, with an average value of 16.17 g/kg. SOM content exhibited a geographical gradient, being relatively lower in the west and south, and higher in the north and northeast. It could be seen that the SOM content was comparatively low, with a dispersed distribution of different levels.
In the EHR, the SOM content ranged from 1.13 to 50.32 g/kg, with an average value of 18.25 g/kg. The SOM content in the western inland and coastal areas was low, while relatively high in the central and eastern inland areas, and the overall SOM content was general.
From Figure 7, in Shandong Province, the SOM content ranged from 0.39 to 56.37 g/kg, the inversion SOM contents are primarily concentrated in grades 3 to 5 with the SOM range of 10–25 g/kg. The area exceeding 25 g/kg accounted for 14.82%, the area between 10 and 25 g/kg accounted for 80.63%, and the area below 10 g/kg accounted for only 4.55%. The SOM content was very high in the western plain, general in the eastern hills, and relatively low in the central mountains, which was consistent with the previous results.
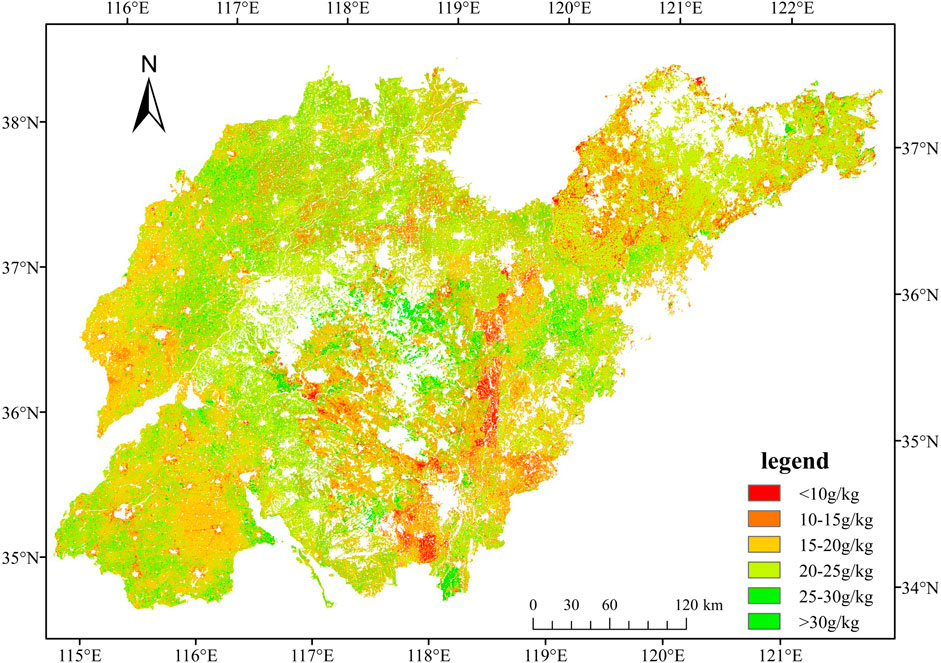
Figure 7. Inversion map of SOM content in Shandong Province.
The accuracy of the SOM inversion was evaluated and presented in Table 5. For the differences of the each grade proportion in inversion maps and in the samples’ measured values, 2.47%, 2.89%, 1.17%, 3.86%, 5.45%, and 2.53% were in the WPR; 1.32%, 7.34%, 4.29%, 4.83%, 6.84%, and 2.36% were in the CSMR; 2.92%, 3.78%, 1.16%, 1.95%, 4.92%, and 1.33% were in the EHR, respectively. In general, the inversion results of the three topographic regions align with the field sampling findings, with discrepancies for most grades under 5%, it could be seen that these are consistent with the samples point measurements. Therefore, the determined model in combination spectra and topographic factors can be effectively used for the spatial distribution of croplands SOM inversion in three topographic regions.
In addition, the inversion SOM contents are primarily concentrated in grades 3 to 5 with the SOM range of 10–25 g/kg. In the WPR, the area exceeding 25 g/kg accounted for 16.24%, the area between 10 and 25 g/kg accounted for 80.19%, and the area below 10 g/kg accounted for 3.57%. In the CSMR, the areas of above-mentioned three levels accounted for 11.34%, 82.97%, and 5.69% respectively. In the EHR, the areas of above-mentioned three levels accounted for 9.97%, 87.44%, and 2.59% respectively. Therefore, the inversion results reveal higher SOM content in the WPR, lower in the CSMR, and general in the EHR, which is consistent with reality.
(1) The spatial distribution of SOM is closely related to environmental factors, and other studies have shown that E, RA and S are significantly negative correlated with SOM (Li et al., 2016; Hu et al., 2021; Lv et al., 2022), which is consistent with the results of this study. The reason is that the thermal conditions, precipitation, and decomposition rate change with the increase of altitude, which contributes to different impacts on SOM accumulation (Li et al., 2019). In addition, S influences SOM distribution by regulating soil erosion intensity (Nabiollahi et al., 2018; Zhang et al., 2020). RA can result in the accumulation and drainage of water in gully and hillside areas, (Takoutsing et al., 2018). Moreover, some studies have also demonstrated that distinct topographies have a significant impact on SOM content and its distribution in large-scale regions with diverse topographies (Sigua and Coleman, 2010; Chen et al., 2016; Bai and Zhou, 2020; Kumar et al., 2023). Therefore this study employed regional inversion to distinguish the different topographies of plains, mountains, and hills, and topographic factors were introduced to enhance the accuracy of the SOM prediction model. The results indicate that the characteristic topographic factors differ across various topographic regions. In flat or plain areas, topographic differences are minimal, as are the variations in landscape environmental factors, such as vegetation, consequently, topography has a negligible influence on the spatial variability of SOM. However, E, RA and S exhibit significant disparities in mountainous regions, and S is slow and the terrain is rugged in hilly areas. Therefore, no obvious characteristic topographic factor of SOM is observed in the WPR, while which are E, RA, S in the CSMR and are E, RA in the EHR.
(2) The complex topographic conditions and strong soil heterogeneity in large-scale areas significantly influence the content and spatial distribution of surface SOM (Luo et al., 2012). It was found that there were significant differences in SOM content among plain, mountain and hilly terrain in Shandong Province, with the highest in the WPR, lowest in the CSMR and general in the EHR. The soil spectral reflectance can be used to characterize the SOM to some extent. The characteristic spectral parameters of SOM exhibit distinct differences in different topographic regions, which are
(3) The field sampling took place from mid-September to mid-October, a period strategically chosen for its agricultural significance. During this time, the corn harvest had concluded, leaving the fields predominantly bare with minimal ground cover. Concurrently, wheat had been recently sown, but had not yet sprouted. This specific timing provided an ideal condition for the inversion of SOM, as exposed soil surface facilitated more accurate and effective sampling. Hence, the study did not take into account vegetation types and its coverage. However, Sha et al. revealed that a high vegetation cover significantly influenced soil reflectance, which suggested that SOM inversion studies must consider the influence of vegetation on soil reflectance and apply appropriate corrections (Sha et al., 2019). Therefore, the applicability of these findings to SOM inversion in the areas with higher vegetation cover needs to be explored in future.
Taking Sentinel 2A MSI image as data source, this paper selected three major topographic regions in Shandong Province. According to topographic conditions, four topographic factors, E, S, A RA, were introduced to improve the accuracy of SOM remote sensing inversion. The SOM spectral characteristics, spectral indices and topographic factors of different topographic regions were compared and analyzed, and the characteristic spectral parameters and topographic factors were screened to construct SOM remote sensing inversion models. The results showed that the correlation between topographic factors and SOM was not obvious in the WPR, so it was not necessary to introduce topographic factors to participate in SOM inversion. Through comparative analysis, the introduction of topographic factors had the best effect on the SOM prediction and mapping in the CSMR, followed by the EHR, which could effectively enhance the accuracy of regional SOM remote sensing inversion. Therefore, building the SOM inversion model combined spectral parameters with topographic factors can not only effectively improve the SOM inversion accuracy in different topographic regions, but also provide a new perspective for predicting and mapping SOM in large-scale regions. The research findings can provides valuable data and decision-making support for applications such as sustainable land use and intelligent agriculture.
The original contributions presented in the study are included in the article/supplementary material, further inquiries can be directed to the corresponding author.
JZ: Conceptualization, Investigation, Methodology, Validation, Writing–original draft, Writing–review and editing. YW: Methodology, Software, Writing–review and editing. YZ: Supervision, Writing–review and editing. ZL: Writing–review and editing. YG: Writing–review and editing. HC: Funding acquisition, Project administration, Supervision, Writing–review and editing. PL: Writing–review and editing. QS: Writing–review and editing.
The author(s) declare that financial support was received for the research, authorship, and/or publication of this article. This research was supported by the Natural Science Foundation of Shandong Province of China (grant number ZR2023MD033 and ZR2022MD026), the National Key Research and Development Program Project (grant number 2023YFD2303304) and the Key Research and Development Project of Shandong Province (grant number LJNY202103).
Thanks to the ESA for support with the Sentinel-2A MSI image.
Authors YG and QS were employed by Ltd.
The remaining authors declare that the research was conducted in the absence of any commercial or financial relationships that could be construed as a potential conflict of interest.
All claims expressed in this article are solely those of the authors and do not necessarily represent those of their affiliated organizations, or those of the publisher, the editors and the reviewers. Any product that may be evaluated in this article, or claim that may be made by its manufacturer, is not guaranteed or endorsed by the publisher.
Bai, Y. X., and Zhou, Y. C. (2020). The main factors controlling spatial variability of soil organic carbon in a small karst watershed, Guizhou Province, China. Geoderma 357, 113938. doi:10.1016/j.geoderma.2019.113938
Belenok, V., Hebryn-Baidy, L., Bielousova, N., Zavarika, H., Kryachok, S., Liashenko, D., et al. (2023). Application of remote sensing methods for statistical estimation of organic matter in soils. Earth Sci. Res. J. 27 (3), 299–313. doi:10.15446/esrj.v27n3.100324
Chen, D., Chang, N. J., Xiao, J. F., Zhou, Q. B., and Wu, W. B. (2019). Mapping dynamics of soil organic matter in croplands with MODIS data and machine learning algorithms. Sci. Total Environ. 669, 844–855. doi:10.1016/j.scitotenv.2019.03.151
Chen, H. Y., Ma, Y., Zhu, A. X., Wang, Z. R., Zhao, G. X., and Wei, Y. A. (2021). Soil salinity inversion based on differentiated fusion of satellite image and ground spectra. Int. J. Appl. Earth Observation Geoinformation 101, 102360. doi:10.1016/j.jag.2021.102360
Chen, H. Y., Zhao, G. X., Li, Y. H., Wang, D. Y., and Ma, Y. (2019). Monitoring the seasonal dynamics of soil salinization in the Yellow River delta of China using Landsat data. Nat. Hazards Earth Syst. Sci. 19 (7), 1499–1508. doi:10.5194/nhess-19-1499-2019
Chen, L. F., He, Z. B., Du, J., Yang, J. J., and Zhu, X. (2016). Patterns and environmental controls of soil organic carbon and total nitrogen in alpine ecosystems of northwestern China. Catena 137, 37–43. doi:10.1016/j.catena.2015.08.017
Dindaroglu, T., Kiliç, M., Günal, E., Gündogan, R., Akay, A. E., and Seleiman, M. (2022). Multispectral UAV and satellite images for digital soil modeling with gradient descent boosting and artificial neural network. Earth Sci. Inf. 15 (4), 2239–2263. doi:10.1007/s12145-022-00876-7
Dou, X., Wang, X., Liu, H. J., Zhang, X. L., Meng, L. H., Pan, Y., et al. (2019). Prediction of soil organic matter using multi-temporal satellite images in the Songnen Plain, China. Geoderma 356, 113896. doi:10.1016/j.geoderma.2019.113896
Gao, L. L., Zhu, X. C., Han, Z. Y., Wang, L., Zhao, G. X., and Jiang, Y. M. (2019). Spectroscopy-based soil organic matter estimation in Brown forest soil areas of the Shandong peninsula, China. Pedosphere 29 (6), 810–818. doi:10.1016/s1002-0160(17)60485-5
Gu, X. H., Wang, Y. C., Sun, Q., Yang, G. J., and Zhang, C. (2019). Hyperspectral inversion of soil organic matter content in cultivated land based on wavelet transform. Comput. Electron. Agric. 167, 105053. doi:10.1016/j.compag.2019.105053
Guo, L., Fu, P., Shi, T. Z., Chen, Y. Y., Zeng, C., Zhang, H. T., et al. (2021). Exploring influence factors in mapping soil organic carbon on low-relief agricultural lands using time series of remote sensing data. Soil and Tillage Res. 210, 104982. doi:10.1016/j.still.2021.104982
Hamedani, K. S., Tavili, A., Javadi, S. A., and Jafari, M. (2022). THE IMPACT OF TERRAIN AND SPECTRAL VARIABLES IN ESTIMATING SOIL ORGANIC MATTER USING REMOTE SENSING IN SEMI-ARID MOUNTAINOUS AREAS. Environ. Eng. Manag. J. 21 (4), 549–558. doi:10.30638/eemj.2022.051
Hong, Y. S., Zhu, Y. X., Su, X. P., Zhu, Q., Zhou, Y., and Yu, L. (2017). Estimation of soil organic matter content using hyperspectral techniques combined with normalized difference spectral index. Spectrosc. Spectr. Analysis 37 (11), 3537–3542. doi:10.3964/j.issn.1000-0593(2017)11-3537-06
Hu, W., Shen, Q. S., Zhai, X. Y., Du, S. L., and Zhang, X. Y. (2021). Impact of environmental factors on the spatiotemporal variability of soil organic matter: a case study in a typical small Mollisol watershed of Northeast China. J. Soils Sediments 21 (2), 736–747. doi:10.1007/s11368-020-02863-1
Jiang, G. P., Grafton, M., Pearson, D., Bretherton, M., and Holmes, A. (2019). Integration of precision farming data and spatial statistical modelling to interpret field-scale maize productivity. Agriculture-Basel 9 (11), 237. doi:10.3390/agriculture9110237
Kahaer, Y., Sawut, R., Kasim, N., Tashpolati, N., Zhang, F., Abliz, A., et al. (2019). Estimation of heavy metal contents in soil around open pit coal mine area based on optimized spectral index. Spectrosc. Spectr. Analysis 39 (8), 2486–2494. doi:10.3964/j.issn.1000-0593(2019)08-2486-09
Kumar, P., Sajjad, H., Tripathy, B. R., Ahmed, R., and Mandal, V. P. (2018). Prediction of spatial soil organic carbon distribution using Sentinel-2A and field inventory data in Sariska Tiger Reserve. Nat. Hazards 90 (2), 693–704. doi:10.1007/s11069-017-3062-5
Kumar, S., Murugan, N., Raj, A. D., and Kalambukattu, J. G. (2023). Hillslope elements and soil-landscape analysis in Himalayas for characterizing soil quality parameters using digital terrain model and remote-sensing data. Environ. Earth Sci. 82 (20), 469. doi:10.1007/s12665-023-11166-w
Li, C., Xu, Y. L., Liu, Z. G., Tao, S. L., Li, F. R., and Fang, J. Y. (2016). Estimation of forest topsoil properties using airborne LiDAR-derived intensity and topographic factors. Remote Sens. 8 (7), 561. doi:10.3390/rs8070561
Li, X. H., Ding, J. L., Liu, J., Ge, X. Y., and Zhang, J. Y. (2021). Digital mapping of soil organic carbon using sentinel series data: a case study of the ebinur lake watershed in xinjiang. Remote Sens. 13 (4), 769. doi:10.3390/rs13040769
Li, X. P., Zhang, F., and Wang, X. P. (2019). Study on differential-based multispectral modeling of soil organic matter in ebinur lake wetland. Spectrosc. Spectr. Analysis 39 (2), 535–542. doi:10.3964/j.issn.1000-0593(2019)02-0535-08
Li, Y., Hu, J. M., Han, X., Li, Y. X., Li, Y. W., He, B. Y., et al. (2019). Effects of past land use on soil organic carbon changes after dam construction. Sci. Total Environ. 686, 838–846. doi:10.1016/j.scitotenv.2019.06.030
Liao, K. H., Xu, S. H., Wu, J. C., and Zhu, Q. (2013). Spatial estimation of surface soil texture using remote sensing data. Soil Sci. Plant Nutr. 59 (4), 488–500. doi:10.1080/00380768.2013.802643
Liu, P., Lee, H. K., and Casazza, M. (2023). Editorial: methods and applications in environmental informatics and remote sensing. Front. Environ. Sci. 11. doi:10.3389/fenvs.2023.1255010
Luo, C., Wang, Y. A., Zhang, X. L., Zhang, W. Q., and Liu, H. J. (2022). Spatial prediction of soil organic matter content using multiyear synthetic images and partitioning algorithms. Catena 211, 106023. doi:10.1016/j.catena.2022.106023
Luo, C., Zhang, X. L., Wang, Y. H., Men, Z. B., and Liu, H. J. (2022). Regional soil organic matter mapping models based on the optimal time window, feature selection algorithm and Google Earth Engine. Soil and Tillage Res. 219, 105325. doi:10.1016/j.still.2022.105325
Luo, Y. Y., Liu, T. X., Wang, X. X., and Duan, L. M. (2012). Influences of landform as a confounding variable on SOM-NDVI association in semiarid Ordos Plateau. J. Arid Land 4 (4), 450–456. doi:10.3724/sp.J.1227.2012.00450
Lv, X. R., Jia, G. D., Yu, X. X., and Niu, L. L. (2022). Vegetation and topographic factors affecting SOM, SOC, and N contents in a mountainous watershed in north China. Forests 13 (5), 742. doi:10.3390/f13050742
Ma, T. Q., Zhang, D. H., Li, X. S., Huang, Y., Zhang, L. F., Zhu, Z. C., et al. (2023). Hyperspectral remote sensing technology for water quality monitoring: knowledge graph analysis and Frontier trend. Front. Environ. Sci. 11. doi:10.3389/fenvs.2023.1133325
Ma, Y., Chen, H. Y., Zhao, G. X., Wang, Z. R., and Wang, D. Y. (2020). Spectral index fusion for salinized soil salinity inversion using sentinel-2A and UAV images in a coastal area. Ieee Access 8, 159595–159608. doi:10.1109/access.2020.3020325
Mallick, J., Ahmed, M., Alqadhi, S. D., Falqi, I. I., Parayangat, M., Singh, C. K., et al. (2022). Spatial stochastic model for predicting soil organic matter using remote sensing data. Geocarto Int. 37 (2), 413–444. doi:10.1080/10106049.2020.1720314
Medeiros, S. C., Bobinsky, J. S., and Abdelwahab, K. (2022). Locality of topographic ground truth data for salt marsh lidar DEM elevation bias mitigation. Ieee J. Sel. Top. Appl. Earth Observations Remote Sens. 15, 5766–5775. doi:10.1109/jstars.2022.3189226
Nabiollahi, K., Golmohamadi, F., Taghizadeh-Mehrjardi, R., Kerry, R., and Davari, M. (2018). Assessing the effects of slope gradient and land use change on soil quality degradation through digital mapping of soil quality indices and soil loss rate. Geoderma 318, 16–28. doi:10.1016/j.geoderma.2017.12.024
Nilashi, M., Asadi, S., Abumalloh, R. A., Samad, S., Ghabban, F., Supriyanto, E., et al. (2021). Sustainability performance assessment using self-organizing maps (SOM) and classification and ensembles of regression trees (CART). Sustainability 13 (7), 3870. doi:10.3390/su13073870
Pan, Y., Zhang, X. L., Liu, H. J., Wu, D. Q., Dou, X., Xu, M. Y., et al. (2022). Remote sensing inversion of soil organic matter by using the subregion method at the field scale. Precis. Agric. 23 (5), 1813–1835. doi:10.1007/s11119-022-09914-2
Piccini, C., Francaviglia, R., and Marchetti, A. (2020). Predicted maps for soil organic matter evaluation: the case of abruzzo region (Italy). Land 9 (10), 349. doi:10.3390/land9100349
Pouladi, N., Moller, A. B., Tabatabai, S., and Greve, M. H. (2019). Mapping soil organic matter contents at field level with Cubist, Random Forest and kriging. Geoderma 342, 85–92. doi:10.1016/j.geoderma.2019.02.019
Pusch, M., Oliveira, A. L. G., Fontenelli, J. V., and do Amaral, L. R. (2021). SOIL PROPERTIES MAPPING USING PROXIMAL AND REMOTE SENSING AS COVARIATE. Eng. Agric. 41 (6), 634–642. doi:10.1590/1809-4430-Eng.Agric.v41n6p634-642/2021
Rajabi, R., Zehtabian, A., Singh, K. D., Tabatabaeenejad, A., Ghamisi, P., and Homayouni, S. (2024). Editorial: hyperspectral imaging in environmental monitoring and analysis. Front. Environ. Sci. 11. doi:10.3389/fenvs.2023.1353447
Sha, Z. Y., Wang, Y. W., Bai, Y. F., Zhao, Y. J., Jin, H., Na, Y., et al. (2019). Comparison of leaf area index inversion for grassland vegetation through remotely sensed spectra by unmanned aerial vehicle and field-based spectroradiometer. J. Plant Ecol. 12 (3), 395–408. doi:10.1093/jpe/rty036
Sigua, G. C., and Coleman, S. W. (2010). Spatial distribution of soil carbon in pastures with cow-calf operation: effects of slope aspect and slope position. J. Soils Sediments 10 (2), 240–247. doi:10.1007/s11368-009-0110-0
Sun, M. Y., Li, Q., Jiang, X. Z., Ye, T. T., Li, X. J., and Niu, B. B. (2022). Estimation of soil salt content and organic matter on arable land in the Yellow River delta by combining UAV hyperspectral and landsat-8 multispectral imagery. Sensors 22 (11), 3990. doi:10.3390/s22113990
Takoutsing, B., Weber, J. C., Martín, J. A. R., Shepherd, K., Aynekulu, E., and Sila, A. (2018). An assessment of the variation of soil properties with landscape attributes in the highlands of Cameroon. Land Degrad. Dev. 29 (8), 2496–2505. doi:10.1002/ldr.3075
Tang, S. Y., Du, C., and Nie, T. Z. (2022). Inversion estimation of soil organic matter in Songnen Plain based on multispectral analysis. Land 11 (5), 608. doi:10.3390/land11050608
Thaler, E. A., Larsen, I. J., and Yu, Q. (2019). A new index for remote sensing of soil organic carbon based solely on visible wavelengths. Soil Sci. Soc. Am. J. 83 (5), 1443–1450. doi:10.2136/sssaj2018.09.0318
Wang, C., Feng, M. C., Yang, W. D., Ding, G. W., Wang, H. Q., Li, Z. H., et al. (2016). Use of spectral character to evaluate soil organic matter. Soil Sci. Soc. Am. J. 80 (4), 1078–1088. doi:10.2136/sssaj2015.10.0364
Wang, D. Y., Chen, H. Y., Wang, Z. R., and Ma, Y. (2022). Inversion of soil salinity according to different salinization grades using multi-source remote sensing. Geocarto Int. 37 (5), 1274–1293. doi:10.1080/10106049.2020.1778104
Wang, L., and Zhou, Y. (2023). Combining multitemporal sentinel-2A spectral imaging and random forest to improve the accuracy of soil organic matter estimates in the plough layer for cultivated land. Agriculture-Basel 13 (1), 8. doi:10.3390/agriculture13010008
Wang, X. P., Zhang, F., Kung, H. T., and Johnson, V. C. (2018). New methods for improving the remote sensing estimation of soil organic matter content (SOMC) in the Ebinur Lake Wetland National Nature Reserve (ELWNNR) in northwest China. Remote Sens. Environ. 218, 104–118. doi:10.1016/j.rse.2018.09.020
Wang, Y., Luo, C., Zhang, W. Q., Meng, X. T., Liu, Q., Zhang, X. L., et al. (2023). Remote sensing prediction model of cultivated land soil organic matter considering the best time window. Sustainability 15 (1), 469. doi:10.3390/su15010469
Wei, Y. N., Ping, Z. L., Zhao, G. X., Chen, H. Y., and Wang, L. L. (2022). Comparison of sentinel 2A MSI and Landsat 8 OLI for soil organic matter inversion in southwestern Shandong province, China. Geocarto Int. 37 (25), 8214–8229. doi:10.1080/10106049.2021.1996638
Wood, S. A., and Baudron, F. (2018). Soil organic matter underlies crop nutritional quality and productivity in smallholder agriculture. Agric. Ecosyst. Environ. 266, 100–108. doi:10.1016/j.agee.2018.07.025
Wu, C. Y., Cao, G. C., Chen, K. L., E, C. Y., Mao, Y. H., Zhao, S. K., et al. (2019). Remotely sensed estimation and mapping of soil moisture by eliminating the effect of vegetation cover. J. Integr. Agric. 18 (2), 316–327. doi:10.1016/s2095-3119(18)61988-4
Wu, T. J., Luo, J. C., Dong, W., Sun, Y. W., Xia, L. G., and Zhang, X. J. (2019). Geo-object-based soil organic matter mapping using machine learning algorithms with multi-source geo-spatial data. Ieee J. Sel. Top. Appl. Earth Observations Remote Sens. 12 (4), 1091–1106. doi:10.1109/jstars.2019.2902375
Xu, X. B., Chen, Y. H., Dai, X. J., Lei, T. J., Wang, S. J., and Li, K. N. (2023). An improved vis-NIR estimation model of soil organic matter through the artificial samples enhanced calibration set. Ieee J. Sel. Top. Appl. Earth Observations Remote Sens. 16, 4626–4637. doi:10.1109/jstars.2023.3275745
Xu, X. B., Du, C. W., Ma, F., Qiu, Z. C., and Zhou, J. M. (2023). A framework for high-resolution mapping of soil organic matter (SOM) by the integration of fourier mid-infrared attenuation total reflectance spectroscopy (FTIR-ATR), sentinel-2 images, and DEM derivatives. Remote Sens. 15 (4), 1072. doi:10.3390/rs15041072
Zhai, M. T. (2019). Inversion of organic matter content in wetland soil based on Landsat 8 remote sensing image. J. Vis. Commun. Image Represent. 64, 102645. doi:10.1016/j.jvcir.2019.102645
Zhang, X. F., Adamowski, J. F., Liu, C. F., Zhou, J. J., Zhu, G. F., Dong, X. G., et al. (2020). Which slope aspect and gradient provides the best afforestation-driven soil carbon sequestration on the China's Loess Plateau? Ecol. Eng. 147, 105782. doi:10.1016/j.ecoleng.2020.105782
Keywords: soil organic matter, remote sensing inversion, topographic factor, sentinel-2A MSI, multiple linear regression
Citation: Zou J, Wei Y, Zhang Y, Liu Z, Gai Y, Chen H, Liu P and Song Q (2024) Remote sensing inversion of soil organic matter in cropland combining topographic factors with spectral parameters. Front. Environ. Sci. 12:1420557. doi: 10.3389/fenvs.2024.1420557
Received: 20 April 2024; Accepted: 29 May 2024;
Published: 20 June 2024.
Edited by:
Changchun Huang, Nanjing Normal University, ChinaCopyright © 2024 Zou, Wei, Zhang, Liu, Gai, Chen, Liu and Song. This is an open-access article distributed under the terms of the Creative Commons Attribution License (CC BY). The use, distribution or reproduction in other forums is permitted, provided the original author(s) and the copyright owner(s) are credited and that the original publication in this journal is cited, in accordance with accepted academic practice. No use, distribution or reproduction is permitted which does not comply with these terms.
*Correspondence: Hongyan Chen, Y2hlbmh5QHNkYXUuZWR1LmNu
Disclaimer: All claims expressed in this article are solely those of the authors and do not necessarily represent those of their affiliated organizations, or those of the publisher, the editors and the reviewers. Any product that may be evaluated in this article or claim that may be made by its manufacturer is not guaranteed or endorsed by the publisher.
Research integrity at Frontiers
Learn more about the work of our research integrity team to safeguard the quality of each article we publish.