 Tingyu Tao
 Hao Zhang
 Zikun Hu
- School of Economics and Management, Huaibei Normal University, Huaibei, China
With urbanization acceleration, ensuring urban water use security and sustainable water resource management has become a major global challenge. As a populous country, China faces increasingly severe challenges. Comprehensive and systematic urban wastewater treatment efficiency (UWTE) assessments constitute a prerequisite for addressing this problem. Based on 2011–2021 panel data of 30 Chinese provinces, the superefficiency SBM model was employed for UWTE measurement from national and regional perspectives. ArcGIS software and the Tobit model were adopted to analyse the spatial-temporal patterns and factors influencing UWTE. UWTE in most provinces generally exhibited a fluctuating upward trend, with an uneven east-high and west-low spatial distribution pattern. The decomposition results showed that the low UWTE in the eastern region was mainly constrained by scale efficiency, while in the central region, pure technical efficiency was the primary constraint. The shunt pipeline construction level, load rate, and wastewater treatment scale significantly positively impacted UWTE, while economic scale yielded a negative impact. It is recommended that the Chinese government adjust the outdated construction-without-operation model and implement differentiated wastewater treatment policies. It is necessary to vigorously promote rainwater and wastewater diversion pipeline construction, optimize and upgrade sewer networks and wastewater treatment facilities, and fully utilize scale effects. These findings provide insights for China and countries similar to China to facilitate efficient wastewater management practices.
1 Introduction
Over the 70 years since the founding of New China, the country has experienced the largest and fastest urbanization process in world history (Wang et al., 2022). With the comprehensive reform of the household registration system, a total of 130 million agricultural transfers and other permanent residents have settled in urban areas across China. By the end of 2022, the urbanization rate of the national permanent population had reached 65.22%, which was 3.6 times greater than that in 1978 (17.92%). New urbanization is still progressing in depth, and it is estimated that by 2035, the new urban population will increase by approximately 150 million people. With urbanization acceleration, the total amount of urban wastewater discharge in China is constantly increasing, the water pollution situation is becoming increasingly severe, and cities are facing enormous environmental challenges. The large volume of urban wastewater is a leading cause of water pollution (Wu et al., 2019). Statistics indicate that from 2007 to 2022 alone, the national wastewater discharge increased from 36,101.18 million cubic metres to 63,897.07 million cubic metres, an increase of 76.99%. Urban domestic wastewater discharge is also increasing each year, and over the past 10 years, domestic wastewater has accounted for more than 70% of the total wastewater volume (National Bureau of Statistics, 2019). Since 1998, it has surpassed industrial pollution to become the No. 1 source of environmental pollution in China.
Increased urban wastewater discharge also increases health risks (Wang et al., 2020). Biomass contains large amounts of organic matter, nutrients such as nitrogen and phosphorus, and various microorganisms. Direct discharge without proper treatment can cause serious pollution of the aquatic environment and threaten human health and the ecosystem balance. In addition, it threatens the sustainability of water resources and socioeconomic and environmental systems in China. In response to the increasing harm caused by water pollution, the Chinese government has introduced numerous policies to attempt to control water pollution (Mao et al., 2019). As a result, the number of urban wastewater treatment plants (UWWTPs) increased from 1,258 plants in 2007 to 12,586 plants in 2021, with an average annual growth rate of 9.86%. In 2021, the operating cost of UWWTPs across China reached 112.42 billion yuan, with yearly increases. However, the operating conditions of Chinese urban UWWTPs have deteriorated due to issues such as inadequate equipment (Zhao et al., 2018). Moreover, some cities have overemphasized investment projects of UWWTPs but neglected the construction of urban sewers, which has negatively impacted the transportation and treatment capabilities of urban wastewater and resulted in the direct discharge of large amounts of wastewater into the environment, resulting in environmental destruction and the loss of renewable water resources (Wu et al., 2018).
The above indicates that the wastewater treatment cost in China is increasing annually, but the wastewater treatment situation remains grim. To effectively treat urban wastewater and ensure the sustainable development of society, not only should the number of wastewater treatment facilities be increased but also the operational efficiency should be improved. Systematic measurement of the efficiency is an important prerequisite for efficiency improvement. Therefore, it is necessary to comprehensively evaluate the urban wastewater treatment efficiency (UWTE) and determine the causes of a low efficiency to help government departments formulate reasonable UWTE improvement policies and promote the healthy development of UWWTPs.
Many empirical wastewater treatment studies have been conducted. The research methods that have been employed include life cycle analysis (LCA), data envelopment analysis (DEA), stochastic frontal analysis (SFA) (Corton and Berg, 2009), key performance indicators (Benedetti et al., 2008; Quadros et al., 2010; Silva et al., 2016), grey relationship analysis (Ilangkumaran et al., 2013; Li et al., 2015), analytic hierarchy processes (Lizot et al., 2021; Castellet-Viciano et al., 2022), and machine learning (Torregrossa et al., 2018; Maziotis et al., 2023). Among these methods, the LCA method aims to assess the environmental impact by considering the life cycle of products, technologies, or production activities and to quantify the economic value and environmental burden at each life stage. In many studies, the LCA method has been used to investigate wastewater treatment efficiency (Hospido et al., 2008; Khalkhali and Mo, 2020; Furness et al., 2021) However, the LCA method mainly focuses on the study of specific products or technologies, and this method is unsuitable for environmental performance indicators at the macroscopic level. When selecting indicators and assigning weights, most performance indicator assessment methods are subjective. The KPIs and AHP are equally susceptible to subjective factors. SFA requires assumptions about the form of the production function, which may limit its applicability. The results of the GRA may not be as intuitive as those of the DEA, because its results are correlations rather than efficiency values. Machine learning usually requires a large amount of high quality data for training. The availability of data also limits the use of this methodology.
Charnes et al. (1978) proposed the DEA technique, which is the most common method for evaluating wastewater treatment performance. The advantage of this method is that it can address multiple-input and multiple-output problems without defining the form of the production function in advance. It uses mathematical planning models to determine efficiency based on actual data, reducing the influence of subjective judgement. The results are usually presented in the form of efficiency scores that visually represent the level of efficiency of the DMU relative to other DMUs. Therefore, this technique is suitable for data analysis at various scales. Since it was first proposed, it has been widely applied in UWWTP efficiency assessment, helping researchers identify the causes of low efficiency levels and providing a sound basis for management decision-making. Cubbin and Tzanidakis. (1998), Thanassoulis. (2000), Alsharif et al. (2008), and Jiang et al. (2020) confirmed the effectiveness of the DEA method in wastewater treatment efficiency assessment.
However, this model ignores slack variables, and the efficiency value can only remain within the (0, 1) interval. Tone. (2001) introduced the slack-based measure (SBM) model; on this basis, a superefficiency SBM model was proposed (Tone, 2002). In this model, the selection issue of orientation is not considered, and the input and output are not required to strictly change proportionately, which can overcome the above shortcomings and more accurately reflect the actual efficiency value. In terms of research methods, Hernández-Sancho et al. (2011) used a nonradial DEA model to calculate the energy efficiency index of UWWTPs in Spain. Yang et al. (2021) adopted a dynamic interactive network SBM model to evaluate the efficiency of regional industrial water systems in China from 2008 to 2014, which provided beneficial information for policymakers to solve the problem of a low system efficiency. In terms of research content, (Zhang et al., 2021) studied the UWTE and its driving factors against the background of the river chief system in China. Chang and Zhu (2021) analysed the relationships between policy measures such as pollution levies and environmental inspections and water resource utilization and treatment in various provinces in China. In terms of influencing factors, existing studies have demonstrated that wastewater treatment facilities exhibit a significant scale effect (Hernández-Chover et al., 2018). In areas with leading economic development, areas with small populations and vast natural land attained greater wastewater treatment efficiency (Feng et al., 2019). The influent concentration and loading rate can significantly impact wastewater treatment efficiency (Gómez et al., 2017), while both discharge standards and influent quality affect treatment efficiency through operating costs (Yang and Chen, 2021).
The above literature review reveals that there are abundant relevant research results for wastewater treatment efficiency, which provide sufficient theoretical support and technical guidance for this study. However, existing studies still exhibit certain areas that should be developed and extended further, which are shown in Table 1. (1) In terms of research methods, few studies have focused on decomposing UWTE into scale efficiency (SE) and pure technical efficiency (PTE) and analysing the contributions of these two components to UWTE. (2) In terms of research content, the temporal and spatial differences in UWTE between different regions have not been fully revealed. (3) In terms of influencing factors, because most Chinese cities have not implemented rain and wastewater diversion pipelines in the past, the impact of the construction level of diversion pipelines on the efficiency has often been ignored (Longo et al., 2018). Therefore, it is necessary to further analyse the spatiotemporal evolution characteristics of UWTE and identify the key influencing factors, which is important for UWTE improvement.
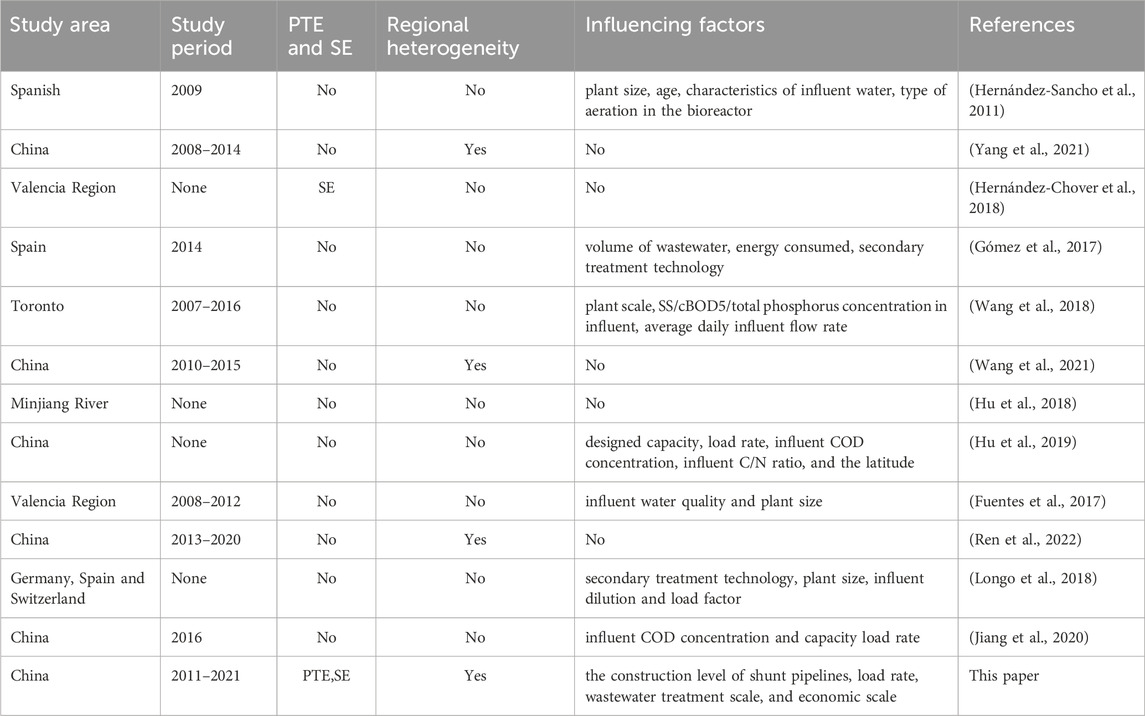
Table 1. Previous studies on UWTE that use DEA.
The main contributions of this paper are as follows: (1) The superefficiency SBM model was adopted to measure UWTE in China from 2011 to 2021, which was decomposed into PTE and SE to analyse the impact of decomposition factors. (2) ArcGIS software was used to describe the spatiotemporal evolution characteristics and regional heterogeneity of UWTE, which facilitates the implementation of differentiated wastewater treatment policies by the Chinese government. (3) Accounting for the key influencing factor of the construction level of shunt pipelines, a Tobit model was constructed for further empirical verification. The effect of each influencing factor on the efficiency of the UWWTPs was investigated to provide data support for continuing to vigorously promote rainwater and wastewater diversion pipeline construction.
2 Materials and methods
2.1 Application of the superefficiency SBM model
In this subsection, the principle of the superefficiency SBM model is first described as a way to measure the UWTE of China’s provinces; then, the selected input‒output variables and collected data are presented.
2.1.1 Principle of the superefficiency SBM model
In 2002, Tone proposed the nonoriented superefficiency SBM model, which is shown in Equation (1):
The characteristics of the superefficiency SBM model are as follows: the optimal solution is dimensionless, and the efficiency can exceed 1. Therefore, these two properties can provide the ranking and degree of difference between decision-making units (DMUs). This model is suitable for measuring the efficiency value of multiple DMUs and can fully reflect the difference in the efficiency value of each DMU. With the use of this model, UWTE in 30 provinces in China was measured to study regional differences.
The technical efficiency (TE) can be obtained via the above superefficiency SBM model. TE can be further divided into PTE and SE. In this study, TE reflects the UWTE of each DMU, which is equal to the product of PTE and SE. The BCC model is based on variable returns to scale (VRS), and its results exclude the effect of SE; thus, its results are called “PTE” (Banker et al., 1984). The output-oriented BCC model planning equation is shown in Equation (2):
PTE refers to the efficiency related to technology factors, and SE refers to the efficiency related to the scale of production (Cooper et al., 2007). The relationship between them is shown in Equation (3).
2.1.2 Input‒output variables
Reasonable selection of input and output variables can improve the accuracy of DEA. The environmental, economic, social, and resource dimensions should be comprehensively considered to fully reflect the operational status of the studied UWWTPs. In general, the consumption of capital, resources or energy represents the input, while products or services represent the output (Hu et al., 2019; Banker et al., 1984). Notably, the more model variables there are, the more difficult it is to differentiate among DMUs (Morita and Avkiran, 2009). Therefore, while retaining the necessary production factors, the number of variables should be reduced as much as possible.
This study referred to the variables selected in previous efficiency assessment studies of WWTPs (Dong et al., 2018; Gémar et al., 2018; Pan et al., 2020; Feng et al., 2022; Hernández-Chover et al., 2023) and considered the difficulty of obtaining indicator data and the applicability of indicators in the selected model. To comprehensively evaluate UWTE, the number (N), wastewater treatment capacity (WTC), annual operating expenses (OC) and new fixed assets (NFA) of the UWWTPs were chosen as input variables. The amount of wastewater treated (T), removal amount of the chemical oxygen demand (COD) and removal amount of ammonia-nitrogen (AN) (two major pollutants in Chinese wastewater) were employed as output variables.
The data for the above variables were all obtained from the China Environment Statistical Annual Report. Notably, 2011–2021 data on the input and output indicators for each province, autonomous region, and municipality directly under the purview of the Central Government (excluding Tibet) were collected. Descriptive statistics of the input and output variables are provided Table 2. The median values of all variables are less than the mean values, and the standard deviations of all variables are very large. In addition, significant differences exist between the maximum and minimum values. These descriptive results indicate that significant UWTE differences may exist among different cities. Table 2 shows the Pearson correlation coefficient between the input and production variables (Cui and Li, 2018). In Table 3 most coefficients are positive and relatively high, which ensures that the relationships between the input and output are close.
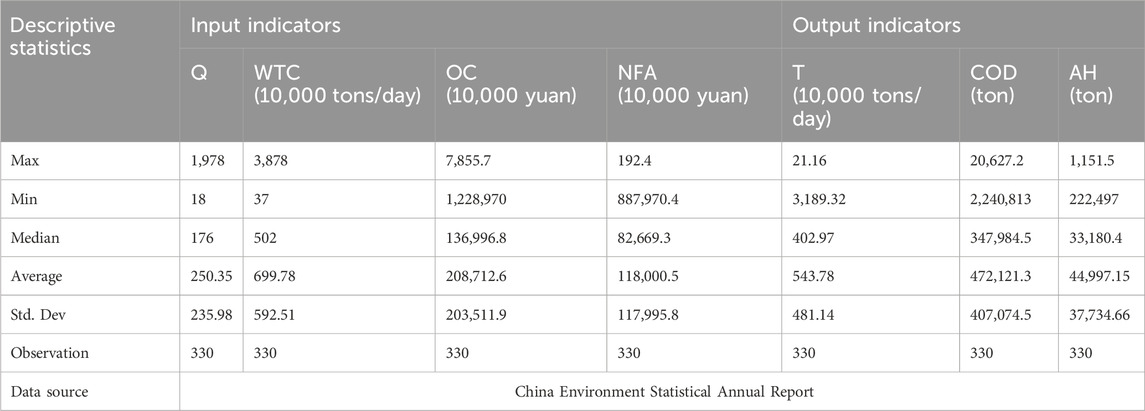
Table 2. Descriptive statistics of the input‒output variables (2011–2021).
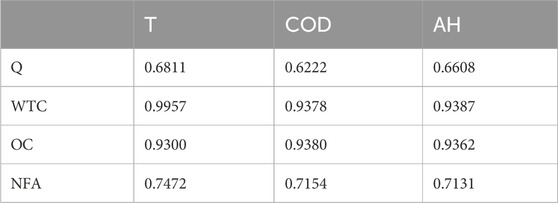
Table 3. Input‒output variable correlation statistics.
2.2 Application of the Tobit model
The principle of the Tobit model is first described to analyse the factors influencing UWTE; then, the selected influencing factor variables and hypotheses are presented.
2.2.1 Principle of the Tobit model
The Tobit model, designed by Tobin (1958), is a classic method for analysing influencing factors; it is an econometric model suitable for partially continuous or partially discrete dependent variables, and it serves as a regression model with limited dependent variables. The Tobit model is shown in Equation (4):
where
In this paper, the dependent variable in the Tobit model is UWTE, which is calculated via the superefficiency SBM model. The obtained efficiency values are discrete values greater than 0. In this case, the ordinary least squares (OLS) method was employed to estimate the model parameters. However, the use of the maximum likelihood (ML) method for estimating Tobit model parameters could yield more accurate results. Therefore, in Tobit regression analysis, the ML method was chosen to estimate the model parameters.
2.2.2 Influencing factor variables
Because there are many factors that impact the UWTE, it is impossible to exhaustively address these factors. In this study, based on existing research, impact analysis of the UWTE was conducted by considering the construction level of shunt pipelines, load rate, wastewater treatment scale, and economic scale.
2.2.2.1 Shunt pipeline construction level (SP)
Existing studies have shown that low influent concentrations of water pollutants such as COD could lead to a low efficiency of UWWTPs (Feng et al., 2022; Dong et al., 2017) because excessive dilution increases the energy needed to remove a unit amount of pollutants (di Cicco et al., 2019). An important reason for low influent concentrations is the insufficient proportion of the separate system and drainage pipes, resulting in the confluence of rain and wastewater (Liu, 2023). The urban drainage network is an important part of urban infrastructure and is responsible for the collection and transportation of domestic wastewater, industrial wastewater and surface runoff rainwater (Lofrano and Brown, 2010). These systems can be divided into combined and diverted systems (van Daal et al., 2017). In recent years, most newly built cities have adopted the split-flow pipe network; however, for various reasons, many old cities at home and abroad still use the combined pipe network (Gasperi et al., 2010). Therefore, not only wastewater but also other external waters may be received, which wastes the ability of wastewater treatment plant to reduce water pollutants. Water quantity overload and insufficient water quality loading rates greatly impact the operation of UWWTPs. In summary, the construction level of shunt pipelines critically affects UWTE. In this paper, the ratio of wastewater pipelines to the total pipelines was used to represent the construction level of shunt pipelines.
Hypothesis 1. Wastewater pipes affect the influent concentration of pollutants such as COD. The higher the proportion of wastewater pipes in the total pipelines is, the greater the UWTE.
2.2.2.2 Wastewater treatment scale (TS)
Wastewater treatment facilities generate a notable scale effect, which positively affects UWTE. Economies of scale influence efficiency, especially operational costs, such as personnel, waste management, and maintenance (Cooper et al., 2007). For example, when comparing large (>100,000 m3/day) and small (<10,000 m3/day) UWWTPs, large plants performed better, thus demonstrating the effect of economies of scale (Zeng et al., 2017). In this study, the wastewater treatment volume of a wastewater treatment plant was used to represent the treatment scale.
Hypothesis 2. Due to the scale effect of the UWWTPs, the larger the annual wastewater treatment volume is, the greater the UWTE.
2.2.2.3 Load rate (LR)
The higher the loading rate is, the higher the facility utilization rate and the greater the UWTE (Yang and Chen, 2021). In this study, the ratio of the actual treatment capacity to the design treatment capacity of the wastewater treatment facility was employed to represent the loading rate.
Hypothesis 3. The higher the load factor is, the higher the facility utilization rate and the greater the UWTE.
2.2.2.4 Economic scale (ES)
The economic scale is the basic environment for UWWTP development, so the economic scale affects the differences in UWTE. To comprehensively consider the differences in economic scale among the different provinces, the gross regional product was used in this study to represent the level of the regional economic scale (Sun et al., 2021).
Hypothesis 4. The greater the gross regional product is, the greater the investment in UWWTPs and the greater the UWTE.
Based on the above hypothesis, to study the influencing factors on UWTE, which derived from the superefficiency SBM model was used as the dependent variable. Moreover,
Where
Variable definitions and data sources are provided Table 4. Descriptive statistics of the influencing factor variables are provided Table 5.

Table 4. Meaning of the variables and data sources.
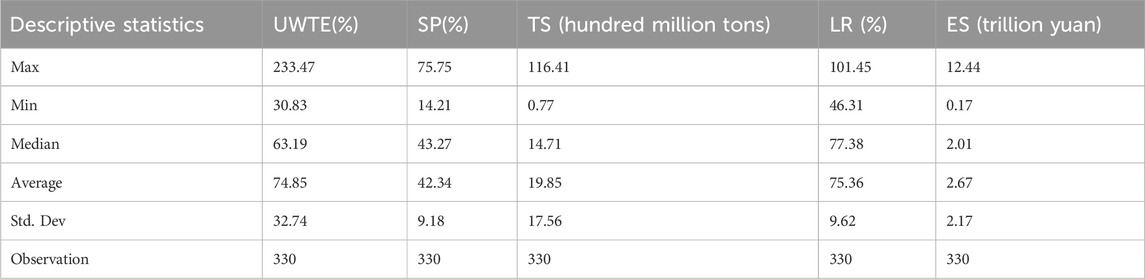
Table 5. Descriptive statistics of the influencing variables (2011–2021).
3 Results and discussion
In this study, the superefficiency SBM model was adopted to measure UWTE in China, and decomposition analysis was performed. Then, the spatiotemporal evolution characteristics of UWTE were described via ArcGIS software. Finally, regression analysis was performed on the UWTE measurement results and influencing factors via the Tobit model to quantify the influence of each influencing factor explore the conditions and methods used to improve UWTE.
3.1 Efficiency evaluation analysis
With the use of MaxDEA12.1 software, the input‒output indicators of each province were substituted into the superefficiency SBM model, and the UWTE in the 30 provinces in China from 2011 to 2021 was calculated as summarized in Figures 1A–K. UWTE was further decomposed into PTE and SE, as detailed in Supplementary Appendix Table SA1.
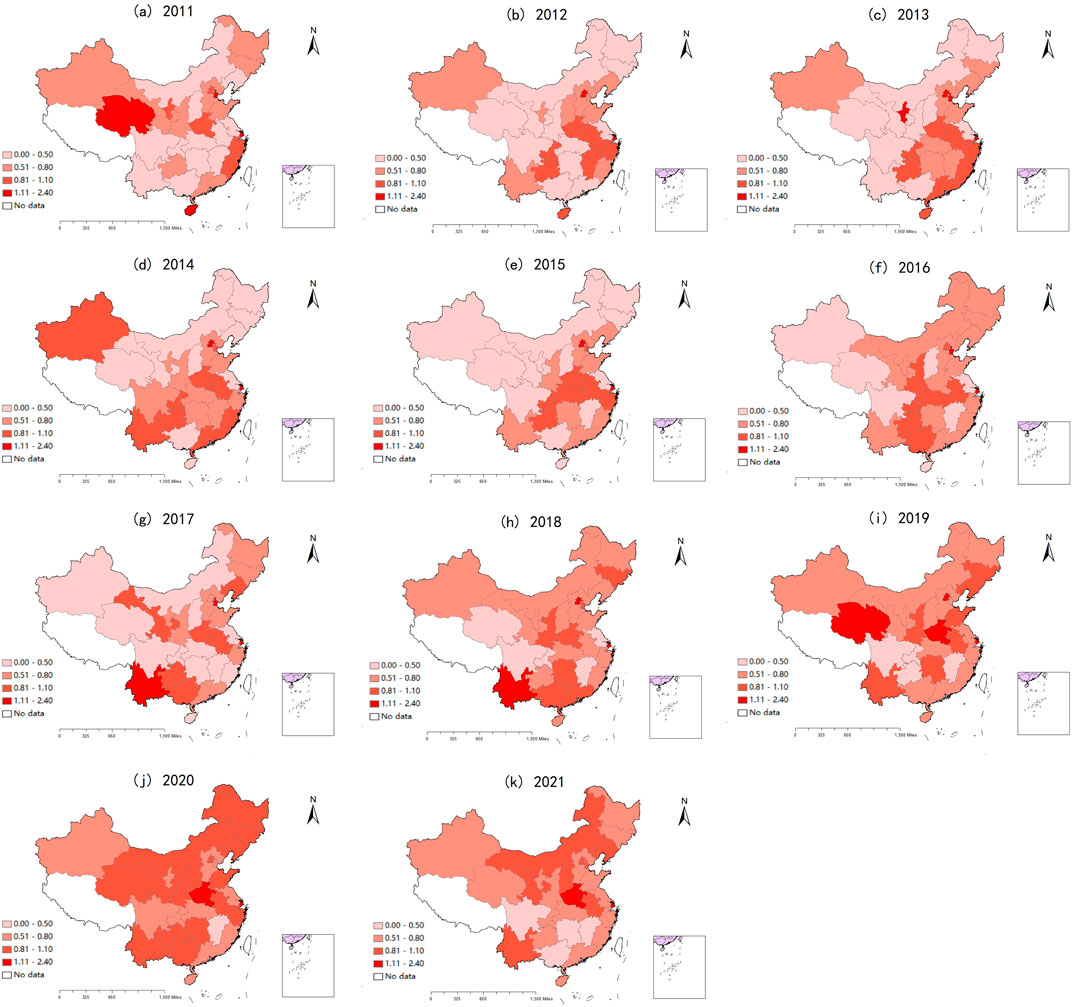
Figure 1. Uwte in China (2011–2021). (A) 2011, (B) 2012, (C) 2013, (D) 2014, (E) 2015, (F) 2016, (G) 2017, (H) 2018, (I) 2019, (J) 2020, (K) 2021.
3.1.1 Overall analysis
During the 2011–2021 period, the UWTE in China generally increased, but the efficiency remained low. The efficiency reached 0.677 in 2011, 0.713 in 2015, and 0.785 in 2021, and the 11-year average efficiency was 0.749, indicating that there is still much room for improvement. During the study period, PTE and SE fluctuated slightly, and PTE remained above SE, as shown in Figure 2.
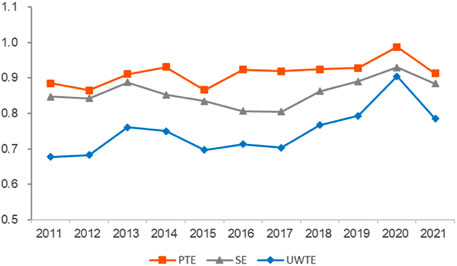
Figure 2. Uwte, Pte and Se in China (2011–2021).
3.1.2 Regional analysis
In general, mainland China can be divided into three regions based on the economic geography: the eastern, central and western regions. The eastern region is the most developed region in China, comprising three municipalities directly under the purview of the Central Government, namely, Beijing, Tianjin, and Shanghai, and eight coastal provinces (Liaoning, Hebei, Jiangsu, Zhejiang, Fujian, Shandong, Guangdong, and Hainan). The central region includes ten inland provinces (Heilongjiang, Jilin, Inner Mongolia, Henan, Shanxi, Anhui, Hubei, Hunan, Jiangxi, and Guangxi). The western region comprises one municipality directly under the Central Government (Chongqing) and nine provinces (Gansu, Guizhou, Ningxia, Qinghai, Shaan xi, Tibet, Yunnan, Xinjiang, and Sichuan) and accounts for more than half of the total geographic area of China. This area has the lowest population density and is the least developed area. Due to missing data for Tibet in the statistical yearbook, Tibet was excluded.
The UWTE, PTE and SE in the above three regions from 2011 to 2021 were calculated, as detailed in Table 6. Table 6 indicates that the UWTE in the eastern region was the highest, and the value in the central region was greater than that in the western region. Over the past 11 years, the UWTE in the eastern region has slightly decreased, while that in the central and western regions has significantly increased.

Table 6. UWTE, PTE and SE in the three major regions of China (2011–2021).
The UWTE, PTE, and SE, of wastewater treatment in the three major regions all fluctuated, as shown in Figure 3. In particular, PTE, in the eastern region was significantly greater than SE, and PTE, significantly promoted the increase in the UWTE. SE, in the central region was significantly higher than PTE, and SE, exerted a greater impact on the environmental efficiency than did PTE. PTE, and SE, slightly differed in the western region, and the extent of the impact of these efficiency components on UWTE, was basically the same.

Figure 3. UWTE, PTE and SE in the three major regions of China (2011–2021) (A) Eastern region (B) Central region (C) Western region.
3.1.3 Provincial-level analysis
To compare the differences among the various provinces, a spatial-temporal comparison map of the UWTE for the 2011–2021 period was created based on the calculation results, as shown in Supplementary Appendix Table SA2.
Clearly, as of 2021, the number of provinces (cities) across China that reached a relatively high level (>0.8) significantly increased, indicating that the wastewater treatment level significantly increased in 2011. Inner Mongolia experienced the greatest increase in national rankings, rising from 27th to third place. The reason may be that Inner Mongolia has certain regional advantages. The vast amount of land provides certain conditions and guarantees the construction and operation of wastewater treatment facilities, which is conducive to improving treatment efficiency. Hainan Province has experienced the greatest decrease in the national ranking of the UWTE over the past 11 years, from 4th to 22nd place. The reason may be that, as a popular tourist city in recent years, the wastewater volume in Hainan has exceeded the maximum carrying capacity relative to other provinces. In contrast to developed areas, the economic development level is low, and financial resources are relatively insufficient to support the large-scale construction and upgrading of wastewater treatment facilities, thus affecting treatment efficiency improvement; Inner Mongolia, Liaoning, Yunnan, Anhui, Shanxi, Gansu, Hubei, Henan, Jiangsu, Guangxi, and Chongqing UWTE increased across the efficiency range compared with 2021, while Hainan, Fujian, Tianjin, and Zhejiang decreased. In addition, only Shanghai, Beijing, Tianjin, and Henan have UWTE averages above 1. Notably, Jiangsu is at the bottom of the list for UWTE.
To explore the contributions of PTE and SE to UWTE in different provinces, high and low efficiency are distinguished via 0.8 as a cut-off point. All 30 provinces were divided into three categories, as shown in Table 7. (1) The PTE and SE jointly promoted UWTE. PTE and SE in these provinces were greater than 0.8. As shown in Figure 4, 7 provinces fell into this category, accounting for 23.3% of the total provinces. This is precisely why Shanghai, Beijing, Tianjin and Henan have efficiency values greater than 1. These regions have actively promoted wastewater treatment technology introduction and innovation. In addition, they are densely populated, making it easy to create economies of scale. (2) PTE was the main source of UWTE growth, and SE inhibited UWTE growth. There were 17 provinces of this type, accounting for 56.7% of the total provinces. This result indicates that the scale of wastewater treatment facilities may be insufficient. A small scale prevents the fixed costs from being fully amortized to the output, resulting in a higher unit output cost and the effect of economies of scale is not obvious. Jiangsu is a notable example. Although it has invested substantially, its layout has not been rationalized to form a scale effect. (3) SE was the main source of UWTE growth, while PTE inhibited UWTE growth. Only 6 provinces, Zhejiang, Guangdong, and Shandong, belonged to this category, indicating that PTE was not the main obstacle to improving UWTE in most provinces. These results can be clearly seen in Figure 4.
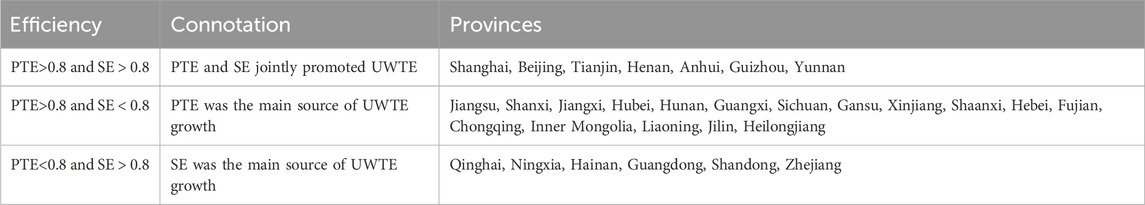
Table 7. Statistical table of high and low efficiency subgroups.
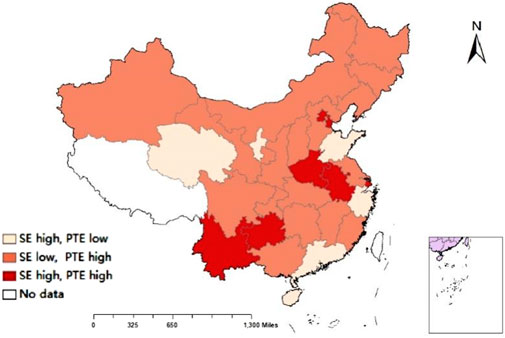
Figure 4. Contributions of PTE and SE to UWTE in each province.
3.2 Influencing factor analysis for the efficiency scores of WWPTs
3.2.1 Random effects model test
The existence of different individuals in the panel data model may lead to the occurrence of individual effects. If there are no individual effects, a fixed effects model can be created. Conversely, a random effects model should be established. Therefore, before performing regression analysis, we must first determine the specific form of the panel data model, namely, we must determine whether the fixed effects model or the random effects model should be employed. The null hypothesis (H0: the random effects model is the correct model) was tested. If the null hypothesis can be rejected on the basis of the Hausman test, the estimates of the random effects model may be biased, while the estimates of the fixed effects model may be more reliable. If the test result does not indicate that the null hypothesis can be rejected, we can use a random effects model, which is more effective.
With the help of Stata 17.0 data analysis software, the Hausman test was adopted to determine whether the fixed effects model or the random effects model should be used. The p-value was 0.8544, which was not significant at the 1%, 5%, or 10% level. Therefore, the model could not be rejected. The null hypothesis indicates that there are individual effects in the panel data. Therefore, the effect of using the random effects model is better; thus, it was chosen as the panel data model.
3.2.2 Regression result analysis
With the use of Stata 17.0 software, a random effects model was applied to evaluate the factors affecting UWTE in China. The regression estimation results are listed in Table 8.
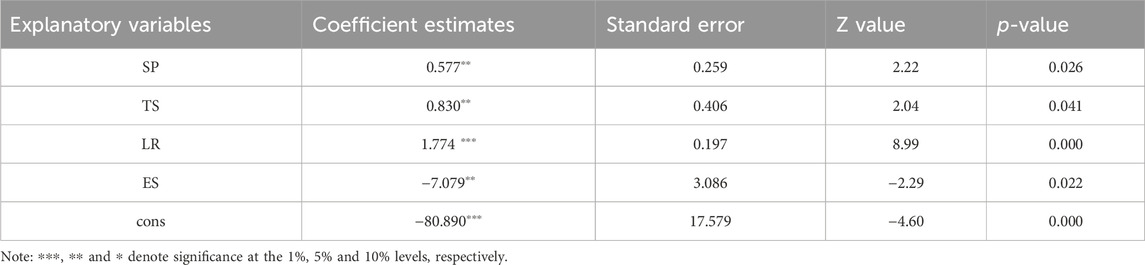
Table 8. Tobit regression results for the factors influencing UWTE in China.
Through regression analysis, we found that the shunt pipeline construction level, load rate, and wastewater treatment scale significantly positively impacted UWTE, while the economic scale had a negative impact. These results support hypotheses 1, 2, and 3 but contrast with Hypothesis 4.
3.2.3 Robustness analysis
3.2.3.1 Endogenous test
To alleviate the endogeneity problem of omitted variables, a multiperiod difference-in-differences (DID) model is constructed. The idea of setting is as follows: the samples are divided into experimental and control groups according to the shunt pipeline construction level. The average value is then taken as the demarcation; those higher than the sample mean are set as the experimental group; and those lower than the mean are set as the control group. The regression results are shown in Table 9, and the conclusion still holds.

Table 9. Endogeneity test results for the factors influencing UWTE in China.
3.2.3.2 Subsample regression
Considering that the selection of the sample time window may have an impact on the results of the study, the random effects Tobit model for regression is again adopted after excluding the first and last 2 years of sample data. The results are listed in Table 10, which shows that the coefficients and significance of the variables have not changed substantially, confirming the robustness of the primary conclusions.
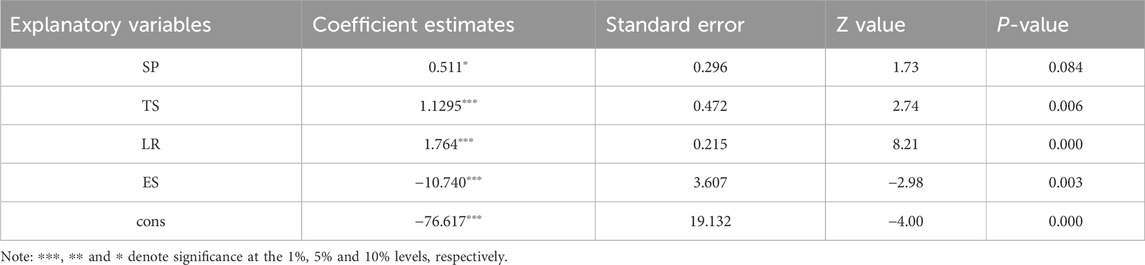
Table 10. Robustness test results for the factors influencing UWTE in China.
4 Discussion
4.1 The spatial-temporal pattern of UWTE
With urbanization acceleration, ensuring urban water use security and sustainable water resource management has become a major global challenge. Comprehensive and systematic UWTE assessments constitute a prerequisite for addressing this problem. In this study, we discuss the spatial and temporal evolution of UWTE from three perspectives.
1. From a national perspective, the UWTE in China has generally showed a fluctuating upward trend, but it has remained low. The main factor was the low SE because the small scale prevented the fixed costs from being fully amortized to the output, resulting in a higher unit output cost and the effect of economies of scale was not obvious.
2. From a regional perspective, the UWTE shows an uneven pattern of high-east and low-west. The decomposition results show that PTE in the eastern region was significantly greater than SE, and PTE significantly promoted an increase in UWTE. This may have occurred because the eastern region exhibits favourable water resource endowment conditions and location advantages, abundant human and financial resources, and advanced technology for efficient wastewater treatment. This technological innovation has increased the efficiency. However, SE in the eastern region was the lowest. This may be due to the high population mobility in this region, which faces higher variability and seasonal wastewater flow, making it difficult for treatment facilities to maintain stable high-load operation conditions throughout the year. The potential capacity of the treatment facility should be fully utilized. SE in the central region was significantly higher than PTE, and SE exerted a greater impact on the environmental efficiency than did PTE. These results suggest that the contribution of PTE to environmental efficiency improvement was relatively low. This may be due to the wastewater treatment technology adopted in this area, which is not advanced enough. PTE and SE in the western region differed slightly, and the extent of the impact of these efficiency components on UWTE was basically the same.
3. From a provincial perspective, UWTE in Shanghai has always remained at the forefront in China. As of 2021, the number of provinces and autonomous regions (cities) across China that reached a relatively high level (>0.8) had significantly increased, indicating that the level of wastewater treatment has increased considerably over the last 11 years. After decomposing the UWTE, we found that SE was the main obstacle to improving the UWTE.
4.2 Influencing factors of UWTE
After analysing the spatial and temporal evolution of UWTE, an in-depth discussion of the influencing factors is necessary to arrive at targeted measures to improve UWTE.
1. The proportion of wastewater pipelines to total pipelines imposed a significant positive effect on UWTE, which is consistent with the above hypothesis. The UWTE in some areas was low. The main reason is that mixed-flow drainage systems encompass less rain and wastewater shunts, and the mixing of natural water into wastewater pipes is more common, resulting in a lower concentration of pollutants in the influent and a reduction in pollutants per unit of wastewater treatment. Therefore, it is necessary to enhance pipeline network renovation to promote rainwater diversion and reduce the “useless work” of wastewater treatment facilities.
2. The load factor was the main influencing factor of UWTE, which is consistent with the original hypothesis. The load rate is closely related to the construction of the supporting pipe network of wastewater treatment facilities, which is consistent with the results of Li et al. (2017). Therefore, it is very important to improve the planning of wastewater treatment facilities and strengthen the construction of supporting pipelines.
3. The wastewater treatment scale significantly positively affected the UWTE, which is consistent with the hypothesis. This shows that wastewater treatment exhibits a notable scale effect, and that most provinces are currently at the stage of increasing returns to scale, which is consistent with the conclusions of other researchers (Wu et al., 2021; Fuentes et al., 2020; He et al., 2019). Therefore, it is necessary to increase the wastewater treatment scale and rate, which can facilitate UWTE improvement.
4. The gross regional product significantly negatively affects UWTE, which is inconsistent with the hypothesis. In general, the higher the economic development level is, the greater the strength of the construction of wastewater treatment facilities and distribution networks. The observed negative effect may have occurred because although more effort was invested in the installation of wastewater treatment facilities, less effort was invested in the effective use of these facilities. Under the guidance of GDP, the construction of wastewater treatment facilities is considered the main factor contributing to GDP growth (Shi et al., 2017). Therefore, local governments usually emphasize the construction of wastewater treatment facilities rather than the effective use of these facilities. Many UWWTPs have been built in China but have not been put into operation (Bian et al., 2014). The high degree of vacancy of wastewater treatment facilities not in operation due to construction leads to high input redundancy and affects UWTE improvement.
4.3 Policy implications
Based on the study results, a series of suggestions for future work by the Chinese government are proposed.
1. To increase UWTE, the Chinese government should first propose a clear action plan. Such measures include adjusting the outdated model of construction without operation, adopting a new model of effectively using existing wastewater treatment facilities, absorbing the advanced wastewater treatment management experience of developed countries, actively adopting cutting-edge technologies of developed countries, and regulating such adopted technologies. Transformation should be conducted according to local conditions, and technological innovation of UWWTPs should be encouraged.
2. To improve UWTE, PTE and SE increases should be realized simultaneously. Moreover, the government should implement differentiated wastewater treatment policies with considering spatial heterogeneity. For example, the eastern region should emphasize SE improvement; the government should encourage the integration and sharing of resources among wastewater treatment companies and promote joint construction and sharing of wastewater treatment facilities to reduce construction and operating costs and improve SE; and the central region should focus on PTE improvement. Wastewater treatment facilities should be upgraded, and a pairing support mechanism should be established to guide the transfer of advanced wastewater treatment technology from the eastern region to the central and western regions. Each region should be proactive and adopt effective measures tailored to local conditions to promote coordinated development among various regions.
3. To enhance UWTE, the influencing factors should be comprehensively considered. On the one hand, local authorities should continue to vigorously promote the construction of rainwater and wastewater diversion pipelines, optimize and upgrade sewer networks and wastewater treatment facilities, build new wastewater pipelines, and separate wastewater and rainwater in different pipelines to increase the influent concentration and ensure the water quantity, loading rate and water quality loading rate. On the other hand, the scale effect of the infrastructure system should be fully utilized to operate the system more effectively.
4.4 Study limitations and future studies
Like most studies, this study has several limitations. First, in terms of research perspective, this paper measures UWTE in thirty provinces in China from a macro perspective, and owing to the different resource endowments and development situations within the provinces, more in-depth research can be carried out at the municipal or enterprise level in the future. Second, in terms of data availability, the data in this paper come mainly from official announcements, and in the future more comprehensive and detailed data can be obtained through field research. Last, in addition to objective factors, UWTE is also affected by policy factors, which can be account for via comprehensive analysis in the future.
5 Conclusion
In this study, the DEA model, geographic analysis, and the Tobit model were adopted to calculate UWTE in 30 provinces in China from 2011 to 2021, and the spatiotemporal patterns and factors influencing UWTE were analysed. The main conclusions are as follows.
1. The UWTE in most provinces generally exhibited a fluctuating upwards trend, with an uneven east-high and west-low spatial distribution pattern. The decomposition results showed that the low UWTE in the eastern region was constrained mainly by scale efficiency, while in the central region, pure technical efficiency was the primary constraint.
2. The Tobit analysis results showed that UWTE was affected by factors such as the shunt pipeline construction level, load rate, wastewater treatment scale, and economic scale. Notably, only the economic scale yielded a negative effect. The possible reason is that local governments usually emphasize the construction of wastewater treatment facilities rather than the effective use of these facilities. The high degree of vacancy of wastewater treatment facilities not in operation due to construction results in a high input redundancy and affects UWTE improvement.
Data availability statement
The original contributions presented in the study are included in the article/Supplementary Material, further inquiries can be directed to the corresponding author.
Author contributions
TT: Conceptualization, Data curation, Writing–original draft. HZ: Funding acquisition, Resources, Writing–review and editing. ZH: Visualization, Writing–review and editing.
Funding
The author(s) declare that financial support was received for the research, authorship, and/or publication of this article. This research was supported by Anhui Province Excellent Youth Research Project in Universities (Grant No. 2023AH030082).
Acknowledgments
The authors are grateful to the editor and reviewers for their critical suggestions of this manuscript.
Conflict of interest
The authors declare that the research was conducted in the absence of any commercial or financial relationships that could be construed as a potential conflict of interest.
Publisher’s note
All claims expressed in this article are solely those of the authors and do not necessarily represent those of their affiliated organizations, or those of the publisher, the editors and the reviewers. Any product that may be evaluated in this article, or claim that may be made by its manufacturer, is not guaranteed or endorsed by the publisher.
References
Alsharif, K., Feroz, E. H., Klemer, A., and Raab, R. (2008). Governance of water supply systems in the Palestinian Territories: a data en-velopment analysis approach to the management of water resources. J. Environ. Manag. 87 (1), 80–94. doi:10.1016/j.jenvman.2007.01.008
Banker, R. D., Charnes, A., and Cooper, W. W. (1984). Some models for estimating technical and scale inefficiencies in data envelopment analysis. Manag. Sci. 30 (9), 1078–1092. doi:10.1287/mnsc.30.9.1078
Benedetti, L., Dirckx, G., Bixio, D., Thoeye, C., and Vanrolleghem, P. (2008). Environmental and economic performance assessment of the integrated urban wastewater system. J. Environ. Manag. 88 (4), 1262–1272. doi:10.1016/j.jenvman.2007.06.020
Bian, Y., Yan, S., and Xu, H. (2014). Efficiency evaluation for regional urban water use and wastewater decontamination systems in China: a DEA approach. Resour. Conservation Recycl. 83, 15–23. doi:10.1016/j.resconrec.2013.11.010
Castellet-Viciano, L., Hernández-Chover, V., and Hernández-Sancho, F. (2022). The benefits of circular economy strategies in urban water facilities. Sci. Total Environ. 844, 157172. doi:10.1016/j.scitotenv.2022.157172
Chang, Y. J., and Zhu, D. (2021). Water utilization and treatment efficiency of China's provinces and decoupling analysis based on policy implementation. Resour. Conservation Recycl. 168, 105270. doi:10.1016/j.resconrec.2020.105270
Charnes, A., Cooper, W. W., and Rhodes, E. (1978). Measuring the efficiency of decision making units. Eur. J. opera-tional Res. 2 (6), 429–444. doi:10.1016/0377-2217(78)90138-8
Cooper, W. W., Seiford, L. M., and Tone, K. (2007). Data envelopment analysis: a comprehensive text with models, applications, references and DEA-solver software. New York: Springer.
Corton, M. L., and Berg, S. V. (2009). Benchmarking central American water utilities. Util. Policy 17 (3-4), 267–275. doi:10.1016/j.jup.2008.11.001
Cubbin, J., and Tzanidakis, G. (1998). Regression versus data envelopment analysis for efficiency measurement: an application to the England and Wales regulated water industry. Util. policy 7 (2), 75–85. doi:10.1016/s0957-1787(98)00007-1
Cui, Q., and Li, Y. (2018). Airline dynamic efficiency measures with a dynamic RAM with unified natural and managerial disposability. Energy Econ. 75, 534–546. doi:10.1016/j.eneco.2018.09.016
di Cicco, M. R., Spagnuolo, A., Masiello, A., Vetromile, C., Nappa, M., Corbo, G., et al. (2019). Assessing energy performance and critical issues of a large wastewater treatment plant through full-scale data benchmarking. Water Sci. Technol. 80 (8), 1421–1429. doi:10.2166/wst.2019.392
Dong, X., Du, X., Li, K., Zeng, S., and Bledsoe, B. P. (2018). Benchmarking sustainability of urban water infrastructure systems in China. J. Clean. Prod. 170, 330–338. doi:10.1016/j.jclepro.2017.09.048
Dong, X., Zhang, X., and Zeng, S. (2017). Measuring and explaining eco-efficiencies of wastewater treatment plants in China: an uncertainty analysis perspective. Water Res. 112, 195–207. doi:10.1016/j.watres.2017.01.026
Feng, Y., Chiu, Y., and Liu, F. (2019). Measuring the performance of wastewater treatment in China. Appl. Sci. 9 (1), 153. doi:10.3390/app9010153
Feng, Z., Liu, X., Wang, L., Wang, Y., Yang, J., Wang, Y., et al. (2022). Comprehensive efficiency evaluation of wastewater treatment plants in northeast Qinghai–Tibet Plateau using slack–based data envelopment analysis. Environ. Pollut. 311, 120008. doi:10.1016/j.envpol.2022.120008
Fuentes, R., Molinos-Senante, M., Hernández-Sancho, F., and Sala-Garrido, R. (2020). Analysing the efficiency of wastewater treatment plants: the problem of the definition of desirable outputs and its solution. J. Clean. Prod. 267, 121989. doi:10.1016/j.jclepro.2020.121989
Fuentes, R., Torregrosa-Martí, T., and Hernández-Sancho, F. (2017). Productivity of wastewater treatment plants in the Valencia Region of Spain. Util. Policy 46, 58–70. doi:10.1016/j.jup.2017.04.004
Furness, M., Bello-Mendoza, R., Dassonvalle, J., and Chamy-Maggi, R. (2021). Building the ‘Bio-factory’: a bibliometric analysis of circular economies and Life Cycle Sustainability Assessment in wastewater treatment. J. Clean. Prod. 323, 129127. doi:10.1016/j.jclepro.2021.129127
Gasperi, J., Gromaire, M.-C., Kafi, M., Moilleron, R., and Chebbo, G. (2010). Contributions of wastewater, runoff and sewer deposit erosion to wet weather pollutant loads in combined sewer systems. Water Res. 44 (20), 5875–5886. doi:10.1016/j.watres.2010.07.008
Gémar, G., Gómez, T., Molinos-Senante, M., Caballero, R., and Sala-Garrido, R. (2018). Assessing changes in eco-productivity of wastewater treatment plants: the role of costs, pollutant removal efficiency, and greenhouse gas emissions. Environ. Impact Assess. Rev. 69, 24–31. doi:10.1016/j.eiar.2017.11.007
Gómez, T., Gémar, G., Molinos-Senante, M., Sala-Garrido, R., and Caballero, R. (2017). Assessing the efficiency of wastewater treatment plants: a double-bootstrap approach. J. Clean. Prod. 164, 315–324. doi:10.1016/j.jclepro.2017.06.198
He, Y., Zhu, Y., Chen, J., Huang, M., Wang, P., Wang, G., et al. (2019). Assessment of energy consumption of municipal wastewater treatment plants in China. J. Clean. Prod. 228, 399–404. doi:10.1016/j.jclepro.2019.04.320
Hernández-Chover, V., Bellver-Domingo, Á., and Hernández-Sancho, F. (2018). Efficiency of wastewater treatment facilities: the influence of scale economies. J. Environ. Manag. 228, 77–84. doi:10.1016/j.jenvman.2018.09.014
Hernández-Chover, V., Castellet-Viciano, L., Fuentes, R., and Hernández-Sancho, F. (2023). Circular economy and efficiency to ensure the sustainability in the wastewater treatment plants. J. Clean. Prod. 384, 135563. doi:10.1016/j.jclepro.2022.135563
Hernández-Sancho, F., Molinos-Senante, M., and Sala-Garrido, R. (2011). Energy efficiency in Spanish wastewater treatment plants: a non-radial DEA approach. Sci. Total Environ. 409 (14), 2693–2699. doi:10.1016/j.scitotenv.2011.04.018
Hospido, A., Moreira, M. T., and Feijoo, G. (2008). A comparison of municipal wastewater treatment plants for big centres of population in Galicia (Spain). Int. J. Life Cycle Assess. 13, 57–64. doi:10.1007/s11367-007-0314-8
Hu, W., Guo, Y., Tian, J., and Chen, L. (2019). Eco-efficiency of centralized wastewater treatment plants in industrial parks: a slack-based data envelopment analysis. Resour. Conservation Recycl. 141, 176–186. doi:10.1016/j.resconrec.2018.10.020
Hu, Z., Yan, S., Yao, L., and Moudi, M. (2018). Efficiency evaluation with feedback for regional water use and wastewater treatment. J. hydrology 562, 703–711. doi:10.1016/j.jhydrol.2018.05.032
Ilangkumaran, M., Sasirekha, V., Anojkumar, L., Sakthivel, G., Boopathi Raja, M., Ruban Sundara Raj, T., et al. (2013). Optimization of wastewater treatment technology selection using hybrid MCDM. Manag. Environ. Qual. Int. J. 24 (5), 619–641. doi:10.1108/meq-07-2012-0053
Jiang, H., Hua, M., Zhang, J., Cheng, P., Ye, Z., Huang, M., et al. (2020). Sustainability efficiency assessment of wastewater treatment plants in China: a data envelopment analysis based on cluster benchmarking. J. Clean. Prod. 244, 118729. doi:10.1016/j.jclepro.2019.118729
Khalkhali, M., and Mo, W. (2020). The energy implication of climate change on urban wastewater systems. J. Clean. Prod. 267, 121905. doi:10.1016/j.jclepro.2020.121905
Li, J., Li, X., Lv, N., Yang, Y., Xi, B., Li, M., et al. (2015). Quantitative assessment of groundwater pollution intensity on typical contaminated sites in China using grey relational analysis and numerical simulation. Environ. earth Sci. 74, 3955–3968. doi:10.1007/s12665-014-3980-4
Li, X., Sun, X. X., and Su, S. P. (2017). Measurement of emission reduction efficiency of sewage services in Chinese counties based on DEA-Tobit model. Resour. Sci. 39 (03), 451–460. doi:10.18402/resci.2017.03.07
Liu, W. Q. (2023). Analysis of the causes and countermeasures of low influent con--centration in typical urban sewage treatment plants in South China. Nanchang: Nanchang University.
Lizot, M., Goffi, A. D. S., Thesari, S. S., et al. (2021). Multi-criteria methodology for selection of sewage treatment systems with economic, social, technical and environmental aspects. Environ. Dev. Sustain. 1 (1), 1–18. doi:10.1007/s10668-020-00906-8
Lofrano, G., and Brown, J. (2010). Wastewater management through the ages: a history of mankind. Sci. Total Environ-ment 408 (22), 5254–5264. doi:10.1016/j.scitotenv.2010.07.062
Longo, S., Hospido, A., Lema, J. M., and Mauricio-Iglesias, M. (2018). A systematic methodology for the robust quantification of energy efficiency at wastewater treatment plants featuring Data Envelopment Analysis. Water Res. 141, 317–328. doi:10.1016/j.watres.2018.04.067
Mao, Z., Xue, X., Tian, H., and Michael, A. U. (2019). How will China realize SDG 14 by 2030?A case study of an institutional approach to achieve proper control of coastal water pollution. J. Environ. Manag. 230, 53–62. doi:10.1016/j.jenvman.2018.09.028
Maziotis, A., Sala-Garrido, R., Mocholi-Arce, M., and Molinos-Senante, M. (2023). A comprehensive assessment of energy efficiency of wastewater treatment plants: an efficiency analysis tree approach. Sci. Total Environ. 885, 163539. doi:10.1016/j.scitotenv.2023.163539
Morita, H., and Avkiran, N. K. (2009). Selecting inputs and outputs in data envelopment analysis by designing statistical experiments (< Special Issue> Operations Research for Performance Evaluation). J. Operations Res. Soc. Jpn. 52 (2), 163–173. doi:10.15807/jorsj.52.163
Pan, D., Hong, W., and Kong, F. (2020). Efficiency evaluation of urban wastewater treatment: evidence from 113 cities in the yangtze river economic belt of China. J. Environ. Manag. 270, 110940. doi:10.1016/j.jenvman.2020.110940
Quadros, S., João Rosa, M., Alegre, H., and Silva, C. (2010). A performance indicators system for urban wastewater treatment plants. Water Sci. Technol. 62 (10), 2398–2407. doi:10.2166/wst.2010.526
Ren, F., Sun, Y., Liu, J., Chen, K., and Shi, N. (2022). A modified dynamic DEA model to assess the wastewater treatment efficiency: perspective from Yangtze River and Non-Yangtze River Basin. Sci. Rep. 12 (1), 9931. doi:10.1038/s41598-022-14105-0
Shi, Y., Guo, S., and Sun, P. (2017). The role of infrastructure in China’s regional economic growth. J. Asian Econ. 49, 26–41. doi:10.1016/j.asieco.2017.02.004
Silva, C., Matos, J. S., and Rosa, M. J. (2016). Performance indicators and indices of sludge management in urban sewage treatment plants. J. Environ. Manag. 184, 307–317. doi:10.1016/j.jenvman.2016.09.056
Sun, Y., Ren, F., Liu, J., Shi, N., Wang, H., and You, X. (2021). Evaluation of wastewater pollution and treatment efficiencies in China during urbanization based on dynamic exogenous variable data envelopment analysis. Front. Environ. Sci. 9, 585718. doi:10.3389/fenvs.2021.585718
Thanassoulis, E. (2000). The use of data envelopment analysis in the regulation of UK water utilities: water distribution. Eu-ropean J. Operational Res. 126 (2), 436–453. doi:10.1016/s0377-2217(99)00303-3
Tobin, J. (1958). Estimation of relationships for limited dependent variables. Econometrica 26 (1), 24–36. doi:10.2307/1907382
Tone, K. (2001). A slacks-based measure of efficiency in data envelopment analysis. Eur. J. operational Res. 130 (3), 498–509. doi:10.1016/s0377-2217(99)00407-5
Tone, K. (2002). A slacks-based measure of super-efficiency in data envelopment analysis. Eur. J. operational Res. 143 (1), 32–41. doi:10.1016/s0377-2217(01)00324-1
Torregrossa, D., Leopold, U., Hernández-Sancho, F., and Hansen, J. (2018). Machine learning for energy cost modelling in wastewater treatment plants. J. Environ. Manag. 223, 1061–1067. doi:10.1016/j.jenvman.2018.06.092
van Daal, P., Gruber, G., Langeveld, J., Muschalla, D., and Clemens, F. (2017). Performance evaluation of real time control in urban wastewater systems in practice: review and perspective. Environ. Model. and Softw. 95, 90–101. doi:10.1016/j.envsoft.2017.06.015
Wang, L. T., Liu, Z. R., et al. (2020). Progress of soil pollution risk assessment research. China Environ. Manage-ment 12 (02), 62–68. doi:10.16868/j.cnki.1674-6252.2020.02.062
Wang, M., Huang, Y., and Li, D. (2021). Assessing the performance of industrial water resource utilization systems in China based on a two-stage DEA approach with game cross efficiency. J. Clean. Prod. 312, 127722. doi:10.1016/j.jclepro.2021.127722
Wang, S., Qiu, S., Ge, S., Liu, J., and Peng, Z. (2018). Benchmarking Toronto wastewater treatment plants using DEA window and Tobit regression analysis with a dynamic efficiency perspective. Environ. Sci. Pollut. Res. 25, 32649–32659. doi:10.1007/s11356-018-3202-9
Wang, W., Deng, Y. S., et al. (2022). The new round of technological revolution and China's urbanization from 2020 to 2050, Impacts, prospects and strategies. Manag. World 38 (11), 12–28. doi:10.19744/j.cnki.11-1235/f.2022.0156
Wu, G., Hong, J., Li, D., and Wu, Z. (2019). Efficiency assessment of pollutants discharged in urban wastewater treatment: evidence from 68 key cities in China. J. Clean. Prod. 233, 1437–1450. doi:10.1016/j.jclepro.2019.06.012
Wu, G., Hong, J., Tian, Z., Zeng, Z., and Sun, C. (2021). Assessing the total factor performance of wastewater treatment in China: a city-level analysis. Sci. Total Environ. 758, 143324. doi:10.1016/j.scitotenv.2020.143324
Wu, G., Miao, Z., Shao, S., Jiang, K., Geng, Y., et al. (2018). Evaluating the construction efficiencies of urban wastewater transportation and treatment capacity: evidence from 70 megacities in China. Resour. Conservation Recycl. 128, 373–381. doi:10.1016/j.resconrec.2016.08.020
Yang, F., Wang, D., Zhao, L., and Wei, F. (2021). Efficiency evaluation for regional industrial water use and wastewater treatment systems in China: a dynamic interactive network slacks-based measure model. J. Environ. Manag. 279, 111721. doi:10.1016/j.jenvman.2020.111721
Yang, J., and Chen, B. (2021). Energy efficiency evaluation of wastewater treatment plants (WWTPs) based on data envelopment analysis. Appl. Energy 289, 116680. doi:10.1016/j.apenergy.2021.116680
Zeng, S., Chen, X., Dong, X., and Liu, Y. (2017). Efficiency assessment of urban wastewater treatment plants in China: considering greenhouse gas emissions. Resour. Conservation Recycl. 120, 157–165. doi:10.1016/j.resconrec.2016.12.005
Zhang, Z., Li, Y., Wang, X., Xu, Y., Liao, Y., Wan, Z., et al. (2021). Investigating the spatiotemporal dynamic evolution and driving factors of wastewater treatment efficiency in the context of China’s River Chief system. Ecol. Indic. 129, 107991. doi:10.1016/j.ecolind.2021.107991
Keywords: sustainable development, urban wastewater treatment, pure technical efficiency, scale efficiency, shunt pipeline, superefficiency SBM-Tobit model
Citation: Tao T, Zhang H and Hu Z (2024) A study on the measurement and influencing factors of the urban wastewater treatment efficiency in China based on the superefficiency SBM-Tobit model. Front. Environ. Sci. 12:1416269. doi: 10.3389/fenvs.2024.1416269
Received: 12 April 2024; Accepted: 28 August 2024;
Published: 12 September 2024.
Edited by:
Cristina Matos, University of Trás-os-Montes and Alto Douro, PortugalReviewed by:
Zhengxian Zhang, Wuhan University, ChinaGuangyao Deng, Lanzhou University of Finance and Economics, China
Copyright © 2024 Tao, Zhang and Hu. This is an open-access article distributed under the terms of the Creative Commons Attribution License (CC BY). The use, distribution or reproduction in other forums is permitted, provided the original author(s) and the copyright owner(s) are credited and that the original publication in this journal is cited, in accordance with accepted academic practice. No use, distribution or reproduction is permitted which does not comply with these terms.
*Correspondence: Hao Zhang, emhhbmdoYW9uY3VAMTI2LmNvbQ==