 Xu Yang
 Shike Qiu1*
 Jun Du
- 1Institute of Geographical Sciences, Henan Academy of Sciences, Zhengzhou, China
- 2The Second Topographic Surveying Brigade of Ministry of Natural Resources of the People’s Republic of China, Xi’an, China
In recent years, non-point source pollution (NPSP) has become prominent in the Yellow River Basin (YRB) of China and seriously affects human survival and sustainable development. The Henan section was selected as an example region of the YRB in China, and the Integrated Valuation of Ecosystem Services and Tradeoffs (InVEST) model has been used to quantitatively evaluate nitrogen (N) and phosphorus (P). The results show that (1) the cultivated land (CL), grassland (GL), and unused land (UL) decreased, while forest land (FL), water areas (WAs), and built-up areas (BAs) increased in 2000–2020, and precipitation increased from the northeast to the southwest in 2000–2020; (2) the N export was much more than P export in 2000, 2010, and 2020, and the N and P exports increased in 2000–2020; the spatial distribution of N and P export changes was different in the whole basin in 2000–2010, 2010–2020, and 2000–2020; (3) the N and P exports decreased in 2000–2010, 2010–2020, and 2000–2020 with increasing precipitation; and (4) the N and P exports on CL and BAs were more than those on the other land-use types, and the overall change trends of N and P exports on all land-use types increased from 2000 to 2020.
1 Introduction
Non-point source pollution (NPSP) involves dissolved or solid state pollutants, sinking into water areas (WAs) through the runoff process and leading to eutrophication or other forms of soil pollution. NPSP (nitrogen, phosphorus, etc.) is an important issue in water environmental protection and a focus issue of society (Ongley et al., 2010; Collick et al., 2015), endangering the ecological environment and threatening human health (Shen et al., 2012). The problem of NPSP in China is very prominent (Ongley et al., 2010), resulting in the weakening of the capacity of ecosystem services for human survival and socio-economic development (Zhang and Fu, 2014; Defries and Nagendra, 2017). In the National Water Resources Planning organized and prepared by the Ministry of Water Resources in 2000, it was estimated that NPSP has become one of the main sources of pollution in WAs, and the amount of nitrogen (N) and phosphorus (P) pollutants accounted for 40%–60% of the total amount of pollution entering the river (Li et al., 2010). In recent years, the Chinese government has increasingly paid more attention to the protection of the ecological environment and the management of NPSP. China’s relevant laws and regulations and policy documents, along with major science and technology projects in ecological environmental protection outlined in China’s “13th and 14th Five-Year Plans,” indicate that China’s NPSP problem is serious and needs to be studied in depth. However, it is more difficult to study and manage NPSP in China; the reasons include the vast territory, complex natural conditions, and the insufficient monitoring network, technology, and method. Therefore, clarifying NPSP is of great significance to the human survival and socio-economic development of China.
In 2019, the Chinese President Xi Jinping set a major national strategy for Yellow River Basin (YRB). President Xi pointed out that there are still some difficulties and problems in the YRB, including the fragile ecological environment of the basin, serious situation of water resource security, and pollution control (Xi, 2019). Water pollution in the YRB mainly originates from NPSP, which is more serious in nine provinces of China through which the YR flows (Tao et al., 2021). The Henan section of the YRB has prominent ecological, economic, and cultural functions, encompassing water conservation areas, beach areas, irrigation areas, and floodplains. According to the Water Resources Bulletin published by the Yellow River Conservancy Commission and Water Resources Department of Henan Province in 2020, the area of the Henan section of the YRB accounts for 4.55% of the total area of the YRB and the water supply is 4.2 × 10⁹ m3 and accounts for 13.78% of the total amount of water from the YR; however, 14 municipal districts of Henan Province use the water from the YR, and the water consumption accounts for 14.97% of the total amount of water from the YR. Therefore, the health, stability, and safety of the water ecosystem in the Henan section of the YRB have a crucial impact on the socio-economic development and life of residents. With increasing population and rapid development of the Henan Province, the NPSP is increasing (Gu et al., 2012; Huang et al., 2019), making an important issue of control and management of NPSP. Therefore, conducting research on NPSP in the Henan section of the YRB contributes to the ecological security and sustainable development and responds to the major national strategy of the YRB.
The assessment of NPSP is important for water resource protection and management and can help in decision-making (Terrado et al., 2014); however, its quantitative assessment is difficult due to the complexity of NPSP. Chinese researchers developed some NPSP models at the regional scale in China; however, these models have only been applied in a few specific areas of China, and their stability and applicability need more proof. Now, there are some methods to assess NPSP, including mathematical models and modular integrated models. The mathematical models include the single-factor method (Hao et al., 2020), integrated evaluation method (Ma and Liu, 2014), backpropagation (BP) neural network method (Sinshaw et al., 2019), support vector machine (Li et al., 2021), average concentration method (Wu et al., 2018), hydrological separation method (Zhu et al., 2019), NPSP load–sediment relationship method (Li and Cai, 2003), water quality–quantity relationship method (Yoon et al., 2015), improved export coefficient method (Wu et al., 2015), rainfall or runoff difference method (Cai et al., 2004; Xu, 2007), NPSP estimation method for sandy rivers (Li et al., 2008), integrated average concentration and export coefficient method (Ongley et al., 2010), land use–NPSP relationship method (Maillard and Santos, 2008), and universal soil loss equation (USLE) (Li et al., 2019). These methods are needed to set up a large number of permanent and temporary monitoring points for sampling and analysis, so these methods need a lot of human, material, and financial resources, resulting in low work efficiency, long evaluation cycles, and poor real-time evaluation results. The evaluation results are mostly from a microscopic perspective and do not reflect the macroscopic pollution status. However, with the development of the geographic information system (GIS) and remote sensing (RS), the modular integrated models begin to emerge with low-cost, rapid, large-scale monitoring of NPSP, and can discover the spatio-temporal distribution characteristics and migration patterns of pollutants. The modular integrated models include the Soil and Water Assessment Tool (SWAT) (FitzHugh and Mackay, 2000), Integrated Valuation of Ecosystem Services and Tradeoffs (InVEST) (Huang et al., 2022), storm water management model (SWMM) (Lee et al., 2022), Water Erosion Prediction Project (WEEP) (Yeghiazarian and Montemagno, 2001), Annualized Agricultural Non-Point Source Pollution Model (AnnAGNPS) (Zhang et al., 2020), MIKE Système Hydrologique Européen (MIKE SHE) (Hou et al., 2021), geomorphology-based non-point source pollution model (GBNP) (Wang et al., 2016), Hydrological Simulation Program-Fortran (HSPF) (Wang et al., 2015), model of rainfall-runoff and NPSP (Han et al., 2011), binary-structure model (Hong et al., 2012a), Distributed Time–Variant Gain Hydrological Model (DTVGM) (Zhao et al., 2019), and Areal Nonpoint Source Watershed Environment Response Simulation Model (ANSWERS) (Bouraoui and Dillaha, 2000). Overall, these models have different mechanisms and expertise in simulating pollutants, and direct applications of foreign-developed NPSP models in China may cause errors due to the significant regionality. Therefore, considering easy access to data, less input data and parameters, and well local adaptation, the InVEST model is very appropriate to study NSPS, and this model has been used to assess NSPS in China and other countries (Redhead et al., 2018; Bai et al., 2019; Yang et al., 2019; Qi et al., 2020; Liang et al., 2021; Wu et al., 2021).
In order to explore the status of N and P pollution and the effects of precipitation and land use on N and P pollution in the YRB, the Henan section of the YRB was selected as the study region, and N and P exports were simulated and analyzed. The major objectives are to determine (1) the spatio-temporal changes of N and P exports and (2) the impact of precipitation and land-use changes on N and P exports. The combination of GIS, RS, and InVEST model in this study provides new ideas for the quantitative assessment of N and P pollution in areas with limited data and can efficiently assess a large scale of N and P pollution, contributing to regional control suggestions.
2 Study region
The Henan section of the YRB (34°34′N-36°08′N and 110°22′E−116°07′E) is located on the middle and low reaches of the YRB (Figure 1), and the Taohuayu of Zhengzhou City is the dividing point of middle and lower reaches. The area is 3.62 × 10⁴ km2, which accounts for 4.6% and 22.0% of the total area of the YRB and Henan Province (Qin et al., 2022). The study region mainly covers with the north and west parts of the Henan Province with an irrigation area of 318.67×10⁴ km2 (Hu et al., 2022). The Henan section of the YRB is a region of intense human activities, with an average population density of 482 person/km2 and a maximum population density of 1.08×10⁴ person/km2, which is comparable to the population density of developed eastern regions of China (Xu, 2017; Qin et al., 2022). The study region is located in the warm temperate zone and subtropical transition zone, with plains to hilly and mountainous climate transition characteristics, mainly controlled by the atmospheric circulation of the westerly wind belt. The annual temperature is between 10.5°C and 16.7°C, and the annual precipitation is between 407.7 and 1295.8 mm.
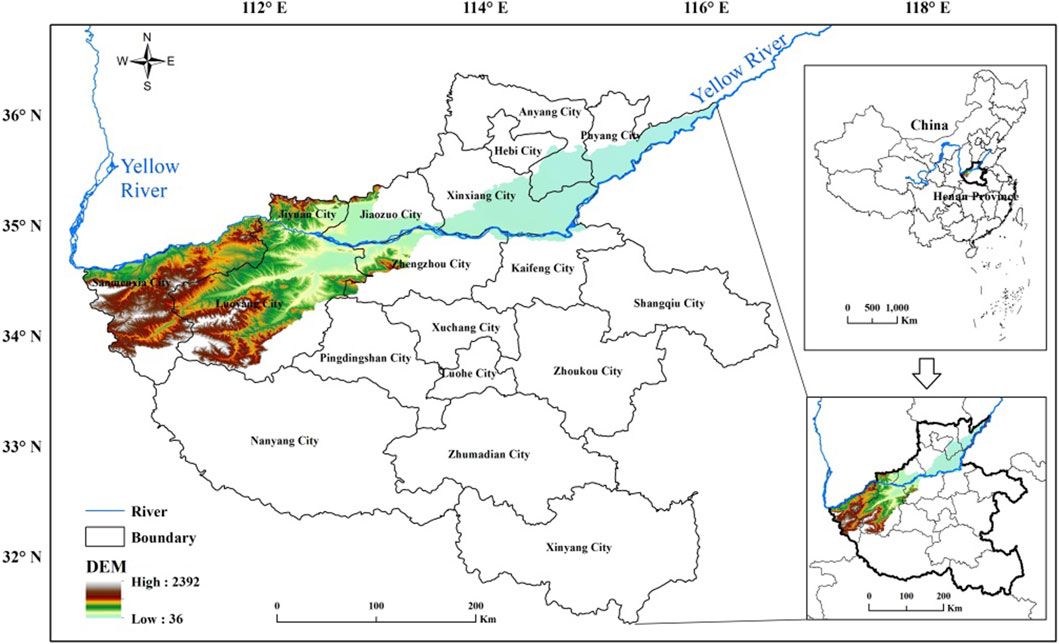
Figure 1. Geographical location of the Henan section of the Yellow River Basin.
3 Materials and methods
3.1 Data source and pretreatment
The datasets include the digital elevation model (DEM), land use and precipitation, and watershed. The 90-m resolution DEM was obtained from the United States Geological Survey (USGS) (https://earthexplorer.usgs.gov/). The 1-km resolution land use was obtained from the Resource Environmental Science and Data Center of Chinese Academy of Sciences (https://www.resdc.cn/). The low-resolution, long-time scale precipitation data were obtained from the Climate Research Unit of the East Anglia University of the United Kingdom (https://crudata.uea.ac.uk/cru/data/hrg/), and high-resolution, short-time scale precipitation data were obtained from the World Climate Data Network (http://www.worldclim.org/). The watershed was obtained from the DEM data using ArcSWAT software. The parameters of the InVEST model including load, efficiency, and critical length were obtained from the relevant studies (Xia et al., 2020; Fang et al., 2021; Long, 2022; Yu, 2022) and InVEST user’s guide, and we adjust these parameters with using sensitivity analysis.
Due to few meteorological stations and low-resolution data assimilation products, we selected the Delta method to improve the data resolution after analysis and comparison (Getirana et al., 2011; Liu et al., 2011; Mahmood and Babel, 2013). The Delta method is the more commonly used downscaling method, which uses the long time series, low-resolution monthly scale meteorological data and the high-resolution reference meteorological data to obtain the long time series, high-resolution monthly scale meteorological data. First, the low-resolution precipitation data on the desired month are selected, and the low-resolution outlier is obtained from the monthly scale precipitation dij of the desired year divided by the average of the summed monthly scale precipitation Daj for the same month at the reference annual scale; then, this low-resolution outlier eij is interpolated into the high-resolution outlier; finally, the high-resolution outlier Eij is summed with the average of the summed monthly scale precipitation Daj for the same month at the reference annual scale to obtain the high-resolution precipitation data Pij of the desired month. The calculation formula is as follows Eqs 1, 2:
where i is the series value at an annual time scale, a is the reference time period, j is the series value at a monthly scale, dij is the long time series and low-resolution precipitation data, Daj is the long time series and high-resolution reference precipitation data, eij is the low-resolution outlier, and Eij is the high-resolution outlier obtained by interpolation of eij.
3.2 Research methods
3.2.1 InVEST model
The nutrient delivery ratio (NDR) component of the InVEST model is designed to map the source and transport process of nutrients across a basin. The NDR estimates the quantity of N and P at each watershed in the area of interest. The NDR component uses the mass conservation method to simulate the transfer of nutrients in space. The equations to determine nutrients are as follows Eqs 3, 4:
where Xexpton is the total export amount of nutrients in the river basin (kg/yr) and Xexpi is the export amount of each grid of nutrients (kg/yr). The loadsurf,i is the surface nutrient load (kg/ha·yr-1), NDRsuf,i is the surface nutrient transfer rate, loadsubs,i is the subsurface nutrient load (kg/ha·yr-1), and NDRsubs,i is the subsurface nutrient transfer rate.
NDRsuf,i is calculated using the following equation Eqs 5–11:
where NDR0,I is the retention efficiency; IC0 and k are the correction parameters, IC0 is the terrain index, k is a non-physical parameter representing the empirical factor of terrain, and the default value is 2;
NDRsubs,i is calculated by the following equation Eq. 12:
The nutrient loads of the grid are corrected by local runoff potential using the following formula Eqs 13–16:
where modified.load(x,i) is the modified nutrient loads of the grid; RPIi is the runoff potential index of grid i; RPi is the runoff agent of grid i; and RPav is the average runoff agent of the grid.
3.2.2 Spatial analysis method
Spatial analysis has been performed using GIS and RS. The data management tools and spatial analyst tools of ArcGIS software and the change detection statistics of Environment for Visualizing Images (ENVI) software have been used to analyze and map the results of precipitation change, land-use change, spatio-temporal characteristics of N and P exports, and the impact of precipitation and land-use changes on N and P exports.
4 Results
4.1 Land-use changes in 2000–2020
The land use in the Henan section of YRB includes cultivated land (CL), forest land (FL), grassland (GL), water areas (WAs), built-up areas (BAs), and unused land (UL) in 2000, 2010, and 2020 (Figure 2). The CL makes up the majority of the area and is distributed throughout the basin; FL and GL are located in the central and western parts of the basin; WAs and BAs are scattered in the basin, with more numerous WAs in the central and western parts of the basin; and UL makes up a small portion of the basin’s area.
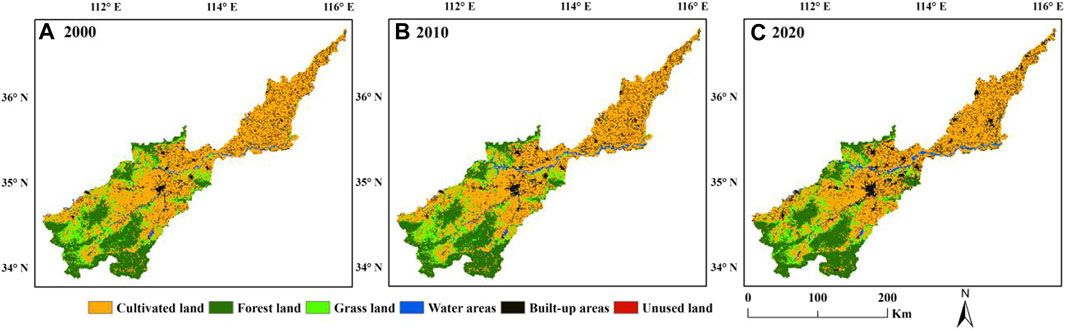
Figure 2. Spatial distribution of land use of the Henan section of Yellow River Basin in 2000 (A), 2010 (B) and 2020 (C).
The area of different land-use types of the Henan section of the YRB in 2000, 2010, and 2020 is given in Table 1. The results show that CL accounts for more than 50%, which is the largest part of the basin; FL, GL, WA, and BA are the larger parts of the basin; UL accounts for less than 1%, which is the smallest part of the basin. The CL, GL, and UL decreased with 4.98%, 8.56%, and 74.58%, respectively, while FL, WA, and BA increased with 0.58%, 27.40%, and 39.85%, respectively, during the 20 years.
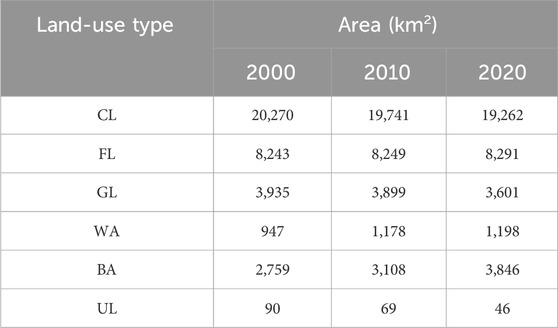
Table 1. Area of different land-use types of the Henan section of the Yellow River Basin in 2000, 2010, and 2020.
The land-use changes in 2000–2010 were the lowest, while there were more changes in 2010–2020 (Figure 3). The changes in 2000–2010 were distributed in the central and northeastern areas of the basin, and the changes in 2010–2020 were distributed in the whole basin. Over the past 20 years, there have been significant changes in land use throughout the entire basin. These are related to the acceleration of socio-economic development and population growth.
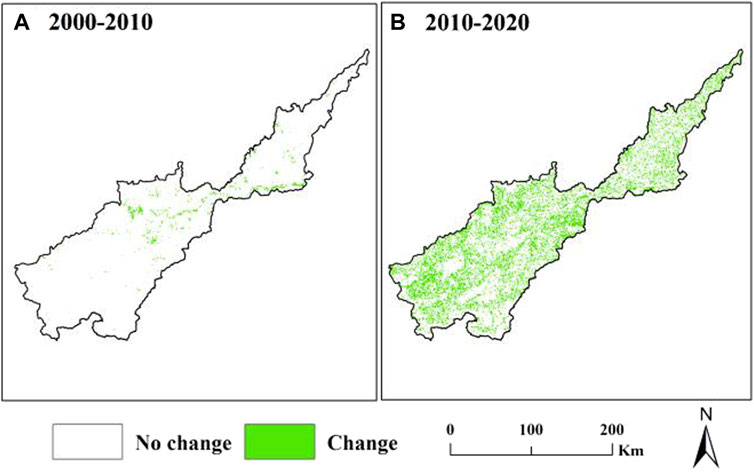
Figure 3. Spatial distribution of the land-use change of the Henan section of the Yellow River Basin in 2000–2010 (A) and 2010–2020 (B).
The land-use transfer matrices of the Henan section of the YRB in 2000–2010, 2010–2020, and 2000–2020 were calculated using ENVI software, and the transfer areas of different land use are shown in Table 2. In 2000–2010, 2010–2020, and 2000–2020, the CL converted to other land-use types with 608 km2, 4,475 km2, and 4,854 km2, respectively; the FL converted to other land-use types with 21 km2, 1281 km2, and 1275 km2, respectively; the GL converted to other land-use types with 39 km2, 2083 km2, and 2,114 km2, respectively; the WA converted to other land-use types with 77 km2, 546 km2, and 510 km2, respectively; the BA converted to other land-use types with 7 km2, 1819 km2, and 1674 km2, respectively; and the UL converted to other land-use types with 23 km2, 36 km2, and 57 km2, respectively. At the same time, other land-use types converted to CL with 79 km2, 3,996 km2, and 3,846 km2; FL with 27 km2, 1323 km2, and 1323 km2; GL with 3 km2, 1784 km2, and 1779 km2; WA with 308 km2, 567 km2, and 762 km2; BA with 356 km2, 2,557 km2, and 2,761 km2; UL with 2 km2, 13 km2, and 13 km2 in 2000–2010, 2010–2020, and 2000–2020 respectively. During the 20 years, the CL reduced by 1008 km2, FL increased by 48 km2, GL reduced by 335 km2, WA increased by 252 km2, BA increased by 1087 km2, and UL reduced by 44 km2. Agriculture is still important, the area of CL has slowed down, urbanization is increasing, reforestation projects are being stepped up, and wasteland has been developed. Although GL is decreasing, it is mainly transformed into CL, FL, and BA to serve human life and production and reforestation projects.
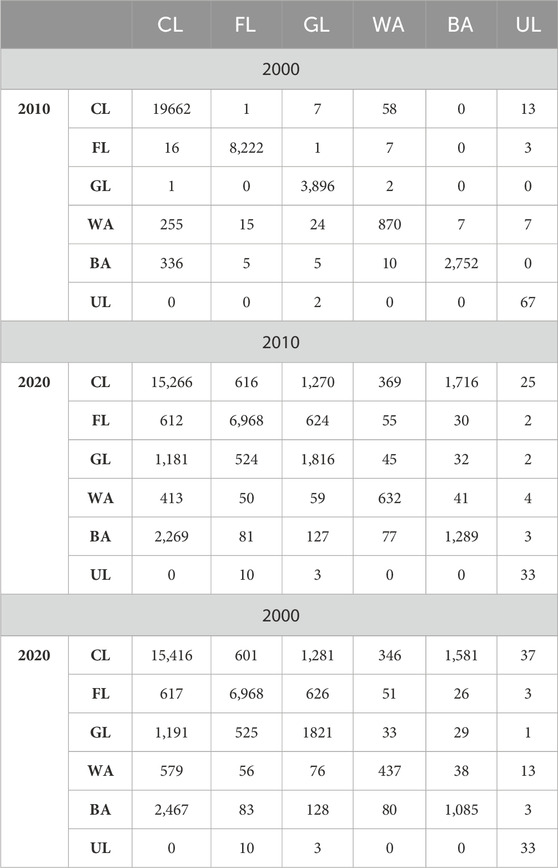
Table 2. Land-use transfer matrix of the Henan section of the Yellow River Basin in 2000–2010, 2010–2020, and 2000–2020 (unit: km2).
4.2 Precipitation changes in 2000–2020
The InVEST model needs nutrient runoff proxy as one of the input datasets, which is a map of runoff potential, indicating its capacity to transport nutrients downslope. The nutrient runoff proxy can be defined as average annual precipitation, according to the InVEST user’s guide. The average annual precipitation in the Henan section of the YRB gradually increased from the northeast to the southwest during 2000–2020 (Figure 4). This is related to the distribution of topography and land use, where most forests and mountains are in the southwest and the most plains are in the northeast (Figures 1, 2).
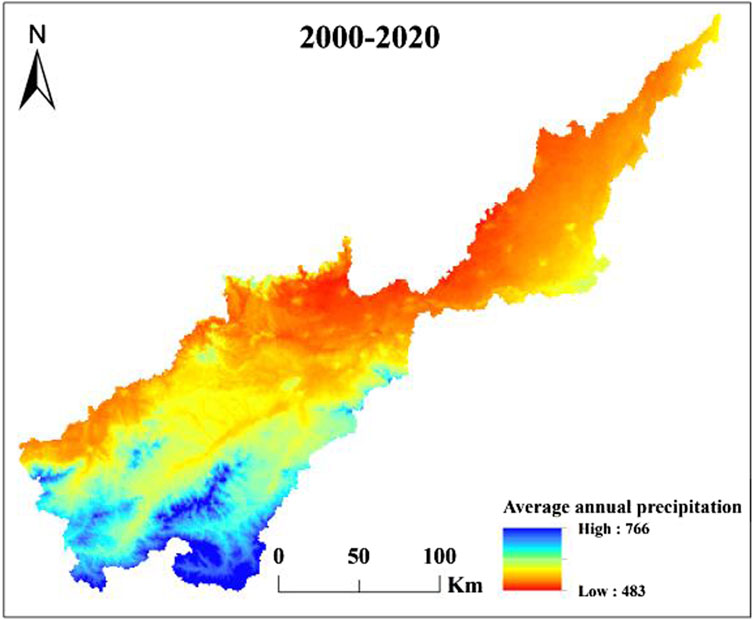
Figure 4. Spatial distribution of average annual precipitation of the Henan section of the Yellow River Basin in 2000–2020.
4.3 Spatio-temporal changes of nitrogen and phosphorus exports
The N and P exports of the Henan section of the YRB in 2000, 2010, and 2020 were calculated by the NDR module of the InVEST model (Figure 5). Although the spatial distribution characteristics of N and P exports in 2000, 2010, and 2020 were similar, the values of N and P exports still differed in different spatial locations. The maximum value of N or P export was different, and the maximum values of N export were greater than those of P export in 2000, 2010, and 2020.
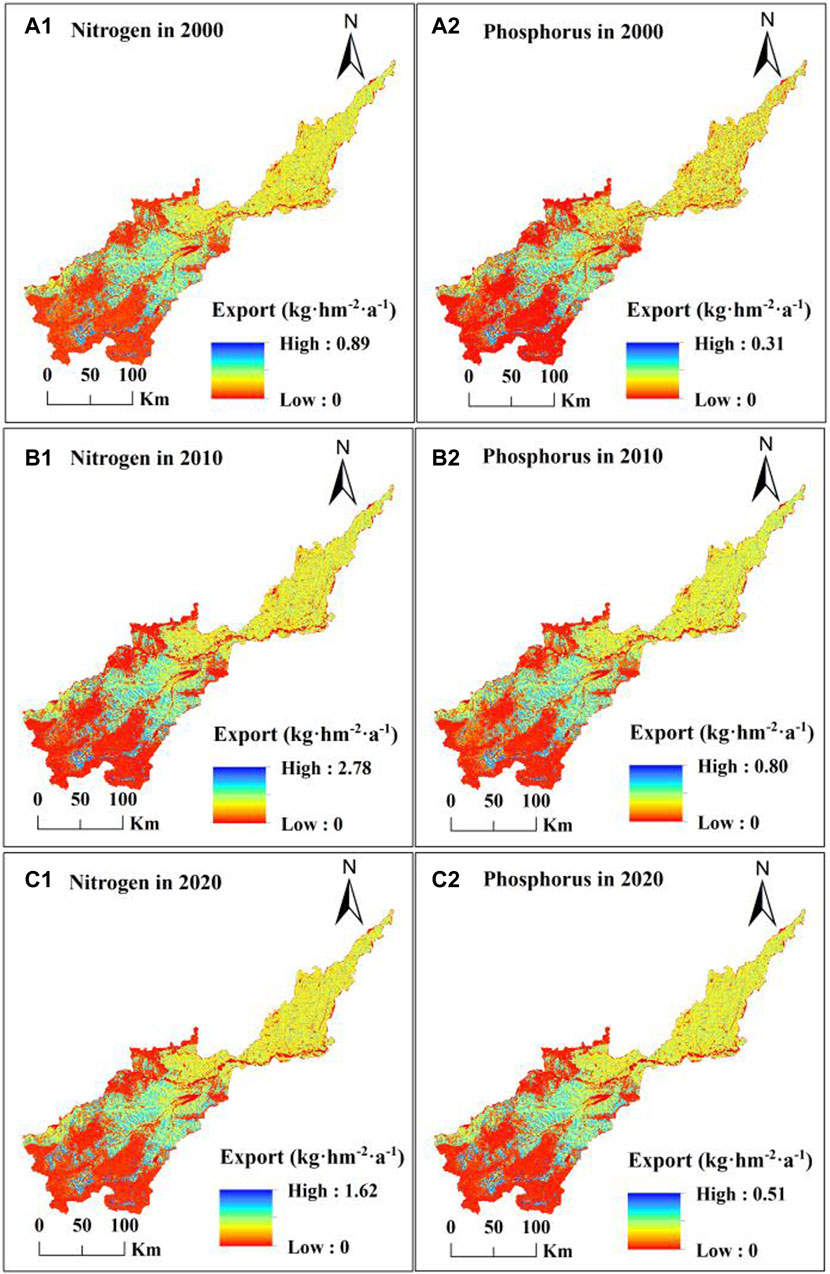
Figure 5. Spatial distribution of nitrogen export (A1, B1, and C1) and phosphorus export (A2, B2, and C2) of the Henan section of the Yellow River Basin in 2000, 2010, and 2020.
The total and average amount of N and P exports of the Henan section of the YRB were different in 2000, 2010, and 2020 (Table 3), and these results demonstrated that there were differences in spatial distribution characteristics of N or P export in Figure 5. The N export was much more than P export in 2000, 2010, and 2020. The total and average N and P exports increased in 2000–2010 and decreased in 2010–2020, reaching a maximum value in 2010, and they increased in 2000–2020. During the 20 years, the total amount of N and P exports increased with 3,982,140.07 kg, and 1,283,264.33 kg, and the average amount of N and P exports increased with 109.86 kg/km2 and 35.41 kg/km2. The 69.58% growth rate of N export was less than the 74.46% growth rate of P export in the 20 years.
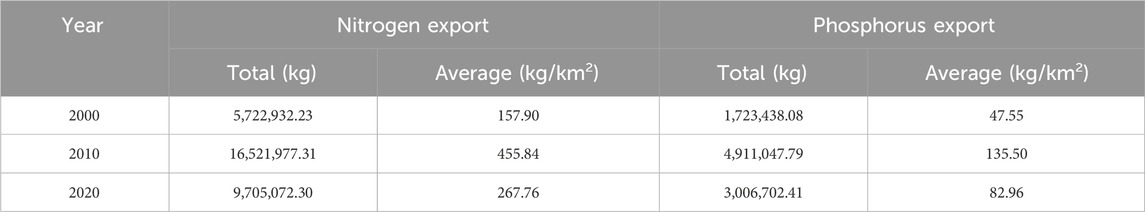
Table 3. Amount of nitrogen and phosphorus exports of the Henan section of the Yellow River Basin in 2000, 2010 and 2020.
In order to obtain the differences of the N and P export changes in different periods, the changes in N and P exports of the Henan section of the YRB in 2000–2010 and 2010–2020 were calculated (Figure 6). The spatial distribution of N and P export changes was different in two periods. The N and P exports mainly increased in 2000–2010 (Figure 6A1, B1) and decreased in 2010–2020 (Figure 6A2, B2) throughout the entire basin. The decrease in N and P exports in 2000–2010 was less than the increase in N and P exports in 2010–2020.
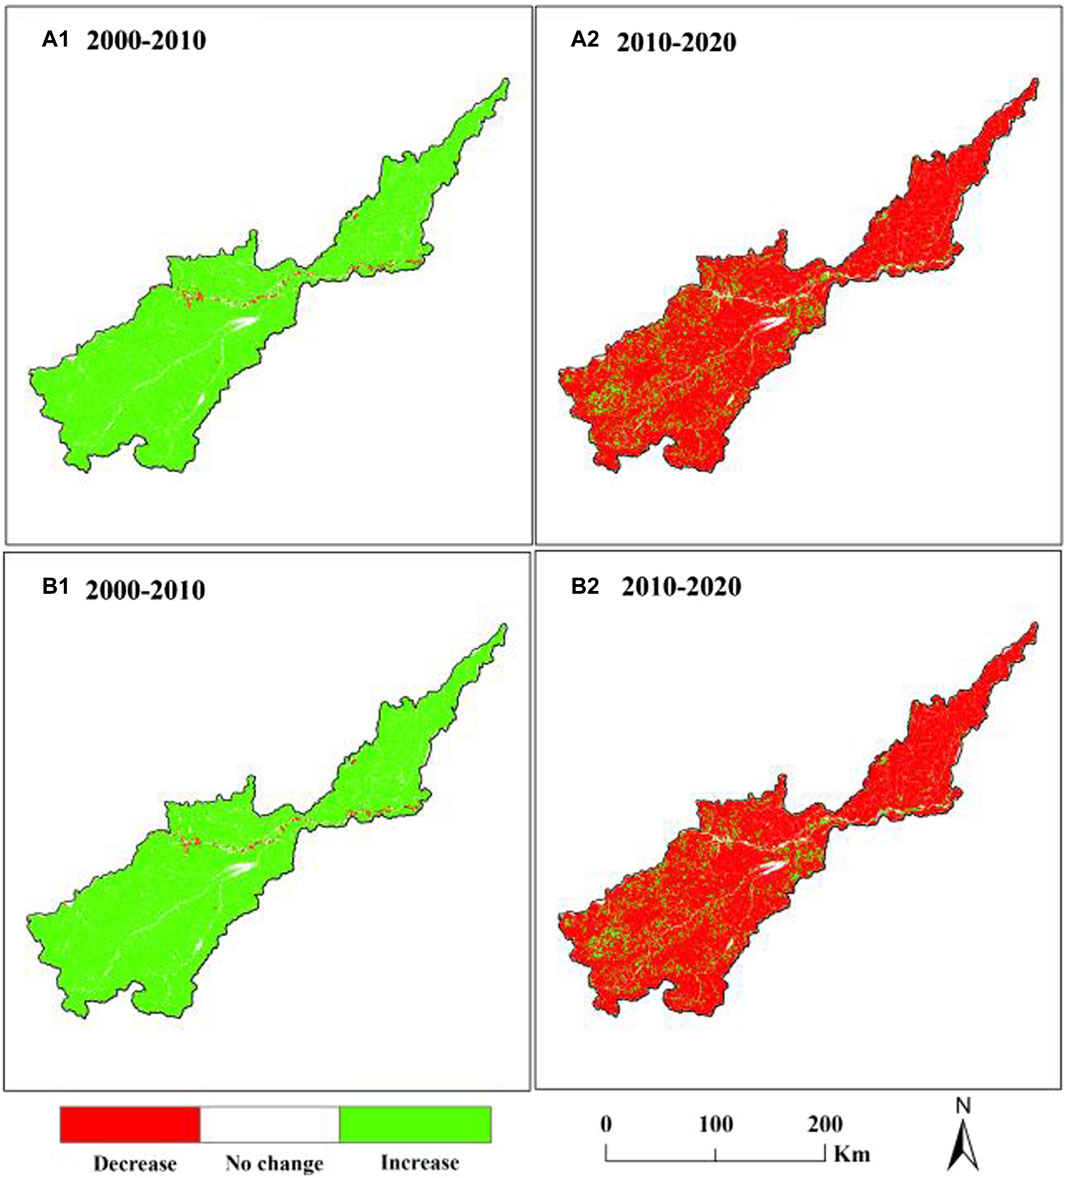
Figure 6. Spatial distribution of nitrogen (A1 and A2) and phosphorus (B1 and B2) export changes of the Henan section of the Yellow River Basin in 2000–2010 and 2010–2020.
The area of N and P export changes in the Henan section of YRB in 2000–2010 and 2010–2020 were calculated (Table 4). The no-change areas of N and P exports make up a minor part of the basin, and more decreased areas were in 2010–2020, while more increased areas were in 2000–2010. However, the increased areas decreased and the decreased areas increased between 2000–2010 and 2010–2020. The rapid socio-economic development in the decade after 2000 led to an increase in ecological pollution, and the national government did not sufficiently protect the ecological environment, while ecological pollution control was strengthened in the decade after 2010. However, the increased areas were more than the decreased or no change areas, showing that the pollution is still serious and the ecological environment needs to be treated in 20 years.
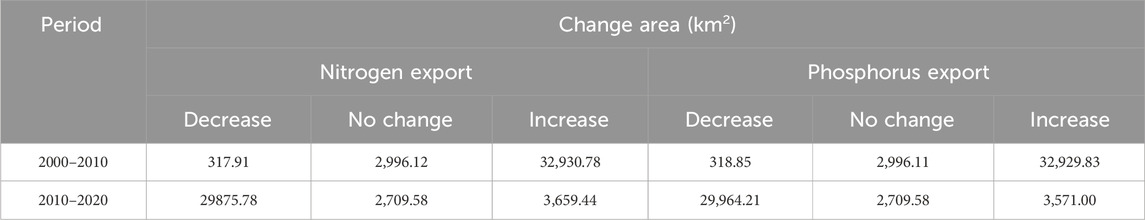
Table 4. Change areas of nitrogen and phosphorus exports of the Henan section of the Yellow River Basin in 2000–2010, 2010–2020, and 2000–2020.
4.4 The impact of precipitation and land-use changes on nitrogen and phosphorus exports
Precipitation affects the transmission process of N and P pollution, thereby indirectly affecting the amount of pollution, while land use has a direct impact on N and P pollution. Therefore, exploring the relationship between precipitation or land use and N and P pollution is helpful for ecological protection and governance, national spatial planning, and management.
The average annual precipitation was used instead of nutrient runoff proxy in the InVEST model, so average annual precipitation was selected to analyze the impact of precipitation changes on N and P exports. Since there were the same values of average annual precipitation, the average N and P exports on the same average annual precipitation were used to analyze the relationships (Figure 7). The average N export was all larger than the average P export in 2000, 2010, and 2020. The average N and P exports on average annual precipitation in 2000, 2010, and 2020 were similar. With the increase in precipitation, the average N and P exports showed a decreasing trend of fluctuating changes in three periods. However, almost all values of average N and P exports on average annual precipitation were largest in 2010 and were smallest in 2000, while a few values in 2020 were larger than those in 2010.
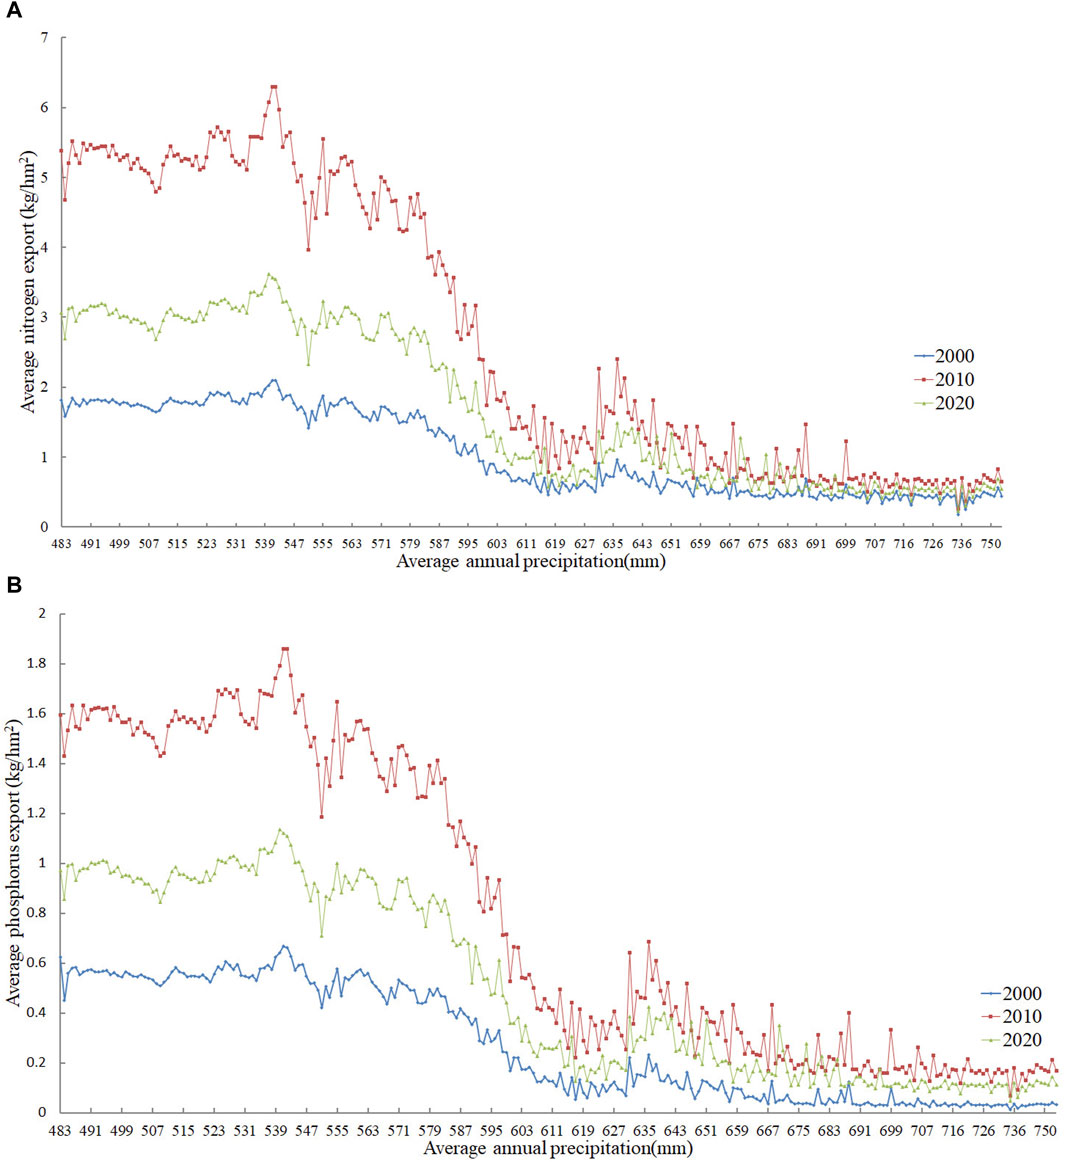
Figure 7. Average nitrogen (A) and phosphorus (B) exports on average annual precipitation of the Henan section of the Yellow River Basin in 2000, 2010, and 2020.
The change trends of average N export or average P export on average annual precipitation in 2000–2010 and 2010–2020 were similar, but they were different in two periods (Figure 8). With the increase in precipitation, the changes in average N and P exports showed a decreasing trend of fluctuating changes in two periods. The change magnitudes were larger at low precipitation and were lower at high precipitation in two periods. However, the change magnitudes were positive in 2000–2010; the change magnitudes were negative, while a few changes were positive in 2010–2020. The trend of changes in N and P exports over the past 20 years was similar to that of the previous 10 years, but the changes were not very drastic.
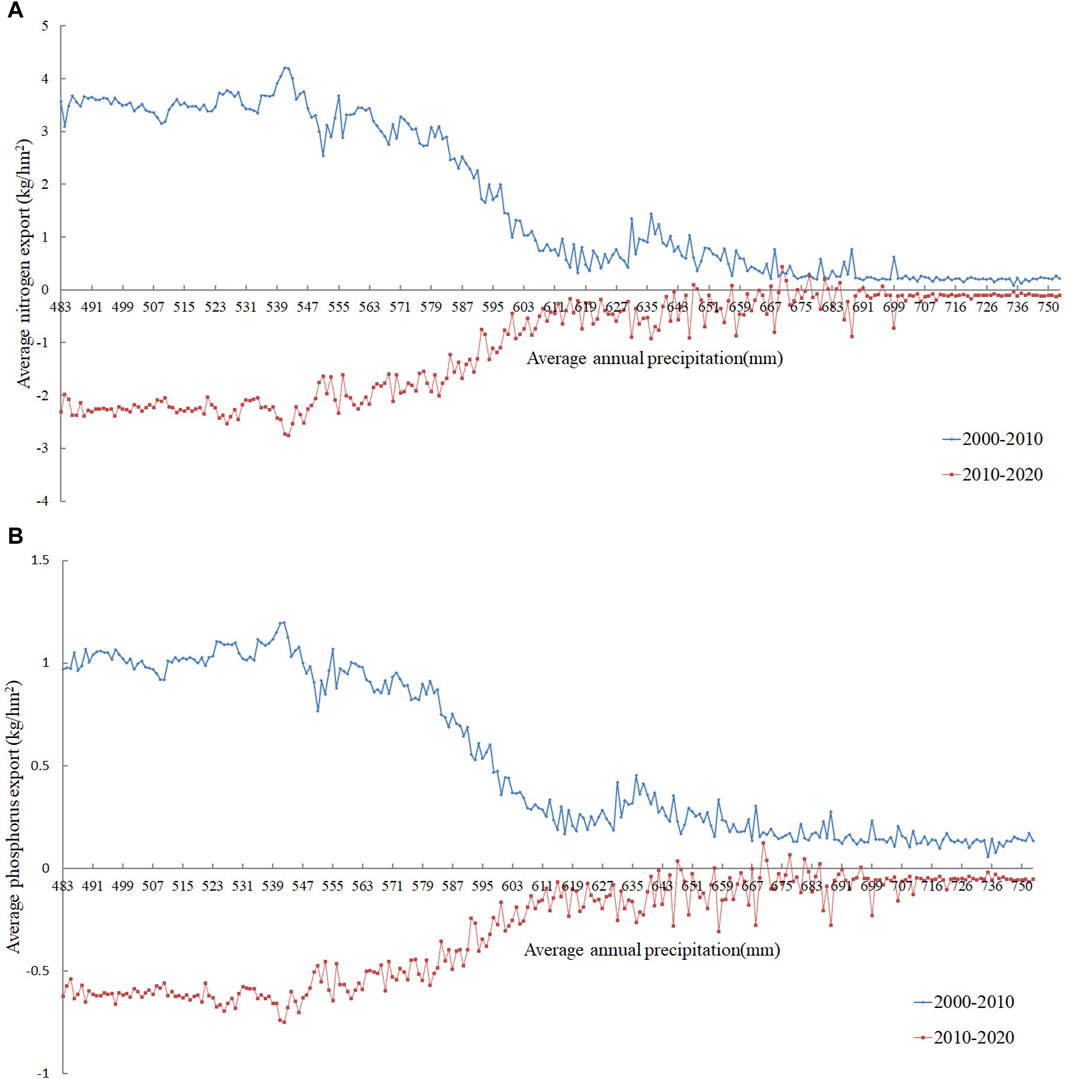
Figure 8. Change in average nitrogen (A) and phosphorus (B) exports on average annual precipitation of the Henan section of the Yellow River Basin in 2000-2010 and 2010-2020.
The N and P exports were mainly influenced by land use, and the N and P exports on different land-use types of the Henan section of the YRB in 2000, 2010, and 2020 were calculated (Table 5). The total and average amount of N and P exports made up the largest proportion on CL; a larger proportion on FL, GL, and BAs; a smaller proportion on UL; and smallest on WAs. However, the total amount of N and P exports on forest land was larger than that on GL in 3 years, while the average amount of N and P exports on FL was smaller than that on GL. In addition, the average amount of N and P exports on UL in 2020 was larger; the average amount of P export on UL was also larger than that on BAs in 2010 and 2020, while the results were the opposite in 2000. The total or average amount of N and P exports on each land-use type all first increased and then decreased, and the overall change trend all increased from 2000 to 2020.
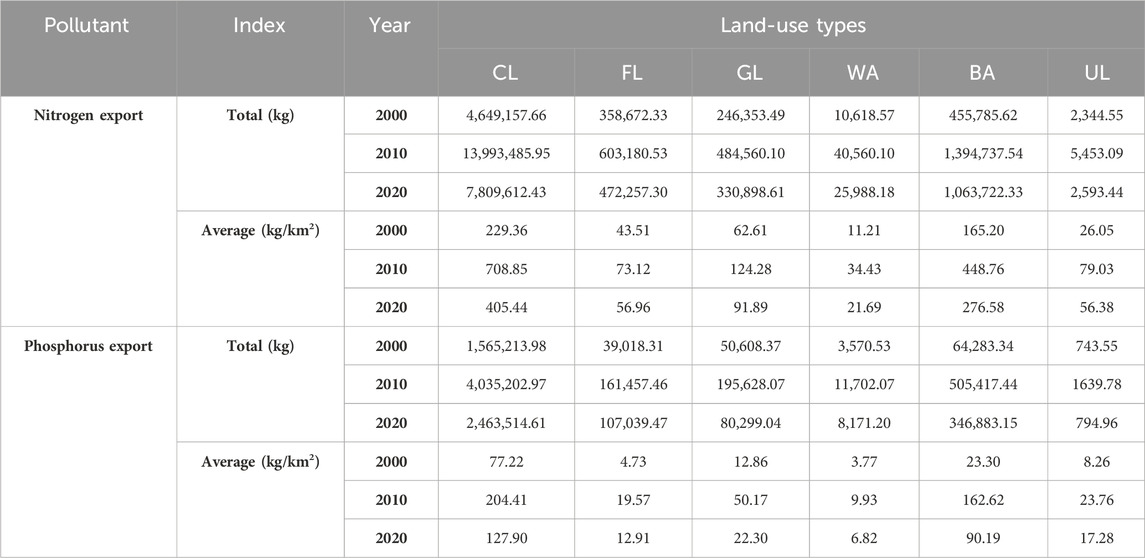
Table 5. Nitrogen and phosphorus exports on land use of the Henan section of the Yellow River Basin in 2000, 2010, and 2020.
5 Discussion
5.1 Trends and attribution of nitrogen and phosphorus pollution
According to statistical data in the China Statistical Yearbook and Henan Statistical Yearbook and the results in existing studies (Zhang et al., 2014; Tao et al., 2021; Zheng et al., 2023), the results are consistent with the findings. During the 20 years, the expanding population and rapid socio-economic development have led to higher production and living standards and increasing demand for land and food, which have increased N and P pollution. The Henan Province is the third largest area of population and is the second largest area of agricultural production in China, and the YRB in Henan Province encompasses water conservation areas, beach areas, irrigation areas, floodplains, and gathering areas of the population; these practicalities cause a large amount of N and P pollution derived from agricultural materials, industrial waste, domestic waste, aquaculture pollution, and other pollution. However, the national and local governments in China have also taken measures to control and treat NPSP to reduce pollutants including N and P. Since socio-economic development is at different stages, the control and treatment measures need time to be effective on N and P pollution, so the N and P pollution will neither be eliminated immediately nor is it likely to be completely eliminated. The rapid socio-economic development and insufficient governance in 2000–2010 led to increased N and P pollution; however, the government increased the control and treatment of NPSP after 2010, and the socio-economic development still continues, so the N and P exports in 2010 are the most, and the N and P exports in 2020 are heavier than those in 2000.
The causes of N and P exports are complex; the precipitation and land use were selected as the impact factors in this study, considering the input dataset and actual situation. These indicate that there is an inverse relationship between precipitation and N and P exports. However, if these results are further combined with the topography and land use of the study region in Figures 1, 2, it can be found that small precipitation is widely distributed in plain areas with more CL and BA, and large precipitation is widely distributed in mountainous areas with more FL and GL. These show that the N and P exports are more closely related to land use, which is consistent with existing studies (Hoyer and Chang, 2014; Yang et al., 2019); the impact of precipitation on N and P exports is relatively small, which mainly affects the pollutant transport.
5.2 Policy implications and suggestions of nitrogen and phosphorus pollution
Since the reform and opening up of China, the State Council of the People’s Republic of China formulated “The Five-Year Plan for Ecological Environmental Protection,” and these plans have brought the trend of increasing environmental pollution and ecological damage under basic control, resulting in an improved environmental quality. In recent years, the Central Committee of the Communist Party of China and the State Council of the People’s Republic of China have issued the “Opinions on the Establishment and Supervision of the Implementation of the Territorial Spatial Planning System” in 2019; the Central Committee of the Communist Party of China and the State Council of the People’s Republic of China have officially issued the “Opinions on Deepening the Battle of Pollution Prevention and Control” and “Outline of the Plan for Ecological Protection and High-quality Development of the Yellow River Basin” in 2021; the State Council of the People’s Republic of China jointly issued the “14th Five-Year Plan for the Protection of Soil, Groundwater and Rural Ecological Environment” and “Ecological Protection Plan for Yellow River Basin” in 2022. To control pollution and improve the quality of the ecological environment in Henan Province, the People’s Government of Henan Province issued “Pollutant Emissions Reduction Regulations” in 2013, “Opinions on Comprehensively Strengthening Ecological Environmental Protection and Resolutely Fighting the Battle of Pollution Prevention and Control” and “Three-Year Action Plan for the Battle of Pollution Prevention and Control (2018–2020)” in 2018, “Notice on Soil Pollution Prevention and Food Security on Agricultural Land” in 2020, “Soil Pollution Prevention and Control Regulations” in 2021, and “Work Program of New Pollutant Management” in 2023.
N and P pollution is still serious, but NPSP including N and P pollution can never be eradicated in the short term, and we need to gradually control the increment and remove the stock of NPSP in the long term. The problem of China’s serious pollution lies in sloppy operation of economic growth. The control of total pollutant emissions will promote resource conservation, industrial structure optimization, technological progress, and pollution control, as well as the transformation of economic growth. Considering agriculture development and large population in the Henan section of the YRB, priority should be given to controlling major pollution sources by reducing fertilizers, pesticides, domestic waste, and production waste in CL and BAs. The vegetation and permeable ground around the CL or in and around BA need to be improved to intercept, absorb, and reduce pollutants. In addition, slowing or redirecting the movement of pollutants by soil consolidation or recessed space ultimately reduces the amount of pollutants that sink into water sources or enter other land uses. The pollutants in the FL or GL are still present but less pronounced, and a reasonable increase in the mix of forest and grass helps improve the ability to intercept and absorb pollutants. The WAs or UL do not produce many pollutants; in addition to controlling aquaculture and the development of UL, illegal discharge and dumping of toxic and harmful substances into water sources and UL are strictly prohibited; and implementing projects for biological or physical protection should be undertaken.
5.3 Limitations and prospects
Although this study used the technology of GIS and RS to assess N and P pollution in the data-scarce region, there are some limitations. Some parameters are obtained from the official user’s guide, official statistics data, and existing relevant studies. If monitoring data can be used in the future to calibrate the input parameters, the results can be improved.
6 Conclusion
The N and P exports in the Henan section of the YRB in 3 years (2000, 2010, and 2020) were analyzed from a macroscopic perspective; the results show that (1) the CL, GL, and UL decreased with 4.98%, 8.56%, and 74.58%, respectively, while FL, WAs, and BAs increased with 0.58%, 27.40%, and 39.85% in 20 years, respectively; (2) the average annual precipitation increased from northeast to southwest in 20 years; (3) the N export was much more than P export in 3 years, and the N and P exports increased in 20 years, and the spatial distribution of N and P export changes was different in the whole basin in three periods (2000–2010, 2010–2020, and 2000–2020); (4) with the increase in precipitation, the changes in average N and P exports showed a decreasing trend in three periods, and the change magnitudes were larger at low precipitation and were lower at high precipitation in three periods; and (5) the amount of N and P exports on CL and BAs is more than that on the other land-use types, and the N and P exports on each land-use type all first increased and then decreased, and the overall change trend all increased from 2000 to 2020. At present, environmental pollution including N and P pollution is still one of the important development issues, and more efforts need to be made to ensure ecological, green, and healthy development.
Data availability statement
The original contributions presented in the study are included in the article/Supplementary Material; further inquiries can be directed to the corresponding author.
Author contributions
XY: conceptualization, data curation, formal analysis, investigation, methodology, resources, validation, writing–original draft, and writing–review and editing. SQ: conceptualization, funding acquisition, project administration, resources, supervision, and writing–review and editing. CW: formal analysis, investigation, resources, validation, visualization, and writing–review and editing. JD: data curation, formal analysis, investigation, methodology, project administration, resources, validation, visualization, and writing–review and editing. XZ: investigation, resources, supervision, validation, and writing–review and editing. TS: writing–review and editing.
Funding
The author(s) declare that financial support was received for the research, authorship, and/or publication of this article. This work was supported by the Joint Fund of Henan Province Science and Technology R&D Program [grant number 222103810100, 225200810088 and 225200810057], Innovation Team Project of Henan Academy of Sciences [grant number 20230107], Technology and Cooperation Project of Henan Academy of Sciences [grant number 220901008], and the Project of Geographic Information Technology of Collaborative Innovation Center of Smart Central Plains [grant number 2023C004].
Conflict of interest
The authors declare that the research was conducted in the absence of any commercial or financial relationships that could be construed as a potential conflict of interest.
Publisher’s note
All claims expressed in this article are solely those of the authors and do not necessarily represent those of their affiliated organizations, or those of the publisher, the editors, and the reviewers. Any product that may be evaluated in this article, or claim that may be made by its manufacturer, is not guaranteed or endorsed by the publisher.
References
Bai, Y., Ochuodho, T. O., and Yang, J. (2019). Impact of land use and climate change on water-related ecosystem services in Kentucky, USA. Ecol. Indic. 102, 51–64. doi:10.1016/j.ecolind.2019.01.079
Bouraoui, F., and Dillaha, T. A. (2000). ANSWERS-2000:non-point-source nutrient planning model. J. Environ. Eng. 126 (11), 1045–1055. doi:10.1061/(asce)0733-9372(2000)126:11(1045)
Cai, M., Li, H. E., and Zhuang, Y. T. (2004). Rainfall deduction method for estimating non-point source pollution load for watershed. J. Northwest A&F Univ. Nat. Sci. Ed. 52 (1), 102–106. doi:10.13207/j.cnki.jnwafu.2005.04.023
Collick, A. S., Fuka, D. R., Kleinman, P. J. A., Kleinman, P. J. A., Buda, A. R., Weld, J. L., et al. (2015). Predicting phosphorus dynamics in complex terrains using a variable source area hydrology model. Hydrol. Process. 29 (4), 588–601. doi:10.1002/hyp.10178
Defries, R., and Nagendra, H. (2017). Ecosystem management as a wicked problem. Science 356, 265–270. doi:10.1126/science.aal1950
Fang, L. L., Wang, L. C., Chen, W. X., Sun, J., Cao, Q., Wang, S., et al. (2021). Identifying the impacts of natural and human factors on ecosystem service in the Yangtze and Yellow River Basins. J. Clean. Prod. 314, 127995. doi:10.1016/j.jclepro.2021.127995
FitzHugh, T. W., and Mackay, D. S. (2000). Impacts of input parameter spatial aggregation on an agricultural nonpoint source pollution model. J. Hydrology 236 (1-2), 35–53. doi:10.1016/s0022-1694(00)00276-6
Getirana, A. C. V., Espinoza, J. C. V., Ronchail, J., and Rotunno Filho, O. (2011). Assessment of different precipitation datasets and their impacts on the water balance of the Negro River basin. J. Hydrology 404 (3-4), 304–322. doi:10.1016/j.jhydrol.2011.04.037
Gu, B. J., Ge, Y., Ren, Y., Xu, B., Luo, W., Jiang, H., et al. (2012). Atmospheric reactive nitrogen in China: sources, recent trends, and damage costs. Environ. Sci. Technol. 46 (17), 9420–9427. doi:10.1021/es301446g
Han, L. X., Huo, F., and Sun, J. (2011). Method for calculating non-point source pollution distribution in plain rivers. Water Sci. Eng. 4 (1), 83–91. doi:10.3882/j.issn.1674-2370.2011.01.008
Hao, G. R., Li, J. K., Li, S., Zhang, Z. h., and Li, H. e. (2020). Quantitative assessment of non-point source pollution load of PN/PP based on RUSLE model: a case study in Beiluo River Basin in China. Environ. Sci. Pollut. Res. 27, 33975–33989. doi:10.1007/s11356-020-09587-2
Hong, G. D., Teng, F. G., Ming, H. L., and Xu, D. (2012a). Comprehensive assessment model on heavy metal pollution in soil. Int. J. Electrochem. Sci. 7 (6), 5286–5296. doi:10.1016/s1452-3981(23)19621-0
Hou, C. Y., Chu, M. L., Botero-Acosta, A., and Guzman, J. A. (2021). Modeling field scale nitrogen non-point source pollution (NPS) fate and transport: influences from land management practices and climate. Sci. Total Environ. 759, 143502. doi:10.1016/j.scitotenv.2020.143502
Hoyer, R., and Chang, H. (2014). Assessment of freshwater ecosystem services in the Tualatin and Yamhill basins under climate change and urbanization. Appl. Geogr. 53, 402–416. doi:10.1016/j.apgeog.2014.06.023
Hu, Y. W., Zhang, W., and Jin, X. H. (2022). Current situation and suggestions of rural sewage treatment in henan section of the Yellow River Basin. Mod. Agric. Sci. Technol. (7), 146–151.
Huang, C. B., Zhao, D. Y., Fan, X., and Liu, C. (2022). Landscape dynamics facilitated non-point source pollution control and regional water security of the Three Gorges Reservoir area, China. Environ. Impact Assess. Rev. 92, 106696. doi:10.1016/j.eiar.2021.106696
Huang, G. R., Yao, G. L., Zhao, J., Lisk, M. D., Yu, C., and Zhang, X. (2019). The environmental and socioeconomic trade-offs of importing crops to meet domestic food demand in China. Environ. Res. Lett. 14 (9), 094021. doi:10.1088/1748-9326/ab3c10
Lee, J., Kim, J., Lee, J. M., Jang, H. S., Park, M., Min, J. H., et al. (2022). Analyzing the impacts of sewer type and spatial distribution of LID facilities on urban runoff and non-point source pollution using the Storm water management model (SWMM). Water 14 (18), 2776. doi:10.3390/w14182776
Li, C. H., Wang, Y. K., Ye, C., Wei, W. w., Zheng, B. h., and Xu, B. (2019). A proposed delineation method for lake buffer zones in watersheds dominated by non-point source pollution. Sci. Total Environ. 660, 32–39. doi:10.1016/j.scitotenv.2018.12.468
Li, H. E., and Cai, M. (2003). Relationship between nonpoint source nutrient load and sediment and its application. Sci. Geogr. Sin. 23 (4), 460–463.
Li, J. J., Wang, Z. W., and Sun, L. J. (2010). Basic situation and preventive measures of non-point source pollution. Henan Sci. Technol. 16, 258.
Li, Q. K., Li, H. E., Sun, J., and Hu, Y. W. (2008). The non-point source pollution loads estimation method in limited data of the soil and water loss region. J. Soil Water Conservation (5), 181–185. doi:10.13870/j.cnki.stbcxb.2008.05.006
Li, X. L., Yang, J. X., Fan, Y. F., Xie, M., Qian, X., and Li, H. (2021). Rapid monitoring of heavy metal pollution in lake water using nitrogen and phosphorus nutrients and physicochemical indicators by support vector machine. Chemosphere 280, 130599. doi:10.1016/j.chemosphere.2021.130599
Liang, J., Li, S., Li, X. D., Li, X., Liu, Q., and Meng, Q. (2021). Trade-off analyses and optimization of water-related ecosystem services (WRESs) based on land use change in a typical agricultural watershed, southern China. J. Clean. Prod. 279, 123851. doi:10.1016/j.jclepro.2020.123851
Liu, Z. F., Xu, Z. X., Charles, S. P., Fu, G., and Liu, L. (2011). Evaluation of two statistical downscaling models for daily precipitation over an arid basin in China. Int. J. Climatol. 31 (13), 2006–2020. doi:10.1002/joc.2211
Long, Y. (2022). Evaluation and driving factors of ecosystem services in the Yellow River Basin based on InVEST model. Southwestern University of Finance and Economics.
Ma, X. G., and Liu, X. N. (2014). Assessment on emergent pollution emergency of water environment of qinghe river basin based on fuzzy integrated evaluation method. Adv. Mater. Res. 1010, 570–575. doi:10.4028/scientific.net/amr.1010-1012.570
Mahmood, R., and Babel, M. S. (2013). Evaluation of SDSM developed by annual and monthly sub-models for downscaling temperature and precipitation in the Jhelum basin, Pakistan and India. Theor. Appl. Climatol. 113, 27–44. doi:10.1007/s00704-012-0765-0
Maillard, P., and Santos, N. A. P. (2008). A spatial-statistical approach for modeling the effect of non-point source pollution on different water quality parameters in the Velhas river watershed–Brazil. J. Environ. Manag. 86 (1), 158–170. doi:10.1016/j.jenvman.2006.12.009
Ongley, E. D., Zhang, X. L., Xiaolan, Z., and Yu, T. (2010). Current status of agricultural and rural non-point source pollution assessment in China. Environ. Pollut. 158, 1159–1168. doi:10.1016/j.envpol.2009.10.047
Qi, Y., Lian, X. H., Wang, H. W., Zhang, J., and Yang, R. (2020). Dynamic mechanism between human activities and ecosystem services: a case study of Qinghai lake watershed, China. Ecol. Indic. 117, 106528. doi:10.1016/j.ecolind.2020.106528
Qin, Y. P., Xu, S. J., and Tian, Y. W. (2022). The spatial differentiation of vegetation and soil carbon density in Henan section of the Yellow River Basin. Ecol. Environ. Sci. 31 (9), 1745–1753. doi:10.16258/j.cnki.1674-5906.2022.09.004
Redhead, J. W., May, L., Oliver, T. H., Hamel, P., Sharp, R., and Bullock, J. M. (2018). National scale evaluation of the InVEST nutrient retention model in the United Kingdom. Sci. Total Environ. 610, 666–677. doi:10.1016/j.scitotenv.2017.08.092
Shen, Z. Y., Liao, Q., Hong, Q., and Gong, Y. (2012). An overview of research on agricultural non-point source pollution modelling in China. Sep. Purif. Technol. 84, 104–111. doi:10.1016/j.seppur.2011.01.018
Sinshaw, T. A., Surbeck, C. Q., Yasarer, H., and Najjar, Y. (2019). Artificial neural network for prediction of total nitrogen and phosphorus in US lakes. J. Environ. Eng. 145 (6), 04019032. doi:10.1061/(asce)ee.1943-7870.0001528
Tao, Y., Xu, J., Ren, H. J., Guan, X., You, L., Wang, S., et al. (2021). Spatiotemporal evolution of agricultural non-point source pollution and its influencing factors in the Yellow River Basin. Trans. Chin. Soc. Agric. Eng. 37, 257–264. doi:10.11975/j.issn.1002-6819.2021.4.031
Terrado, M., Acuña, V., Ennaanay, D., Tallis, H., and Sabater, S. (2014). Impact of climate extremes on hydrological ecosystem services in a heavily humanized Mediterranean basin. Ecol. Indic. 37, 199–209. doi:10.1016/j.ecolind.2013.01.016
Wang, A., Tang, L. H., and Yang, D. W. (2016). Spatial and temporal variability of nitrogen load from catchment and retention along a river network: a case study in the upper Xin'anjiang catchment of China. Hydrology Res. 47 (4), 869–887. doi:10.2166/nh.2015.055
Wang, H. L., Wu, Z. N., and Hu, C. H. (2015). A comprehensive study of the effect of input data on hydrology and non-point source pollution modeling. Water Resour. Manag. 29, 1505–1521. doi:10.1007/s11269-014-0890-x
Wu, L., Gao, J. E., Ma, X. Y., and Li, D. (2015). Application of modified export coefficient method on the load estimation of non-point source nitrogen and phosphorus pollution of soil and water loss in semiarid regions. Environ. Sci. Pollut. Res. 22, 10647–10660. doi:10.1007/s11356-015-4242-z
Wu, Y. F., Zhang, X., Li, C., Xu, Y., Hao, F., and Yin, G. (2021). Ecosystem service trade-offs and synergies under influence of climate and land cover change in an afforested semiarid basin, China. Ecol. Eng. 159, 106083. doi:10.1016/j.ecoleng.2020.106083
Wu, Z. S., Wang, X. L., Chen, Y. W., Cai, Y., and Deng, J. (2018). Assessing river water quality using water quality index in Lake Taihu Basin, China. Sci. Total Environ. 612, 914–922. doi:10.1016/j.scitotenv.2017.08.293
Xi, J. P. (2019). Speech at the symposium on ecological protection and high-quality development of the Yellow River Basin. China Water Resour. 20, 1–3.
Xia, H. J., Liu, L. S., Bai, J. H., Kong, W., Lin, K., and Guo, F. (2020). Wetland ecosystem service dynamics in the Yellow River estuary under natural and anthropogenic stress in the past 35 years. Wetlands 40, 2741–2754. doi:10.1007/s13157-020-01368-4
Xu, X. L. (2017). Kilometer grid dataset of population spatial distribution in China. Resour. Environ. Sci. Data Registration Publ. Syst.
Xu, Y. L. (2007). Non-point source pollution research based on land use/coverage changes in Shaanxi Heihe River watershed. Xi’an University of Technology.
Yang, X., Ji, G. X., Wang, C., Zuo, J., Yang, H., Xu, J., et al. (2019). Modeling nitrogen and phosphorus export with InVEST model in Bosten Lake basin of Northwest China. PLoS ONE 14 (7), e0220299. doi:10.1371/journal.pone.0220299
Yeghiazarian, L. L., and Montemagno, C. D. (2001). Incorporation of the water erosion prediction project (WEPP) in the modeling of transport of pathogenic microorganisms from non-point sources of pollution. American Society of Agricultural and Biological Engineers, 127–130.
Yoon, T., Rhodes, C., and Shah, F. A. (2015). Upstream water resource management to address downstream pollution concerns: a policy framework with application to the Nakdong River basin in South Korea. Water Resour. Res. 51 (2), 787–805. doi:10.1002/2013wr014201
Yu, C. X. (2022). Ecosystem services assessment and trade-offs and synergies in the lower Yellow River floodplain based on the InVEST model. Master Thesis: Zhengzhou University.
Zhang, L. W., and Fu, B. J. (2014). The progress in ecosystem services mapping: a review. Acta Ecol. Sin. 34 (2), 316–325. doi:10.5846/stxb201303110391
Zhang, T., Yang, Y. H., Ni, J. P., and Xie, D. (2020). Best management practices for agricultural non-point source pollution in a small watershed based on the AnnAGNPS model. Soil Use Manag. 36 (1), 45–57. doi:10.1111/sum.12535
Zhang, X. L., Wang, Q., Gilliam, F. S., Wang, Y., and Cha, F. (2014). Spatial variation in carbon and nitrogen in cultivated soils in henan province, China: potential effect on crop yield. PLoS ONE 9 (10), e109188. doi:10.1371/journal.pone.0109188
Zhao, C. S., Yang, Y., Yang, S. T., Xiang, H., Zhang, Y., Wang, Z., et al. (2019). Predicting future river health in a minimally influenced mountainous area under climate change. Sci. Total Environ. 656, 1373–1385. doi:10.1016/j.scitotenv.2018.11.430
Zheng, J. Q., Cao, X. H., Ma, C. Z., Weng, N., and Huo, S. (2023). What drives the change of nitrogen and phosphorus loads in the Yellow River Basin during 2006-2017? J. Environ. Sci. 126, 17–28. doi:10.1016/j.jes.2022.04.039
Keywords: nitrogen, phosphorus, multi-source data, InVEST model, Yellow River Basin
Citation: Yang X, Qiu S, Wang C, Du J, Zhang X and Sun T (2024) Assessment of nitrogen and phosphorus pollution based on multi-source data and the InVEST model in the Henan section of Yellow River Basin, China. Front. Environ. Sci. 12:1415732. doi: 10.3389/fenvs.2024.1415732
Received: 15 April 2024; Accepted: 07 June 2024;
Published: 11 July 2024.
Edited by:
Changchun Huang, Nanjing Normal University, ChinaReviewed by:
Chenggong Du, Huaiyin Normal University, ChinaShaohua Lei, Nanjing Hydraulic Research Institute, China
Copyright © 2024 Yang, Qiu, Wang, Du, Zhang and Sun. This is an open-access article distributed under the terms of the Creative Commons Attribution License (CC BY). The use, distribution or reproduction in other forums is permitted, provided the original author(s) and the copyright owner(s) are credited and that the original publication in this journal is cited, in accordance with accepted academic practice. No use, distribution or reproduction is permitted which does not comply with these terms.
*Correspondence: Shike Qiu, qiushike@igs-has.cn