 Ping Wu1†
 Jie Feng2†Mingxia Ju1†Shenhao Wu2Weichun Han1
 Miao Wang1Junquan Liao2Lifeng Zhao1Yifan Gao1Jiao Zheng1Mingjie Luo1Huixian Gong1Lidong Zeng1
 Juan Lai1Mingze Li1Qin Yan1
 Lei Sun1
 Yongfeng Liu1*
- 1GeneMind Biosciences Company Limited, Shenzhen, China
- 2Shenzhen Academy of Environmental Sciences, Shenzhen, China
Biological monitoring using environmental DNA (eDNA) technology has expanded from micro- to macro-organisms. In aquatic eDNA studies, large volumes of water need to be filtered rapidly in the field, which requires development of effective eDNA collection devices. In this study, we introduce a novel portable eDNA collection system containing a GM dual-channel water filter and a DNA extraction kit adapted to large filter membranes (ø 100 mm). The water filter is powered by a high-capacity lithium battery (9,000 mA), which operates two peristaltic pumps and maintains a continuous filtration rate of up to 1 L/min for 5 h in outdoor settings. For sample collection, the optimum conditions are still water and turbidity below 8 nephelometric turbidity units. This allows for the filtration of 10 L of water within 10 min by use of a 0.22-μm filter. Metagenomic and 12S metabarcoding sequencing showed that the DNA extraction quality and species annotation accuracy of our custom DNA extraction kit, which was tailored for this system, rivaled the performance of established kits. The GM water filter’s enrichment mode gave consistent results with vacuum filtration, which greatly reduced the filtration time for large water samples, while accurately reproducing species annotations. This innovation streamlines the eDNA collection and annotation process and offers substantial benefits for biodiversity monitoring and conservation efforts.
1 Introduction
Environmental DNA (eDNA) is DNA released by an organism into its surroundings. This DNA can be detected in various matrices, including air, water, and soil (Thomsen and Willerslev, 2015). Initially used to investigate microbial communities in marine sediments (Ogram et al., 1987), eDNA sampling has more recently revolutionized the study of multicellular organisms (Pawlowski et al., 2020). This includes the detection of various organisms such as diatoms, macrozoobenthos, fish, and earthworms (Nagler et al., 2022). An outstanding advantage of eDNA sampling lies in its ability to detect organisms that are rare or challenging to sample, including invasive non-native species (Dejean et al., 2011; James et al., 2024) and native species of conservational concern (Wilcox et al., 2013; Mauvisseau et al., 2020).
To date, three principal detection strategies have been used in eDNA research: single-species eDNA detection by quantitative PCR (Ratsch et al., 2020) and digital PCR (Capo et al., 2020), multispecies community composition analysis through metabarcoding (West et al., 2020), and shotgun sequencing of the entire metagenome (Pinfield et al., 2019; Roesma et al., 2021). The latter two approaches necessitate high-throughput sequencing, which enables the simultaneous annotation of numerous species within a single experiment. The evolution of high-throughput sequencing technology over the past decade has facilitated the application of eDNA analyses across a diverse array of aquatic ecosystems (Beng and Corlett, 2020; Takahashi et al., 2023), including subterranean environments (Saccò et al., 2022), Antarctic geothermal sites (Fraser et al., 2018), coral reefs (Madduppa et al., 2021), and deep oceans (McClenaghan et al., 2020). Research on aquatic eDNA generally requires enrichment procedures because of the low concentration of DNA (organismal or extra-organismal) (Minamoto, 2022). Advances in eDNA sampling methodologies, particularly for large-volume sampling, are ongoing (Thomas et al., 2018). Existing protocols often necessitate the transportation of water samples back to the laboratory, which limits the sample volume and introduces the possibility of DNA degradation before filtration or preservation can be performed (Goldberg et al., 2016). Development of portable eDNA filtration systems, particularly for large-volume sampling, can improve the efficiency, sterility, and replicability of aquatic eDNA sampling for field users. Thomas et al. designed a novel backpack eDNA filtration system with a flow rate threshold of 1.0 L/min. It greatly improved the sampling speed and replicability and minimized the risk of contamination. Nevertheless, this system was adapted to two mixed cellulose ester filter pore sizes (1 and 5 μm) rather than the small pore-sized filters (0.45–1.0 μm) used in a large number of eDNA studies (Rees et al., 2014). Another portable aquatic eDNA filtration system developed by DeHart et al. incorporated a field-portable pump to filter large volumes of water conveniently with 0.22-µm or 0.45-µm Sterivex filters with an unobstructed filtration rate of 150.05 ± 7.01 mL/min and 151.70 ± 6.72 mL/min, respectively (DeHart et al., 2023). Undoubtedly, this rate is still time-consuming for field filtration of large-volume water samples. Therefore, the development of a portable eDNA sampling system that supports a high flow rate (e.g. 1.0 L/min) and is compatible with commonly used filter membrane pore sizes (e.g. 0.22 μm and 0.45 μm) could greatly streamline eDNA pre-processing by enabling the filters to be easily carried and reducing DNA degradation. In the laboratory setting, vacuum filtration remains the predominant method for eDNA enrichment, with the standard filter membrane diameter being 47 mm (Schweiss et al., 2020; Wong et al., 2020). For eDNA extraction from these filters, the Qiagen DNeasy PowerWater Kit and MP Biomedicals MagBeads FastDNA Kit for Soil are frequently used (Lear et al., 2018; Schweiss et al., 2020; WANG et al., 2022). However, these extraction kits are specifically designed for 47-mm filter membranes and may not be compatible with larger filters that could be used in portable field systems.
In this study, we developed an innovative portable eDNA collector system using a GM dual-channel water filter (developed by GeneMind Biosciences Co., Ltd, Shenzhen, China) with a Water Filter DNA Extraction Kit specifically tailored for large filter membranes (ø 100 mm). This system was engineered to enhance the efficiency, sterility, and replicability of aquatic eDNA sampling in the field. We provide a comprehensive account of the system’s design, including its stress testing, and comparative experiments against conventional extraction kits and vacuum filtration methods.
2 Methods
2.1 System design
It is well-established that the flow rate is positively correlated with pressure differences when the flow resistance remains constant. In suction filtration, the maximum achievable pressure difference is capped at 1.0 atm, whereas gravity filtration exhibits a minor pressure difference, which is dictated by the water column’s height. A positive pressure filtration system enhances the pressure difference across the filter membrane surface beyond the 1.0 atm threshold, which surpasses the limitation of gravity filtration. When considering the driving force, a peristaltic pump outperforms centrifugal, diaphragm, and plunger pumps in terms of self-priming capacity, flow capacity, and pump liquid efficiency. Consequently, we opted for a positive pressure filtration system paired with a peristaltic pump. To monitor clogging during the filtration process, we incorporated a pressure monitoring device, which allowed for the cessation of filtration by setting the upper and lower pressure thresholds. Additionally, we implemented two timers to assist the operator with tracking the filtration duration. The system was designed with a lightweight structure and was powered by a high-capacity lithium battery (9,000 mA), which makes it suitable for the collection of water samples in the field. For more turbid water bodies, we have designed a bucket-shaped filter (120 mesh) and a butterfly filter (pore size of 100 μm), which can be connected sequentially in front of the inlet pipe for pre-filtration. The GM dual-channel water filter contains one battery meter, two pressure gages, and two timers (Figure 1).
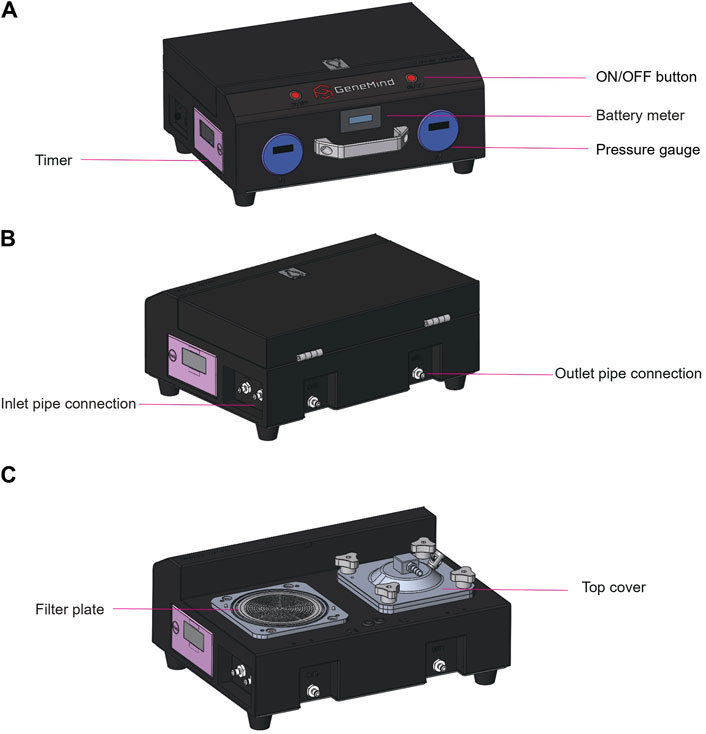
Figure 1. GM dual-channel water filter. (A) Front view showing the window for the battery meter, two pressure gages, and one timer on the left side. (B) Rear view showing two outlet and inlet pipe connections. (C) Rear view showing two filter plates, two top covers, and one timer on the left side.
2.2 Water turbidity stress testing
We evaluated the system’s performance using 12 freshwater samples sourced from groundwater, streams, lakes, and ponds in Shenzhen, China (Table 1). Water turbidity was quantified by using a suspended matter turbidity detector (LH-XZ03, Lohand Biotechnology Co., Ltd., Hangzhou, China), with measurements of four replicates. Four replicate filter samples were collected using mixed cellulose ester membranes with a pore size of 0.22 μm (XYMCE0065, Shanghai Hai Xin Ya Purification Equipment Co., Ltd). The filtration time required to process 10 L of water through the dual channel system was recorded.
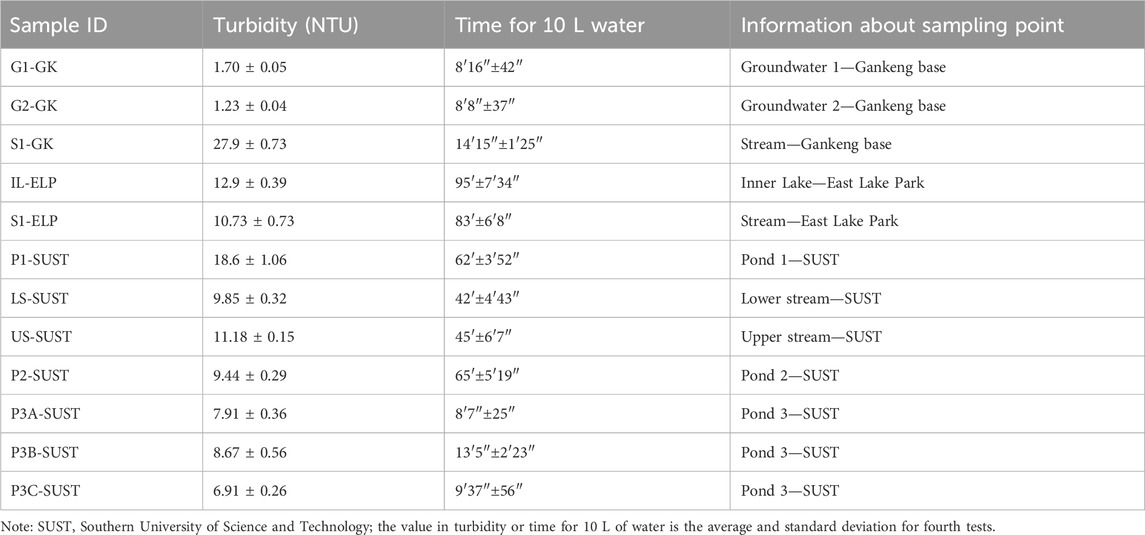
Table 1. Filtration time of 10 L water with different turbidities via 0.22-μm filter membranes.
2.3 Pressure testing
To ascertain the maximum pressure tolerance during the filtration process and validate the system’s capability to filter 10 L water within 10 min, we conducted an experiment using water samples from Gankeng Reservoir with an original turbidity of 8.81 ± 0.71 nephelometric turbidity units (NTU). We supplemented the samples with pure water to facilitate pressure testing and to prevent rapid clogging of the filter membrane. Finally, a total volume of 200 L and a turbidity of 2.61 NTU water were used to ascertain the pressure limit during the filtration process. The flow rate was calculated from the volume of the water filtered per minute, and dynamic pressure changes were monitored. Experiments were conducted separately for each channel, with four trials for both channels in total, and the filtration endpoint was set at 15 min.
2.4 Comparison with different DNA extraction kits
Following the pressure testing, we performed three consecutive filtration rounds with the above water (2.61 NTU), which resulted in the collection of six filter membranes. The volume of water filtered by each filter membrane was approximately 5.5–6.2 L. Two membranes were divided into four and subjected to eDNA extraction using a MagBeads FastDNA Kit for Soil (MP Biomedicals, Santa Ana, CA) and a DNeasy PowerWater Kit (Qiagen, Dusseldorf, Germany). The remaining four membranes were processed using our in-house Water Filter DNA Extraction Kit (A000026, GeneMind Co., Ltd, Shenzhen, China).
The process involved the addition of 7.5 mL of lysis solution and grinding beads, followed by vigorous vortex mixing at 2,500 rpm for 10 min and centrifugation at 4,000 × g for 1 min. The supernatant (6.5 mL) was then transferred to a clean collection tube, and 100 μL of proteinase K solution was added. The mixture was vortex-mixed briefly to ensure thorough mixing and then incubated at 65°C for 20 min. Subsequently, 3 mL of isopropyl alcohol and 80 μL of magnetic beads (50 mg/mL) were added, the tube was vortexed or inverted to mix, and then placed on a shaker for 9 min to facilitate binding. The tube was then set on a magnetic rack for 5 min to allow the magnetic beads to settle, after which the supernatant was discarded. Add 1 mL of wash solution I to re-suspend the magnetic beads by vortexing, and then deposit the tube on the magnetic rack for 2 min to ensure that the beads aggregate along the tube wall. Thereafter, the supernatant was carefully discarded without disturbing the bead pellet. Following this, a second wash was performed with 1.2 mL of wash solution II, followed by a third wash with an additional 700 μL of wash solution II. After the final wash, the remaining solution was carefully aspirated, and the tube was returned to the magnetic rack for drying at room temperature. The drying process was ceased when all of the visible moisture on the magnetic nanoparticles had evaporated. Then, 100 μL of elution buffer was added to the dried beads. The beads were re-suspended and incubated at 55°C for 5 min. After that, the tube was placed on the magnetic rack for 5 min to allow the magnetic beads to settle. Finally, 98 μL of the supernatant (eluted DNA) was transferred to a clean 1.5-mL micro-centrifuge tube. The extracted DNA could be stored at −20°C for extended periods. All devices and extraction kits came with operation manuals.
The concentration and purity of the extracted eDNA were quantified by using a fluorometer (Qubit 4, Thermo Fisher Scientific Inc, Waltham, Mass) and a spectrophotometer (NanoDrop 2000, Thermo Fisher Scientific Inc, Waltham, Mass), respectively. The integrity of the eDNA was assessed by agarose gel electrophoresis (gel concentration: 1%; voltage: 5 V/cm; electrophoresis time: 20 min) and by using a NanaLyzer (GeneMind Co., Ltd, Shenzhen, China). Subsequently, 12 metagenomic libraries were constructed from the 12 DNA samples. Sequencing was conducted via the FASTASeq 300 platform (GeneMind Co., Ltd, Shenzhen, China) using the PE150 mode. Species annotation was performed using our previously published method (Feng et al., 2023). Briefly, Kraken 2 was used for taxonomic assignment of metagenomics sequencing reads through exact k-mer matches (https://ccb.jhu.edu/software/kraken2/). The Kraken2_standard_16G_20230314 database was chosen for aligning. Using the internal k-mer (default parameters) to the LCA (lowest common ancestor) mapping algorithm, Kraken 2 assigns a taxonomic label (confidence: 0.9). The relative abundance was calculated based on the proportion of fragments assigned to the taxa by Kraken 2.
2.5 Comparison with vacuum filtration
Vacuum filtration is a prevalent technique in eDNA laboratory research. The standard filtered water sample volume for this technique is 500 mL. In this part, we compared the metagenomic and 12S sequencing outcomes for filter membranes obtained after processing 2 L of stream water from the Gankeng base (turbidity: 25.98 ± 0.56 NTU). For vacuum filtration, a 47-mm filter membrane (pore size: 0.22 μm) was used for every 500 mL of water, and the four resulting membranes were pooled for eDNA extraction. The GM water filter system processed 2 L of water by using a single filter membrane (ø 100 mm, pore size: 0.22 μm). Four biological replicates were conducted for each filtration method, and a Water Filter DNA Extraction Kit (A000026, GeneMind Co., Ltd, Shenzhen, China) was used for eDNA extraction. Each of the eight DNA samples was divided into two aliquots. One aliquot was subjected to metagenomic sequencing by the FASTASeq 300 platform using the PE150 mode, while the other was sent to Magigene Co., Ltd (Guangzhou, China) for 12S metabarcoding sequencing using a NovaSeq 6000 in the PE150 mode. The subsequent data analysis followed the methods outlined in a previous study (Zhang et al., 2024). Briefly, Fastp (v0.12.4) was utilized to perform quality control on the raw sequencing data. Subsequently, the cutadapt software was employed to eliminate primer sequences, thereby generating clean reads. These clean reads were then processed using usearch-fastq_mergepairs version (v11.0.667), which required at least a 16-bp overlap between reads derived from the opposite ends of the same DNA fragment, with a maximum of 5-bp mismatches permitted within the overlap region. The resulting sequences were clustered into operational taxonomic units (OTUs) using the UPARSE software with a 97% sequence similarity threshold. These OTUs with reads <10 were removed. The remaining OTUs were compared against the reference databases MitoFish and GenBank to facilitate species annotation. For alpha diversity, Chao and Shannon indices were computed, and beta diversity was assessed through non-metric multidimensional scaling (NMDS) analysis based on the Bray–Curtis dissimilarity matrices.
3 Results
3.1 System implementation
The GM Water Filter is versatile and can accommodate various filter membrane pore sizes (0.22 and 0.45 μm) and materials, including mixed cellulose ester, organic nylon, and polyether sulfone, all with a standard diameter of 100 mm. The setup of the GM water filter and the standard sampling procedure are depicted in Figure 2. Operators must always wear sterile gloves to ensure aseptic conditions during the experimental procedure. Before initiating the filtration process, 20 mL of 75% alcohol was aspirated into the water inlet pipe to effectively sanitize the internal conduit. Subsequently, the water sample designated for filtration was introduced into the apparatus to ensure that any residual alcohol was thoroughly rinsed from the pipe by the incoming water sample. After assessing the flow rate, we used a mixed cellulose ester membrane. Post-filtration, the filter membrane was carefully collected and stored in a sterile 50-mL centrifuge tube, which was then transported to the laboratory at low-temperature conditions (4°C). The pipeline system was thoroughly cleaned using 75% ethanol and pure water. Additionally, the panel components are disinfected by applying 75% alcohol, followed by wiping with a clean cloth to ensure the removal of any residual alcohol and contaminants.
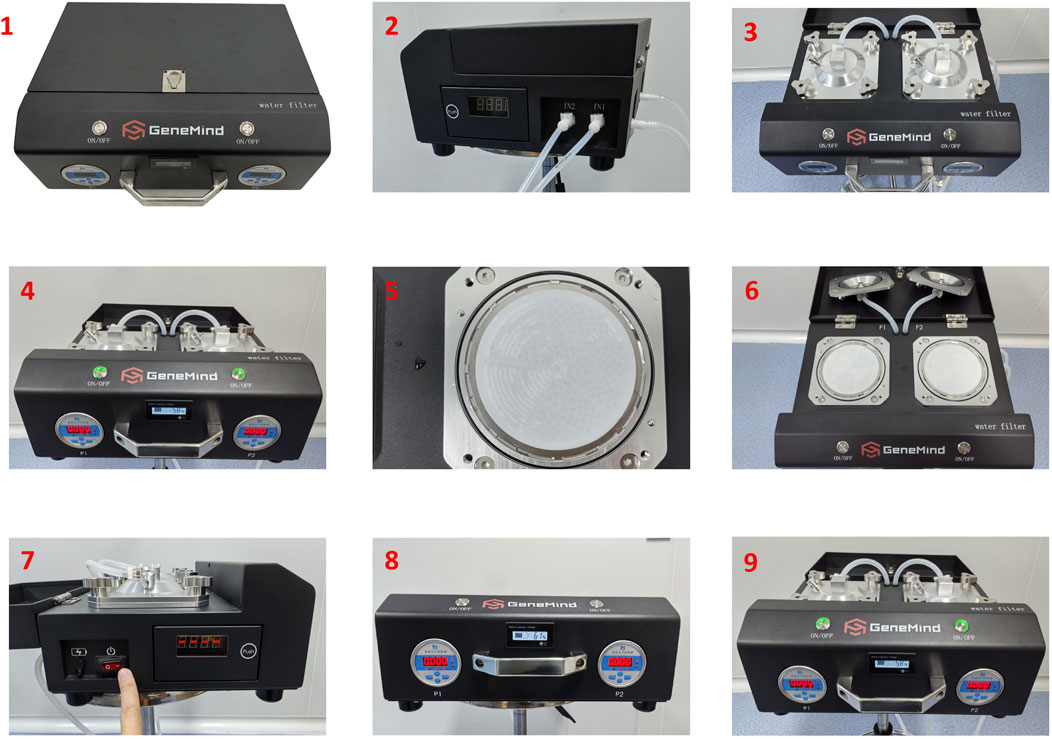
Figure 2. Typical GM dual-channel water filter workflow for environmental DNA (eDNA) sampling: (1) the equipment, (2) connecting the inlet and outlet tubes, (3) tightening the screws and closing the upper covers, (4) placing the inlet tubes into the alcohol and turning on the rinse, (5) loading the filter membrane with the edge of the filter membrane aligned with the supporting filter, (6) loading the two filter membranes, (7) turning on the power and setting the filtering time, (8) setting the pressure switch, and (9) pressing the on–off button and starting the filter.
3.2 Determination of the optimal turbidity
We assessed 12 freshwater sites to establish the recommended turbidity for achieving filtration of 10 L of water within 10 min. The turbidity distribution was 1.23–27.90 NTU (Table 1). A filtration rate of 10 L in 10 min was feasible when the turbidity was below 8 NTU. Even for relatively pristine groundwater (1.23–1.70 NTU), filtration of 10 L of water took approximately 8 min. Although there was a positive correlation between the filtration time and turbidity, the relationship was not strictly linear (Supplementary Figure S1).
3.3 Pressure threshold
During the filtration process, channel A exhibited two distinct plateaus in the relationship between the flow rate and pressure within 15 min, while channel B demonstrated a negative correlation between these parameters (Figure 3). At the end of filtration, the pressures of channels A and B stabilized at 174.75 ± 1.5 and 155.55 ± 3.70 kPa, respectively. The corresponding flow rates were 0.110 ± 0.008 and 0.178 ± 0.005 L/min, respectively. The volumes of water filtered through the channels were 3.81 ± 0.14 L (A) and 3.17 ± 0.03 L (B) at 5 min, 5.64 ± 0.41 L (A) and 5.06 ± 0.05 L (B) at 10 min, and 6.34 ± 0.44 L (A) and 6.09 ± 0.09 L (B) at 15 min. The results for the four replicates confirmed that the dual-channel system was capable of filtering at least 10 L of water within 10 min.
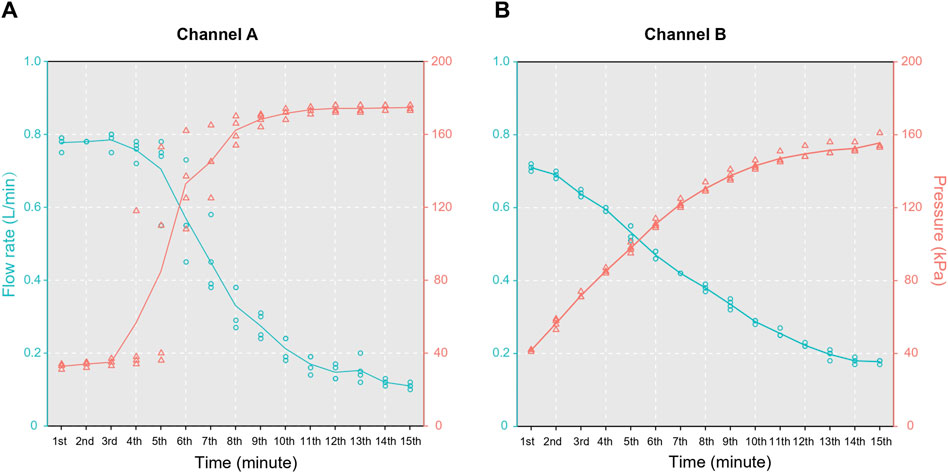
Figure 3. Results of the pressure tests for the two channels in the water filter: (A) channel A and (B) channel B.
3.4 Performance of the GM extraction kit
Benchmarking results indicated that DNA integrity with the GM extraction kit was comparable to that with the MP and Qiagen kits (Table 2), while the DNA concentration and total yield were evidently lower with the MP kit than with the other kits (Supplementary Figure S2). Specifically, the total DNA yields from a single filter using the GM, MP, and Qiagen kits were 9.56, 7.66, and 19.48 μg, respectively (Table 2). The efficiency of the GM extraction kit was comparable to that the MP kit, but was less efficient than the Qiagen kit when considering DNA quality and quantity.
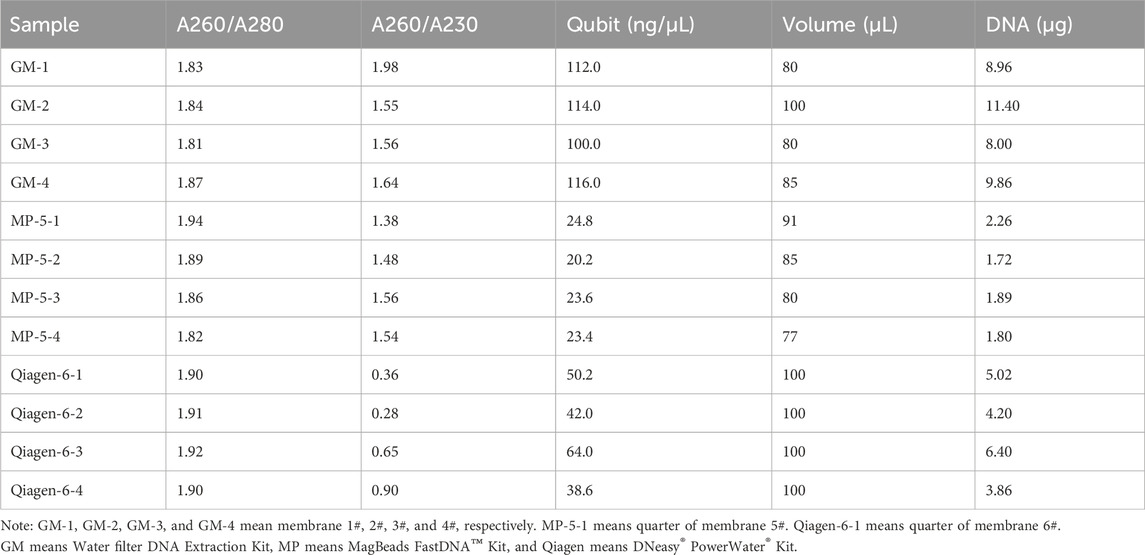
Table 2. Comparison of DNA quality obtained by the eDNA extraction reagent.
Metagenomic sequencing and species annotation were performed on the 12 DNA samples. The clean data ranged from 22.6 to 26.9 million reads, with Q20 > 94% (Supplementary Table S1). Figure 4 shows the relative abundances at the phylum and genus levels. The three kits presented highly consistent species annotation at the phylum level, with only minor variations observed at the genus level. Generally, the inter-group differences were more pronounced than the intra-group differences. The more distinct difference observed within the GM group could be attributed to the separate extraction of the four filter membranes. This was in contrast to the MP and Qiagen kits, where four aliquots were extracted from the same filter membrane. It seems like the water was not fully mixed during the filtration, and although we agitated the water bucket to ensure homogeneity and started the filtration, it remained undisturbed. Nevertheless, these differences are considered acceptable and are consistent with the variations observed in biological replicates.
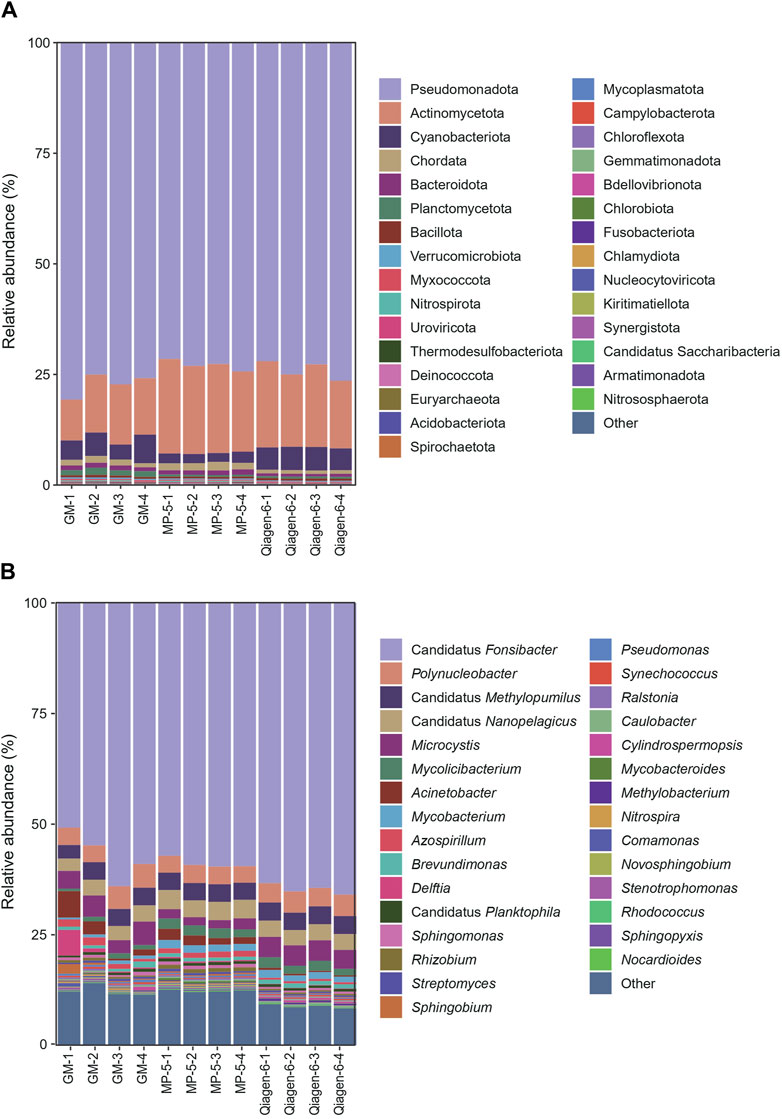
Figure 4. Relative abundances at the phylum (A) and genus (B) levels of the 12 DNA samples from three kits. The 30 most abundant species are shown. “Other” indicates species other than the top 30 across all samples. Abbreviations: MP, MagBeads FastDNA Kit for Soil; Qiagen, DNeasy PowerWater Kit; and GM, water filter DNA extraction kit.
3.5 Impact of filtering methods in eDNA sequencing
To filter 2 L of water, the vacuum filtration system took 644.02 ± 39.74 min and the GM water filter system took 27.61 ± 2.67 min. Metagenomic sequencing was conducted on eight samples, which were divided into two groups (labeled VF for vacuum filtration and GM for the GM water filter system). The data volume ranged from 15.5 to 16.6 million reads (Supplementary Table S2). The heatmap representing the relative abundances of the top 20 genus and species taxa demonstrated a high degree of concordance among the four biological replicates within each group, with these replicates clustering together in a single clade (Supplementary Figure S3). Inter-group comparisons also revealed high consistency in the relative abundance profiles. In both VF and GM groups, the genera Cylindrospermopsis, Candidatus Fonsibacter, Polynucleobacter, and Synechococcus were predominant at the genus level. When examining the species level, the four most abundant were Cylindrospermopsis raciborskii, Candidatus Fonsibacter ubiquis, Polynucleobacter sp. MWH-UH24A, and Cylindrospermopsis curvispora. The consistent distribution of highly abundant genera and species between the two groups indicated that both the filtering methods had a minimal influence on species annotation via metagenomics sequencing.
The 12S metabarcoding sequencing data for the eight samples ranged from 329,000 to 401,000 reads, with an average of 360,000 reads (Supplementary Table S3). The VF and GM groups yielded 281,000–320,000 tags and 231,000–311,000 tags, respectively, which culminated in the identification of a total of 271 OTUs. Thirty-seven OTUs were annotated in the genus or species levels for the VF group, and 39 OTUs were annotated for the GM group. The GM group included all 37 OTUs from the VF group (Figure 5A). The alpha diversity indices, Shannon and Chao1, indicated that there were no significant differences between the two filter models (Figure 5B). Furthermore, the NMDS analysis from Bray–Curtis dissimilarity matrixes showed a highly consistent ordination pattern for both groups, with a stress value of <0.05 (Figure 5C). Supplementary beta diversity analysis (analysis of similarity) showed that the inter-group differences were less pronounced than the intra-group differences (R < 0); however, it was not statistically significant (P > 0.05) (Figure 5D). Collectively, the metabarcoding sequencing (12S) results suggested that there were no significant differences between the species information obtained by the two eDNA enrichment methods when both alpha and beta diversity were considered.
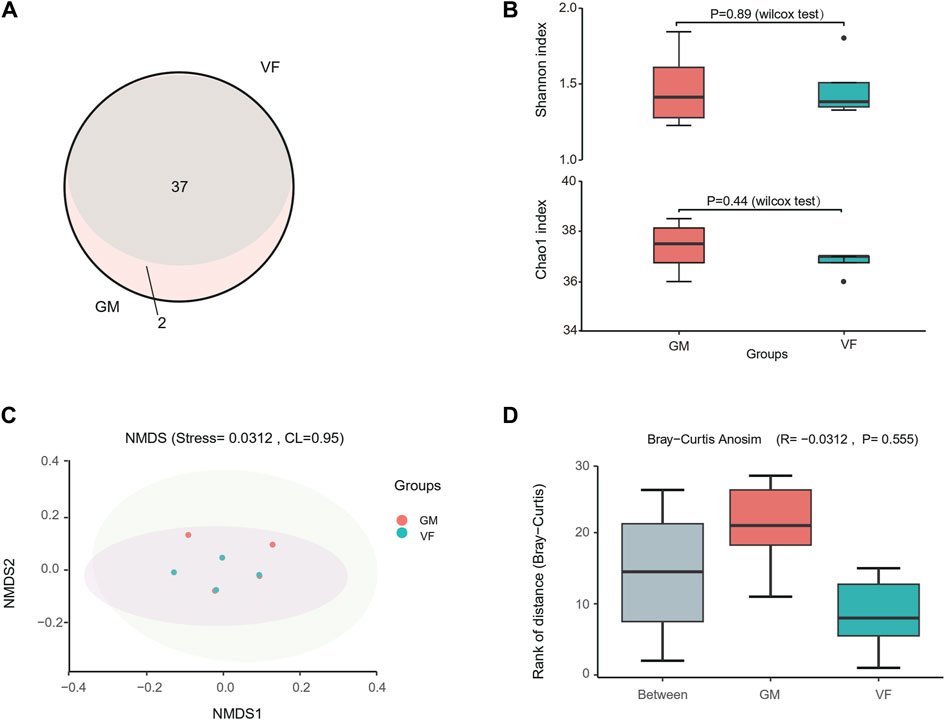
Figure 5. 12S metabarcoding sequencing of sample filters by vacuum filtration and the GM water filter system. (A) Venn diagram of the OTU annotations for the GM water filter system (GM) and vacuum filtration (VF). (B) Alpha diversity of the two groups. (C) Non-metric multidimensional scaling (NMDS) scatter plot for the Bray–Curtis distance of the two groups. The shaded areas represent the confidence intervals (0.95). The stress value reflects the quality of the NMDS analysis results. When stress <0.05, the analytical result has excellent representativeness. (D) Box plot of significant differences between two groups obtained using analysis of similarity (AnoSim) for the Bray–Curtis dissimilarity. R < 0 indicates that the difference between the groups is smaller than the difference within the group. P < 0.05 indicates statistical significance.
4 Discussion
We engineered a portable water filtration device using a GM dual-channel water filter for eDNA collection. This innovative system markedly expedites the filtration process for large-volume water samples (10 L) and reduces the time from several hours required by traditional vacuum filtration methods to only 10 min. When we evaluated commercially available eDNA extraction kits, we observed that kits tailored for smaller filter membranes (ø 47 mm) dominated (Schweiss et al., 2020; Wang et al., 2022), which also makes extraction of DNA from environmental water samples tedious and expensive. Therefore, to complement the GM water filter, we designed a compatible eDNA extraction kit, which was optimized for the large filter membranes (ø 100 mm) used by our system. Pilot studies with the GM dual-channel water filter and the Water Filter DNA Extraction Kit showed high agreement in terms of species annotation.
When sampling eDNA from aquatic environments, the choice of the filter material, the pore size of the filter membrane, and the volume of the water filtered are critical factors that significantly affect the capture efficiency of eDNA (Majaneva et al., 2018). In this study, the mixed cellulose ester filter membrane was selected for its superior eDNA yield when compared with polyethene sulfone, polyvinylidene fluoride, and polycarbonate filters (Liang and Keeley, 2013; Majaneva et al., 2018). The pore size determines the retention of eDNA-laden particles. Small pore-size filters [0.20 µm (Liang and Keeley, 2013)] have been shown to enrich the eDNA yield, while they may lead to faster clogging of the filter, especially in algal blooming or turbid waters. In such conditions, pre-filtration seems to be a good strategy to intercept larger particles, such as sediment, organic debris, and other macroscopic materials. Our developed GM dual-channel water filter integrated a bucket-shaped filter (120 mesh) at the water inlet to perform a pre-filtration step to enhance the efficiency of the subsequent finer filter membrane designed for eDNA capture. Employing a larger pore-size filter membrane can significantly reduce the filtration time required for turbid water samples. However, this efficiency gain was accompanied by a notable reduction in eDNA recovery, presumably due to the increased pore size, allowing a portion of the eDNA-containing particles to pass through the filter (Turner et al., 2014). Alternatively, augmenting the volume of water may compensate for the diminished capture rate; however, it necessitates an extension of the filtration time. In summary, a subtle equilibrium must be struck, given the interplay between the membrane pore size, the volume of the water sample, the duration of filtration, and the efficiency of eDNA capture. The GM dual-channel water filter employed a pre-filtration (120 mesh) step followed by fine filtration (0.22 μm or 0.45 μm) to allow the filtering of 10 L of the water sample within 10 min, thereby ensuring a high efficiency of eDNA enrichment.
For still water samples with turbidity levels below 8 NTUs, the filtration process takes approximately 10 min, and interestingly, relatively pristine groundwater with turbidity ranging from 1.23 to 1.70 NTUs also requires a similar duration. This suggests that the filtration time does not scale linearly with decreasing turbidity. The association between turbidity and flow rate appears to be more complex than a straightforward negative linear correlation (Supplementary Figure S1). Moreover, turbidity is not the sole factor governing the filtration rate. The free flowing rate (no-loading filter membrane) of our peristaltic pump is 0.7 L/min, and it rapidly increases until the sample turbidity is above 8, at which point filtration slows down drastically. Consequently, for optimal filtration efficiency, we recommend targeting still water bodies with turbidity levels below 8 NTUs. If the water body has relatively high turbidity (>8 NTU), pre-filtration should be applied.
We acknowledge the limitation inherent in the validation experiment of this study. Our benchmarking comparison with vacuum filtration was predominantly centered on the 12S rRNA metabarcoding sequencing (Majaneva et al., 2018), a method commonly applied for the identification of eukaryotic phytoplankton and fish. Its focus did not extend to other established sequencing methods, including 16S rRNA (Harrison et al., 2021), 18S rRNA (Minerovic et al., 2020), ITS (Fahner et al., 2016), and CO1 (Tagliabue et al., 2023) sequencing for bacteria, fungi and protists, fungi, and metazoan species identification, respectively. These methodologies were also extensively utilized in the profiling of the eDNA metabarcoding study and should be performed in subsequent studies to fully assess the strength and weakness of our equipment in the application of metabarcoding.
Our eDNA collection system has been widely disseminated among numerous collaborators conducting field studies in diverse aquatic ecosystems, spanning from urban reservoirs to lakes within national reserves. The invaluable feedbacks received have driven the ongoing enhancement of our system, focusing on simplifying its operation, reducing its weight, and creating extraction kits that are compatible with larger filter membranes, all while minimizing costs. By embracing an open-hardware philosophy, forthcoming iterations of this portable filtration system are poised to incorporate advancements such as higher-flow pumps, integrated large-capacity batteries, and materials that contribute to less overall weight, thereby enhancing field usability. At present, our systems are being utilized in the Shenzhen Academy of Environmental Sciences, the Key Laboratory of Poyang Lake Hydrology and Ecology Monitoring and Research, and the Eco-Environmental Monitoring Center of Dongting Lake in Hunan Province research programs. Collaborative input has been instrumental in guiding the design evolution, allowing us to refine the system’s field reliability and processing capacity.
5 Conclusion
We have successfully developed a portable water filtration system, the GM dual-channel water filter, complemented by a water filter DNA extraction kit that is specifically designed for the collection of environmental DNA (eDNA) from large-volume water samples quickly, such as 10 L volume in 10 min. This innovative system is particularly user-friendly, even for individuals with minimal prior experience in eDNA sampling, thanks to the provided operation manual. It holds great promise for field applications, as it could significantly simplify the process of water eDNA collection. By streamlining the filtration process and facilitating rapid species identification, this system is instrumental in enhancing biodiversity monitoring and conservation initiatives.
Data availability statement
The datasets presented in this study can be found in online repositories. CNGB Sequence Archive (https://db.cngb.org/cnsa/) under project accession number CNP0005350.
Author contributions
PW: conceptualization and writing–original draft. JF: writing–original draft. MJ: methodology and writing–original draft. SW: conceptualization and writing–review and editing. WH: methodology, validation, and writing–review and editing. MW: formal analysis, visualization, and writing–original draft. JnL: methodology and writing–review and editing. LfZ: conceptualization and writing–review and editing. YG: conceptualization, methodology, and writing–review and editing. JZ: data curation, resources, and writing–review and editing. MjL: data curation, resources, and writing–review and editing. HG: data curation, resources, and writing–review and editing. LdZ: methodology, visualization, writing–review and editing. JaL: writing–review and editing. MzL: methodology, supervision, and writing–review and editing. QY: project administration and writing–review and editing. LS: project administration and writing–review and editing. YL: writing–original draft, writing–review and editing, and project administration.
Funding
The authors declare that financial support was received for the research, authorship, and/or publication of this article. This work was supported by the National Key R&D Program of China 2023YFF0714300.
Acknowledgments
The authors thank WX.Z, LC, LL, GM.W, LZ.Z, and XX.L for their help in equipment and kit development. They extend their sincere gratitude to the esteemed research teams at the Shenzhen Academy of Environmental Sciences, the Key Laboratory of Poyang Lake Hydrology and Ecology Monitoring and Research, and the Eco-Environmental Monitoring Center of Dongting Lake in Hunan Province. Their constructive feedback on the authors’ filtration system has been invaluable in their pursuit of scientific advancement and innovation. They also thank Gabrielle David, PhD, from Liwen Bianji (Edanz) (www.liwenbianji.cn/) for editing the English text of a draft of this manuscript.
Conflict of interest
Authors PW, MJ, WH, MW, LfZ, YG, JZ, MjL, HG, LdZ, JaL, MzL, QY, LS, and YL were employed by GeneMind Biosciences Company Limited.
The remaining authors declare that the research was conducted in the absence of any commercial or financial relationships that could be construed as a potential conflict of interest.
Publisher’s note
All claims expressed in this article are solely those of the authors and do not necessarily represent those of their affiliated organizations, or those of the publisher, the editors, and the reviewers. Any product that may be evaluated in this article, or claim that may be made by its manufacturer, is not guaranteed or endorsed by the publisher.
Supplementary material
The Supplementary Material for this article can be found online at: https://www.frontiersin.org/articles/10.3389/fenvs.2024.1415338/full#supplementary-material
References
Beng, K. C., and Corlett, R. T. (2020). Applications of environmental DNA (eDNA) in ecology and conservation: opportunities, challenges and prospects. Biodivers. Conservation 29 (7), 2089–2121. doi:10.1007/s10531-020-01980-0
Capo, E., Spong, G., Königsson, H., and Byström, P. (2020). Effects of filtration methods and water volume on the quantification of brown trout (Salmo trutta) and Arctic char (Salvelinus alpinus) eDNA concentrations via droplet digital PCR. Environ. DNA 2 (2), 152–160. doi:10.1002/edn3.52
DeHart, H. M., Gasser, M. T., Dixon, J., and Thielen, P. (2023). An aquatic environmental DNA filtration system to maximize recovery potential and promote filtration approach standardization. PeerJ 11, e15360. doi:10.7717/peerj.15360
Dejean, T., Valentini, A., Duparc, A., Pellier-Cuit, S., Pompanon, F., Taberlet, P., et al. (2011). Persistence of environmental DNA in freshwater ecosystems. PLoS One 6 (8), e23398. doi:10.1371/journal.pone.0023398
Fahner, N. A., Shokralla, S., Baird, D. J., and Hajibabaei, M. (2016). Large-scale monitoring of plants through environmental DNA metabarcoding of soil: recovery, resolution, and annotation of four DNA markers. PLoS One 11 (6), e0157505. doi:10.1371/journal.pone.0157505
Feng, J., Zhou, L., Zhao, X., Chen, J., Li, Z., Liu, Y., et al. (2023). Evaluation of environmental factors and microbial community structure in an important drinking-water reservoir across seasons. Front. Microbiol. 14, 1091818. doi:10.3389/fmicb.2023.1091818
Fraser, C. I., Connell, L., Lee, C. K., and Cary, S. C. (2018). Evidence of plant and animal communities at exposed and subglacial (cave) geothermal sites in Antarctica. Polar Biol. 41, 417–421. doi:10.1007/s00300-017-2198-9
Goldberg, C. S., Turner, C. R., Deiner, K., Klymus, K. E., Thomsen, P. F., Murphy, M. A., et al. (2016). Critical considerations for the application of environmental DNA methods to detect aquatic species. Methods Ecol. Evol. 7 (11), 1299–1307. doi:10.1111/2041-210X.12595
Harrison, J. P., Chronopoulou, P.-M., Salonen, I. S., Jilbert, T., and Koho, K. A. (2021). 16S and 18S rRNA gene metabarcoding provide congruent information on the responses of sediment communities to eutrophication. Front. Mar. Sci. 8, 708716. doi:10.3389/fmars.2021.708716
James, J., Moore, E., Naden, R., Aston, B., Bradbeer, S., Masud, N., et al. (2024). Using eDNA to detect freshwater invasive non-native species under controlled conditions. Manag. Biol. Invasions 15 (1), 41–50. doi:10.3391/mbi.2024.15.1.03
Lear, G., Dickie, I., Banks, J., Boyer, S., Buckley, H. L., Buckley, T. R., et al. (2018). Methods for the extraction, storage, amplification and sequencing of DNA from environmental samples. N. Z. J. Ecol. 42 (1), 10–50A. doi:10.20417/nzjecol.42.9
Liang, Z., and Keeley, A. (2013). Filtration recovery of extracellular DNA from environmental water samples. Environ. Sci. and Technol. 47 (16), 9324–9331. doi:10.1021/es401342b
Madduppa, H., Cahyani, N. K. D., Anggoro, A. W., Subhan, B., Jefri, E., Sani, L. M. I., et al. (2021). eDNA metabarcoding illuminates species diversity and composition of three phyla (chordata, mollusca and echinodermata) across Indonesian coral reefs. Biodivers. Conservation 30 (11), 3087–3114. doi:10.1007/s10531-021-02237-0
Majaneva, M., Diserud, O. H., Eagle, S. H., Boström, E., Hajibabaei, M., and Ekrem, T. (2018). Environmental DNA filtration techniques affect recovered biodiversity. Sci. Rep. 8 (1), 4682. doi:10.1038/s41598-018-23052-8
Mauvisseau, Q., Kalogianni, E., Zimmerman, B., Bulling, M., Brys, R., and Sweet, M. (2020). eDNA-based monitoring: advancement in management and conservation of critically endangered killifish species. Environ. DNA 2 (4), 601–613. doi:10.1002/edn3.92
McClenaghan, B., Fahner, N., Cote, D., Chawarski, J., McCarthy, A., Rajabi, H., et al. (2020). Harnessing the power of eDNA metabarcoding for the detection of deep-sea fishes. PloS one 15 (11), e0236540. doi:10.1371/journal.pone.0236540
Minamoto, T. (2022). Environmental DNA analysis for macro-organisms: species distribution and more. DNA Res. 29 (3), dsac018. doi:10.1093/dnares/dsac018
Minerovic, A. D., Potapova, M. G., Sales, C. M., Price, J. R., and Enache, M. D. (2020). 18S-V9 DNA metabarcoding detects the effect of water-quality impairment on stream biofilm eukaryotic assemblages. Ecol. Indic. 113, 106225. doi:10.1016/j.ecolind.2020.106225
Nagler, M., Podmirseg, S. M., Ascher-Jenull, J., Sint, D., and Traugott, M. (2022). Why eDNA fractions need consideration in biomonitoring. Mol. Ecol. Resour. 22 (7), 2458–2470. doi:10.1111/1755-0998.13658
Ogram, A., Sayler, G. S., and Barkay, T. (1987). The extraction and purification of microbial DNA from sediments. J. Microbiol. methods 7 (2-3), 57–66. doi:10.1016/0167-7012(87)90025-X
Pawlowski, J., Apothéloz-Perret-Gentil, L., and Altermatt, F. (2020). Environmental DNA: What's behind the term? Clarifying the terminology and recommendations for its future use in biomonitoring. Mol. Ecol. 29 (22), 4258–4264. doi:10.1111/mec.15643
Pinfield, R., Dillane, E., Runge, A. K. W., Evans, A., Mirimin, L., Niemann, J., et al. (2019). False-negative detections from environmental DNA collected in the presence of large numbers of killer whales (Orcinus orca). Environ. DNA 1 (4), 316–328. doi:10.1002/edn3.32
Ratsch, R., Kingsbury, B. A., and Jordan, M. A. (2020). Exploration of environmental DNA (eDNA) to detect Kirtland’s snake (Clonophis kirtlandii). Animals 10 (6), 1057. doi:10.3390/ani10061057
Rees, H. C., Maddison, B. C., Middleditch, D. J., Patmore, J. R., and Gough, K. C. (2014). REVIEW: the detection of aquatic animal species using environmental DNA – a review of eDNA as a survey tool in ecology. J. Appl. Ecol. 51 (5), 1450–1459. doi:10.1111/1365-2664.12306
Roesma, D. I., Djong, H. T., Janra, M. N., and Aidil, D. R. (2021). Freshwater vertebrates monitoring in maninjau lake, west sumatra, Indonesia using environmental DNA. Biodiversitas J. Biol. Divers. 22 (5). doi:10.13057/biodiv/d220543
Saccò, M., Guzik, M. T., van der Heyde, M., Nevill, P., Cooper, S. J., Austin, A. D., et al. (2022). eDNA in subterranean ecosystems: applications, technical aspects, and future prospects. Sci. Total Environ. 820, 153223. doi:10.1016/j.scitotenv.2022.153223
Schweiss, K. E., Lehman, R. N., Drymon, J. M., and Phillips, N. M. (2020). Development of highly sensitive environmental DNA methods for the detection of Bull Sharks, Carcharhinus leucas (Müller and Henle, 1839), using Droplet Digital™ PCR. Environ. DNA 2 (1), 3–12. doi:10.1002/edn3.39
Tagliabue, A., Matterson, K. O., Ponti, M., Turicchia, E., Abbiati, M., and Costantini, F. (2023). Sediment and bottom water eDNA metabarcoding to support coastal management. Ocean and Coast. Manag. 244, 106785. doi:10.1016/j.ocecoaman.2023.106785
Takahashi, M., Saccò, M., Kestel, J. H., Nester, G., Campbell, M. A., Van Der Heyde, M., et al. (2023). Aquatic environmental DNA: a review of the macro-organismal biomonitoring revolution. Sci. Total Environ. 873, 162322. doi:10.1016/j.scitotenv.2023.162322
Thomas, A. C., Howard, J., Nguyen, P. L., Seimon, T. A., and Goldberg, C. S. (2018). eDNA Sampler: a fully integrated environmental DNA sampling system. Methods Ecol. Evol. 9 (6), 1379–1385. doi:10.1111/2041-210X.12994
Thomsen, P. F., and Willerslev, E. (2015). Environmental DNA–An emerging tool in conservation for monitoring past and present biodiversity. Biol. Conserv. 183, 4–18. doi:10.1016/j.biocon.2014.11.019
Turner, C. R., Barnes, M. A., Xu, C. C., Jones, S. E., Jerde, C. L., and Lodge, D. M. (2014). Particle size distribution and optimal capture of aqueous macrobial eDNA. Methods Ecol. Evol. 5 (7), 676–684. doi:10.1111/2041-210X.12206
Wang, Y., Liu, H.-Z., Li, S., and Yu, D. (2022). Optimization of fish environmental DNA sample processing and preservation technology based on droplet digital PCR. Acta Hydrobiol. Sin. 46 (3), 332–341. doi:10.7541/2022.2021.281
West, K. M., Stat, M., Harvey, E. S., Skepper, C. L., DiBattista, J. D., Richards, Z. T., et al. (2020). eDNA metabarcoding survey reveals fine-scale coral reef community variation across a remote, tropical island ecosystem. Mol. Ecol. 29 (6), 1069–1086. doi:10.1111/mec.15382
Wilcox, T. M., McKelvey, K. S., Young, M. K., Jane, S. F., Lowe, W. H., Whiteley, A. R., et al. (2013). Robust detection of rare species using environmental DNA: the importance of primer specificity. PloS one 8 (3), e59520. doi:10.1371/journal.pone.0059520
Wong, M.K.-S., Nakao, M., and Hyodo, S. (2020). Field application of an improved protocol for environmental DNA extraction, purification, and measurement using Sterivex filter. Sci. Rep. 10 (1), 21531. doi:10.1038/s41598-020-77304-7
Keywords: aquatic ecosystem, eDNA sample collection, metabarcoding, metagenome, quick filtering
Citation: Wu P, Feng J, Ju M, Wu S, Han W, Wang M, Liao J, Zhao L, Gao Y, Zheng J, Luo M, Gong H, Zeng L, Lai J, Li M, Yan Q, Sun L and Liu Y (2024) Water filter: a rapid water environmental DNA collector in the field. Front. Environ. Sci. 12:1415338. doi: 10.3389/fenvs.2024.1415338
Received: 10 April 2024; Accepted: 31 July 2024;
Published: 23 August 2024.
Edited by:
Felipe Polivanov Ottoni, Federal University of Maranhão, BrazilReviewed by:
Beilun Zhao, Uppsala University, SwedenSara Fernández Fernández, University of Oviedo, Spain
Copyright © 2024 Wu, Feng, Ju, Wu, Han, Wang, Liao, Zhao, Gao, Zheng, Luo, Gong, Zeng, Lai, Li, Yan, Sun and Liu. This is an open-access article distributed under the terms of the Creative Commons Attribution License (CC BY). The use, distribution or reproduction in other forums is permitted, provided the original author(s) and the copyright owner(s) are credited and that the original publication in this journal is cited, in accordance with accepted academic practice. No use, distribution or reproduction is permitted which does not comply with these terms.
*Correspondence: Yongfeng Liu, bGl1eW9uZ2ZlbmdAZ2VuZW1pbmQuY29t
†These authors have contributed equally to this work and share first authorship