 Yalin Han
 Cuicui Qi2
95% of researchers rate our articles as excellent or good
Learn more about the work of our research integrity team to safeguard the quality of each article we publish.
Find out more
ORIGINAL RESEARCH article
Front. Environ. Sci. , 17 July 2024
Sec. Toxicology, Pollution and the Environment
Volume 12 - 2024 | https://doi.org/10.3389/fenvs.2024.1409011
Introduction: Endocrine-disrupting chemicals (EDCs) in effluent and residual sludge from wastewater treatment plants (WWTPs) pose significant environmental and human health risks due to their persistence, bioaccumulation, and difficulty in detection and degradation. This study investigates the environmental exposure and risks associated with EDCs in effluent and sludge from four WWTPs: Tangxi River (TXH), Zipeng Mountain (ZPS), Lianxi (LX), and Wang Xiaoying (WXY).
Methods: Environmental exposure indexes of EDCs were assessed in the effluent and sludge of the four WWTPs across four seasons (spring, summer, autumn, and winter) from October 2017 to October 2018. Detection rates of various pollutants, their seasonal and spatial characteristics, and removal rates were analyzed. Positive matrix factorization (PMF) was used for source analysis under influent data, and an ecological risk assessment was conducted using the risk quotient (RQ) method.
Results: The study found 4-n-nonylphenol (NP) and di-2-ethylhexyl phthalate (DEHP) had 100% detection rates in the effluent of all four WWTPs, while only DEHP showed a 100% detection rate in the sludge. Bisphenol A (BPA) exhibited the highest concentration in the TXH effluent during autumn. Benzo(a)pyrene (B(a)P) was detected only in the sludge during spring and summer and in the effluent of TXH and WXY. PMF source analysis indicated industrial wastewater discharge as the primary source of pollutants. Ecological risk assessment revealed a high RQ for estriol (E3) in TXH effluent during autumn, and DEHP presented a potential carcinogenic risk through drinking water.
Discussion: The findings highlight significant seasonal and spatial variations in EDC concentrations and removal rates across the WWTPs. The persistent presence of DEHP and the high-risk levels of E3 in specific seasons underscore the need for improved treatment processes and stricter industrial discharge regulations to mitigate EDC-related risks. Further research is recommended to explore advanced detection and degradation techniques for EDCs in WWTPs.
Endocrine-disrupting chemicals (EDCs) are a group of emerging pollutants known for their high toxicity (Charitos et al., 2022) and ability to bioaccumulate (Ashfaq et al., 2018). These compounds have been detected in a range of products, including pharmaceuticals, personal care products, pesticides, surfactants, and various other items (Andra et al., 2015; Careghini et al., 2015). They are subsequently often detected in water bodies; the effluent, influent, and sludge of wastewater treatment plants (WWTPs); even in human body, the geometric mean urinary concentration geome Of BPA in Chinese young adults was 2.23 ng mL−1 (Gao et al., 2016). Unlike traditional pollutants, EDCs tend to be persistent and stable in the environment, where they are present in low concentrations. However, they can migrate long distances in the environment, accumulate in organisms, and then spread through food webs via mechanisms such as blood circulation and trophic level amplification (Vandenberg, 2021). Their presence in organisms causes the abnormal development of spermathecae in male animals and even in hermaphrodites (Godfray et al., 2019), and mimics hormones and their activity, disrupting the human endocrine and reproductive systems, resulting in different pathologic complications (Ghosh et al., 2022). Endocrine-disrupting chemicals are frequently detected in water bodies. In a 2018 study, 14 phthalate ester (PAE) pollutants were detected in the water and sediments of Asan Lake in South Korea, with concentrations up to 2.29 μg·L−1 in water and 3.6–8,973 μg kg−1 dry weight in sediment (Lee et al., 2019). Twenty-one EDCs were also detected in groundwater samples from the United States, with concentrations in the range of 0.6–3.0 μg L−1 (Landers, 2019). The situation in China is also concerning. The Yangtze River basin is one of the most polluted regions in China, and several common endocrine disruptors, including bisphenol A (BPA), 4-n-nonylphenol (NP), and tert-butylphenol (TBP) have been detected in the surface water of the Yangzi River, with maximum values of 112.1, 8.58, and 5.63 μg L−1, respectively (Liu et al., 2017). Additionally, the investigation showed that the EDC concentrations in the influent, effluent, and sludge of urban WWTPs in China differed significantly between the four seasons and between the north and south of the country. It is possible that the discrepancies might be driven by a distinction of population size served by the WWTP, the urban characteristics where the WWTP is located, and the influent quality (Lopez-Velazquez et al., 2021; Yu et al., 2022).
EDCs are widely sourced from domestic and industrial wastewater. For example, BPA is mainly used in resin coatings and polycarbonate plastics, while EE2 is mainly used in contraceptives (Song et al., 2014). The main treatment processes used to control EDC levels in urban WWTPs are activated sludge, membrane bioreactor (MBR), and artificial wetlands (Qiang et al., 2013), among the numerous WWTPs surveyed, 47.5% of 17α-ethinylestradiol (EE2) was removed during the primary treatment process, 55.3% was removed through biological filtration, and 71.5% was removed through activated sludge treatment (Tang et al., 2021). The biological treatment removal efficiency of BPA in Shanghai WWTPs is over 95% (Xu et al., 2016). Some EDCs in the wastewater can be adsorbed in the sludge to achieve removal effects, but they are also easily entering the water environment, respectively, and WWTP is considered to be the main source of EDCs in the environment (Eli et al., 2020). According to statistics, South Korean sewage treatment plants process 25 million tons of wastewater every day and produce three million tons of sludge annually (Lee et al., 2015). There has been only limited monitoring of EDCs in the large WWTPs in China, which is concerning given the significant amount of industrial and domestic wastewater being generated, resulting in the production of influent and effluent water, as well as contaminated sludge. The total EDC concentrations in the influent and effluent water of three WWTPs in Hong Kong were reported to be 3.107–5.83 μg L−1 and 1.23–2.64 μg L−1, and alkylphenols and BPA are the main pollutants in wastewater (Zhou et al., 2019). Although these concentrations are low, they could still result in adverse health effects (Shahid et al., 2021). A better understanding of the spatial and temporal characteristics and ecological risks of EDCs in WWTPs would therefore be helpful to realize their effective removal from the water environment.
In this study, four representative WWTPs in the Chaohu Lake basin, China, were selected, each of which operated a relatively effective wastewater treatment process. The environmental exposure characteristics of 18 typical EDCs in the WWTP effluents were obtained through an experimental analysis. A source analysis was conducted, and the entropy method was applied to assess the ecological and health risks of typical EDCs. The findings are expected to lead to an improvement in the removal effect of EDCs in the WWTPs, and to lay a good foundation for the establishment of the model and its application in practice.
The Tangxi River WWTP (TXH) is located in Binhu District, Hefei City, with a service area of approximately 7.9 square kilometers and a population of approximately 150,000 people. The main treatment process is the anaerobic/anoxic/aerobic -membrane bioreactor (A/A/O + MBR) membrane reaction tank process (Figure 1B); The Zipeng Mountain WWTP (ZPS) is located in Zipengshan Town, Feixi County, with a service area of about 17 square kilometers and a population of about 50,000 people. The main treatment process is the secondary anoxic/aerobic (AO) process (Figure 1C); The Lianxi WWTP (LX) is located in Cuo Town, Feidong County, with a service area of approximately 21 square kilometers and a population of approximately 326,000. The main treatment processes are air flotation + hydrolysis acidification and sequencing batch reactors (SBR) +air flotation filtration processes (Figure 1D); The Wang Xiaoying WWTP (WXY) is located in Baohe District, Hefei City, with a service area of approximately 61 square kilometers and a population of approximately 759,000. The main treatment processes include secondary sedimentation tank + activated sand filter, and BAF aerated biological filter (Figure 1F).
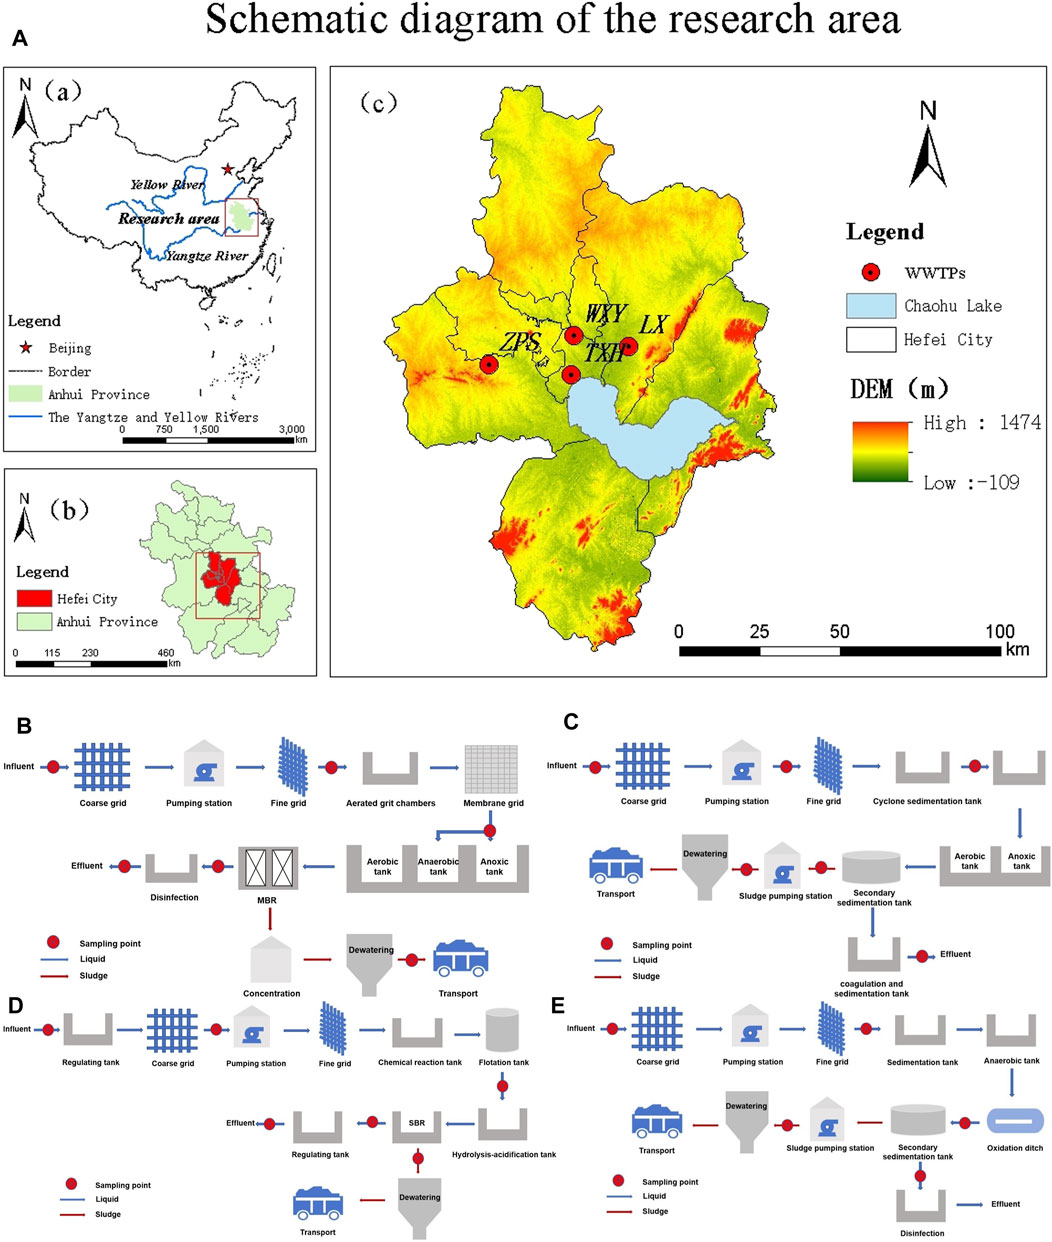
Figure 1. Schematic diagram of the research area and WWTPs and sampling sites.
Water and sludge samples were taken at four seasonal time points (27 September 2017, 11 January 2018, 7 March 2018, and 1 June 2018) and at different sampling points at each WWTP. The detailed process of wastewater and sludge treatment and the location of sampling points are shown in Figure 1. For each sample, a volume of 1 L was collected in brown glass sampling bottles that were transported back to the laboratory in a timely manner to complete the pre-treatment of the samples. All samples were kept in a refrigerator prior to processing. Samplers and sample bottles were soaked in dilute HCl solution before sampling, rinsed with distilled water, washed with methanol for a second time, and finally rinsed with distilled water and ultrapure water. They were then left to dry naturally.
In this study, 18 typical EDCs from four classes (estrogens, PAEs, polycyclic aromatic hydrocarbons (PAHs), and polychlorinated biphenyls (PCBs)) were selected as the target compounds for the study. The estrogens were EE2, estrone (E1), E2, estriol (E3), NP, and BPA. The phthalates were dimethyl phthalate (DMP), diethyl phthalate (DEP), dibutyl phthalate (DBP), di-2-ethylhexyl phthalate (DEHP). The PAH was benzo(a) pyrene (BaP). And the PCBs were a commonly used set of PCB standards including seven specific congeners: 28, 52, 101, 118, 138, 153, and 180. Standard solutions of these compounds were purchased from Shanghai Amperexperiment Technology Co., Ltd. (China). The other reagents used in the study were methanol, dichloromethane (HPLC first-grade chromatographic purity, Tianjin Siyou Company, China), acetone (analytical purity, Xilong Chemical Company, China), and n-hexane (HPLC chromatographic grade, Tianjin Daimao Company, China).
The pretreatment of water samples was performed by solid phase extraction (SPE). One liter of water was filtered through a 0.45 μm glass fiber membrane, passed through a chromatography column with 2.5 mL of methanol and 3 mL of purified water at a flow rate of 5 mL min−1, and then rinsed with 5 mL of methanol and 5 mL of ultrapure water in a C18 column. The 1 L water sample was passed through the C18 SPE column at a flow rate of 5 mL min−1, and then the column was vacuum dried for 1.5 h. The residual water in the column was removed by elution with 10 mL of methanol. The eluate was collected in a glass centrifuge tube, blown to near dryness with nitrogen for subsequent instrumental analysis, as described in 2.4 (Yu and Wu, 2011).
The pre-treatment of sludge was carried out by ultrasonic extraction, and the sludge was freeze-dried for 48 h. 1 g sludge sample was placed into a 10 mL glass centrifuge tube, and 5 mL of dichloromethane and 5 mL of n-hexane were added. An ultrasonic extraction was carried out for 15 min, and the supernatant was centrifuged at 4,000 r·min−1 for 3 min, and then poured into a cigar-shaped bottle. The extraction was then repeated with the addition of 5 mL of dichloromethane, 5 mL of n-hexane, and ultrasonic extraction for 15 min. The supernatant was removed and centrifuged at 4,000 r·min−1 for 3 min. The resulting supernatant was then transferred back into the original container. The container was subjected to rotary evaporation until the volume was reduced to 1 mL. Subsequently, the silica gel column was activated with 6 mL of dichloromethane and 6 mL of n-hexane, and the small sample column was rinsed with 10 mL of n-hexane. The eluent in the glass centrifuge tube was nitrogen-blown to near-dryness for subsequent instrumental analysis, as described in 2.4.
The estrogens were analyzed by UPLC on a Waters Acquity UPLCTM BEH C18 column (50 × 2.1 mm, 1.7 μm) at 40°C with an injection volume of 5 μL. Mobile phase A was ammonium acetate at a concentration of 5 mmol L−1. Mobile phase B was acetonitrile at a flow rate of 0.2 mL/min. The gradient elution conditions are shown in Supplementary Table S1.
The PAEs, PAH, and PCBs were analyzed on a Thermo TSQ Quantum XLS Ultra triple quadrupole gas chromatograph with a DB-1MS capillary column (dimensions, 30 m × 0.25 mm × 0.25 μm). The operating conditions were as follows: injection volume: 1 μL; detection temperature: 280°C; inlet temperature: 270°C, non-split injection; programmed temperature increase: 60°C for 1 min; increase to 180°C at 30°C/min and held for 1 min, and increase to 290°C at 10 C/min and held for 4 min; carrier gas 99.99% helium, 1.2 mL min−1; tail gas: nitrogen, 20.0 mL min−1.
The ionization mode conditions were as follows: EI; capillary voltage: 3.0 kV; source temperature: 150°C; nebulized gas temperature: 700°C; nebulized gas flow rate: 1000 L h−1; cone pore gas flow rate: 50 L h−1; MS1 low/high end resolution: 2.80/14.70; MS2 low/high end resolution: 3.0/14.18; MS1/MS2 ion energy: 0.6/0.7; Collision gas flow rate: 0.15 mL min−1; secondary cone bore voltage: 3.0 V; collision chamber inlet/outlet voltage: 30.0/30.0. The parameters of the mass spectrometry detection conditions are shown in Supplementary Table S2 and S3.
Accurately extract a mixed standard sample of the target compound, and dilute it with methanol to create a series of standard working solutions with different concentration gradients. Analyze these solutions under optimized chromatographic and mass spectrometry conditions to determine the concentration range with a significant linear relationship for the target compound, thereby constructing a standard curve. The limits of detection (LOD) and quantification (LOQ) were determined as 3 and 10 times the signal-to-noise ratio, respectively (Table 3). Conduct spiked recovery rate experiments using water and mud samples from the sewage treatment plant, with three parallel samples at each concentration level. The processing procedure is the same as the sample analysis process, and the results meet the requirements for residual analysis.
Positive matrix factor analysis is a novel source apportionment method developed based on factor analysis methods. Similar to principal component analysis, the PMF algorithm mainly utilizes data on the chemical composition of receptor points, converts monitoring data into matrices based on samples and components, and splits this matrix into source distribution matrix and source contribution matrix (Manousakas et al., 2015). By monitoring the EDCs of different sources, different fingerprints corresponding to different sources were obtained. By comparing the data of the actual measured EDCs with the source fingerprints corresponding to the sources, the different sources of the EDCs at the monitoring points could be determined (Mandariya et al., 2016). The PMF base equation was:
where Xij is the concentration of species j measured on sample i, p is the number of factors contributing to the sample, fki is the concentration of species j in the factor profile k, gik is the relative contribution of factor k to the sample i, and eij is the error of the PMF model for species j measured on sample i. Minimization of the objective function Q allows each species and profile, and thus the stability of the solution, to be assessed. It is defined as:
where Uij is the uncertainty of species j in sample i. Uncertainty estimation is a critical part of the PMF application, where each data value is assigned an estimated uncertainty that takes into account the analytical uncertainty and method detection limit (MDL). If the concentration of the substance in the sample is ≤ MDL, the uncertainty is calculated as:
If the concentration is > MDL, the formula is:
where Unc is the uncertainty; Uel is the error factor, and c is the measured concentration of the component. The error factor in this study was assumed equal to 10%.
An ecological risk evaluation is commonly conducted using RQ method, and characterizes ecological risk in a quantitative way (Kalf et al., 1997). It is calculated as follows:
The ratio of the actual detected environmental exposure concentration (MEC) of the target compound to the predicted no effect concentration (PNEC) of its toxicity in the effluent, expressed as a risk quotient (RQ), T represents acute and chronic toxicity data, AF represents safety factor. In many cases, receptors may be directly exposed to wastewater and sludge from sewage treatment plants, especially if the treatment process is incomplete, or there are equipment failures or pipeline leaks. Wastewater and sludge may directly enter the surrounding environment, causing direct impacts on biological receptors and human receptors. According to the EU guidelines on risk assessment, the minimum half effective concentration (EC50) or maximum unobserved effect concentration (NOEC) values are used as the basic data for PNEC, as shown in Supplementary Table S4 and S5.
For B (a) P, the threshold effect concentration value of B (a) p = 150 ng g−1 is selected as the PNEC. The PNEC of PCBs is 0.5 μg L−1. When the ecological RQ is used to characterize the degree of ecological environmental risk, the environmental risk can be divided into three levels according to its magnitude: low risk is when 0.01< RQ ≤ 0.1, medium risk is when 0.1< RQ ≤ 1, and high risk is when RQ > 1 (Lahnsteiner et al., 2005).
The treated sewage will eventually be discharged into the water for human use, and most environmental hormone pollutants come into contact with the human body through drinking water. In this study, the effluent of the sewage treatment plant is directed towards the Chaohu water system, which is the largest freshwater lake in Anhui and a very important drinking water source in Hefei. Therefore, in this study, the human health risks of drinking water sources were evaluated. Non-carcinogenic risk is usually described using the hazard quotient (HQ) as a risk index, with this value defined as the ratio of the long-term chronic daily intake (CDI) to the reference dose (US EPA National Center for Environmental Assessment, 1986), and is calculated as follows:
The carcinogenic risk (R) is the product of the long-term CDI and the carcinogenicity slope factor (SF), the value of which is expressed as the R value and is calculated as follows:
The long-term CDI for the different exposure routes is calculated as follows:
where Ci is the EDC concentration in the effluent, U is the daily water consumption, EF is the exposure frequency, ED is the exposure duration, BW is the average body weight, AT is the average exposure time, DEHP has a certain carcinogenic risk and a reference SF (Supplementary Table S6).
When the HQ is < 1, the exposure dose does not pose a non-carcinogenic risk to humans; when the HQ is > 1, the exposure dose poses a non-carcinogenic health risk to humans. When the R value is < 10−6, the risk can be considered as negligible; when the R value is in the range of 10−6 to 10−4, the exposure dose poses a potential risk to humans; and when the R is > 10−4, the exposure dose poses a risk to humans (Tohyama et al., 2001).
Endocrine-disrupting chemicals were detected in the influent and effluent water of the four WWTPs at different concentrations (Table 1). Among the 18 target compounds, the detection rates of BPA, NP, DBP, and DEHP exceeded 80% in the effluent of the four WWTPs, and NP and DEHP had the highest detection rate of 100%, while B(a) P was present in all samples at a concentration below the limit of quantification (LOQ) and was considered to be non-detectable. There were no PCBs detected in the WWTP effluents. From the detection rates, it was apparent that estrogenic and phthalate substances were widely present in the WWTPs, and both types of substance could present a serious threat to the water quality of receiving water bodies (Ismanto et al., 2022) and the health of Chaohu Lake residents (Zhang et al., 2019).
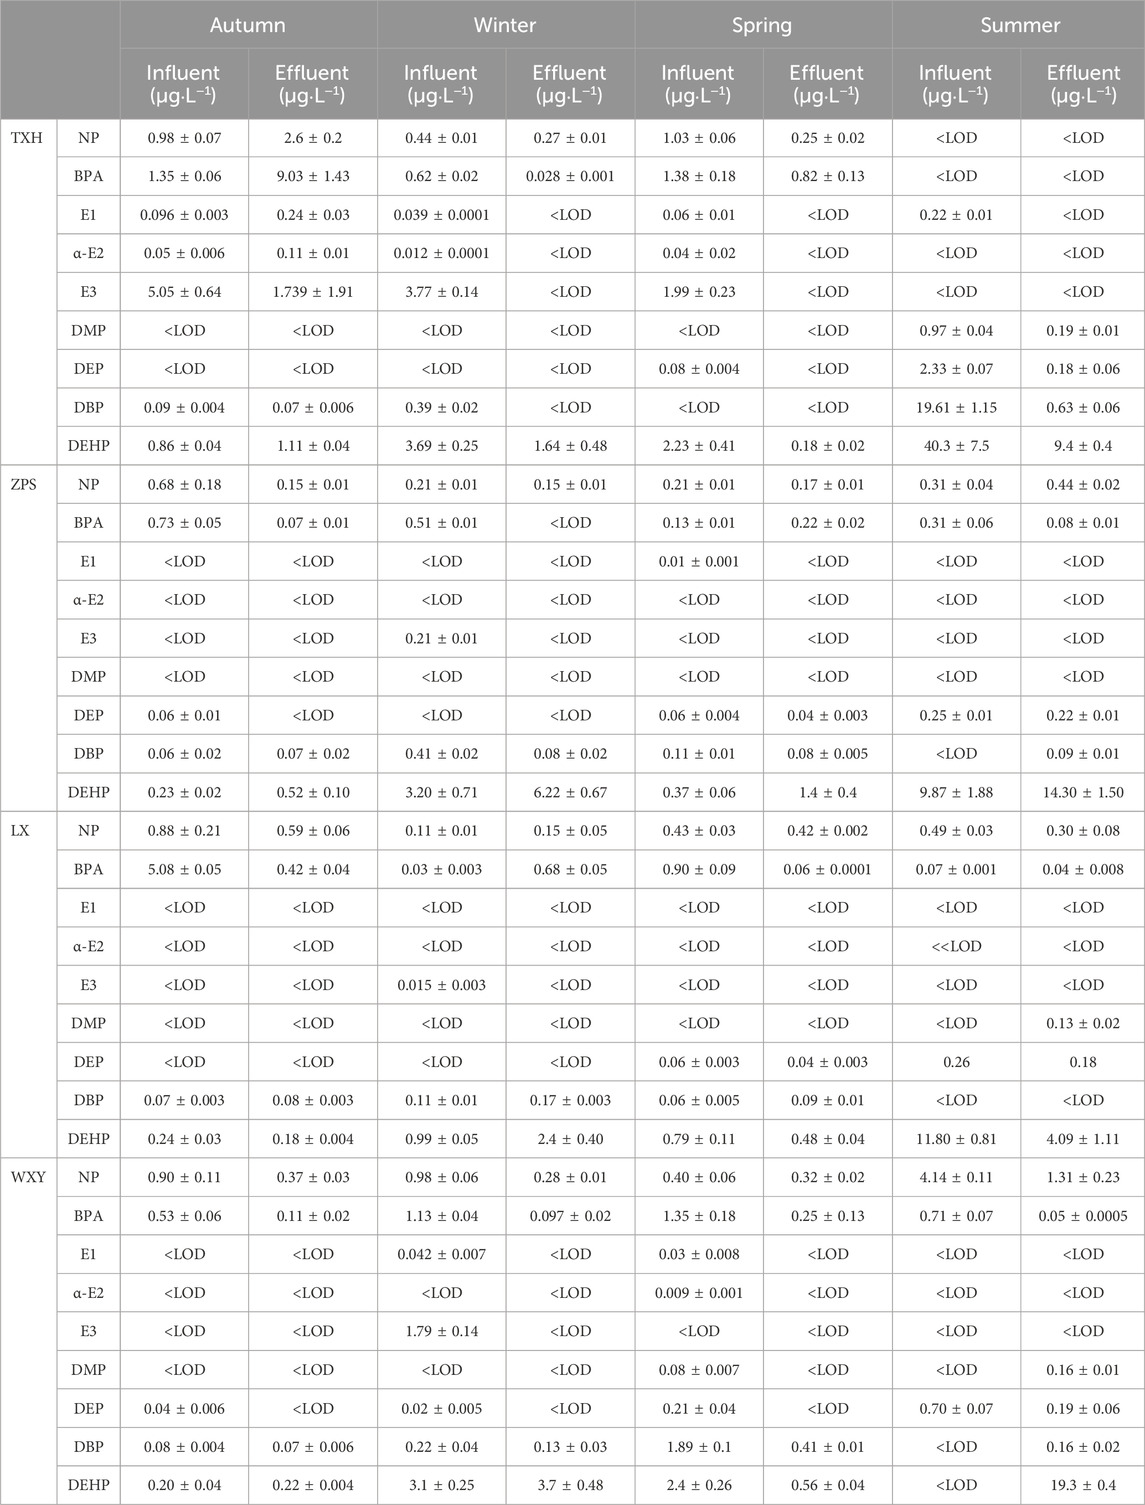
Table 1. Concentration and removal rate of EDCs in the influent and effluent of WWTPs.
The average BPA concentrations in the effluent water from the four WWTPs in the different seasons were 0.34, 0.05, 2.41, and 0.2 μg L−1. The average NP concentrations in the effluent water in the different seasons were 0.32, 0.62, 0.93, and 0.21 μg L−1. The E1, E2, and E3 concentrations were 0.242, 0.106, and 1.739 μg L−1, with each compound detected only in the autumn (Figure 2). The concentration of estrogen in TXH effluent is relatively high compared to other WWTPs, and the concentration of estrogen compounds detected in autumn effluent is 120%–568.9% higher than that in influent (Table 1). The average concentration of BPA detected in the influent of TXH in autumn is 1.35 μg L−1, while its average concentration detected in the effluent is 9.43 μg L−1, which may be due to the low rainfall in the Chaohu Lake basin at this time of the year. Without the dilution of precipitation, and because the humidity and temperature were lower than in the summer, various migratory and transformation behaviors were inactive in autumn. The difficulty of effectively removing estrogenic pollutants at this time of the year resulted in high concentrations (Gong et al., 2012).
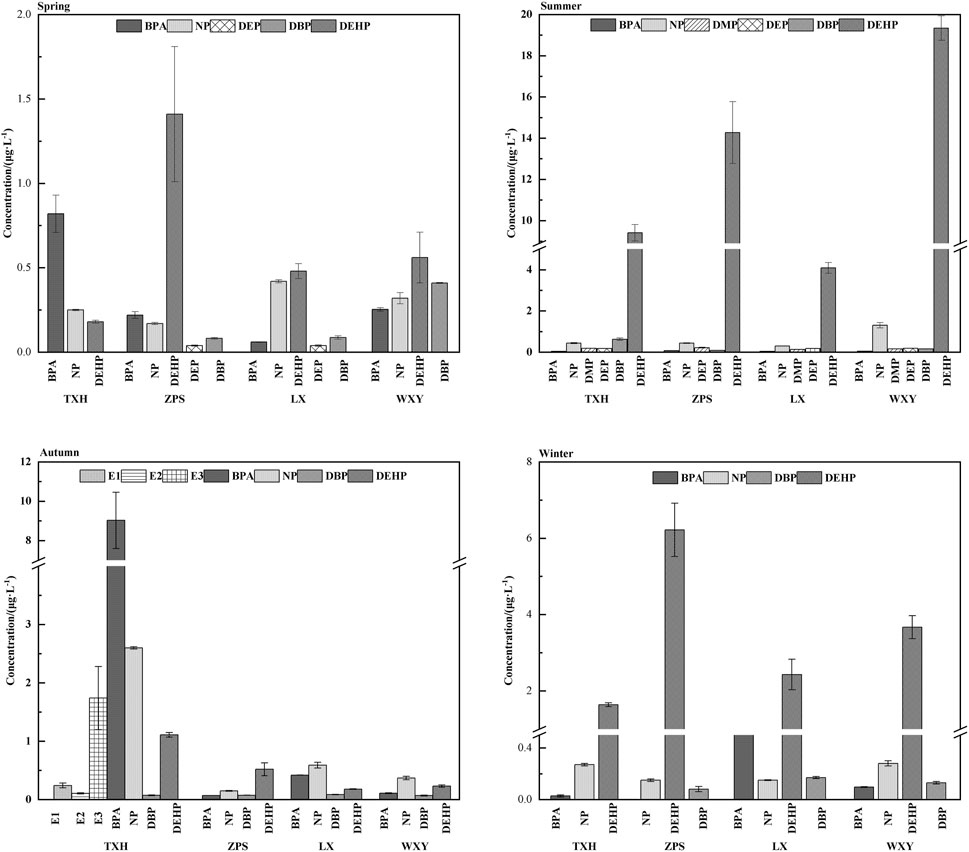
Figure 2. Seasonal distribution characteristics of EDCs in effluent.
The concentration ranges of the four PAEs were ND (<LOQ)−0.19 μg L−1 for DMP, ND−0.22 μg L−1 for DEP, ND−1.59 μg L−1 for DBP, and 0.18–19.34 μg L−1 for DEHP, with the highest values occurring in the WXY effluent in summer. The total PAEs in the WXY effluent ranged from 2.15 to 6.49 μg L−1, with an average concentration of 4.57 μg L−1. Dimethyl phthalate was detected only in summer, and DEP was detected in spring, summer, and winter, with average concentrations in the effluent in the different seasons of 0.0075, 0.027, and 0.2 μg L−1. The average DBP concentrations in the effluent in the different seasons were 0.078, 0.19, 0.44, and 0.22 μg L−1. The average DEHP concentrations in the effluent of the different seasons were 0.54, 4.12, 0.91, and 11.78 μg L−1. All four PAEs had seasonal distributions with significantly higher concentrations in summer and lower concentrations in autumn. In the TXH influent, the average concentration of DBP detected in summer reached 19.61 μg L−1, while the average concentration of DEHP in the ZPS influent in summer reached 9.87 μg L−1. This may be due to the wide use of PAEs in plastics, cosmetics, and other daily necessities. Under the high temperatures experienced in summer, PAEs are more likely to escape from plastics, leading to higher pollutant levels in summer than in the other three seasons (Sun et al., 2021).
The BPA concentrations in the Tangxi River (TXH), Zipeng Mountain (ZPS), Lianxi (LX), and WXY effluents had peak concentrations of 9.03, 0.22, 0.68, and 0.25 μg L−1, their influent concentrations are 1.35, 0.13, 0.03, and 1.35 μg L−1, therefore the BPA removal rate of WXY is positive, while the BPA removal rates of other WWTPs are negative, indicating that WXY’s treatment process has a good removal effect on BPA. There is enrichment phenomenon in other WWTPs treatment processes. The NP in the TXH, ZPS, LX and WXY effluents had peak concentrations of 2.60, 0.44, 0.59, and 1.31 μg L−1, their influent concentrations were 0.98, 0.31, 0.88, and 4.14 μg L−1. Similarly, the removal efficiency of NP at higher concentrations is better under the WXY treatment process. The concentration of estrogenic substances was highest in the TXH effluent and lowest in the ZPS effluent. E1, E2, and E3 detected in TXH effluent. Estrogens in the remaining three WWTPs were not detected. The concentrations of total estrogen-like compounds followed the order TXH > WXY > LX > ZPS. TXH effluent is prone to high concentration enrichment of estrogen in autumn, this may have been because two-thirds of the service area radiating from the TXH WWTP is a newly constructed stormwater diversion channel with a strong sewage collection capacity (Zhang et al., 2010).
The average DMP concentrations in the TXH, ZPS, LX, and WXY effluents were 0.048, ND, 0.033, and 0.04 μg L−1, respectively; Except for ZPS, DMP was not detected (<LOD), and all other WWTPs were only detected once. The average DEP concentrations in the TXH, ZPS, LX, and WXY effluents were 0.05, 0.07, 0.06, and 0.07 μg L−1. The average DBP concentrations in the TXH, ZPS, LX, and WXY effluents were 0.18, 0.08, 0.09, and 0.58 μg L−1. The average DEHP concentrations in the TXH, ZPS, LX, and WXY effluents were 3.085, 5.61, 1.795, and 6.87 μg L−1, the reason for the high concentration of DEHP is that, on the one hand, it has a wide range of sources, and on the other hand, based on the calculation of influent concentration, the removal rate of DEHP is also relatively low. The concentrations of total PAEs followed the order WXY > ZPS > TXH > LX. The concentrations of total PAEs were highest in the WXY effluent and lowest in the LX effluent, which may be due to the WXY WWTP servicing a larger area within the main urban area.
Estrogenic substances were detected in the sludge of the four WWTPs, with the detection rate following the order BPA = NP > E2 > E1. Neither E3 nor EE2 were detected in the sludge samples, and E1 and E2 were detected only in spring. The detection rates of BPA and NP were 87.5%, which indicated relatively serious pollution levels. The DEHP detection rate was 100%, and the detection rates of DMP, DEP, and DBP were 25%, 56.25%, and 75%, respectively, with the detection rates of DEHP > DBP > DEP > DMP, and B(a) P was not detected in autumn and winter.
The average BPA concentrations in sludge in the different periods were 0.12, 0.1, 0.03, and 0.09 mg kg−1, and it can be seen that the concentration is higher in spring and summer (Figure 3). The average NP concentrations in sludge in the different periods were 0.65, 1, 0.58, and 0.15 mg kg−1, also, the average concentration in summer is relatively high. The E1 and E2 average concentrations were 0.06 and 0.02 mg kg−1, with both compounds only detected in spring; EE2 and E3 were not detected in the sludge from all WWTPs in all time periods. In terms of their total concentration, the six estrogenic pollutants displayed a seasonal distribution of higher pollutant concentrations in summer and lower concentrations in winter in the sludge from each WWTP.
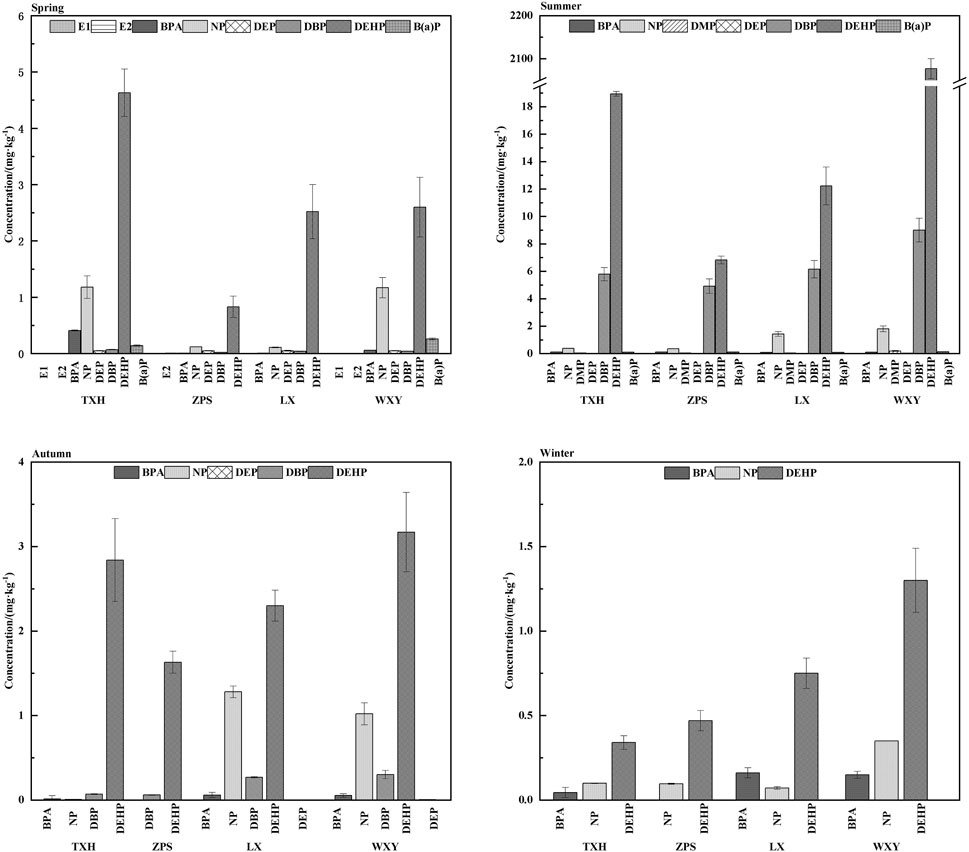
Figure 3. Seasonal distribution characteristics of EDCs in sludge.
DMP was only detected in summer, with a peak concentration of 0.19 mg kg−1. DEP was detected in spring, summer, and autumn, with seasonal average concentration of 0.05, 0.004, and 0.003 mg kg−1. DBP was not detected in winter, and the peak concentrations in the other three seasons were 0.07, 9, 0.27 mg kg−1 (Table 2), DEHP was detected throughout the sampling cycle, with peak concentrations of 4.63, 2077.1, 3.17, and 1.3 mg kg−1, respectively. Overall, the concentration of pollutants in sludge was much higher in summer than in the other three seasons.
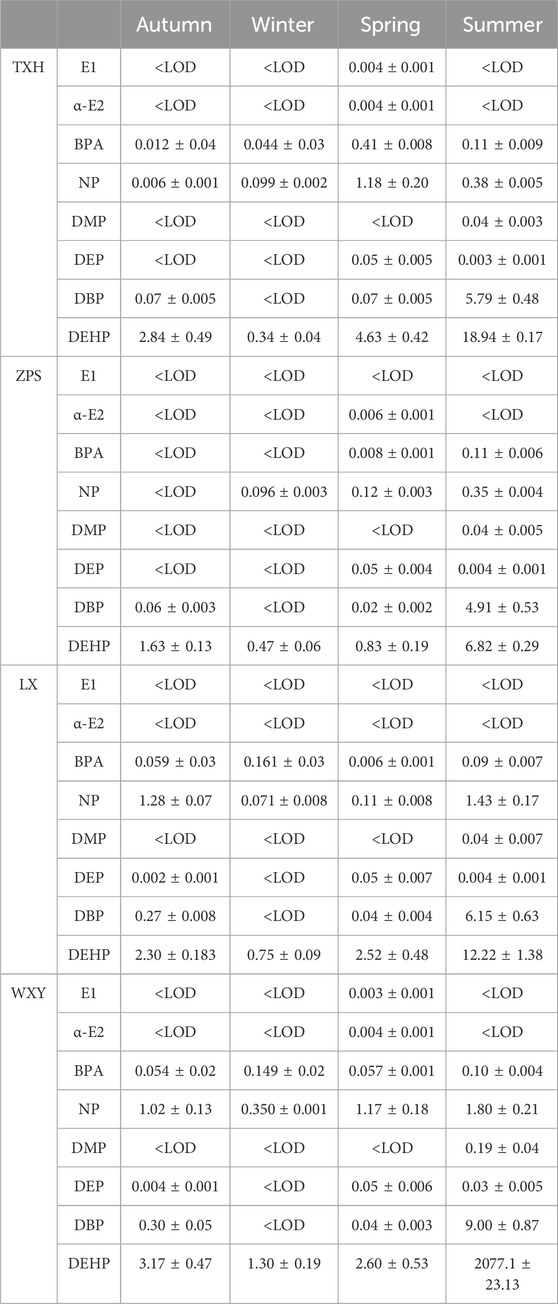
Table 2. Concentration of EDCs in the sludge of WWTPs(mg kg-1).
The peak BPA concentrations in the TXH, ZPS, LX, and WXY sludges over the study period were 0.41, 0.11, 0.16, and 0.15 mg kg−1, the corresponding influent concentrations are 1.38, 0.31, 0.03, and 1.13 μg L−1. The influent concentrations of TXH and WXY are relatively high, but the concentration of BPA in sludge in WXY is lower, which may indicate that the BPA treatment efficiency of WXY WWTP is higher, which is consistent with the conclusion in the effluent. The peak NP concentrations in the TXH, ZPS, LX, and WXY sludges over the study period were 1.18, 0.35, 1.43, and 1.8 mg kg−1, the corresponding influent concentrations are 1.03, 0.31, 0.49, and 4.41 μg L−1, similarly, WXY’s NP treatment capacity may be better in sludge. The peak E1 and E2 concentrations of 0.004 and 0.006 mg kg−1 were detected in the TXH sludge. The total E1 and E2 concentration followed the order WXY > LX > TXH > ZPS.
The peak DMP concentrations in the TXH, ZPS, LX, and WXY sludges over the study period were 0.043, 0.045, 0.047, and 0.19 mg kg−1, the influent concentration in TXH is 0.97 μg L−1, and the remaining WWTPs are ND; there is an enrichment phenomenon of DMP in ZPS, LX, and WXY sludge in the summer. The peak DEP concentrations in the TXH, ZPS, LX, and WXY sludges over the study period were 0.055, 0.054, 0.057, 0.056 mg kg−1, they were all detected and reached their maximum value in the spring. The peak DBP concentrations in the TXH, ZPS, LX, and WXY sludges over the study period were 5.79, 4.91, 6.1, and 9 mg kg−1, the peak DEHP concentrations in the TXH, ZPS, LX, and WXY sludges over the study period were 18.94, 6.82, 12.22, and 2077.1 mg kg−1. Obviously, the concentrations of DBP and DEHP in sludge are relatively high in the summer. Except for ND (<LOD) in WXY influent, other WWTPs have higher concentrations in influent, which may be due to the use of more care products and PVC products in summer. There is also a high concentration enrichment phenomenon in sludge, indicating that DBP and DEHP are easily adsorbed by sludge. The total PAE concentration followed the order WXY > TXH > LX > ZPS.
The peak B(a) P concentrations were 0.11 and 0.1 mg kg−1 in summer and spring, respectively. The B(a) P concentrations in the TXH, ZPS, LX, and WXY sludges were 0.14, 0.11, 0.08, and 0.26 mg kg−1. The total PAH concentration followed the order WXY > TXH > ZPS > LX.
At present, the source apportionment of EDCs is not yet very mature in China. By comparing various types of source apportionment methods, this study chose the PMF source apportionment method and used the latest EPA PMF 5.0 software model as the computational tool. The sewage treatment plant is the end of the municipal sewage pipeline network, and the concentration of pollutants in its inflow can reflect the overall level of environmental hormone pollutants in the service area of the sewage treatment plant and a total of six sources of pollution were identified. According to the algorithm of Vecchi’s research team, the objective function Q is minimized to obtain the pollution source distribution matrix and pollution source contribution matrix. When the number of factors is 4, the Q value is 36.8, when the number of factors is 5, the Q value is 29.32, and when the number of factors is 6, the Q value is 15.47. Therefore, there are six possible sources of pollution for EDCs in Hefei WWTPs.
The main pollutants in factor 1 were DMP and DEP, with DMP accounting for 77.7% (Figure 4A). Dimethyl phthalate is mainly used in cosmetics and personal skin care products, while DEP is commonly used in the production of perfume and as a plasticizer of cellulose resin due to its small relative molecular mass. These materials can therefore be considered sources of pollution in urban and rural wastewater and industrial wastewater. Factor 2 consisted of NP (42.3%) (Figure 4B), which is commonly used in household and laundry detergents. These materials can therefore also be considered sources of pollution in urban and rural wastewater and industrial wastewater. Factors 3 and 5 were dominated by DEHP (81.4%) and DBP (83.1%) (Figures 4C,E), both of which are widely used as plasticizers in production processes in the chemical industry (Chen et al., 2021). These materials can be considered industrial wastewater pollution sources. Factor 4 contained E1, E2, and E3 (Figure 4D), which are endogenous estrogens that mainly originate from animals and human excreta, as well as the use of hormone drugs such as contraceptive pills. Additionally, BPA was present, largely from the production of polycarbonate plastics and epoxy paints (Jahromi et al., 2020). These materials can therefore be considered sources of pollution mixtures in industrial wastewater, and urban and rural sewage. The B(a) P in factor 6 originated from the combustion of biomass and coke (Figure 4F), as well as emissions from motor vehicles and was therefore categorized as a source of coal-fired traffic pollution (Wan et al., 2006).
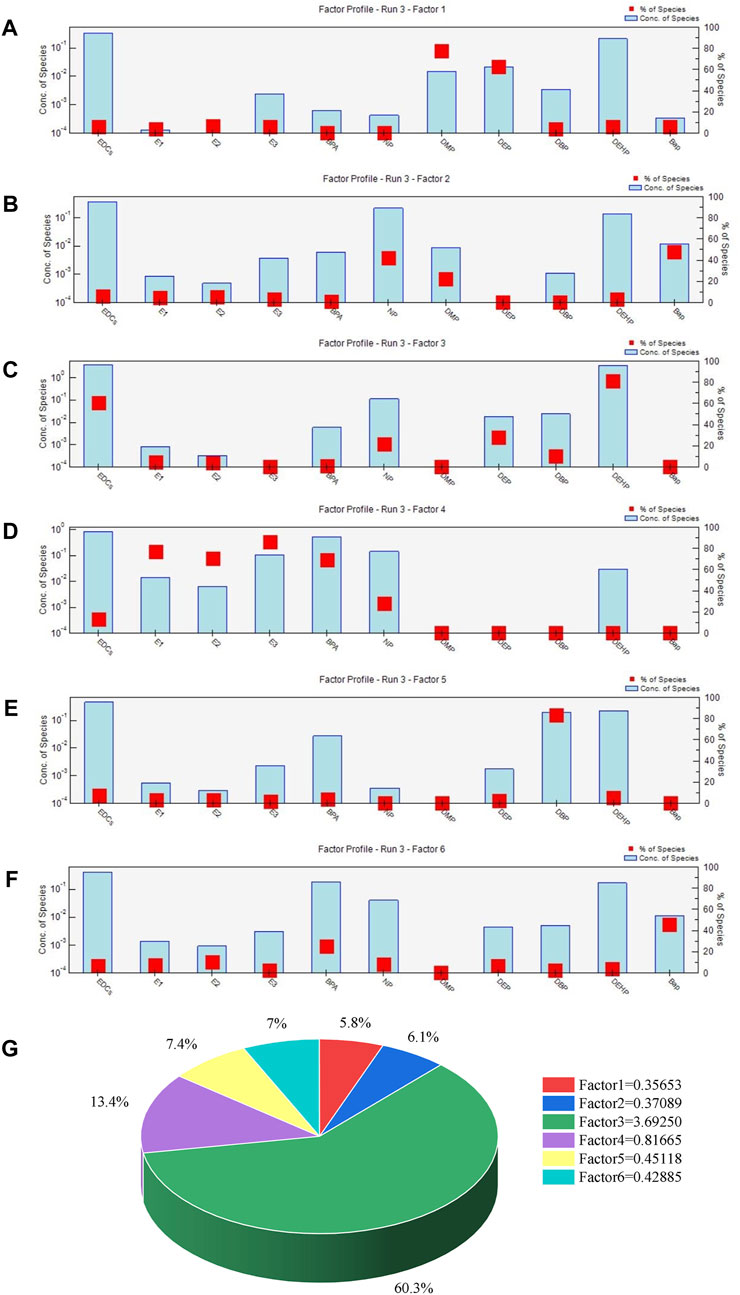
Figure 4. Factor profiles and their contributions to total EDC concentrations based on PMF Model Analysis.
In summary, it was concluded that industrial wastewater discharges were the main source of pollution, with a contribution rate of 60.3% (Figure 4G). Previous studies have shown that industrial wastewater discharges from an iron and steel company are the main source of PAHs in the Chaohu Lake basin. This was followed by urban and rural sewage discharges, with a contribution rate of 13.4%, which was likely related to the development of an animal husbandry and aquaculture industry in the Chaohu Lake region (Tang et al., 2015).
Throughout the sampling cycle, the RQ of estrogenic substances ranged from 0.3 to 2,318.67 (Figure 5), with the highest RQ value 2,318.67 was recorded for E3 in TXH in the autumn, which was due to its low predicted no-effect concentration (PNEC). Therefore, even if the concentration was very low, it still had a very high environmental risk (Sun et al., 2014; Wu et al., 2014; Cheng et al., 2020). Half of the RQ values for the estrogenic substances ranged from 0.1 to 1, while 33% were <0.1 and 17% were >1, indicating that the overall ecological risk level of estrogenic pollutants in the effluent of the WWTP could be classed as medium; however, the estrogenic substances BPA, E2, and E3 presented a high ecological risk in autumn. Overall, the estrogenic pollutants in the ecosystem of the Chaohu Lake basin presented a medium ecological risk. The ecological risks from PAEs were evaluated for three populations: algae, trematodes, and fish (Supplementary Table S5). It was found that the risk was highest for algae, followed by fish (Table 3), while the risk was lowest for trematodes. The RQ of DEHP for trematodes was always >1, which presented a high threat to their populations (Thomaidi et al., 2015). The B(a) P and PCB concentrations were lower than the LOQ or were not detected, and were therefore considered to present a low ecological risk.
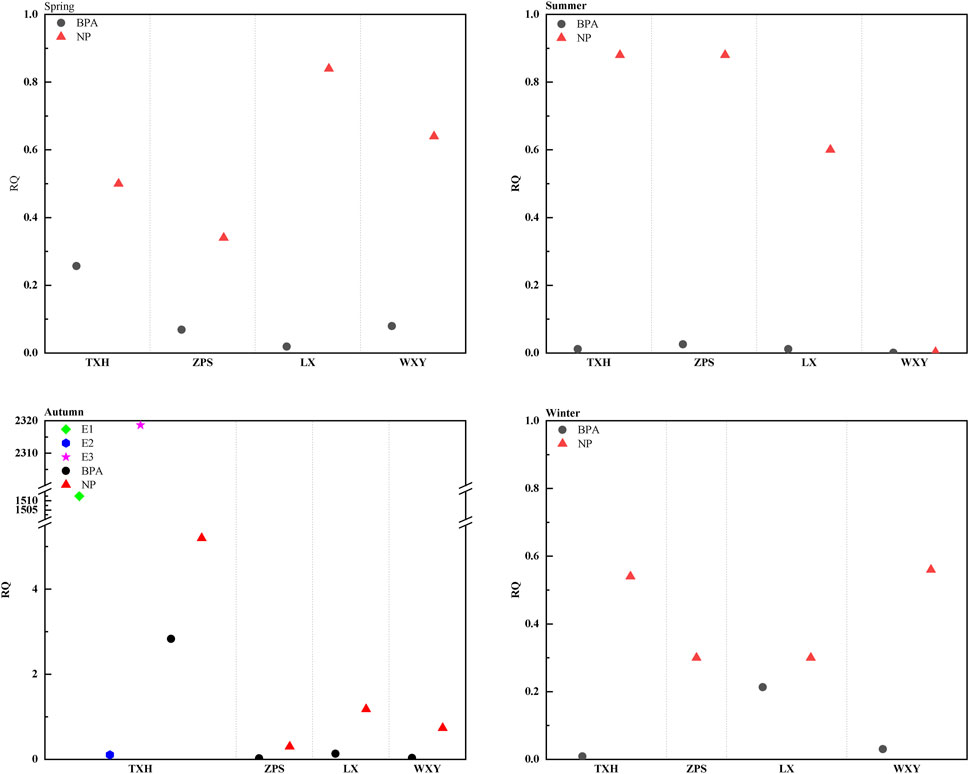
Figure 5. Ecological risk assessment of estrogenic pollutants in effluent.
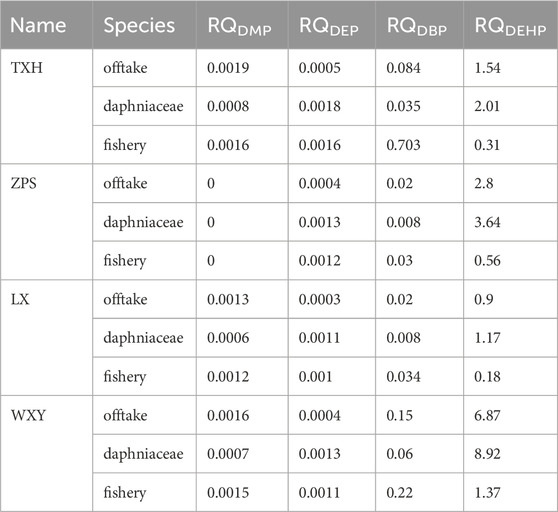
Table 3. Ecological risk evaluation of PAEs in effluent.
The RQ values of most estrogenic substances in sludge were <0.1 and were therefore considered to present a low ecological risk. The only exception was E1, which had a spring RQ between 0.1 and 1, and was therefore considered to present a medium risk (Figure 6). Among the four PAEs, the RQ of DBP for the different test populations was much larger than that of the other three pollutants, with a value >1. The ecological risk presented to aquatic organisms by sludge from ZPS was greatest for algae, followed by trematodes and fishes (Table 4). According to the Control Standards for Agricultural Use of Sludge from Urban WWTPs (GB4284-2018), the no-effect concentration of B(a) P in surface sediments is 0.15 μg g−1. Based on this level, a high ecological risk was presented in the spring sludge samples from WXY. The remaining samples all indicated a medium ecological risk. Overall, B(a)P was considered to present a high risk of harm to the ecosystem in the spring sludge samples, and a medium ecological risk in the summer.
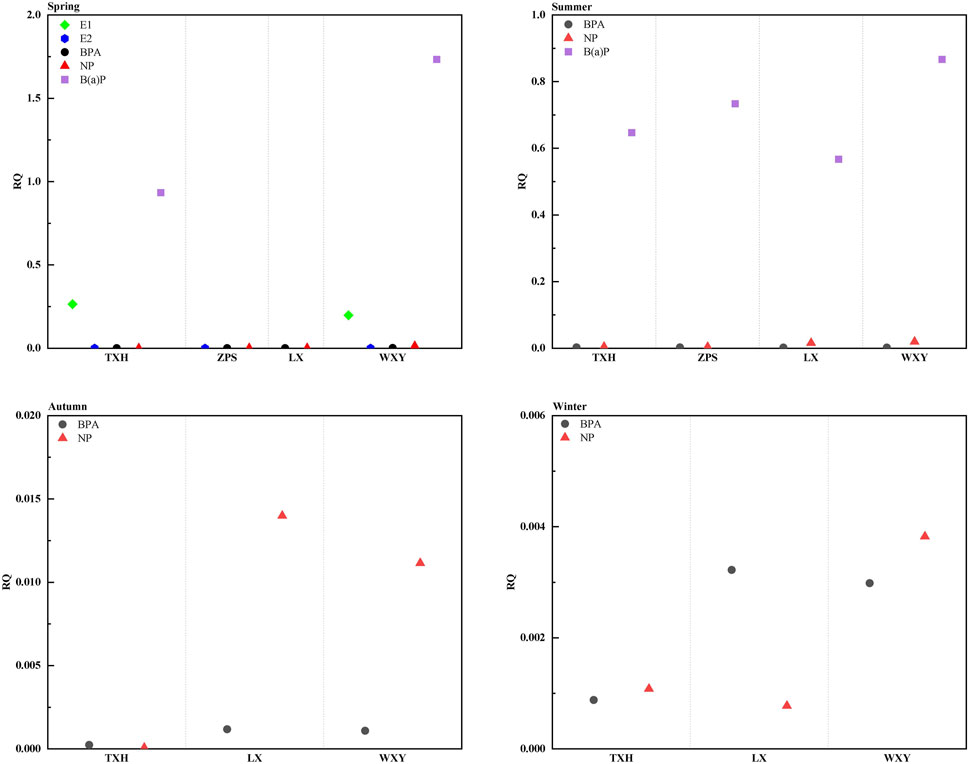
Figure 6. Ecological risk evaluation of estrogenic contaminants in sludge.
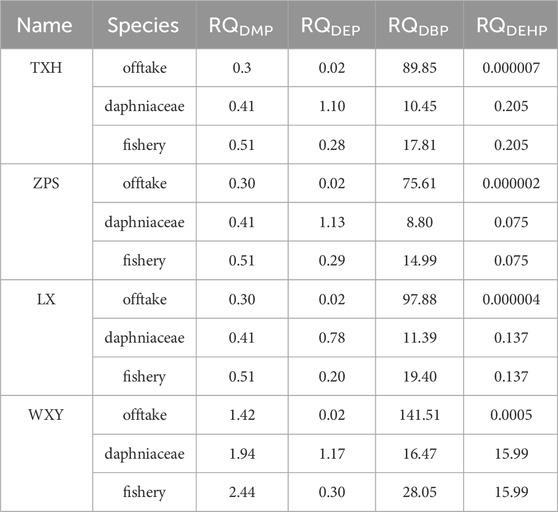
Table 4. Ecological risk evaluation of sludge PAEs.
The results of the human health risk evaluation of the five key EDCs in the WWTP effluent are shown in Table 5. In order to explore the maximum potential impact of EDC in health risk assessment, the degradation of EDC through environmental media and water quality purification after effluent were omitted, this study considers the effluent of WWTPs as a source of tap water. On a seasonal basis, only DEHP in the effluent samples from summer presented a human health hazard, and the cumulative HQ values for each pollutant in the other seasons were <1, while the carcinogenic risk (R) of DEHP was >10−4, indicating that DEHP presented a cancer risk to humans. Previous studies have shown that EDCs exhibit cumulative or synergistic toxic effects (Wang et al., 2005). The pollutants in the effluent water could therefore present a threat to human health and serious attention to pollution control measures should be given by the regulatory authorities (Wee and Aris, 2017; Akhbarizadeh et al., 2021).
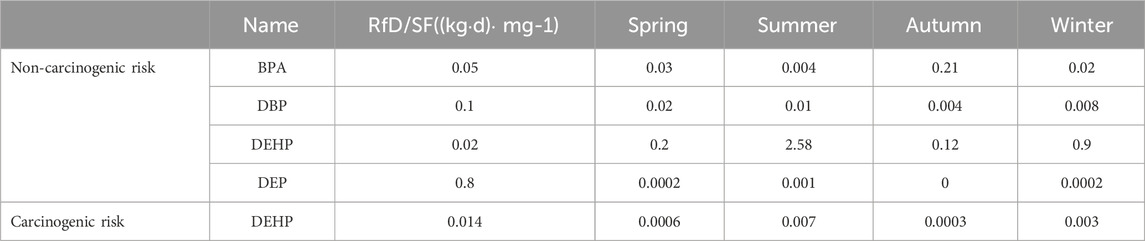
Table 5. Cumulative non-carcinogenic/carcinogenic risk index for EDCs in the drinking water pathway.
The experimental results showed that nine of the 18 EDCs were detected in the effluent and sludge of the WWTPs in the Chaohu Lake basin, with BPA and DEHP in the effluent and DEHP in the sludge detected at high concentrations. This indicates that not all EDCs are completely removed in the treatment plants and hence pose a threat to ecosystems, especially aquatic environments. Therefore, managing the sources of EDCs is crucial to reduce pollution and minimize their impact on the environment. This could be achieved by considering the results of the PMF model analysis of industrial wastewater streams carrying EDCs. The largest source contributions to EDC pollution were determined to be the discharge of domestic sewage, agricultural wastewater, seepage from solid waste filtration, traffic emissions, and the incineration of domestic waste. Once the sources of EDCs are known, control measures can be strengthened. Blocking and controlling the migration of EDCs is a crucial step in wastewater management and treatment. Sewage treatment is an important part of wastewater treatment, and there is a need to accurately monitor the source and migration of pollutants to prevent the accumulation of EDCs in this stage of the process. According to the pollution characteristics of the EDCs it could be possible to optimize the relevant treatment process and promote the resourceful use of wastewater, improving the quality of wastewater treatment. Finally, assuming receptors are directly exposed to wastewater and sludge from WWTPs, and EDCs enter the human body through drinking pathway, a risk assessment revealed that E1, E3, and DEHP were the pollutants that presented the highest risk, and TXH and WXY were the WWTPs with the highest frequency of ecological and health risks due to the presence of EDCs in effluent and sludge. There could be a cancer risk for humans due to DHEP exposure and EDCs will be harmful to the ecosystem of the Chaohu Lake basin. To further clarify how the EDCs entering the environment will impact the water body, aquatic organisms, and human health, it is necessary to construct a comprehensive evaluation model and expand the existing EDC evaluation models to fully consider the pollutant migration and exposure pathways, and use the annual average data of EDCs to consider long-term exposure to improve the risk evaluation method.
The original contributions presented in the study are included in the article/Supplementary Material, further inquiries can be directed to the corresponding author.
YH: Writing–original draft, Writing–review and editing. CQ: Writing–review and editing. ZN: Writing–original draft. NL: Writing–original draft. JT: Writing–review and editing, Writing–original draft.
The author(s) declare that financial support was received for the research, authorship, and/or publication of this article. This study was supported by Innovation training program for college students: Anhui Provincial Environmental Protection Research Project: Research on the Migration Law and Ecological Risk Assessment of Environmental Hormone Substances in Urban Wastewater Treatment Plants in the Chaohu Basin (201,709), Effects of PFCs on Lipid in the Developing Embryos and Fry of Arctic Charr (Salvelinus alpines) S20221, 10364202-AHAU and Studies on the Accumulation, Migration of Perfluorinated compounds in Soybean (Glycine Max L.) S20201, 10364276-AHAU.
We would like to express my gratitude to the following individuals for their encouragement, support, and assistance in this study, who have made significant contributions to the successful completion of the research and manuscript: ZN, Chu Chunping, Luo Jiawei, Liu Wanqian, and Zhang Zhong’en for their contributions to sample collection; and Bian Yuming and Yan Yuming from Hefei No.1 High School for their contributions to the writing and polishing of the article.
The authors declare that the research was conducted in the absence of any commercial or financial relationships that could be construed as a potential conflict of interest.
All claims expressed in this article are solely those of the authors and do not necessarily represent those of their affiliated organizations, or those of the publisher, the editors and the reviewers. Any product that may be evaluated in this article, or claim that may be made by its manufacturer, is not guaranteed or endorsed by the publisher.
The Supplementary Material for this article can be found online at: https://www.frontiersin.org/articles/10.3389/fenvs.2024.1409011/full#supplementary-material
Akhbarizadeh, R., Russo, G., Rossi, S., Golianova, K., Moore, F., Guida, M., et al. (2021). Emerging endocrine disruptors in two edible fish from the Persian gulf: occurrence, congener profile, and human health risk assessment. Mar. Pollut. Bull. 166, 112241. doi:10.1016/j.marpolbul.2021.112241
Andra, S. S., Charisiadis, P., Arora, M., Van Vliet-Ostaptchouk, J. V., and Makris, K. C. (2015). Biomonitoring of human exposures to chlorinated derivatives and structural analogs of bisphenol a. Environ. Int. 85 (DEC.), 352–379. doi:10.1016/j.envint.2015.09.011
Ashfaq, M., Yan, W., Yuwen, , Rehman, M. S. U., Rashid, A., Sun, Q., et al. (2018). Monitoring and mass balance analysis of endocrine disrupting compounds and their transformation products in an anaerobic-anoxic-oxic wastewater treatment system in xiamen, China. Chemosphere Environ. Toxicol. risk Assess. 204, 170–177. doi:10.1016/j.chemosphere.2018.04.028
Careghini, A., Mastorgio, A. F., Saponaro, S., and Sezenna, E. (2015). Bisphenol a, nonylphenols, benzophenones, and benzotriazoles in soils, groundwater, surface water, sediments, and food: a review. Environ. Sci. Pollut. Res. Int. 22 (8), 5711–5741. doi:10.1007/s11356-014-3974-5
Charitos, I. A., Topi, S., Gagliano-Candela, R., De Nitto, E., Polimeno, L., Montagnani, M., et al. (2022). The toxic effects of endocrine disrupting chemicals (EDCs) on gut microbiota: bisphenol A (BPA) A review. Endocr. Metab. Immune Disord. Drug Targets 22 (7), 716–727. doi:10.2174/1871530322666220325114045
Chen, M. H., Yu, B., Zhang, Z. F., and Ma, W. L. (2021). Occurrence of parabens in outdoor environments: implications for human exposure assessment. Environ. Pollut. 282, 117058. doi:10.1016/j.envpol.2021.117058
Cheng, L., Yang, L. A., Xla, D., Ma, X., Ru, S., Qiu, T., et al. (2020). Veterinary antibiotics and estrogen hormones in manures from concentrated animal feedlots and their potential ecological risks. Environ. Res. 198, 110463. doi:10.1016/j.envres.2020.110463
Eli, M., Krbi, B. D., Insa, S., Ivanev, J., and Petrovi, M. (2020). Occurrence and assessment of environmental risks of endocrine disrupting compounds in drinking, surface and wastewaters in Serbia. Environ. Pollut. 114344. doi:10.1016/j.envpol.2020.114344
Gao, C., Liu, L., Ma, W., Zhu, N., Jiang, L., Ren, N., et al. (2016). Bisphenol A in urine of Chinese young adults: concentrations and sources of exposure. Bull. Environ. Contam. Toxicol. 96, 162–167. doi:10.1007/s00128-015-1703-5
Ghosh, A., Tripathy, A., and Ghosh, D. (2022). Impact of endocrine disrupting chemicals (EDCs) on reproductive health of human. Proc. Zoological Soc. 1, 16–30. doi:10.1007/s12595-021-00412-3
Godfray, H., Charles, J., Stephens Andrea, E. A., Jepson Paul, D., Jobling, S., Johnson Andrew, C., et al. (2019). A restatement of the natural science evidence base on the effects of endocrine disrupting chemicals on wildlife. Proc. Biol. Sci. 1897, 20182416. doi:10.1098/rspb.2018.2416
Gong, J., Ran, Y., Chen, D., Yang, Y., and Zeng, E. Y. (2012). Association of endocrine-disrupting chemicals with total organic carbon in riverine water and suspended particulate matter from the pearl river, China. Environ. Toxicol. Chem. 31 (11), 2456–2464. doi:10.1002/etc.1961
Ismanto, A., Hadibarata, T., Kristanti, R. A., Maslukah, L., Safinatunnajah, N., and Kusumastuti, W. (2022). Endocrine disrupting chemicals (edcs) in environmental matrices: occurrence, fate, health impact, physio-chemical and bioremediation technology. Environ. Pollut. 302, 119061. doi:10.1016/j.envpol.2022.119061
Jahromi, F. A., Moore, F., Keshavarzi, B., Mohebbi-Nozar, S. L., Mohammadi, Z., Sorooshian Sajjad Abbasi, A., et al. (2020). Bisphenol A (BPA) and polycyclic aromatic hydrocarbons (PAHs) in the surface sediment and bivalves from Hormozgan Province coastline in the Northern Persian Gulf: a focus on source apportionment. Mar. Pollut. Bull. 152, 110941. doi:10.1016/j.marpolbul.2020.110941
Kalf, D. F., Crommentuijn, T., and Plassche, E. J. V. D. (1997). Environmental quality objectives for 10 polycyclic aromatic hydrocarbons (pahs). Ecotoxicol. Environ. Saf. 36 (1), 89–97. doi:10.1006/eesa.1996.1495
Lahnsteiner, F., Berger, B., Kletzl, M., and Weismann, T. (2005). Effect of bisphenol a on maturation and quality of semen and eggs in the brown trout, salmo trutta f. fario. Aquat. Toxicol. 75 (3), 213–224. doi:10.1016/j.aquatox.2005.08.004
Landers, J. (2019). Hormones, pharmaceuticals are not widespread in u.s. groundwater supplies, study says. Civ. Eng. 89 (5), 28–29.
Lee, L., Song, G. J., Kannan, K., Moon, H. B., Lee, S., and Choi, K. (2015). Emission of bisphenol analogues including bisphenol a and bisphenol f from wastewater treatment plants in korea. CHEMOSPHERE 119, 1000–1006. doi:10.1016/j.chemosphere.2014.09.011
Lee, Y. M., Lee, J. E., Choe, W., Kim, T., Lee, J. Y., Kho, Y., et al. (2019). Distribution of phthalate esters in air, water, sediments, and fish in the asan lake of korea. Environ. Int. 126, 635–643. doi:10.1016/j.envint.2019.02.059
Liu, Y.-H., Zhang, S.-H., Ji, G.-X., Wu, S.-M., Guo, R.-X., Cheng, J., et al. (2017). Occurrence, distribution and risk assessment of suspected endocrine-disrupting chemicals in surface water and suspended particulate matter of Yangtze River (Nanjing section). Ecotoxicol. Environ. Safety90-97 135, 90–97. doi:10.1016/j.ecoenv.2016.09.035
Lopez-Velazquez, K., Guzman-Mar, J. L., Saldarriaga-Norena, H. A., Murillo-Tovar, M. A., Hinojosa-Reyes, L., and Villanueva-Rodriguez, M. (2021). Occurrence and seasonal distribu tion of five selected endocrine-disrupting compounds in wastewater treatment plants of the Metropolitan Area of Monterrey, Mexico: the role of water quality parameters. Environ. Pollut. 269, 116223. doi:10.1016/j.envpol.2020.116223
Mandariya, A., Abhishek, C., Rai, A., Singh, N., Sharma, S., and Tiwari, S. (2016). Composition and source apportionment of pm1 at urban site kanpur in India using pmf coupled with cbpf. Atmos. Res. 178–179, 506–520. doi:10.1016/j.atmosres.2016.04.015
Manousakas, E., Diapouli, H., Papaefthymiou, H., Eleftheriadis, K., Migliori, A., and Savidou, A. (2015) “Source apportionment by pmf on elemental concentrations obtained by pixe analysis of pm10 samples collected at the vicinity of lignite power plants and mines in megalopolis, Greece,” in Nuclear instruments and methods in physics research.
Qiang, Z., Dong, H., Zhu, B., Qu, J., and Nie, Y. (2013). A comparison of various rural wastewater treatment processes for the removal of endocrine-disrupting chemicals (EDCs). Chemosphere 92 (8), 986–992. doi:10.1016/j.chemosphere.2013.03.019
Shahid, M. K., Kashif, A., Fuwad, A., and Choi, Y. (2021). Current advances in treatment technologies for removal of emerging contaminants from water – a critical review. Coord. Chem. Rev. 442, 213993. doi:10.1016/j.ccr.2021.213993
Song, S., Song, M., Zeng, L., Wang, T., Liu, R., Ruan, T., et al. (2014).Occurrence and profiles of bisphenol analogues in municipal sewage sludge in China[J]. Environ. Pollut.,186(Mar.):14–19. doi:10.1016/j.envpol.2013.11.023
Sun, S., Shen, J., Li, B., Geng, J., Ma, L., Qi, H., et al. (2021). The spatiotemporal distribution and potential risk assessment of 19 phthalate acid esters in wastewater treatment plants in China. Environ. Sci. Pollut. Res. 28 (47), 67280–67291. doi:10.1007/s11356-021-15365-5
Sun, Y., Huang, H., Sun, Y., Wang, C., Shi, X., Hu, H., et al. (2014). Occurrence of estrogenic endocrine disrupting chemicals concern in sewage plant effluent. Front. Environ. Sci. Eng. 8, 18–26. doi:10.1007/s11783-013-0573-5
Tang, J., Shi, T., Wu, X., Cao, H., Li, X., Hua, R., et al. (2015). The occurrence and distribution of antibiotics in lake chaohu, China: seasonal variation, potential source and risk assessment. Chemosphere 122 (mar), 154–161. doi:10.1016/j.chemosphere.2014.11.032
Tang, Z., Liu, Z. H., Wang, H., Dang, Z., and Liu, Y. (2021). Occurrence and removal of 17α-ethynylestradiol (ee2) in municipal wastewater treatment plants: current status and challenges. Chemosphere 271, 129551. doi:10.1016/j.chemosphere.2021.129551
Thomaidi, V. S., Stasinakis, A. S., and Borova, V. L. (2015). Occurrence of emerging organic contaminants released from wastewater treatment plants in the aquatic environment and effects on aquatic life: the case of Greece. J.Hazard. Mat. 283, 740–747. doi:10.1016/j.jhazmat.2014.10.023
Tohyama, C., Ohsako, S., and Ishimura, R. (2001). Health risk assessment of endocrine disrupting chemicals. Nippon rinsho. Jpn. J. Clin. Med. 58 (12), 2393–2400.
US EPA National Center for Environmental Assessment (1986). Guidelines for the health risk assessment of chemical mixtures.
Vandenberg, L. (2021). Endocrine disrupting chemicals: strategies to protect present and future generations. Expert Rev. Endocrinol. metabolism 16 (3), 135–146. doi:10.1080/17446651.2021.1917991
Wan, X., Chen, J., Tian, F., Sun, W., Yang, F., and Saiki, K. (2006). Source apportionment of pahs in atmospheric particulates of dalian: factor analysis with nonnegative constraints and emission inventory analysis. Atmos. Environ. 40 (34), 6666–6675. doi:10.1016/j.atmosenv.2006.05.049
Wang, Y., Hu, W., Cao, Z., and Tan, Fu X. Z. (2005). Occurrence of endocrine-disrupting compounds in reclaimed water from Tianjin, China. Anal. Bioanal. Chem. 383 (5), 857–863. doi:10.1007/s00216-005-0082-x
Wee, S. Y., and Aris, A. Z. (2017). Endocrine disrupting compounds in drinking water supply system and human health risk implication. Environ. Int. 106, 207–233. doi:10.1016/j.envint.2017.05.004
Wu, F., Fang, Y., Li, Y., Cui, X., Giesy, J. P., Guo, G., et al. (2014). Predicted no-effect concentration and risk assessment for 17-[beta]-estradiol in waters of China. Rev. Environ. Contam. Toxicol. 228, 31–56. doi:10.1007/978-3-319-01619-1_2
Xu, G., Ma, S., Tang, L., Sun, R., Xiang, J., Xu, B., et al. (2016). Occurrence, fate, and risk assessment of selected endocrine disrupting chemicals in wastewater treatment plants and receiving river of Shanghai, China. Environ. Sci. Pollut. Res. 23, 25442–25450. doi:10.1007/s11356-016-7669-y
Yong, Y., and Wu, L. (2011). Comparison of four extraction methods for the analysis of pharmaceuticals in wastewater. J. Chromatogr. A (18), 2483–2489. doi:10.1016/j.chroma.2011.02.050
Yu, Q., Yang, X., Zhao, F., Hu, X., Guan, L., Ren, H., et al. (2022). Spatiotemporal variation and removal of selected endocrine-disrupting chemicals in wastewater treatment plants across China: treatment process comparison. Sci. total Environ. 835, 155374. doi:10.1016/j.scitotenv.2022.155374
Zhang, F., Yu, Q., and Yang, L. (2019). Watershed scale patterns in steroid hormones composition and content characters at a typical eutrophic lake in southeastern China. Environ. Sci. Pollut. Res. Int. 26 (6), 6107–6115. doi:10.1007/s11356-018-04120-y
Zhang, X., Zhang, S., and Hu, L. (2010). Upgrading of Tangxi River sewage treatment plant in Binhu new District, Hefei city. China Water Supply Drainage(02), 60–63.
Keywords: WWTPs, EDCs, effluent, sludge, risk assessment, Chaohu Lake Basin
Citation: Han Y, Qi C, Niu Z, Li N and Tang J (2024) Occurrence and risk assessment of endocrine-disrupting chemicals in wastewater treatment plants in the Chaohu Lake Basin. Front. Environ. Sci. 12:1409011. doi: 10.3389/fenvs.2024.1409011
Received: 29 March 2024; Accepted: 28 June 2024;
Published: 17 July 2024.
Edited by:
Yalçın TEPE, Giresun University, TürkiyeReviewed by:
Elena Sezenna, Polytechnic University of Milan, ItalyCopyright © 2024 Han, Qi, Niu, Li and Tang. This is an open-access article distributed under the terms of the Creative Commons Attribution License (CC BY). The use, distribution or reproduction in other forums is permitted, provided the original author(s) and the copyright owner(s) are credited and that the original publication in this journal is cited, in accordance with accepted academic practice. No use, distribution or reproduction is permitted which does not comply with these terms.
*Correspondence: Jie Tang, dGFuZ2ppZUBhaGF1LmVkdS5jbg==
Disclaimer: All claims expressed in this article are solely those of the authors and do not necessarily represent those of their affiliated organizations, or those of the publisher, the editors and the reviewers. Any product that may be evaluated in this article or claim that may be made by its manufacturer is not guaranteed or endorsed by the publisher.
Research integrity at Frontiers
Learn more about the work of our research integrity team to safeguard the quality of each article we publish.